Abstract.
Spectral computed tomography (SCT) has advantages in multienergy material decomposition for material discrimination and quantitative image reconstruction. However, due to the nonideal physical effects of photon counting detectors, including charge sharing, pulse pileup and -escape, it is difficult to obtain precise system models in practical SCT systems. Serious spectral distortion is unavoidable, which introduces error into the decomposition model and affects material decomposition accuracy. Recently, neural networks demonstrated great potential in image segmentation, object detection, natural language processing, etc. By adjusting the interconnection relationship among internal nodes, it provides a way to mine information from data. Considering the difficulty in modeling SCT system spectra and the superiority of data-driven characteristics of neural networks, we proposed a spectral information extraction method for virtual monochromatic attenuation maps using a simple fully connected neural network without knowing spectral information. In our method, virtual monochromatic linear attenuation coefficients can be obtained directly through our neural network, which could contribute to further material recognition. Our method also provides outstanding performance on denoising and artifacts suppression. It can be furnished for SCT systems with different settings of energy bins or thresholds. Various substances available can be used for training. The trained neural network has a good generalization ability according to our results. The testing mean square errors are about .
Keywords: spectral information extraction, neural network, spectral computed tomography
1. Introduction
Machine learning is a systematic study of systems and algorithms based on processing massive data to enhance performance or enrich knowledge. The neural network is an important algorithm in machine learning. It connects multiple neurons into a network structure and mimics information analysis of biological nerve cells.1,2 Neural networks optimize model parameters with respect to training data to minimize a task-based objective function.3 In recent years, the neural network has become a hot topic in the field of image recognition, artificial intelligence, etc. It shows excellent performances on various tasks, such as hand-written digit classification, face detection, and image classification.4
Nowadays, the neural network algorithm is gradually applied to the field of x-ray computed tomography (CT). For example, a convolutional neural network (CNN, or ConvNet) was designed to reduce limited angle artifacts.5 Residual CNNs were implemented to recover full-view projections from sparse-view CT.6 A residual U-net was applied to reduce image noise and metal artifact for better image quality.7
A spectral CT imaging system, based on a photon counting detector (PCD), provides energy spectrum information. However, due to the nonuniformity of detector pixels and the nonideal physical effects of PCD, including charge sharing, pulse pileup, and -escape,8 the detected spectrum might be distorted by the nonideal detector response and it is complicated to construct a detector response function. Hence, it is difficult to obtain a comprehensive system spectrum model, which consists of detector response and incident source spectrum. To evaluate system performance and correct the distortion, researchers have proposed different methods to model and calibrate the detector response. Schlomka et al.9 proposed an empirical detector response model consisting of two Gaussian peaks and a constant background. Based on the proposed model, they calibrated a CdTe detector using 25- to 60-keV synchrotron source. However, synchrotron source might not be commonly available to ordinary labs. Ding et al.10 used x-ray fluorescence as a calibration source to determine the response of Si detector. The model also consists of two Gaussian peaks and a baseline function. Si detector yields a simpler detector response as there is no -edge effect. Li et al.,11 on the other hand, proposed an empirical model for CZT detector using x-ray fluorescence as source. Wu et al.12 proposed a hybrid calibration method utilizing Monte Carlo simulation and experimental results. Geant413 was employed to simulate the spreading and broadcasting of electron clouds.
Thus, it is a challenge to build an accurate system model for material decomposition calibration. Some researchers used the tool of the neural network to decomposed materials. A neural network could be used for material decomposition by training images of four different thicknesses of three base materials with a total of combinations.14 Zimmerman and Schmidt15 carried out experiments to compare the performance of conventional and neural network-based material decomposition method. The results demonstrated the experimental feasibility of the neural network method. Liao et al.16 explored the feasibility of neural network in obtaining material decomposition image using single-energy CT and verified it experimentally with clinical patient data. Zhang et al.17 proposed the Butterfly network to implement material decomposition in an image domain. They verified that the Butterfly network yielded excellent performance in image quality improvement and noise suppression.
We proposed an empirical material decomposition method (EMDM) by polynomial fitting before.18 Without knowledge of spectral information, virtual monochromatic linear attenuation coefficients of substances of interest are obtained directly through EMDM. Considering the data-driven characteristics of neural network and the theory that a three-layer neural network can perform any continuous mapping,3 we proposed a method for spectral information extraction for spectral CT using a simple fully connected neural network (FCNN), which does not require the knowledge of spectral information, either. FCNN could output virtual monochromatic attenuation (VMA) maps at arbitrary energies. It is one advantage of our method as virtual monochromatic spectral images are often used in medical imaging. Moreover, using VMA maps we could easily compute electron density and atomic number images as well as material fraction coefficients for material decomposition.
In this task, adequate physical experiments were performed to verify the effectiveness and robustness of the proposed method. The results show that the neural network trained by polychromatic reconstructions of various materials could provide accurate estimation of virtual monochromatic linear attenuation coefficients of other materials with good generalization ability. In our method, the selection of training materials and energy bins is not limited, i.e., all kinds of matters including -edge materials can be used as training materials. The neural network can simultaneously complete denoising and artifacts suppression. Moreover, our network is simple and easy to train.
2. Methods
2.1. Basic Neural Network Algorithm
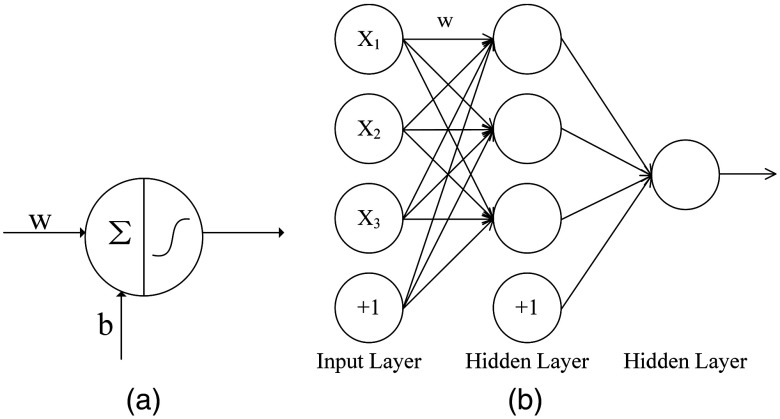
An FCNN is made up of large amounts of elementary neurons, which is the basic processing unit in a neural network [shown in Fig. 1(a)]. Each unit takes weighted inputs from all preceding units and forms a sum with a bias. The processing unit then passes the linear weighted sum through a nonlinear activation function. The sigmoid function, the hyperbolic tangent (tanh) function, and the rectified linear unit (ReLU)19 are commonly used. A simple basic feed-forward layered structure is shown in Fig. 1(b). Each processing unit in a layer is fully connected to all units in the succeeding layer.3 It was proved that an FCNN with one hidden layer can be constructed to approximate any polynomial function.20
Fig. 1.
(a) An elementary neuron, the basic processing unit, takes weighted inputs () from all preceding units and forms a sum with a bias () and (b) a simplified diagram of an FCNN.
For the output layer, a cost function is generally defined according to tasks. To adjust the weights, the neural network is normally trained by the back propagation algorithm.1 Additional techniques such as batch normalization21 can be applied to improve the network training.
2.2. Empirical Material Decomposition Method by Polynomial Fitting
The main idea of EMDM proposed before is to approximate the polynomial combinations of polychromatic CT reconstructions to a desired virtual monochromatic linear attenuation coefficient.18 We successfully conducted experiments on dual-energy imaging to validate the method. Two sets of polynomial weights were obtained by fitting linear attenuation coefficients at two virtual monochromatic energies. The fitting function could be briefly written as
| (1) |
where and are the vectors formed by polynomial weights. and are the polychromatic CT reconstructions in low- and high-energy bin, respectively. Actually, the polynomial combination is the reconstruction of , where and are the polychromatic CT raw data in low- and high-energy bin, respectively. The polynomial order is compositely provided by and . and represent the linear attenuation coefficients at virtual monochromatic energies and , respectively.
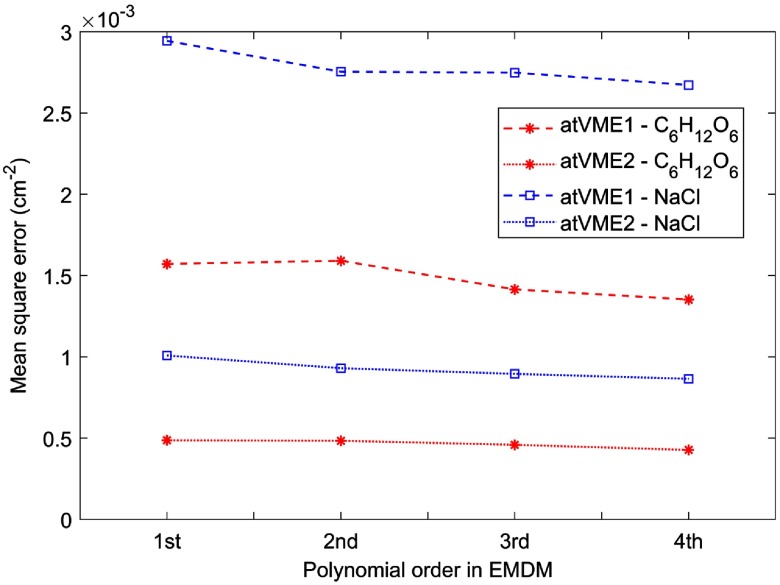
In the study, we found that below the fourth order, the higher the polynomial order was, the better the fitting results were. The relationship between fitting results and polynomial orders was compared by mean squared errors (MSEs) in Fig. 2:
| (2) |
where is the polynomial fitting results and is the number of pixels of a certain material.
Fig. 2.
The polynomial fitting results become better as the order of polynomial combination increases, which are illustrated by their MSEs. Two solutions, 25% and 25% NaCl, were two experimental base materials for calibration. In legend, atVME1 and atVME2 are short for “at virtual monochromatic energies and ,” respectively.
2.3. Virtual Monochromatic Attenuation Map for Spectral Computed Tomography Using Fully Connected Neural Network
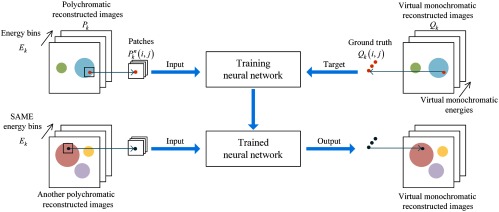
For material discrimination or medical applications, VMA maps at different energies are often of interest for optimal contrast of materials. Therefore, we aim to obtain VMA maps of scanned objects from polychromatic CT reconstructions in our task. That means, polychromatic CT reconstructions are inputs of our network and VMA maps are to be obtained. Data from known materials are used for training. A whole detailed flowchart of our method is shown in Fig. 3.
Fig. 3.
A flowchart of using neural network for spectral information extraction and multienergy CT reconstruction.
In a PCD-based spectral CT system, a set of polychromatic raw data is collected by setting a series of energy bins for the detector, where are indices of the energy bin and is the total number of energy bins. We denote the line integral in x-ray imaging by operator . The polychromatic CT reconstructions for each energy bin are , which is a vector of image size and its element is denoted by with representing the pixel position. We use to denote the virtual monochromatic energy of interest and the corresponding VMA map. The ground truth can be looked up from National Institute of Standards and Technology (NIST).22
Ideally, the relationship between and is pixel-wise independent. In this case, targeted is only a function of . Considering the charge sharing effect of PCD and the spatial correlation resulted from CT reconstructions, could be influenced by its neighboring pixels. Hence, we use an image patch centered at with a neighborhood of pixels as the network input instead of for a single pixel. The problem then becomes estimation of a scalar output from a vector input. A training sample should be a pair composed of an input of a -dimensional vector and a target of ground-truth value. In reality, multiple VMA maps could be of one’s interest. Therefore, at multiple s will be the interested outputs. Consequently, we can set a vector to be the output of the network.
Because of intensive parameters and computations in FCNN, it is important to limit the dimension of the network. Using patches instead of whole images as input is an efficient way to limit the scale of our network. This also helps the convergence and stableness of the training.
Pei et al.20 made a point that a 70-neuron hidden-layer neural network architecture could demonstrate the idea of conducting two-variable polynomial fitting up to third power. Considering the EMDM performance and the neural network complexity comprehensively, we constructed a five-layer FCNN with 100-70-70-10-2 neurons in each hidden layer, respectively, in this work. The last hidden layer gives outputs (i.e., linear attenuation coefficients at two interested virtual monochromatic energies in our experimental studies). If multiple VMA maps are of request, the last hidden layer would have multiple neurons accordingly. We use tanh function
| (3) |
as the activation function in all hidden layers. MSE is used as the loss function for the output layer:
| (4) |
where is the output of the network, and is the number of patches in as well as the number of pixels within regions of interest (ROIs). The setting of ROIs is to enforce data balance, e.g., remove the influence from lots of unimportant background pixels.
For the whole implementation of spectral information extraction and multienergy CT reconstruction, training materials or phantoms are scanned using multiple energy bins first. The raw data are reconstructed using a normal spatial reconstruction method. Patches are extracted from resulted polychromatic CT reconstructions and fed to the network for training. The ground truth of VMA coefficients of training materials is used as target in the training phase. The deployment of trained network for actual application is very straightforward. For a practical spectral CT, polychromatic reconstructions are fed into the network patch-by-patch to obtain the VMA coefficients pixel-by-pixel corresponding to the patch center. The virtual monochromatic material attenuation map is aggregated after all patches are processed.
3. Experiments and Results
3.1. Simulation Study
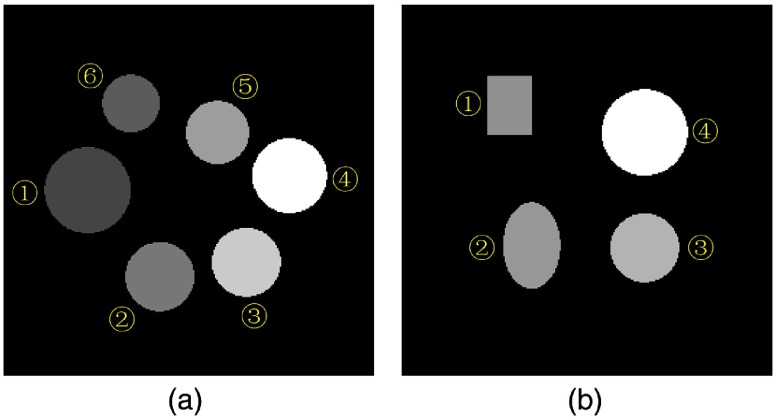
To validate our method, both numerical simulation and practical experiments were performed on dual-energy imaging. First, we conducted simulation experiments. Water () and four aqueous solutions, including sodium chloride (NaCl), glucose (), copper sulfate (), and sodium carbonate (), were simulated. The training and testing concentrations are shown in Table 1. One of the training phantoms and the test phantom are shown in Fig. 4. We generated a 120 kVp incident spectrum with 1e06 photons. Two energy bins of PCD were set to [30, 50] and [50, 70] keV, respectively. In the projection process, the source-to-isocenter and source-to-detector distances were set to 45 and 90 cm, respectively. In addition, the real PCD response23 was used in the simulation. A Gaussian noise with a variance of was added in the simulated projection raw data, so that the polychromatic reconstructions would have almost same noise as practical ones. A filtered back projection algorithm with Ram–Lak filter24 was used for polychromatic reconstructions. We tested the performance of our network on the estimation of VMA maps at three virtual monochromatic energies (40, 48, and 60 keV) for demonstration.
Table 1.
Four solutions used for simulation. The concentrations are all mass concentrations.
| Solution | Concentration for training (%) | Concentration for testing (%) |
|---|---|---|
| NaCl | 5, 10, 15, 20, 25 | 12 |
| 5, 10, 15, 20, 25 | 17 | |
| 2, 4, 6, 8, 10 | 3 | |
| 2, 4, 6, 8, 10 | 7 |
Fig. 4.
Phantoms used for simulation, i.e., VMA maps at 40 keV. The grid of the images is . (a) One of the training phantoms: ① , ② 10% NaCl, ③ 20% NaCl, ④ 25% NaCl, ⑤ 15% NaCl, and ⑥ 5% NaCl. The display window is . Training phantoms are all made up by circles. (b) The testing phantom: ① 17% , ② 7% , ③ 3% , and ④ 12% NaCl. The display window is .
Patches with size of were used in this experiment. That is to say, a training sample would be a 50-D vector (i.e., ) and corresponding target is a two-dimensional vector. In total, about 36,000 samples were constructed as the training dataset. About 80% of samples were used for training and the other 20% for validation. To balance solution-data and air-data in training, only a few patches of air were randomly taken into training process considering their high repeatability, e.g., the patches of air equaled to the mean patches of all solutions. The optimizer was simple stochastic gradient descent and learning rate in this training was 0.03.
All of the training process was running under Mathworks® MATLAB 2017b on a PC with an Intel I7-3770 3.50 GHz CPU and a NVIDIA GeForce GTX TITAN GPU if needed. Both MATLAB Neural Network Toolbox and MatConvNet MATLAB Toolbox25 could be used for training. It only costed less than one second for an epoch when using MATLAB Neural Network Toolbox with GPU acceleration.
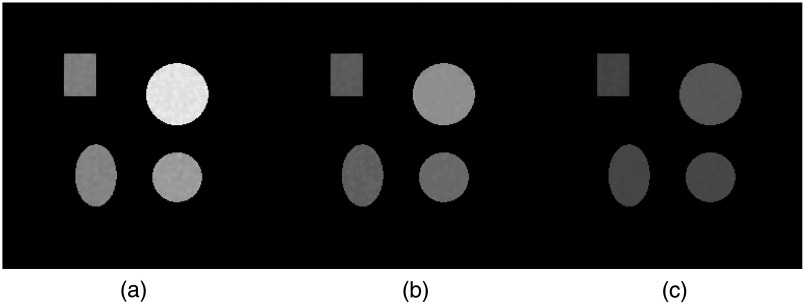
In this task, after 4957 epochs, the resulting MSE of training was , which was stopped by 100 validation checks. (100 validation check means validation performance has increased times since the last time it decreased. This is from the definition of MATLAB.) The training of this network converges well. The resulted VMA coefficients of testing phantom at three monochromatic energies (shown in Fig. 5) are accurate, which are evaluated by mean relative error (MRE, %)
| (5) |
and MSE of the local regions for all solutions (listed in Table 2). It shows good generalization ability of the trained FCNN.
Fig. 5.
The VMA maps at (a) 40, (b) 48, and (c) 60 keV of testing phantom predicted by FCNN. The display window is .
Table 2.
MRE and MSE results of testing phantom by FCNN in simulation.
| Solution | VMA map at 40 keV | VMA map at 48 keV | VMA map at 60 keV | |||
|---|---|---|---|---|---|---|
| MRE (%) | MSE () | MRE (%) | MSE () | MRE (%) | MSE () | |
| 17% | 0.09 | 0.30 | 0.73 | |||
| 7% | 0.16 | 0.05 | 0.02 | |||
| 12% NaCl | 0.27 | 0.01 | 0.48 | |||
| 3% | 0.33 | 0.07 | 0.34 | |||
3.2. Practical Experiments
3.2.1. Experiments setup
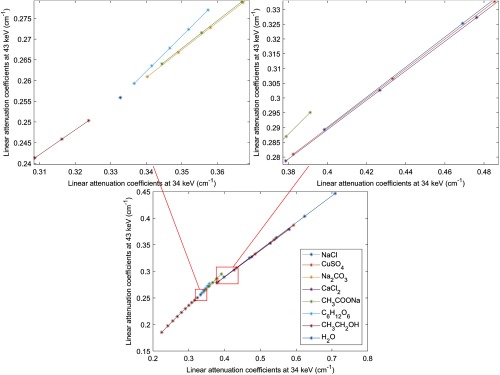
We also verified our method and FCNN on practical experiments, using both dual-energy imaging and -edge imaging. The experiments were conducted on a laboratory spectral CT system with an XC-Flite X1 PCD with -thick CdTe crystal. The PCD consists of pixels with a pixel size of . The x-ray generator was set to 80 kVp and 1 mA. According to the equivalent-incident-photons strategy of setting energy bins, three empirical energy bins of PCD ([25.3, 32.5], [32.5, 46.9], and [) keV) were set for this study. For imaging scan, the source-to-isocenter distance was set to 48.5 cm and the source-to-detector distance was 74.7 cm. We built phantoms of water () and seven different aqueous solutions for training our neural network, including sodium chloride (NaCl), ethyl alcohol (), glucose (), copper sulfate (), calcium chloride (), sodium acetate (), and sodium carbonate () with several unsaturated concentrations each (shown in Fig. 6). For -edge imaging, sodium iodide (NaI) was additionally used for training as well. The trained network was tested on scanning some other unsaturated concentrations of these solutions. The concentrations used for training and testing are shown in Table 3.
Fig. 6.
The attenuation distribution map of all solutions used in training in dual-energy imaging. The linear attenuation coefficient at 34 keV (on -axis) and at 43 keV (on -axis) of a certain solution describe a “*” in the distribution map.
Table 3.
The solutions used in practical experiments. All solutions except NaI were used in dual-energy imaging. All solutions were used in -edge imaging. All concentrations are mass concentrations except that concentration of is volume concentration. (Due to space limitations, only results of testing concentrations listed in the table would be shown below.)
| Solution | Concentration for training (%) | Concentration for testing (%) |
|---|---|---|
| NaCl | 5, 10, 15, 20, 25 | 7, 12, 19 |
| 5, 10, 15, 20, 25 | 17, 21 | |
| 5, 10, 15, 20, 25 | 17 | |
| 2, 4, 6, 8, 10 | 3, 7, 9 | |
| 2, 4, 6, 8, 10 | 7 | |
| 2, 4, 6, 8, 10 | 7 | |
| 10, 20, 30, 40, 50, 60, 70, 80, 90, 100 | 22, 47 | |
| NaI | 2, 4, 6, 8, 10 | 3 |
3.2.2. Dual-energy imaging
For dual-energy CT imaging, we used polychromatic raw data of two energy bins ([25.3, 32.5] and [32.5, 46.9] keV) and set two virtual monochromatic energies of interest for demonstration, and . Training phantoms were made up of all solutions in Table 3 except NaI. Each solution was contained in a 14-mm diameter test tube and each phantom consisted of several test tubes. FCNN training was conducted in the same way as in the simulation. The resulting MSE over the whole training dataset was .
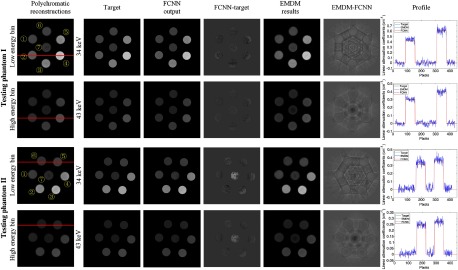
For generalization ability, we took two of testing phantoms for examples to illustrate (shown in Fig. 7). Testing phantom I was composed of ① 17% , ② 7% NaCl, ③ 7% , ④ 19% NaCl, ⑤ 7% , ⑥ 7% , and ⑦ . Testing Phantom II was composed of ① 17% , ② 7% , ③ 9% , ④ 12% NaCl, ⑤ 21% , ⑥ 22% , and ⑦ 47% . Figure 7 shows that compared with EMDM, VMA maps predicted by FCNN have accurate results of linear attenuation coefficients. It shows FCNN outputs have great performance on image denoising and artifacts suppression, including beam-hardening and ring artifacts, as well. Among all testing solutions, solution ⑦ 47% at the center of testing phantom II has the largest deviation. It is because of the severe ring artifacts being in the center of FOV and 47% not being trained by FCNN. However, solution ⑦ at the center of testing phantom I has small deviation. It is owing to that , especially in the center of FOV with severe ring artifacts, has been trained by FCNN.
Fig. 7.
The FCNN outputs of testing phantom I and testing phantom II, compared with results of EMDM. Testing phantom I consists of ① 17% , ② 7% NaCl, ③ 7% , ④ 19% NaCl, ⑤ 7% , ⑥ 7% and ⑦ . Testing phantom II consists of ① 17% , ② 7% , ③ 9% , ④ 12% NaCl, ⑤ 21% , ⑥ 22% , and ⑦ 47% . The dual-energy CT images (, the same below) are reconstructed in low energy bin [25.3 32.5] keV and high energy bin [32.5 46.9] keV. Due to the nonuniformity of PCD, the CT images were severely influenced by ring artifacts. Target images are ground truth of linear attenuation coefficients obtained from NIST. The FCNN outputs VMA maps at and . The difference between FCNN VMA maps and target images can be seen clearly. Additionally, we compared the VMA maps with ones from EMDM by polynomial fitting. The difference between two methods can be observed as well. The profiles of red line show that FCNN could reduce noises evidently. In both EMDM and FCNN methods, pixels of tube walls and out of FOV are not taken into consideration. The display window of differences between FCNN outputs and target images is and of differences between FCNN outputs and EMDM fitting results is . Others all are [0, 0.70]. The units of display windows are all .
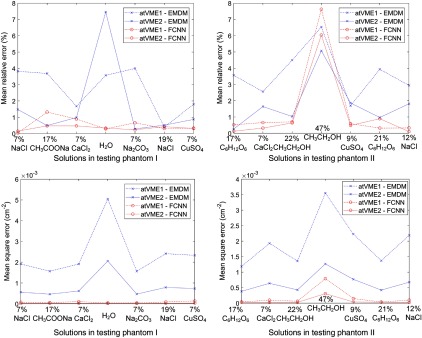
We also compared the results from FCNN with results from EMDM through evaluating performance by MRE and MSE of each regional solution. Figure 8 shows that FCNN performs better than EMDM.
Fig. 8.
Comparison of MREs and MSEs between VMA maps obtained from FCNN and EMDM. Among all regional testing solutions, both MRE and MSE of FCNN are better than those of EMDM, except 47% in testing phantom II. In legend, “atVME1” and “atVME2” are short for “at virtual monochromatic energies and ,” respectively.
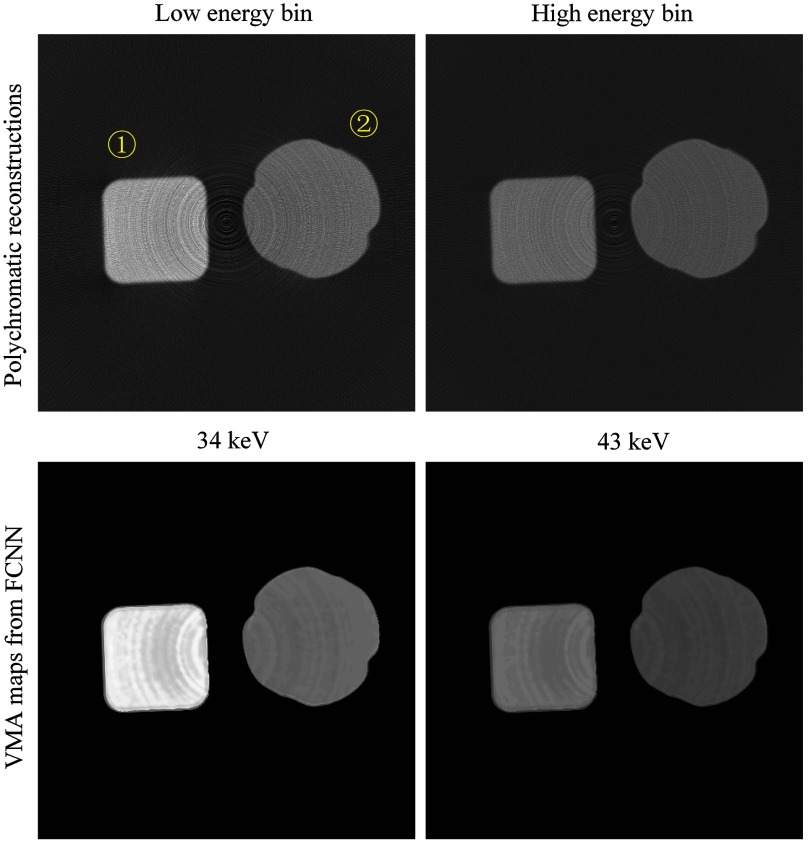
Additionally, a complicated phantom with richer edges and details was used to test the spatial resolution of our method. From Fig. 9, we could tell that spatial information is well preserved. However, the ring artifacts remain obviously, but much better than original reconstructions. The MRE and MSE of each regional solution are shown in Table 4.
Fig. 9.
Validation on a phantom of complicated shapes. The phantom was composed of solutions of ① 14% NaCl and ② 17% . The display windows for polychromatic reconstructions and VMA maps are and , respectively.
Table 4.
MRE and MSE results of testing phantom by FCNN in dual-energy imaging in practical experiments.
| Solution | VMA map at 34 keV | VMA map at 43 keV | ||
|---|---|---|---|---|
| MRE (%) | MSE () | MRE (%) | MSE () | |
| 14% NaCl | 1.45 | 0.87 | ||
| 17% | 1.26 | 0.93 | ||
3.2.3. -edge imaging
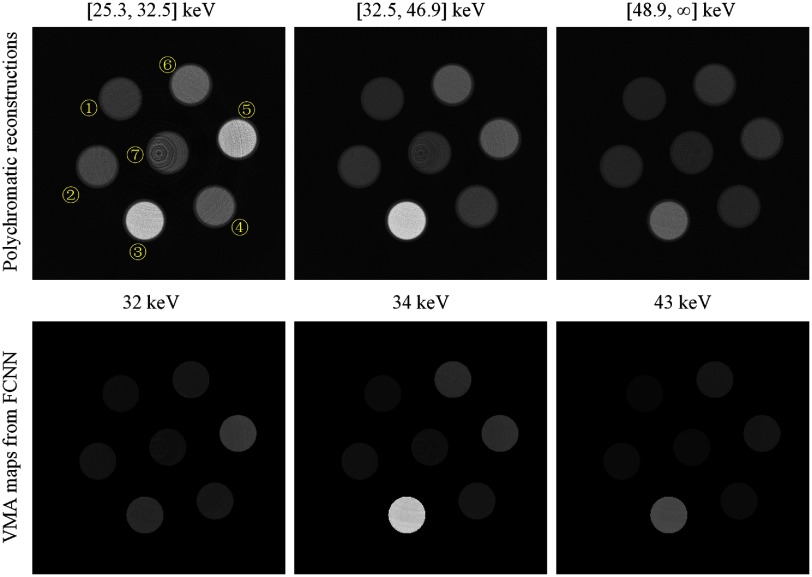
For -edge CT imaging, we used polychromatic raw data of three energy bins ([25.3, 32.5], [32.5, 46.9] and [) keV) and set three virtual monochromatic energies of interest for demonstration, , , and . Training phantoms were made up of all solutions in Table 3. The neurons in the output layer of the FCNN were extended to 3. The resulting MSE over the whole training dataset was . The testing phantom for -edge imaging consists of ① 47% , ② 21% , ③ 3% NaI, ④ 3% , ⑤ 19% NaCl, ⑥ 1% KI, and ⑦ . The reconstructed VMA map of this phantom through FCNN could state the generalization ability of the trained FCNN as shown in Fig. 10 and Table 5. According to the VMA maps at , , the FCNN has good -edge discrimination ability. However, the predicted results of solution ⑥ 1% KI are slightly bigger in bias than others because K is a never-seen element to the FCNN. All other elements in solutions (though of different concentrations) have been seen by this FCNN.
Fig. 10.
A testing phantom used in -edge imaging. The phantom consists of ① 47% , ② 21% , ③ 3% NaI, ④ 3% , ⑤ 19% NaCl, ⑥ 1% KI, and ⑦ . The display windows for polychromatic reconstructions and VMA maps are and , respectively.
Table 5.
MRE and MSE results of testing phantom by FCNN in -edge imaging in practical experiments.
| Solutions | VMA map at 32 keV | VMA map at 34 keV | VMA map at 43 keV | ||||
|---|---|---|---|---|---|---|---|
| MRE (%) | MSE () | MRE (%) | MSE () | MRE (%) | MSE () | ||
| 1 | 47% | 1.12 | 1.09 | 1.59 | |||
| 2 | 21% | 0.30 | 0.13 | 0.18 | |||
| 3 | 3% NaI | 1.74 | 1.37 | 1.00 | |||
| 4 | 3% | 0.81 | 0.26 | 0.01 | |||
| 5 | 19% NaCl | 1.38 | 0.83 | 0.33 | |||
| 6 | 1% KI | 2.85 | 1.33 | 1.22 | |||
| 7 | 1.21 | 0.58 | 0.43 | ||||
4. Discussion and Conclusion
In this work, we proposed a method to reconstruct VMA maps for spectral CT using neural network. The trained network demonstrated its effectiveness and robustness in our study. It could provide accurate virtual monochromatic linear attenuation coefficients directly. The reconstructed images also suggested good potential in reducing image noise and suppressing artifacts.
Large-noisy polychromatic CT reconstructions are suggested to go through denoising preprocess before training by FCNN. Through mean filtering, the reconstructions become smoother. In the training process, we chose image patch with a size of as the neural network input considering the charge sharing effect of PCD and local spatial correlation of the image. Smaller image patch would cause a big fluctuation in the neural network and make the network unstable. A larger image patch would increase the complexity of the network and training costs. In addition, weights and biases of FCNN trained by a small number of samples could help parameter initialization with FCNN to be trained by all samples. Also, deeper and larger FCNNs were constructed tentatively, only limited improvements of MSE were presented but with apparent overfitting and training costs dramatically increased.
The training and implementation of this proposed method are easy and computationally efficient. Moreover, it can be flexibly extended to other cases of different numbers of multiple energy bins and/or different choices of virtual monochromatic energies, though the consistency in system setting between training and testing shall be preserved. As all the information is from the dataset of training phantoms, a reasonable variability and coverage in the choices of training materials would be suggested depending on the tasks.
Acknowledgments
This work was previously reported in SPIE proceedings and supported by grants from the National Natural Science Foundation of China (Nos. 61771279 and 11435007) and the National Key Research and Development Program of China (No. 2016YFF0101304).
Biographies
Chuqing Feng received her bachelor’s degree in electronic information engineering from Beijing University of Technology. Currently, she is a PhD candidate at the Department of Engineering Physics, Tsinghua University. Her research interests are system calibration and material decomposition for spectral computed tomography.
Kejun Kang is a professor at the Department of Engineering Physics in Tsinghua University, the director of the Key Laboratory of Particle and Radiation Imaging of Ministry of Education, and the vice president of the Chinese Nuclear Society. His research focuses on the theories and technologies of radiation imaging.
Yuxiang Xing is an associate professor at the Department of Engineering Physics in Tsinghua University. She is the executive council member of Chinese Society for Stereology, and on the editorial boards of CT theory and applications in China and Chinese Journal of Stereology and Image Analysis. Her research focuses on the imaging physics, reconstruction methods for CT, performance evaluation, as well as deep learning methods for reconstruction and artifact reduction.
Disclosures
No conflicts of interest, financial or otherwise, are declared by the authors.
References
- 1.LeCun Y., et al. , “Backpropagation applied to handwritten zip code recognition,” Neural Comput. 1(4), 541–551 (1989). 10.1162/neco.1989.1.4.541 [DOI] [Google Scholar]
- 2.Zeiler M. D., Fergus R., “Visualizing and understanding convolutional networks,” in Proc. of Computer Vision—ECCV 2014: 13th European Conf., Zurich, Switzerland, Part I, Fleet D., et al., Eds., Springer International Publishing, Cham, pp. 818–833 (2014). [Google Scholar]
- 3.Jansson P. A., “Neural networks: an overview,” Anal. Chem. 63(6), 357A–362A (1991). 10.1021/ac00006a739 [DOI] [Google Scholar]
- 4.Krizhevsky A., Sutskever I., Hinton G. E., “ImageNet classification with deep convolutional neural networks,” in NIPS’12 Proc. of the 25th Int. Conf. on Neural Information Processing Systems, pp. 1097–1105 (2012). [Google Scholar]
- 5.Zhang H., et al. , “Image prediction for limited-angle tomography via deep learning with convolutional neural network,” arXiv:1607.08707 (2016).
- 6.Liang K., et al. , “Improve angular resolution for sparse-view CT with residual convolutional neural network,” Proc. SPIE 10573, 105731K (2018). 10.1117/12.2293319 [DOI] [Google Scholar]
- 7.Zhang C., Xing Y., “CT artifact reduction via U-net CNN,” Proc. SPIE 10574, 105741R (2018). 10.1117/12.2293903 [DOI] [Google Scholar]
- 8.Taguchi K., Iwanczyk J. S., “Vision 20/20: single photon counting x-ray detectors in medical imaging,” Med. Phys. 40(10), 100901 (2013). 10.1118/1.4820371 [DOI] [PMC free article] [PubMed] [Google Scholar]
- 9.Schlomka J. P., et al. , “Experimental feasibility of multi-energy photon-counting K-edge imaging in pre-clinical computed tomography,” Phys. Med. Biol. 53(15), 4031–4047 (2008). 10.1088/0031-9155/53/15/002 [DOI] [PubMed] [Google Scholar]
- 10.Ding H., et al. , “Characterization of energy response for photon-counting detectors using x-ray fluorescence,” Med. Phys. 41(12), 121902 (2014). 10.1118/1.4900820 [DOI] [PMC free article] [PubMed] [Google Scholar]
- 11.Li R., Li L., Chen Z., “Feasible energy calibration for multi-threshold photon-counting detectors based on reconstructed XRF spectra,” IEEE Trans. Radiat. Plasma Med. Sci. 1(2), 109–120 (2017). 10.1109/TNS.2016.2645721 [DOI] [Google Scholar]
- 12.Wu D., et al. , “A hybrid Monte Carlo model for the energy response functions of X-ray photon counting detectors,” Nucl. Instrum. Methods Phys. Res., Sect. A 830, 397–406 (2016). 10.1016/j.nima.2016.05.097 [DOI] [Google Scholar]
- 13.Agostinelli S., et al. , “Geant4—a simulation toolkit,” Nucl. Instrum. Methods Phys. Res., Sect. A 506(3), 250–303 (2003). 10.1016/S0168-9002(03)01368-8 [DOI] [Google Scholar]
- 14.Lee W.-J., et al. , “Material depth reconstruction method of multi-energy X-ray images using neural network,” in Annual Int. Conf. of the IEEE Engineering in Medicine and Biology Society, pp. 1514–1517 (2012). 10.1109/EMBC.2012.6346229 [DOI] [PubMed] [Google Scholar]
- 15.Zimmerman K. C., Schmidt T. G., “Experimental comparison of empirical material decomposition methods for spectral CT,” Phys. Med. Biol. 60(8), 3175–3191 (2015). 10.1088/0031-9155/60/8/3175 [DOI] [PMC free article] [PubMed] [Google Scholar]
- 16.Liao Y., et al. , “Pseudo dual energy CT imaging using deep learning-based framework: basic material estimation,” Proc. SPIE 10573, 105734N (2018). 10.1117/12.2293237 [DOI] [Google Scholar]
- 17.Zhang W., et al. , “Image domain dual material decomposition for dual-energy ct using butterfly network,” arXiv:1804.01685 (2018). [DOI] [PubMed]
- 18.Feng C., et al. , “An empirical material decomposition method (EMDM) for spectral CT,” in IEEE Nuclear Science Symp. Medical Imaging Conf. and Room-Temperature Semiconductor Detector Workshop, pp. 1–5 (2016). 10.1109/NSSMIC.2016.8069592 [DOI] [Google Scholar]
- 19.Nair V., Hinton G. E., “Rectified linear units improve restricted Boltzmann machines,” in Proc. of the 27th Int. Conf. on Machine Learning (ICML-10), pp. 807–814 (2010). [Google Scholar]
- 20.Pei J.-S., Wright J. P., Smythc A. W., “Mapping polynomial fitting into feedforward neural networks for modeling nonlinear dynamic systems and beyond,” Comput. Methods Appl. Mech. Eng. 194(42–44), 4481–4505 (2005). 10.1016/j.cma.2004.12.010 [DOI] [Google Scholar]
- 21.Ioffe S., Szegedy C., “Batch normalization: accelerating deep network training by reducing internal covariate shift,” in Int. Conf. on Machine Learning, pp. 448–456 (2015). [Google Scholar]
- 22.Shen V. K., et al. , “NIST standard reference simulation website NIST,” 2016. https://www.nist.gov/programs-projects/nist-standard-reference-simulation-website (13 April 2016).
- 23.Xu X., et al. , “Response function estimation for the XCounter Flite X1 photon counting detector using Monte Carlo method,” in IEEE Nuclear Science Symp., Medical Imaging Conf. and Room-Temperature Semiconductor Detector Workshop (NSS/MIC/RTSD), pp. 1–4 (2016). 10.1109/NSSMIC.2016.8069403 [DOI] [Google Scholar]
- 24.Ramachandran G. N., Lakshminarayanan A. V., “Three-dimensional reconstruction from radiographs and electron micrographs: application of convolutions instead of Fourier transforms,” Proc. Natl. Acad. Sci. U. S. A. 68(9), 2236–2240 (1971). 10.1073/pnas.68.9.2236 [DOI] [PMC free article] [PubMed] [Google Scholar]
- 25.Vedaldi A., Lenc K., “MatConvNet—convolutional neural networks for MATLAB,” in Proc. of the 23rd ACM Int. Conf. on Multimedia (MM ’15), ACM Press, New York, pp. 689–692 (2015). [Google Scholar]


