Abstract
We sought to determine the molecular composition of human cerebrospinal fluid (CSF) and identify the biochemical pathways represented in CSF to understand the potential for untargeted screening of inborn errors of metabolism (IEMs). Biochemical profiles for each sample were obtained using an integrated metabolomics workflow comprised of four chromatographic techniques followed by mass spectrometry. Secondarily, we wanted to compare the biochemical profile of CSF with those of plasma and urine within the integrated mass spectrometric-based metabolomic workflow. Three sample types, CSF (N=30), urine (N=40) and EDTA plasma (N=31), were analyzed from retrospectively collected pediatric cohorts of equivalent age and gender characteristics. We identified 435 biochemicals in CSF epresenting numerous biological and chemical/structural families. Sixty-three percent (273 of 435) of the biochemicals detected in CSF also were detected in urine and plasma, another 32% (140 of 435) were detected in either plasma or urine, and 5% (22 of 435) were detected only in CSF.Analyses of several metabolites showed agreement between clinically useful assays and the metabolomics approach. An additional set of CSF and plasma samples collected from the same patient revealed correlation between several biochemicals detected in paired samples. Finally, analysis of CSF from a pediatric case with dihydropteridine reductase (DHPR) deficiency demonstrated the utility of untargeted global metabolic phenotyping as a broad assessment to screen samples from patients with undifferentiated phenotypes. The results indicate a single CSF sample processed with an integrated metabolomics workflow can be used to identify a large breadth of biochemicals that could be useful for identifying disrupted metabolic patterns associated with IEMs.
Keywords: phenotype, biochemical, metabolomics, cerebrospinal fluid, diagnostic, DHPR deficiency
Introduction
Identifying biochemical signatures of inborn errors of metabolism (IEMs) can be time consuming due to the number of tests sometimes needed to produce conclusive results. The indistinct (non-specific) phenotypes associated with many IEMs, such as developmental delay and hypotonia, present a challenge to diagnosis and may lead to the need for multiple tests and sample types to screen for the gamut of disorders in the differential diagnosis. Diagnosis is further complicated by the intricate network of pathways that dictate biological processes within the tissues and organs in the human body and the number of biochemicals that accumulate due to perturbed biochemical pathways.
Cerebrospinal fluid (CSF) is in direct contact with the tissues of the central nervous system and has been useful for diagnosis and monitoring several diseases, including IEMs. CSF is a rich source of biochemical information that can be utilized for phenotype analysis during clinical diagnosis [1–4]. As the databases of information and screening technologies become more comprehensive, complete phenotypic assessments of individuals can be made to diagnose disease or to follow treatment of disease. For example, targeted biochemical analysis can identify defects of neurotransmitter biosynthesis or metabolism [5,6], as well as other diseases associated with neurological dysfunction [7–14].
Metabolomics offers the ability to detect the substrates, intermediates, and products of metabolism simultaneously and in multiple different biological matrices. Increased understanding of the biochemical composition of different biological matrices collected from healthy and diseased individuals offers the potential for using samples collected by less invasive means (e.g. plasma or urine) in place of CSF. Further, the ability of untargeted metabolomics to identify multiple biochemicals within a pathway can strengthen the confidence of identifying a potential disease in a patient. IEMs are frequently associated with pathogenic variants in genes encoding metabolic enzymes, but pathogenic variants can also target regulatory proteins that affect dysfunctional expression or activity of metabolic enzymes. Genomic-level testing, such as clinical whole exome sequencing (WES), is a well-established means to identify IEM disease variants [15–21], but the application of similar broad-based phenotype screening technologies lag behind genomic and genetic testing approaches. Genomic methods like WES identify variants of unknown significance (VUS) with some frequency, and metabolomic analysis has proven to be a useful source of functional data to determine whether the variant is pathogenic [22]. Newborn screening can identify a small subset of IEMs, but many IEMs are not included in newborn screening panels. Children with neurological symptoms that are undiagnosed, especially if they have seizures or other encephalopathy, are likely to undergo lumbar puncture. Thus, understanding the metabolite composition and characteristics of CSF is critical to apply untargeted metabolic phenotyping for the possible diagnosis of IEMs using CSF samples.
We recently demonstrated the utility of metabolomics to identify biochemical signatures of disease in plasma [23] and urine [24] for diverse classes of IEMs. This approach identified and assisted in the diagnosis of aromatic amino acid decarboxylase deficiency through the metabolomic and genomic analyses of plasma [22]. Prior to untargeted metabolomic analysis, the child was subjected to an extensive series of tests including (but not limited to) very long-chain fatty acid profiling, lysosomal storage disorders panel, urine mucopolysaccharide screening, chromosomal microarray, CSF amino acid analysis, urine organic acid profiling, plasma acylcarnitine determination, and serial MRIs – all of which failed to reveal the underlying diagnosis. Compound heterozygous variants of unknown significance were revealed in the DDC gene by WES. Follow-up neurotransmitter testing of CSF from a subsequent lumber puncture showed a prominent elevation of the L-DOPA metabolite 3-methoxytyrosine and undetectable levels of homovanillic acid and 5-hydroxyindoleacetic acid that confirmed the homozygous VUS present in the DDC gene caused genuine disease and confirmed the diagnosis of AADC deficiency [22]. Subsequent metabolomic profiling of plasma revealed that 3-methyoxytyrosine levels were markedly elevated (Z-score +6.1) and pointed to the utility of untargeted global metabolomic phenotyping to aid in the identification and accelerated diagnosis of IEMs.
In the present study, we sought to expand this approach to CSF through determination of the relative biochemical composition of CSF and comparison of the CSF profile to those of plasma and urine from two similar, but unpaired cohorts of samples. Further, we analyzed additional paired CSF and EDTA plasma samples from the same patient to determine if levels of molecules between the two matrices correlate. Finally, as a proof-of-concept demonstration, we analyzed CSF from a patient with confirmed DHPR deficiency and identified a metabolic signature indicative of disrupted tetrahydrobiopterin metabolism.
Methods
Sample collection
All procedures were in accordance with the ethical standards of the U.S. Department of Health and Human Services and were approved by the Baylor College of Medicine Institutional Review Board. This study was approved with a waiver of informed consent.
Specimens used in metabolomic testing were collected from residual patient samples in the Baylor clinical biochemical genetics laboratory. All samples were stored at −20°C for 1–9 months prior to metabolomic testing. The average age for the patients was 6.7 years of age (range from 22 days to 20 years of age, median of 4.5 years of age) and 60% female (n=18). Urine (40 samples) and EDTA plasma (31 samples) samples contained equivalent numbers of age-matched male and female subjects.
Metabolomic analysis
Sample Preparation
Metabolomics was performed as described previously [25,26]. One hundred microliters of sample were utilized for each analysis. Small molecules were extracted in an 80% methanol solution containing recovery standards, outlined below, and used to monitor extraction efficiency [27]. The resulting clarified supernatant extract was divided into five aliquots, one for each of the individual LC/MS analyses, briefly evaporated to remove the organic solvent and stored overnight under nitrogen before preparation for analysis.
LC/MS/MSn Analyses
All methods utilized a Waters ACQUITY ultra-performance liquid chromatography (UPLC) and a Thermo Scientific Q-Exactive high resolution/accurate mass spectrometer interfaced with a heated electrospray ionization (HESI-II) source and Orbitrap mass analyzer operated at 35,000 mass resolution [26]. On the day of analysis, the dried sample extract aliquots were reconstituted in solvents compatible to each of the four methods and one for a spare. Each reconstitution solvent contained a series of standards (isotopically labeled compounds) at fixed concentrations to monitor injection and chromatographic consistency and to align chromatograms during data processing. Separate aliquots were separated by two reverse phase positive ion methods, one reverse phase negative ion method, and one hydrophilic interaction liquid chromatographic method [26]. All of the methods alternated between full scan MS and data-dependent MSn scans using dynamic exclusion. The scan range varied slightly between methods but generally covered 70–1000 m/z. Raw data files were archived and data extracted as described below.
Metabolites were identified by matching the ion chromatographic retention index, accurate mass, and mass spectral fragmentation signatures with a reference library consisting of over 4,000 entries created from authentic standard metabolites under the identical analytical procedure as the experimental samples [25]. With the exception of compounds marked with an asterisk after their name (Supplemental Tables 1–4), identification of compounds was based on the match of its retention time, parent ion accurate mass, and MS/MS fragmentation spectrum to an authentic standard. This represents Tier 1 identification (highest level) as defined by the Sumner publication from the Metabolomics Standards Initiative (MSI) [28]. Compounds whose name is marked by an asterisk also were identified based on parent ion accurate mass and MS/MS fragmentation mass spectral data but no reference standard currently exists to make a library entry (Tier 2).
CSF, EDTA plasma, and urine were run as independent sample sets. Small aliquots of each of the clinical samples were pooled and run as 6 technical replicates at randomly spaced intervals throughout the entire sample set to monitor process variability and quality control for the performance of each batch. The median relative standard deviation was calculated for all spiked standards and endogenous biochemicals using median scaled values. The median relative standard deviations (RSDs) for the internal standards and endogenous biochemicals for each of the samples matrices were as follows: 4% and 11% for CSF, 6% and 6% for EDTA plasma, and 4% and 7% for urine, respectively.
Data analysis and statistics
Raw ion intensity values from mass spectrometry analysis were median scaled followed by imputation of any missing values with a value based on the minimum detected value, and, finally, were natural log-transformed on a per biochemical basis. Imputation was based on a random uniform variable with a range between .99 and 1.00 times the observed minimum. Z-scores were calculated by comparing the log transformed median scaled biochemical values to the associated mean and standard deviation, for a given biochemical, found in the reference population for the respective biological matrix.
Correlations were calculated by the Pearson method. Correlations for individual metabolites used a natural log transformation of the raw metabolite values and missing values were ignored.
Targeted amino acid analysis
For quantitative amino acid analysis, CSF samples were acidified, and large molecules were precipitated using equal volumes of Seraprep™ (Pickering Laboratories) and 200 mM lithium citrate (pH = 2.2). Filtered supernatant was analyzed via cation exchange chromatography using either a Biochrom 30 or Hitachi L-8900 amino acid analyzer. Quantitative values were calculated through comparison to spiked isotopic reference standards.
Results
Metabolomic profile of CSF samples
Small molecule analytes were extracted from CSF and subjected to four separate chromatographic and mass spectrometry analyses. We identified 435 biochemicals across these 30 CSF samples that matched biochemical entries in the library (Supplemental Tables 1 and 2).
Among the metabolites with Z-scores of 2 or greater in the 30 CSF samples were drugs and their metabolites, such as acetaminophen, pregabalin, fluoxetine, cetirizine, topiramate, sulfamethoxazole, and vitamin B6 metabolites (Supplemental Table 3), which indicates that treatment and intervention effects may be observed by metabolomic profiling of CSF.
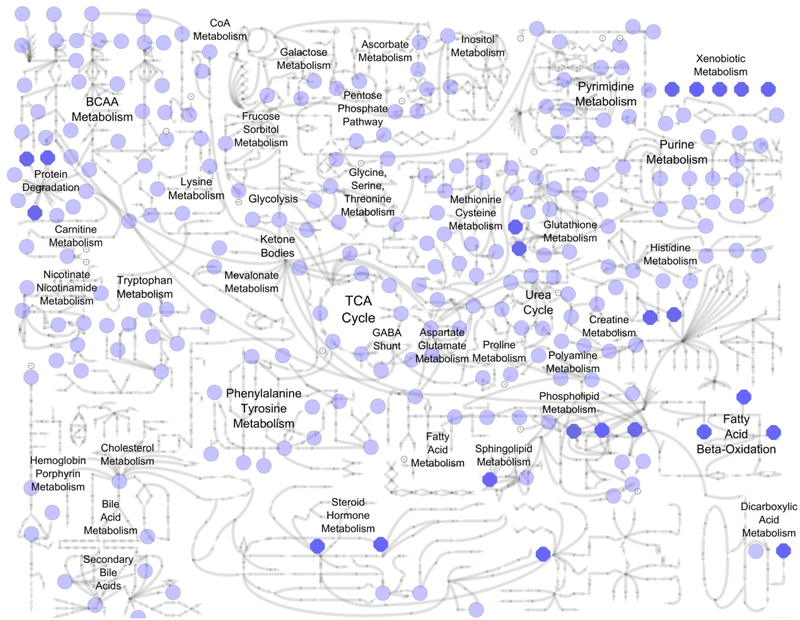
The mean number of biochemical detected per sample was 307 (median 306) with a range of 279 to 376 biochemicals detected in the sample set. Two hundred-seventeen out of 435 total biochemicals (50%) were detected in every sample, 258 biochemicals (59%) were detected in ≥ 90%, and 276 biochemicals (63%) in ≥ 80%. Molecules represented a broad coverage of biological pathways (Figure 1; Supplemental Table 2). The amino acid and lipid superfamilies represented the greatest number of biochemicals, with 143 amino acid and 139 lipid superfamily metabolites identified.
Figure 1. Areas of metabolism represented by biochemicals detected in CSF.
Light blue circles represent individual biochemicals detected in CSF (see Supplemental Table 2 for specific molecules). Bold blue octagons represent metabolite classes that are composed of multiple biochemicals (e.g. xenobiotic metabolism, fatty acid beta-oxidation). Metabolic sub-pathway labels appear adjacent to individual metabolites and/or metabolite classes depicted by blue circles and octagons.
Targeted amino acid measurements correlate to untargeted metabolomic analysis
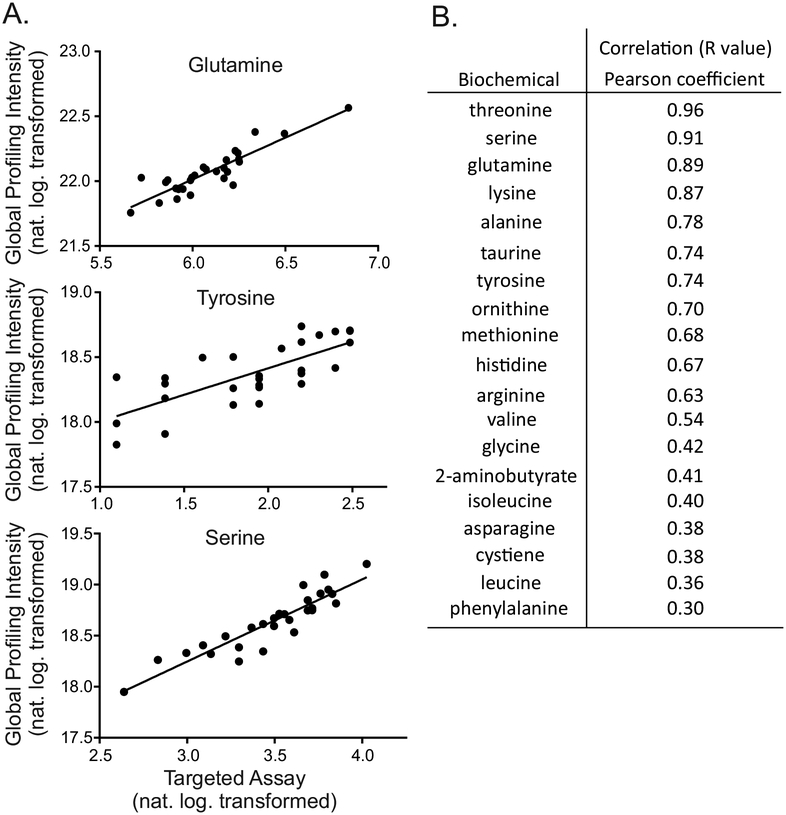
To understand how semi-quantitative measurement of compounds by untargeted global biochemical profiling performed relative to class-specific targeted assays, we conducted standard amino acid analysis on 28 of the CSF samples from the reference population cohort and compared the molar concentrations to values obtained using the metabolomics platform. Values of 18 analytes, those detected in > 90% of the samples in both assays, were correlated across both approaches. Untargeted biochemical profiling of these molecules showed lower limits of detection compared to the targeted methods (data not shown). We observed a positive correlation between targeted and untargeted amino acid test methods for all 18 amino acids (median r=0.68, mean r=0.63, Figure 2). Tryptophan, which is typically destroyed by acidification during amino acid analysis [29], was detected by the metabolomics platform but not by targeted amino acid profiling.
Figure 2. Metabolomic results correlate with targeted amino acid profiling assays.
(A) Example plots for glutamine, tyrosine, and phenylalanine as monitored in all samples for each assay. (B) Correlation values for biochemicals detected in >90% of clinical samples in both assays.
Comparison of CSF biochemical profile to matched cohorts of plasma and urine
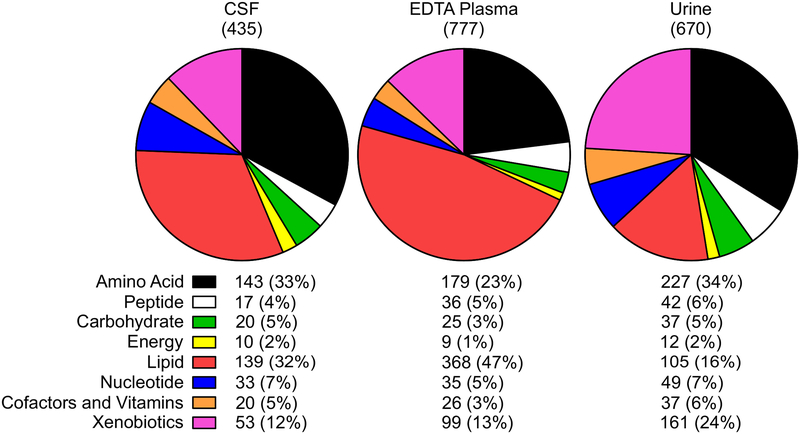
We utilized the biochemical profiles of plasma and urine collected from similar cohorts representative of age and sex as those from the CSF reference cohort in order to compare the biochemical profiles associated with each sample type. The analysis of EDTA plasma identified 777 biochemicals, and the analysis of urine revealed 670 biochemicals (Figure 3) and similar to other cohorts analyzed with the same technology [23,24].
Figure 3. Biochemical families represented in CSF, plasma, and urine.
The biochemical composition of CSF, plasma, and urine are depicted in pie charts showing the composition of each using nine biochemical and biological super families. The number of biochemicals along with the percentage of those in each superfamily are listed below each of the charts.
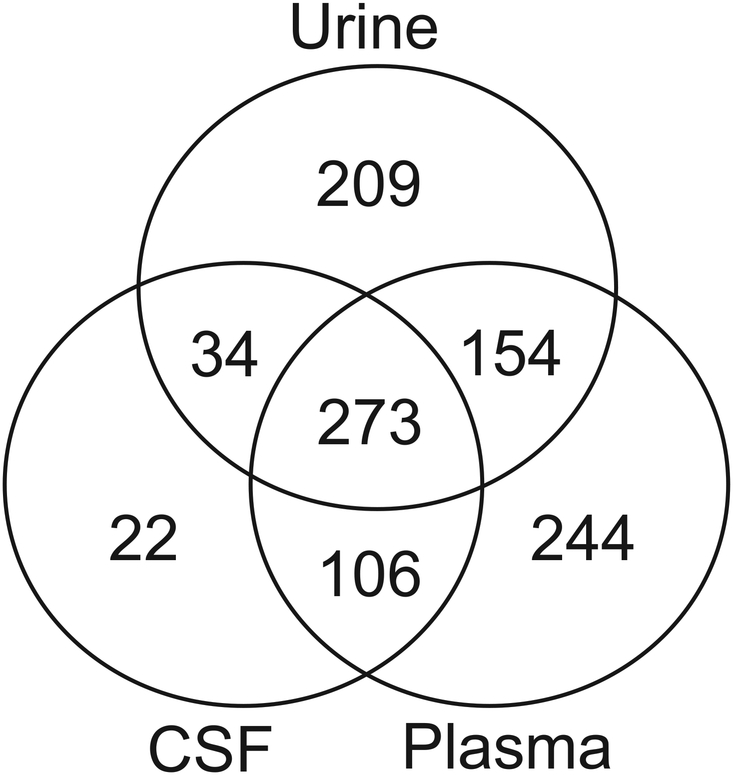
Of the 435 compounds detected across the CSF samples, 273 also were detected in plasma and urine (Figure 4). Twenty-two metabolites, including creatine phosphate, acetoacetate, and the drugs fluoxetine, pregabalin, and sulfamethoxazole, were detected in CSF only and were not detected in plasma or urine (Supplemental Table 1). Thirty-four biochemicals were detected in both CSF and urine, and 106 biochemicals were detected in both CSF and plasma. The smaller number of molecules detected in CSF compared to plasma and urine resulted in relatively modest decreases in coverage of different biological pathways because the compounds not detected in CSF were not concentrated in any single biochemical superfamily (Figure 3 and Supplemental Table 1). Biochemicals that were observed in CSF included markers linked to diet and nutritional intervention, such as vitamin B6 metabolism (e.g. pyridoxate). Heme was detected in 11 out of the 30 CSF samples and could be an indication of blood contamination (Supplemental Tables 2 and 3). A student’s t-test of heme (n=11) versus non-heme (n=19) -containing CSF samples showed only seven compounds – heme, glycerophosphoethanolamine, sphingosine, urate, 4-acetamidophenol, tartarate, and thioproline – significantly different (p<0.05) between the groups, indicating that the potential blood contamination did not affect the overall biochemical profiles of the CSF samples.
Figure 4. Comparison of the biochemical composition of CSF to plasma and urine.
Venn diagram showing the numbers of biochemicals detected in each matrix analyzed and the number of molecules in common between the matrices, illustrating that 273 biochemicals are commonly detected in CSF, plasma, and urine.
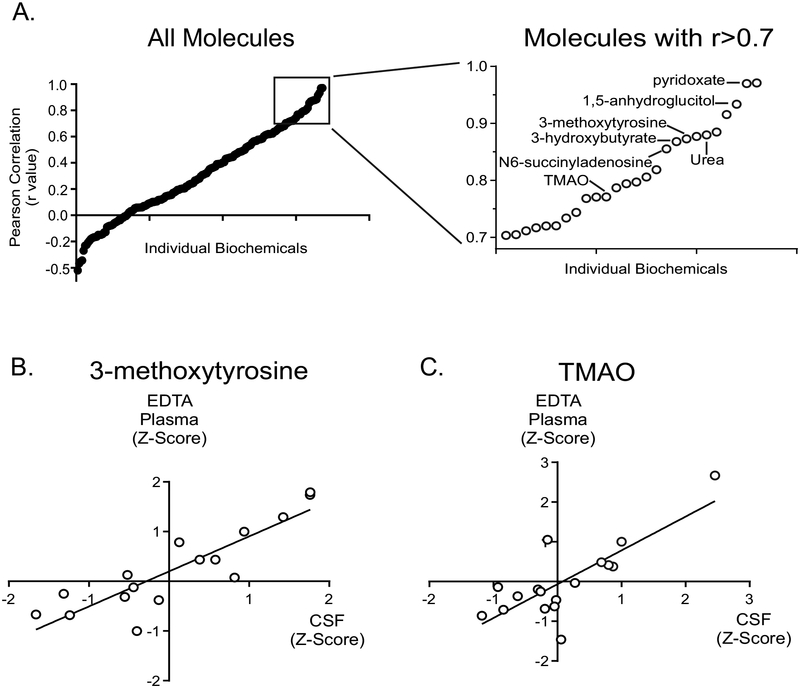
The comparisons above were based on unpaired samples (e.g., EDTA plasma, urine, and CSF were from different individuals). Direct comparison of biochemical profiles between paired samples across different matrices would provide insight into the relationship of biochemicals, if any, between matrices. Therefore, we next compared the levels of biochemicals in paired EDTA plasma and CSF samples using Z-scores. Z-scores allow for the comparison of biochemicals in an individual to those of a population. We identified 16 pairs of EDTA plasma and CSF samples collected on the same day. We examined those biochemicals detected at high prevalence (≥ 90% of clinical specimens) in order to study the relationship between the relative levels of these biochemicals in plasma and CSF. Using these criteria, we identified 188 biochemicals for which a correlation could be determined between the two matrices. Correlation of the levels of each of the 188 molecules in CSF to those in plasma revealed a range of values (Figure 5 and Supplemental Table 4). 3-methoxytyrosine, identified as a marker for aromatic amino acid decarboxylase deficiency [22], showed a high correlation between CSF and plasma (r = 0.88), and biochemicals linked to nutritional intervention, including pyridoxate (Vitamin B6; r = 0.97), carnitine (r = 0.61), and trimethylamine N-oxide (r = 0.77), showed positive correlations (Figure 5). The lysine degradation metabolite glutaroylcarnitine showed the strongest negative association between the two matrices (r = −0.42). Two molecules reflective of energy metabolism, 3-hydroxybutyrate (r = 0.86) and lactate (r = 0.64), also demonstrated a strong positive correlation between the two matrices.
Figure 5. Correlation of individual biochemicals in paired plasma and CSF samples using Z-score analysis.
(A) The correlation coefficient (r value) is plotted for each biochemical on the y-axis and the inset rectangle shows the resolution of those molecules with r >0.7 for the correlation of the plasma and CSF samples. The correlations for the two clinical specimen types, CSF and EDTA plasma, are shown for two individual molecules, 3-methoxytyrosine (B) and trimethylamine N-oxide (C).
Notably, neurotransmitters and biochemicals formed from the metabolism of neurotransmitters, which are typically analyzed using CSF, were also identified in EDTA plasma and urine (Table 1). These compounds included biosynthetic precursors of neurotransmitters (e.g. tryptophan and tyrosine), neurotransmitters (e.g. GABA and dopamine), and metabolites of neurotransmitters (e.g. homovanillate and dopamine sulfate). CSF contained thirteen molecules linked to neurotransmitter biology, EDTA plasma contained 14, and urine contained 20 (Table 1). There were no biochemical diagnostic compounds found in CSF that were not found in urine and most diagnostic compounds were found in plasma. This suggests that sampling of urine or plasma, which is less invasive than obtaining CSF, may be reliable in diagnosing various neurotransmitter disorders. On the other hand, while fewer neurotransmitter metabolites were detected, CSF might present a more robust metabolic phenotype than plasma or urine for IEMs with a strong association with the central nervous system.
Table 1.
Metabolites linked to neurotransmitter physiology in CSF, plasma, and urine.
| Neurotransmitter Family | Biochemical | CSF | Plasma | Urine |
|---|---|---|---|---|
| Adenosine | adenosine | X | X | |
| Aspartate, Glutamate, & GABA | 2-pyrrolidinone | X* | X | X |
| aspartate | X | X | X | |
| gamma-aminobutyrate (GABA) | X | X | ||
| glutamate | X | X | X | |
| glutamine | X | X | X | |
| N-acetylaspartate (NAA) | X | X | X | |
| N-acetyl-aspartyl-glutamate (NAAG) | X | X | X | |
| Dopamine & (Nor)Epinephrine | dopamine | X | ||
| dopamine 4-sulfate | X | X | ||
| dopamine 3-O-sulfate | X | X | X | |
| homovanillate (HVA) | X | X | ||
| tyramine | X | |||
| tyrosine | X | X | X | |
| vanillylmandelate (VMA) | X | X | ||
| Glycine | glycine | X | X | X |
| Histamine | histamine | X | ||
| Serotonin | 5-hydroxyindoleacetate (5-HIAA) | X | X | X |
| serotonin | X | X | ||
| tryptophan | X | X | X |
X* - 2-pyrrolidinone is regularly detected in clinical samples when defects of the GABA pathway are present or the GABA pathway is affected by treatment; it is not detected in normal/healthy
subjects in CSF (manuscript in preparation).
Biochemical Phenotyping of DHPR Deficiency in CSF
The current study and others [2,30] have pointed to the potential utility of untargeted biochemical profiling of CSF to identify metabolic disorders. To further test and provide a proof of concept for this assumption, CSF from a case with confirmed dihydropteridine reductase (DHPR) deficiency was retrospectively analyzed to explore the biochemical profile associated with this inborn error of metabolism (IEM).
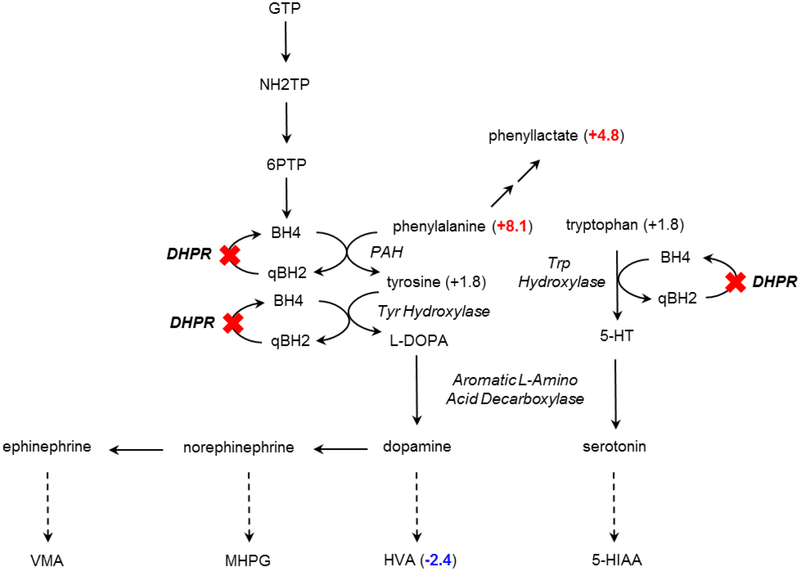
DHPR catalyzes the production of tetrahydrobiopterin, which is a required cofactor for phenylalanine hydroxylase (phenylalanine 4-monooxygenase). DHPR deficiency presents with hyperphenylalaninemia, as well as reduced levels of catecholamine metabolites in CSF [31]. Untargeted metabolomic profiling of CSF from a case with confirmed DHPR deficiency showed an accumulation of phenylalanine (Z-score 8.1) and its alternative product phenyllactate (Z-score 4.8) caused by the disruption of phenylalanine hydroxylase activity due to insufficient tetrahydrobiopterin (Figure 6). A product distal to phenylalanine hydroxylase, homovanillate (HVA), showed a considerable decrease (Z-score −2.4) in CSF from this subject. These results suggest that untargeted biochemical profiling of CSF has the capacity to identify disease signatures and thus, to identify IEMs.
Figure 6. DHPR deficiency can be identified through biomarkers in CSF.
Biochemical profiling of CSF identified substantial increases of phenylalanine and phenyllactate and decreased homovanillate (HVA) in a pathway where the activity of the tetrahydrobiopterin-dependent enzyme phenylalanine hydroxylase (PAH) was disrupted due to dihydropteridine reductase (DHPR) deficiency.
Discussion
Here, we assessed the biochemical profile of CSF and demonstrated that it is a rich matrix for untargeted metabolomic profiling. The biochemicals capable of being detected in CSF include those that reflect neurotransmitter metabolism, markers of nutritional or pharmacological intervention, and, as in the case of DHPR deficiency, IEM disease signatures. Detected metabolites in CSF represented all areas of metabolism and shared many biochemicals also detected in plasma and urine (Figures 1 and 3; Supplemental Table 1). Additionally, comparison of amino acids measured by untargeted metabolomics to those made by targeted amino acid profiling revealed the two methods largely agreed (Figure 2).
One specific group of molecules monitored in CSF is neurotransmitters and related metabolites (Table 1). These molecules typically are present in higher concentrations in CSF compared to other matrices and often have short biological half-lives, which can make them difficult to detect. As observed in Figure 6, when the necessary co-substrate tetrahydrobiopterin is insufficient, as is the case in dihydropteridine reductase deficiency, upstream metabolites such as phenylalanine and phenyllactate are elevated, whereas downstream metabolites such as homovanillate are decreased. Several neurotransmitters, as well as some of their metabolites, were detected across all three matrices (Table 1), such as 3-methoxytyrosine a biomarker for aromatic amino acid decarboxylase deficiency [22,32]. Therefore, the ability to monitor the metabolism neurotransmitters in CSF could be important to identify IEMs associated with the synthesis of neurotransmitters such as dopamine, GABA, and others.
CSF is commonly evaluated for a variety of neurological conditions. However, collection of CSF requires an invasive procedure, significantly increasing cost and stress on the patient and family, when compared to collection of plasma or urine. As the number of paired samples from cases with confirmed IEMs grows, it will be possible to determine whether metabolic phenotypes of disease observed in CSF are also recognized in plasma or urine – potentially offering the ability to monitor disease-specific signatures in samples that can be obtained with less risk and discomfort [22,32]. Additional studies examining critical amounts of heme contamination and stability of biochemicals in CSF will expand the analytical and clinical utility of biochemical phenotyping using mass spectrometry. The detection of heme with this technology does not necessarily mean samples are contaminated beyond clinical use but could reveal signatures associated with metabolic disorders.
The differences in the biochemical identification between the matrices (Figures 3 and 4) can be attributed to the biological functions associated with each. The blood-brain barrier restricts many molecules from freely leaving the bloodstream and entering the nervous system. This helps retain significant molecules in the central nervous system for proper physiologic function, as well as to limit the flow of molecules from the peripheral circulation into the CSF. Plasma is part of the bloodstream and functions in the metabolic homeostasis of tissues and organs throughout the body. Urine contains numerous metabolites derived from the degradation of macromolecules such as proteins and polysaccharides, as well as from the metabolism of carbohydrates, amino acids, nucleotides, and lipids; the biochemical profile of urine is defined by the selective excretion of metabolites through absorption in the renal glomerular apparatus. Additionally, the urinary tract, and to a lesser extent, the bloodstream, will have metabolites contributed by xenobiotic detoxification mechanisms performed in the liver, as well as by the gut microbiota, thereby increasing and differentiating their biochemical profiles from CSF. Analysis of matched-pairs of CSF and plasma samples revealed several biochemicals showing strong correlations between the two sample types (Figure 5 and Supplementary Table 4). Molecules associated with nutritional intervention, such as trimethylamine N-oxide, an analyte associated with carnitine supplementation [33] also correlated positively between plasma and CSF (Figure 5). The analysis of plasma and urine may be feasible for biomarkers of disease which translate from the CSF into the circulation and urinary tract. Specifically, these would be abundant markers of disease or those markers which can be utilized to track the treatment and response to treatment of disease. A specific example of such a marker is 3-methoxytyrosine identified in the plasma of subjects diagnosed with aromatic amino acid decarboxylase deficiency [22]. Additional studies will be required to validate the sensitivity of these biofluids for specific biomarkers associated with disease.
This analysis showed that CSF has a complex biochemical profile, and the analysis of CSF through global metabolomics provides the opportunity to identify biochemicals that typically require multiple different tests to measure or that are not detected in current clinically available diagnostic tests. Especially relevant for the analysis of CSF is the ability to monitor a host of neurotransmitter metabolites. However, currently this assay is a semi-quantitative screening assay which can assist to increase efficiency of analysis, but additional targeted assays (biochemical and/or molecular) should be utilized to define and confirm patient diagnoses. Further validation using clinical samples will illustrate the power of this technology, data analysis, utilization of specific matrices to identify disease signatures and track disease, and treatment biomarkers in the clinical arena. The recognition of biochemical profiles that can be used to identify various IEMs will grow as new cases are examined and as untargeted metabolomic profiling is adopted for the clinical assessment of IEMs.
Supplementary Material
Highlights:
Untargeted metabolomics is a semi-quantitative screening approach used to identify small molecules in cerebrospinal fluid.
CSF has a complex biochemical profile
Urine and/or plasma may be sufficient surrogates for CSF for diagnosis of a subset of inborn errors of metabolism.
Untargeted metabolomics provides an excellent broad-based screening method but does require targeted follow-up biochemical and/or molecular testing for confirmation of diagnoses.
Further validation of specific inborn errors of metabolism will illustrate the power of this technology, data analysis, utilization of specific matrices to identify disease signatures, monitor disease progression, and to define and assess treatment biomarkers.
Acknowledgements
This work was funded, in part, by the T32 GM07526–37 Medical Genetics Research Fellowship Program (MJM). We thank Dr. O. Shi for unwavering technical assistance and Dr. Robnet Kerns for expertise in preparing Figure 1.
Footnotes
Author Disclosure Statement
ADK, KLP, AME, JEW, and LADM are employees of Metabolon, Inc. and, as such, have affiliations with or financial involvement with Metabolon, Inc. MJM, VRS, QS, and SHE are employees of Baylor College of Medicine, which has a partnership with Baylor Genetics and derives revenue from genetic testing. The authors have no other relevant affiliations or financial involvement with any organization or entity with a financial interest in or financial conflict with the subject matter or materials discussed in the manuscript apart from those disclosed.
References
- 1.Forsythe IJ, Wishart DS (2009) Exploring human metabolites using the human metabolome database. Curr Protoc Bioinformatics Chapter 14. [DOI] [PubMed] [Google Scholar]
- 2.Mandal R, Guo AC, Chaudhary KK, Liu P, Yallou FS, et al. (2012) Multi-platform characterization of the human cerebrospinal fluid metabolome: a comprehensive and quantitative update. Genome Med 4: 38. [DOI] [PMC free article] [PubMed] [Google Scholar]
- 3.Schwarz E, Torrey EF, Guest PC, Bahn S (2012) Biomarker discovery in human cerebrospinal fluid: the need for integrative metabolome and proteome databases. Genome Med 4: 39. [DOI] [PMC free article] [PubMed] [Google Scholar]
- 4.Wishart DS, Knox C, Guo AC, Eisner R, Young N, et al. (2009) HMDB: a knowledgebase for the human metabolome. Nucleic Acids Res 37: D603–610. [DOI] [PMC free article] [PubMed] [Google Scholar]
- 5.Camargo JA, Bertolucci PH (2015) Quantification of Amino Acid Neurotransmitters in Cerebrospinal Fluid of Patients with Neurocysticercosis. Open Neurol J 9: 15–20. [DOI] [PMC free article] [PubMed] [Google Scholar]
- 6.Rodan LH, Gibson KM, Pearl PL (2015) Clinical Use of CSF Neurotransmitters. Pediatr Neurol 53: 277–286. [DOI] [PubMed] [Google Scholar]
- 7.Alfadhel M, Alrifai MT, Trujillano D, Alshaalan H, Al Othaim A, et al. (2015) Asparagine Synthetase Deficiency: New Inborn Errors of Metabolism. JIMD Rep 22: 11–16. [DOI] [PMC free article] [PubMed] [Google Scholar]
- 8.Arning E, Bottiglieri T (2014) LC-MS/MS Analysis of Cerebrospinal Fluid Metabolites in the Pterin Biosynthetic Pathway. JIMD Rep. [DOI] [PMC free article] [PubMed] [Google Scholar]
- 9.Hoffmann GF, Surtees RA, Wevers RA (1998) Cerebrospinal fluid investigations for neurometabolic disorders. Neuropediatrics 29: 59–71. [DOI] [PubMed] [Google Scholar]
- 10.Holder BR, McNaney CA, Luchetti D, Schaeffer E, Drexler DM (2015) Bioanalysis of acetylcarnitine in cerebrospinal fluid by HILIC-mass spectrometry. Biomed Chromatogr 29: 1375–1379. [DOI] [PubMed] [Google Scholar]
- 11.Lee JH, van Kuilenburg AB, Abeling NG, Vasta V, Hahn SH (2015) A Korean Case of beta-Ureidopropionase Deficiency Presenting with Intractable Seizure, Global Developmental Delay, and Microcephaly. JIMD Rep 19: 117–121. [DOI] [PMC free article] [PubMed] [Google Scholar]
- 12.Ramm-Pettersen A, Stabell KE, Nakken KO, Selmer KK (2014) Does ketogenic diet improve cognitive function in patients with GLUT1-DS? A 6- to 17-month follow-up study. Epilepsy Behav 39: 111–115. [DOI] [PubMed] [Google Scholar]
- 13.Scholl-Burgi S, Korman SH, Applegarth DA, Karall D, Lillquist Y, et al. (2008) The relation of cerebrospinal fluid and plasma glycine levels in propionic acidaemia, a ‘ketotic hyperglycinaemia’. J Inherit Metab Dis 31: 395–398. [DOI] [PubMed] [Google Scholar]
- 14.van der Ham M, Albersen M, de Koning TJ, Visser G, Middendorp A, et al. (2012) Quantification of vitamin B6 vitamers in human cerebrospinal fluid by ultra performance liquid chromatography-tandem mass spectrometry. Anal Chim Acta 712: 108–114. [DOI] [PubMed] [Google Scholar]
- 15.Blanchet L, Smolinska A, Attali A, Stoop MP, Ampt KA, et al. (2011) Fusion of metabolomics and proteomics data for biomarkers discovery: case study on the experimental autoimmune encephalomyelitis. BMC Bioinformatics 12: 254. [DOI] [PMC free article] [PubMed] [Google Scholar]
- 16.Guy RT, Santago P, Langefeld CD (2012) Bootstrap aggregating of alternating decision trees to detect sets of SNPs that associate with disease. Genet Epidemiol 36: 99–106. [DOI] [PMC free article] [PubMed] [Google Scholar]
- 17.Hu YJ, Li Y, Auer PL, Lin DY (2015) Integrative analysis of sequencing and array genotype data for discovering disease associations with rare mutations. Proc Natl Acad Sci U S A 112: 1019–1024. [DOI] [PMC free article] [PubMed] [Google Scholar]
- 18.Luykx JJ, Bakker SC, Visser WF, Verhoeven-Duif N, Buizer-Voskamp JE, et al. (2015) Genome-wide association study of NMDA receptor coagonists in human cerebrospinal fluid and plasma. Mol Psychiatry. [DOI] [PubMed] [Google Scholar]
- 19.Molho-Pessach V, Rios JJ, Xing C, Setchell KD, Cohen JC, et al. (2012) Homozygosity mapping identifies a bile acid biosynthetic defect in an adult with cirrhosis of unknown etiology. Hepatology 55: 1139–1145. [DOI] [PMC free article] [PubMed] [Google Scholar]
- 20.Shin SY, Fauman EB, Petersen AK, Krumsiek J, Santos R, et al. (2014) An atlas of genetic influences on human blood metabolites. Nat Genet 46: 543–550. [DOI] [PMC free article] [PubMed] [Google Scholar]
- 21.Suhre K, Shin SY, Petersen AK, Mohney RP, Meredith D, et al. (2011) Human metabolic individuality in biomedical and pharmaceutical research. Nature 477: 54–60. [DOI] [PMC free article] [PubMed] [Google Scholar]
- 22.Atwal PS, Donti TR, Cardon AL, Bacino CA, Sun Q, et al. (2015) Aromatic L-amino acid decarboxylase deficiency diagnosed by clinical metabolomic profiling of plasma. Mol Genet Metab 115: 91–94. [DOI] [PubMed] [Google Scholar]
- 23.Miller MJ, Kennedy AD, Eckhart AD, Burrage LC, Wulff JE, et al. (2015) Untargeted metabolomic analysis for the clinical screening of inborn errors of metabolism. J Inherit Metab Dis 38: 1029–1039. [DOI] [PMC free article] [PubMed] [Google Scholar]
- 24.Kennedy AD, Miller MJ, Beebe K, Wulff JE, Evans AM, et al. (2016) Metabolomic Profiling of Human Urine as a Screen for Multiple Inborn Errors of Metabolism. Genet Test Mol Biomarkers. [DOI] [PMC free article] [PubMed] [Google Scholar]
- 25.Dehaven CD, Evans AM, Dai H, Lawton KA (2010) Organization of GC/MS and LC/MS metabolomics data into chemical libraries. J Cheminform 2: 9. [DOI] [PMC free article] [PubMed] [Google Scholar]
- 26.Evans AM BB, Liu Q, Mitchell MW, Robinson RJ, Dai H, Stewart SJ, DeHaven CD, Miller LAD. (2014) High resolution mass spectrometry improves data quantity and quality as compared to unit mass resolution mass spectrometry in high-throughput profiling metabolomics. Metabolomics 4:132. [Google Scholar]
- 27.Evans AM, DeHaven CD, Barrett T, Mitchell M, Milgram E (2009) Integrated, nontargeted ultrahigh performance liquid chromatography/electrospray ionization tandem mass spectrometry platform for the identification and relative quantification of the small-molecule complement of biological systems. Anal Chem 81: 6656–6667. [DOI] [PubMed] [Google Scholar]
- 28.Sumner LW, Amberg A, Barrett D, Beale MH, Beger R, et al. (2007) Proposed minimum reporting standards for chemical analysis Chemical Analysis Working Group (CAWG) Metabolomics Standards Initiative (MSI). Metabolomics 3: 211–221. [DOI] [PMC free article] [PubMed] [Google Scholar]
- 29.Friedman M, Finley JW (1971) Methods of tryptophan analysis. J Agric Food Chem 19: 626–631. [DOI] [PubMed] [Google Scholar]
- 30.Wishart DS, Lewis MJ, Morrissey JA, Flegel MD, Jeroncic K, et al. (2008) The human cerebrospinal fluid metabolome. J Chromatogr B Analyt Technol Biomed Life Sci 871: 164–173. [DOI] [PubMed] [Google Scholar]
- 31.Goldstein DS, Hahn SH, Holmes C, Tifft C, Harvey-White J, et al. (1995) Monoaminergic effects of folinic acid, L-DOPA, and 5-hydroxytryptophan in dihydropteridine reductase deficiency. J Neurochem 64: 2810–2813. [DOI] [PubMed] [Google Scholar]
- 32.Donti TR, Cappuccio G, Hubert L, Neira J, Atwal PS, et al. (2016) Diagnosis of adenylosuccinate lyase deficiency by metabolomic profiling in plasma reveals a phenotypic spectrum. Mol Genet Metab Rep 8: 61–66. [DOI] [PMC free article] [PubMed] [Google Scholar]
- 33.Miller MJ, Bostwick BL, Kennedy AD, Donti TR, Sun Q, et al. (2016) Chronic Oral L-Carnitine Supplementation Drives Marked Plasma TMAO Elevations in Patients with Organic Acidemias Despite Dietary Meat Restrictions. JIMD Rep. [DOI] [PMC free article] [PubMed] [Google Scholar]
Associated Data
This section collects any data citations, data availability statements, or supplementary materials included in this article.


