Abstract
The biophysical basis for electrocardiographic evaluation of myocardial ischemia stems from the notion that ischemic tissues develop, with relative uniformity, along the endocardial aspects of the heart. These injured regions of subendocardial tissue give rise to intramural currents that lead to ST segment deflections within electrocardiogram (ECG) recordings. The concept of subendocardial ischemic regions is often used in clinical practice, providing a simple and intuitive description of ischemic injury; however, such a model grossly oversimplifies the presentation of ischemic disease—inadvertently leading to errors in ECG-based diagnoses. Furthermore, recent experimental studies have brought into question the subendocardial ischemia paradigm suggesting instead a more distributed pattern of tissue injury. These findings come from experiments and so have both the impact and the limitations of measurements from living organisms. Computer models have often been employed to overcome the constraints of experimental approaches and have a robust history in cardiac simulation. To this end, we have developed a computational simulation framework aimed at elucidating the effects of ischemia on measurable cardiac potentials. To validate our framework, we simulated, visualized, and analyzed 226 experimentally derived acute myocardial ischemic events. Simulation outcomes agreed both qualitatively (feature comparison) and quantitatively (correlation, average error, and significance) with experimentally obtained epicardial measurements, particularly under conditions of elevated ischemic stress. Our simulation framework introduces a novel approach to incorporating subject-specific, geometric models and experimental results that are highly resolved in space and time into computational models. We propose this framework as a means to advance the understanding of the underlying mechanisms of ischemic disease while simultaneously putting in place the computational infrastructure necessary to study and improve ischemia models aimed at reducing diagnostic errors in the clinic.
Keywords: Ischemia, ST deviation, Computer model, Cardiac simulation, Electrocardiographic forward problem, Extracellular potentials
INTRODUCTION
The electrical and electrocardiographic consequences of myocardial ischemia have been a topic of clinical study for more than a century,8,18 yet both mechanistic understanding and clinical management remain unsatisfying. Myocardial ischemia results from insufficient blood flow to regions of cardiac tissue. Insufficient blood flow, in turn, leads to inadequate oxygen supply and reduced removal of metabolic byproducts from affected regions of the heart, giving rise to shifts in ionic concentrations and corresponding alterations in electrophysiology.11 Ischemia-induced changes to the electrical activity of the heart lead to changes in the electrocardiogram (ECG), where key ECG markers, such as ST segment shift, are used clinically to monitor ischemic stress.7 ST-segment shifts, however, have been criticized as an inadequate measure of ischemia in patients,9,14 with average accuracy rates ranging from 68–75% and associated sensitivity and specificity ranges of 50–72% and 69–90%, respectively.1
The inaccuracies associated with electrocardiographic ischemia detection are due, in part, to an incomplete understanding of the electrical response of the heart to the ischemic condition. Current clinical understanding assumes that regions of the heart that are most vulnerable to ischemia lie adjacent to the endocardium and are, therefore, the most likely sites of injury.7,13,23 This concept supports the widely accepted view that ischemia can be bioelectrically approximated with geometrically simple source models, located near the endocardium.12,13,20 These source models arise due to differences in transmembrane potential that originate between ischemic regions and surrounding healthy tissues giving rise to what are known as “injury potentials” that drive shifts in the ST segments of individual ECG leads. Recent experimental studies, however, have brought the subendocardial ischemia paradigm into question.2,3 In these studies, intramural extracellular (EC) potentials were measured as an electrical proxy for the metabolic and electrophysiological changes associated with acute ischemia. Spatial distributions of these EC potentials contradicted the accepted dogma of geometrically well-defined, subendocardial ischemic zones. EC potentials, generated by a variety of different ischemic conditions, were, in general, geometrically complex and intramurally distributed, rather than simple zones located only near the endocardium.2,3 This discovery of distributed ischemic potentials is a relatively new finding, and has, therefore, seen little application in the computational modeling community.26 Computational models have historically adopted the schematic ischemic zone paradigm wherein singular, subendocardial ischemic zones, defined by simple geometric primitives, are embedded within a cardiac volume conductor and used as sources from which resulting extracellular potentials throughout the heart can be determined.12, 13, 20 While schematic computational approaches have been useful in highlighting the electrical effects of ischemia within the heart,20 they do not fully represent the complexity of ischemic injury as illustrated by the distributed potential patterns reported during experiments.2,3 This novel discovery necessitates an equally novel simulation approach to elucidate the effects of these sources on computational cardiac models.
To this end, we developed a simulation framework to investigate the effects of experimentally derived, subject-specific, distributed sources on cardiac potentials. To validate our approach, we further constructed a series of subject-specific ischemia simulations that incorporated experimentally obtained electrical signals into image-based, subject-specific cardiac models.3 By applying image-based modeling approaches, we constructed realistic, three-dimensional cardiac meshes into which we imposed measured EC potentials acquired throughout both the ischemic and the nearby unaffected regions. These potentials acted as boundary conditions from which we computed potential values throughout the heart and over the epicardium. We subsequently validated these simulated solutions against recorded epicardial potentials obtained from the same experimental procedures and found that our modeling approach produced satisfactory agreement—particularly under conditions of elevated ischemic stress.
MATERIALS AND METHODS
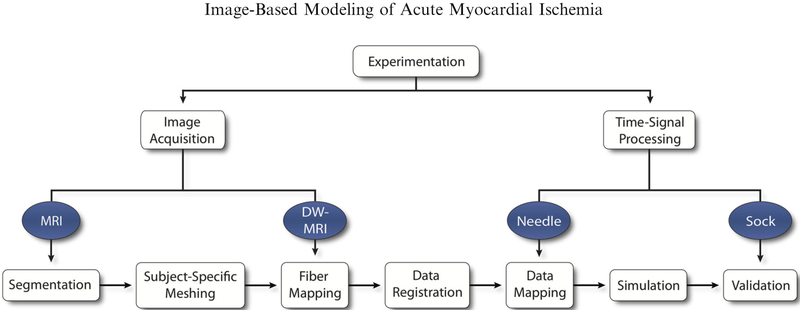
Our image-based modeling framework was built upon the basic principles of subject-specific model design that we proposed previously.15 Using imaging, segmentation, meshing, and simulation, we developed a basic infrastructure for modeling and quantitatively analyzing the ischemic condition in silico (Fig. 1). In brief, we extracted geometric and electrical potentials from experimental animal models in which episodes of controlled ischemia had been induced. Post-experiment magnetic resonance imaging (MRI) scans were used to construct subject-specific models of the heart, which included both geometry and anisotropic conductivity tensors. Known, intramural, extracellular (EC) potential data, extracted via experimental measurements were imposed within the mesh and used as boundary conditions to simulate extracellular potentials throughout the heart and over the epicardium. Simulated epicardial potentials were subsequently validated against recorded unipolar epicardial electrograms, using Wilson Central Terminal (WCT) as a common reference, which were measured simultaneously during each experiment.
FIGURE 1.
Ischemia Simulation Pipeline. Imaging and time signal data were extracted from experimental protocols of acute, controlled ischemia in dogs. Imaging files were used to generate geometric models through segmentation and meshing. Cardiac fibers and intramural electrical signals were aligned and mapped within the geometric models and used to simulate epicardial potentials, which were subsequently validated against recorded, unipolar electrograms.
Experimental Methods
We obtained experimental intramyocardial and epicardial electrograms from open-chest, anesthetized canine models in which we induced controlled, acute ischemia, as described previously by Aras et al.2,3 Briefly, we produced episodes of acute, transient ischemia by regulating coronary blood flow through the left anterior descending artery (LAD) with varying levels of either atrial pacing (demand ischemia) or reduced coronary blood flow (supply ischemia). Individual ischemia episodes lasted no longer than 10 minutes, thereby eliminating complications associated with chronic ischemic conditions. We used high-resolution, customized sock4 and plunge needle21 electrodes to capture extracellular electrogram recordings along ventricular surfaces and within a localized portion of the myocardium, respectively. The resulting electrograms were calibrated, gain adjusted, and corrected against control recordings taken prior to each ischemia episode. From these signals, we identified shifts in the ST segment by measuring potential values at ST40%—a time point that is 40% between the end of the QRS complex (QRSoff) and the peak of the T wave (Tpeak). In total, we extracted and analyzed 226 individual ischemic events, or unique time steps within an ischemic episode, from two canine models (Experiments 1 and 2 shown in Figs. 3 and 4), using ST40% potentials recorded from both epicardial and transmural electrodes. Intramural ST40% values were used as simulation sources within the modeling pipeline while epicardial ST40% potential values, recorded from sock electrodes, served as validation.
FIGURE 3.
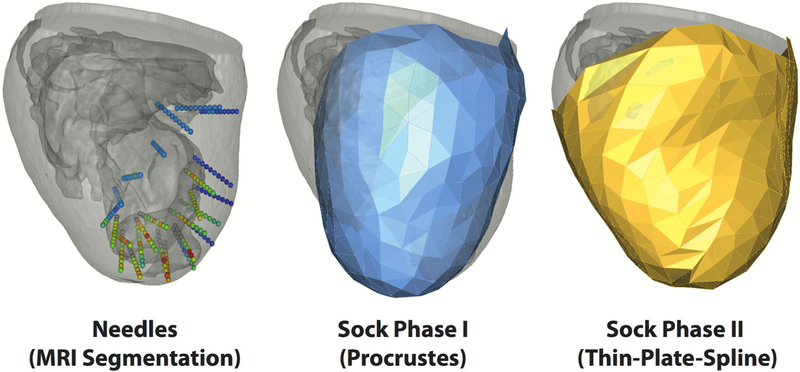
Registration. Plunge needle geometries (left) were isolated through MRI segmentation to provide the basis for needle electrode locations within the cardiac mesh. Sock geometries were registered to the epicardial surface mesh in two phases. Phase I (middle) applied a rigid, procrustes algorithm to a pre-constructed cardiac sock template. Phase II (right), utilized a thin-plate-spline morphing algorithm to project Phase I node locations onto the epicardial mesh surface.
FIGURE 4.
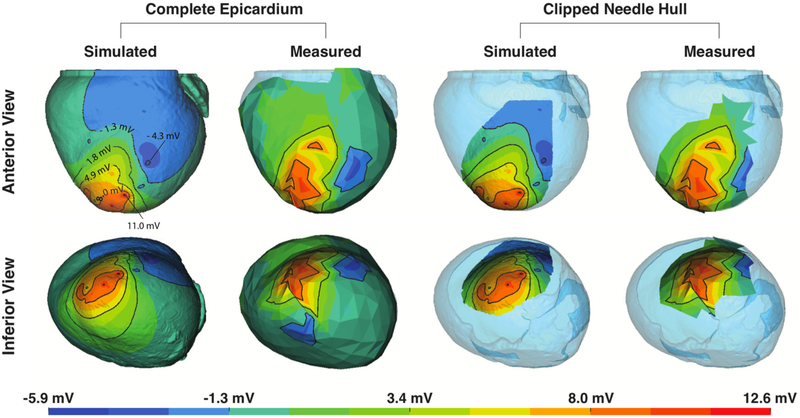
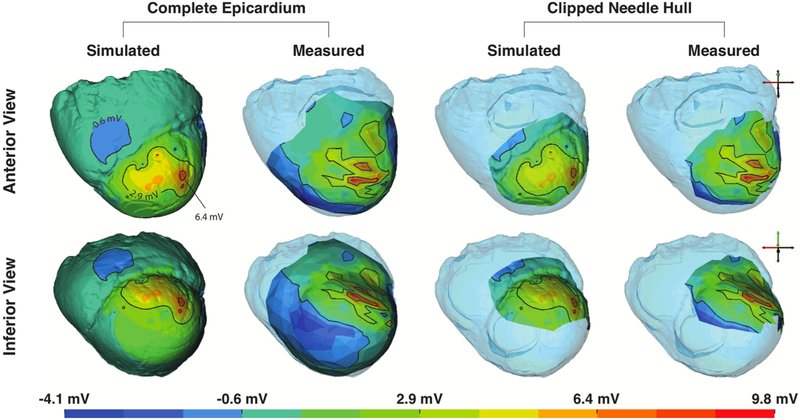
Assessment of Simulations from Experiment 1. Simulated and measured ST40% potential amplitudes, considering two different degrees of coverage, are shown in two different orientations. The complete epicardium (leftmost quadrant) and a subset of the epicardial surface that corresponds to the region captured directly over the needle electrodes (rightmost quadrant) show views along both the anterior-to-posterior axis (upper) and inferior-to-superior axis (lower).
All experiments followed the approval of the Institutional Animal Care and Use Committee at University of Utah and conforming to the Guide for the Care and Use of Laboratory Animals (NIH Pub. No 85-23, Revised 1996).
Image Acquisition, Processing, and Segmentation
In preparation for the imaging process, plunge needles were replaced postexperiment with plastic spacers to make needle locations visible in MRI images. After experimentation, hearts were excised and scanned with a 7 Tesla MRI scanner (Bruker BIOSPEC 70/30, Billerica, MA) using FISP (Fast Imaging with Steady-state Precession) and FLASH (Fast Low Angle Shot) imaging sequences as well as Diffusion Weighted MRI (DW-MRI). Capitalizing on the combined advantages of both FISP (consistent volume boundaries) and FLASH sequences (high internal contrast), we produced realistic geometric segmentations of cardiac tissue, blood, and plunge electrode geometries, using the Seg3D open-source software package.6
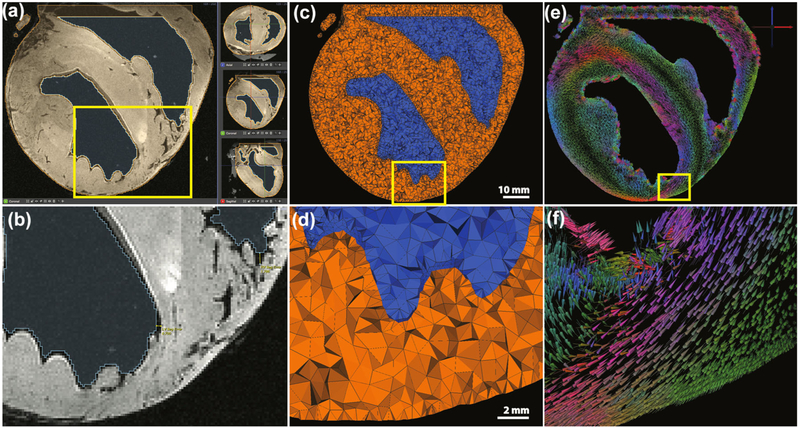
Our segmentation process consisted of both manual and automated processes. First, median and gradient anisotropic diffusion filters were applied to the raw cardiac images to reduce noise. Next, thresholding was applied to acquire cardiac and blood pool volumes. Resulting cardiac volumes were manually clipped and capped along the base—eliminating most of the atrial region and enclosing the blood volumes. Manual inspection and correction consisted of a slice-by-slice analysis of the volume. Provided that both FISP and FLASH modalities were used, segmentations of each were joined via boolean operators to provide final heart and blood volumes (Fig. 2a). Segmentations were within 1 mm of visible FISP epicardial and LV surfaces (Fig. 2b). Due to heavy trabeculation in the RV, however as much as 3 mm of error was observed along RV surfaces. Needle geometries were identified as the negative spaces within the cardiac tissues that, unlike blood vessels, exhibited rigid structural characteristics. Manual segmentation was required to extract needle geometries.
FIGURE 2.
Image and Geometric Processing. MRI images were segmented, (a), to created volumetric representations of the heart from which cardiac meshes were generated, (c). Principal eigenvector fields from DW-MRI were mapped onto the cardiac meshes using weighted average interpolation, (e), where vector glyph coloration is dictated by direction—as indicated by the axes in the upper right corner. (b, d) and (f) are enlarged views of smaller regions of the images above.
Geometric Processing and Data Mapping
Meshing
Segmented cardiac volumes served as inputs to the BioMesh3D software package,5 which we employed to generate realistic, unstructured, three-dimensional, tetrahedral meshes for use in subsequent finite element simulations (Figs. 2c and 2d). The BioMesh3D package incorporates a particle-based approach that optimizes surface node locations and then applies Delaunay tetrahedralization to optimize element quality. Resulting cardiac meshes maintained smooth conforming interfaces along material boundaries and were comprised of 3–4 million elements having edge lengths ranging from 0.029 to 2.31 mm (average edge length = 0.75 ± 0.43 mm).
Fiber Mapping
Subject-specific image-based fiber orientation parameters were extracted from DW-MRI images and projected onto subject-specific cardiac meshes following techniques proposed by Vadakkumpadan et al.28 From DW-MRI images, which existed in the same coordinate space as previously segmented structural MRI images and corresponding cardiac meshes, principal eigenvector fields were generated to identify the primary, or longitudinal (l), fiber orientation within the heart. Eigenvector fields were mapped onto the centroid of each mesh element using weighted-average interpolation and subsequently normalized (Figs. 2e and 2f). Conductivity values were assigned to longitudinal vectors (σel) and to the complimentary orthonormal vector fields representing the transverse (t) and normal (n) components of the fiber coordinate space, and which were regarded as isotropic (σet = σen)—generating the conductivity tensor . Conductivity values reflected those proposed by Stinstra et al.24,25 which we normalized to the extracellular longitudinal conductivity such that σel = 1 and σet = 1/3. Blood was also represented within the mesh and was assigned an isotropic conductivity of σb = 3. Conductivity values were similar to the normalized extracellular conductivities proposed by Roth et al.22 Intracellular conductivity values were not considered, provided that both source and solution potentials existed entirely in the extracellular domain.
Geometric Registration and Mapping of Measured Potentials.
An essential component of our subject-specific simulation framework was the registeration of intramural plunge needle and epicardial sock electrode locations to each cardiac mesh,27 which ensured that simulations properly reflected the spatial distribution of experimental studies. To this end, we implemented a multistep registration approach. First, needle electrodes were positioned within the cardiac mesh. Next, a rigid registration algorithm aligned a pre-constructed sock geometry template to the cardiac surface. Finally, a thin-plate-spline morphing algorithm tightly positioned sock geometries onto epicardial surfaces.
We initiated the registration process by obtaining correspondence points immediately postexperiment to identify needle entry sites and a pre-determined subset of sock electrodes using an electromechanical digitizer (Microscribe). As part of the digitization process, needle orientation vectors were also determined using two digitized points along each needle shaft—one at the entry site and the other at a point along the shaft but distant from the heart. Further detail regarding needle position and orientation was obtained via MRI segmentation as described previously.
MRI-defined needle segmentations were regarded as the ground truth for needle registration; however, in the event that individual needles were not visible in MRI images, due to lost or overly narrow spacers, they were approximated by, first, identifying needle entry sites from photographic images and then defining orientation using previously determined, digitized, needle vectors. With needle geometries identified, we projected intramural nodes, representing needle electrodes, into the heart geometry. Unipolar electrograms, measured from actual needle electrodes, were mapped onto the closest corresponding elements within the mesh to define a source representative of the underlying ischemic activity (Fig. 3a).
Registration of sock electrodes was performed in two phases. Phase I consisted of applying a procrustes registration algorithm to rotate, translate, and scale a template sock geometry into an optimized position, with regard to the surface of the cardiac mesh, without imposing shearing or other deformation processes that would skew the sock geometry (Fig. 3b).10 Phase II consisted of morphing resulting Phase I geometries onto the epicardial surface of the cardiac mesh. To pursue each phase, correspondence points were generated using digitization (Phase I) or activation time correspondence (Phase II) approaches.
Phase I registration defined a correspondence between MRI-derived needle entry sites and associated, digitized, sock electrode locations. A rigid procrustes algorithm10 was applied to optimize the positioning of a pre-constructed 3D sock template to our cardiac mesh (Fig. 3b). This approach eliminated the risk of shearing, or other deformations, and provided the relatively 2D set of correspondence points a basis with which to be applied to our 3D sock template. Expectedly, registered Phase I geometries were not tightly aligned to subject-specific epicardial surfaces—generating an average distance between corresponding sock and needle locations of 10.60 ± 2.85 mm and prompting additional registration steps to improve accuracy.
A second registration phase (Phase II) was implemented to morph Phase I sock electrode locations onto the cardiac mesh via a thin-plate-spline morphing algorithm (Fig. 3c). This required a second set of correspondence points that included posterior and lateral locations not available during Phase I registration. These points were determined by comparing activation times associated with sock electrodes with those of nearby needle entry sites. Sock and epicardial needle electrodes were considered corresponding if they (1) existed within the same local neighborhood and (2) activated no more than 3 ms apart—falling within 10% of total epicardial activation. Additional correspondence points were selected along lateral and posterior regions in order to ensure a reasonable 3D fit. Phase II registration approaches generated an average distance of 0.5 ± 0.06 mm between activation-based correspondence point sets, which is to be expected considering the nature of the thin-plate-spline algorithm. To ensure unbiased error comparisons, we also assessed the distances between Phase II sock geometries and digitized, needle entry site locations, which still outperformed Phase I methods with an average error of 6.30 ± 5.59 mm. With sock electrodes tightly registered to the cardiac volume, we mapped the sparsely measured sock potentials onto the much higher density mesh surface using surface Laplacian interpolation.17
Mathematical Modeling
Using a monodomain approach, we generated electric fields within passive, anisotropic, cardiac volume conductors at a single time point (ST40%). This formulation allowed us to compute the effects of the ischemic condition in terms of Laplace’s equation,
| (1) |
where represents the anisotropic extracellular conductivity and φe are the extracellular potentials. A subset of measured φe values were known, having been obtained from needle electrodes, which we applied as boundary conditions—reflecting the underlying sources generated by the ischemic condition. We also imposed a no current flow boundary condition along the epicardium (∂ΩH,epi) while allowing current to flow normal to the endocardium into the blood pool (∂ΩH,endo) where we also maintained continuity of potential, as follows:
| (2) |
The SCIRun problem-solving environment19 was used to assign boundary conditions and to solve Eq. (1) for the unknown extracellular potentials using an iterative conjugate gradient solver with a Jacobi preconditioner.
Validation
Simulation results were validated against measured epicardial potentials by both qualitative and quantitative means. Pearson’s correlation coefficient (PCC), root-mean-square error (RMSE), and maximum absolute error values (AEmax) provided metrics for quantitative comparison. PCC varies from + 1 to – 1 and reflects similarity of surface potential patterns independent of amplitude. RMSE and AEmax capture, respectively, amplitude differences as root-mean-squared and maximum error values, as follows:
| (3) |
where φs and φm represent simulated and measured potential values and SDφs and SDφm are their respective standard deviations. The covariance between φs and φm is represented in terms of expected value, , and their respective means, μφs and μφm.
We evaluated simulation accuracy over the entire epicardial surface and the area directly overlying the needle region. We also categorized ischemic runs as having either elevated or weak ischemic stress based on the level of epicardial ST shifts. Using heuristic methods, we determined that by applying a potential threshold of 3.5 mV to epicardial ST40% potentials we could consistently isolate instances of ischemia that were generally reproducible and that showed a high correlation between simulated and recorded potentials.
RESULTS
Analysis of 226 individual ischemic events, acquired from 2 canine experiments, showed strong agreement between simulated and measured epicardial potentials, particularly during periods of elevated ischemic stress. We present the spread of epicardial potentials in two ischemic events, one from each experimental model, to demonstrate the visual accuracy of our simulation approach and provide the quantitative statistics from all ischemic episodes.
Epicardial Potential Distrubutions
Figures 4 and 5 show simulated and measured epicardial potentials from two animal models in which induced ischemic stress surpassed a 3.5 mV threshold. Experiment 1 utilized limited coronary blood supply and increased heart rate to reflect demand ischemia while Experiment 2 mimicked supply ischemia by maintaining a slightly elevated heart rate under conditions of reduced coronary blood flow. Simulated and measured extracellular potentials from each experiment are displayed side-by-side over both the entire epicardial surface (‘Complete Epicardium’) and the localized region overlying the plunge needles (‘Clipped Needle Hull’).
FIGURE 5.
Assessment of Simulations from Experiment 2. Figure layout is identical to that of Fig. 4. The color map was adjusted to match the more muted ST40% potentials specific to this experiment. Also, due to physical constraints in this experiment, sock electrodes did not entirely cover the ventricles, leading to reduced epicardial coverage in the RV basal region.
Experiment 1 (Fig. 4) exhibited signs of elevated ischemic stress as shown by large elevations near the anteroapical region of the left ventricle (LV). Elevated regions were flanked by depressions on the lateral and inferoapical boundaries. Simulated results also produced elevated potentials along the anteroapical region with ST depression along the lateral boundary. However, the inferoapical ST depressions, seen in the measured maps, were not present in either simulated epicardial maps or intramural analyses (not show).
Experiment 2 (Fig. 5) produced more distributed, albeit muted, epicardial potential patterns to those observed in Experiment 1. Measured ST40% elevations were present in the LV anteroapical region, but instead of two flanking regions of depression across the epicardium, three were observed along the inferoapical, lateral, and right ventricular (RV) septal boundaries. Simulated potentials produced similarly oriented but more blurred LV anteroapical elevations accompanied by lateral and RV septal depressions, though simulations, again, failed to reproduce the inferoapical ST depressions.
General agreement between simulated and measured potentials improved as epicardial potentials approached the 3.5 mV threshold—corresponding to an ischemic response of a more severe nature. Ischemic episodes that did not reach threshold produced responses that were not stable, having amplitudes that only slightly exceeded background noise. Not surprisingly, these simulations failed to capture the resulting subtle fluctuations observed in epicardial potentials that stemmed from ischemia. During episodes of elevated ischemic stress, however, simulated potentials exhibited amplitudes and distribution patterns that were very similar to measured potentials—albeit somewhat blurred or smoothed.
Quantitive Analysis
Quantitative metrics also demonstrated agreement between simulated solutions and experimental measurements, particularly under conditions of elevated ischemic stress. Three metrics provided support for this claim by showing that simulations of elevated ischemic stress generated a moderate to strong Pearson’s correlation (PCC), low root-mean-square errors (RMSE), and reasonable maximum absolute error (AEmax).
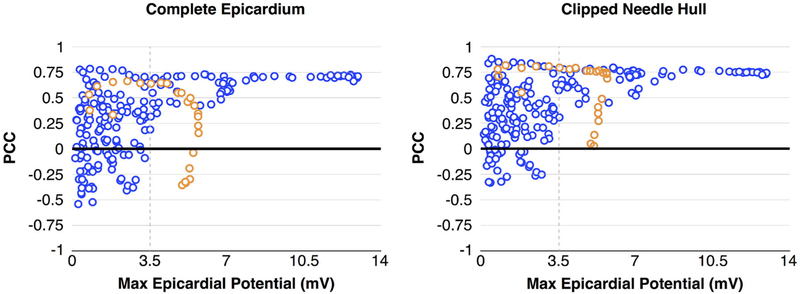
Figure 6 shows the relationship between PCC and the maximum potential values observed on the epicardial surface, considering both the ‘Complete Epicardium’ (left) and the ‘Clipped Needle Hull’ (right). In general, as epicardial potentials increased, so too did PCC values. Ischemic events that produced epicardial potentials that exceeded 3.5 mV generated a pattern of moderate to strong correlation with PCC values ranging from 0.5 to 0.75. Cases of elevated ischemic stress attained moderate to strong correlation in 75% of simulated events across the Complete Epicardium and 93% of events overlying the Clipped Needle Hull. Weaker agreement was observed in cases in which maximum epicardial potentials were below 3.5 mV, with only 19% of the Complete Epicardium and 30% of the Clipped Needle Hull PCC values reaching a moderate level of correlation. However, one ischemic episode (Fig. 6 orange) did not produce events that conformed to this pattern. In this episode, the correlation between needle based sources and epicardial measurements decreased under conditions of elevated ischemic stress. After careful examination, we found that needle electrograms during these particular ischemic events exhibited potential patterns similar to those observed during other episodes of elevated ischemic stress (i.e., large, distributed ST elevations). However, electrograms measured from sock electrodes produced apparently healthy signals—having little or no ST deviation. This phenomenon demonstrates the variable nature of the ischemic response and the challenges associated with this mechanistic situation. Removing this anomalous subset from our analysis improved the correlation percentages to 83 and 94% for complete and needle regions, respectively.
FIGURE 6.
PCC vs. Ischemic Stress. Correlation between ischemic stress, measured as a function of maximum epicardial potential values, show improved PCC with increased ischemic stress. Blue markers make up the majority of individual ischemic events, which exhibited predictable outcomes. Orange markers represent a sequence of related measurements in which prolonged ischemic stress produced elevated but progressively uncorrelated ST40% potentials.
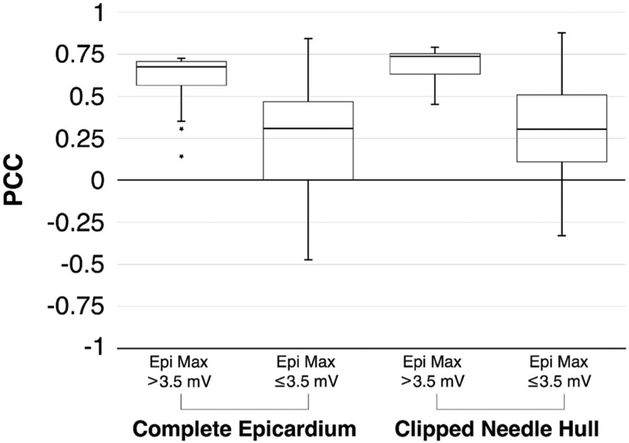
Figure 7 further illustrates the degree to which PCC relies on ischemic stress. In both Complete Epicardium and Clipped Needle Hull regions, higher PCC medians and lower PCC variances were observed when comparing simulations of elevated ischemic stress to those of weak ischemic stress. In both high stress cases, median values indicated a strong correlation. Upper quartile bounds were narrow, reflecting the asymptotic threshold observed in Fig. 6. In cases of weak ischemic stress, PCC values ranged from strongly positive to moderately negative, indicating the uncertainty in simulation outcomes. The separation between the results of elevated and weak stress datasets showed both statistical significance (p = 0.001) and practical significance16 (Hedge’s g = 1.02) based on effect size calculations.
FIGURE 7.
PCC Reliance on Ischemic Stress. Box plots for both coverage regions, Complete Epicardium and Clipped Needle Hull, show that consistently high correlation between measured and simulated solutions is dependent on the level of ischemic stress experienced by the heart as defined by level of maximum epicardial ST40% value.
In addition to increased PCC, elevated ischemic stress led to modest boosts in RMSE and AEmax. Unlike PCC, however, which approached a seemingly asymptotic maximum threshold, RMSE and AEmax values increased monotonically and did not show any specific stress threshold (Fig. 8). RMSE peaked (RMSEmax) at a value of 1.74 mV across the Complete Epicardium and at 2.97 mV across the Clipped Needle Hull region. Notably, Fig. 8 (left) shows that RMSE across the Complete Epicardium increased more slowly than errors recorded across the Clipped Needle Hull. This result is not surprising as regions of the heart that were outside of the area affected by ischemia (e.g., posterior and basal regions) predictably registered healthy ST40% potentials in both simulated and measured cases. These areas were expansive and yielded low error effectively diluting the overall RMSE calculation in comparison to those performed over the Clipped Needle Hull. In contrast, AEmax showed strong agreement between complete and clipped regions as ischemic stress increased (Fig. 8 (right)) suggesting that the largest source of error was found within, or very near to, the Clipped Needle Hull. AEmax peaked for both epicardial and needle hull regions at 7.91 mV and occurred within the basal-most elevation seen in the ‘Anterior View’ of the ‘Measured’ potentials of Fig. 4. Again, this finding is not alarming considering that the epicardial region overlying the Clipped Needle Hull experiences the largest potential changes over the course of an ischemic episode.
FIGURE 8.
Comparison of RMSE and AEmax Error Metrics. Both RMSE (left) and AEmax (right) exhibited monotonically increasing behavior with respect to ischemic stress. Circles, representing the ‘Complete Epicardium,’ vs. those that consider only the ‘Clipped Needle Hull’ (triangle). RMSE measures increased more slowly along the ‘Complete Epicardium’ than they did along the ‘Clipped Needle Hull.’ AE measures, in contrast, increased in unison.
DISCUSSION
The main goal of this study was to establish and validate a computational modeling framework capable of being employed to investigate the effects of myocardial ischemia on measurable cardiac potentials. To offer initial validation of our framework, we chose a subject-specific simulation strategy aimed at predicting epicardial potentials associated with acute myocardial ischemia based on known intramyocardial sources taken from high resolution measurements under induced ischemic conditions. To this end, we built upon our existing simulation pipeline15 to analyze 226 individual events of acute ischemia—each induced using a unique combination of elevated heart rate and reduced coronary blood flow within two canine experiments.3 Using intramurally recorded extracellular potential sources, we generated simulations that qualitatively and quantitatively agreed with measured potentials—exhibiting relatively high correlation values and low error as measured by both RMSE and maximum absolute error. Highly correlated simulations were consistently associated with episodes of ischemic stress that reached, or exceeded, epicardial potential values of 3.5 mV.
The construction of our simulation framework was highly motivated by a combination of observed errors in ECG-based diagnosis of myocardial ischemia,1 and our own experimental observations of ischemic disease, which support the notion of highly distributed, intramural source representations.3 Current clinical protocol dictates that ischemia develops as a single, geometrically well-defined, subendocardial region of injured tissue.7 Our recent experimental findings contradict this paradigm, indicating that intramural potentials, and associated injury currents, are complex and distributed throughout the ventricular wall.3 Experimental findings offer an explanation, at least in part, of the persistently wide deviations associated with ECG-based diagnosis—assuming that such deviations stem from a general lack of understanding regarding the underlying mechanisms of ischemia. To better explore these mechanisms, we have developed a computation infrastructure with which to study ischemic disease. While our approach is not intended to provide a direct improvement to clinical operations, it is important for improving our overall understanding of ischemic sources while simultaneously providing a computational framework for exploring clinical outcomes. Using our own experimental findings, we demonstrate the utility of our computational framework while incorporating the most advanced and realistic set of assumptions about the ischemic heart to date, which include conductive characteristics and accurate, spatially distributed ischemic sources.
Our computational models produced epicardial potentials that matched measured data, both visually and quantitatively, under conditions of elevated ischemic stress. Figures 4 and 5 show two of the multiple cases in which elevated ischemic stress was reached and where agreement between simulated and measured data was achieved. In both of these examples, measured elevated potentials arose in anteroapical regions which were flanked by depressions appearing on the lateral and inferoapical boundaries. In the case of Fig. 5, a third depression appeared along the LV basal region as well. Simulated potentials reproduced most of these features, leading to high correlation values and low RMSE. However, correlation appeared to plateau at a value of approximately 0.75, likely due to the absence of prominent depressions along the inferoapical boundary in simulated cases.
The absence of inferoapical depressions in simulation was likely the result of insufficient needle coverage within the experimental preparation. Evidence of insufficient needle coverage can be seen in the Clipped Needle Hull regions of Figs. 4 and 5 where both simulated and measured cases give no indication of inferoapical depression. Such errors are anticipated, however, as they are a direct consequence of physical and practical constraints inherent within experimental preparations. In our experiments, for example, epicardial sock electrodes were physically constrained to the ventricular surface. Needle electrodes were limited to intramural tissues, and, due to the confined space within our open-chest experimental models, they were further restricted to the anterior, lateral, and anteroapical regions of the heart. In addition to physical constraints, practical considerations further limited the placement of plunge needles in order to: avoid puncturing major coronary blood vessels, ensure complete coverage of the affected perfusion area, mitigate injury within the cardiac tissues, and maximize the capabilities of recording hardware. To account for these anticipated shortcomings, we provided a comparison of both the Clipped Needle Hull and the Complete Epicardium. By analyzing the Clipped Needle Hull, we were able to verify that our simulation pipeline accurately reproduced epicardial potentials over local regions where both sock and needle potentials were known and where ischemia was assumed to produce the most injury. Analysis of the Complete Epicardium, in comparison, provided both a global sense of the overall accuracy while also exposing some of the intrinsic shortcomings present in modeling approaches.
One such shortcoming inherent in subject-specific modeling is registration error. Registration of experimental geometries onto computational models is a persistent source of both qualitative and quantitative error in the simulation process that can often be mitigated but not completely eliminated. Such registration errors are in all subject-specific modeling studies—particularly those involving the heart. For example, potential measurements in our study were recording while the heart was still beating; however, MRI scans used to produce cardiac geometries were taken post-mortem. The potential for error in geometric registration motivated the use of activation-based Phase II registration approaches in an attempt to reduce impact of improper geometric positioning on simulated outcomes. Figure 4 provides another example in which sock electrodes appear to be slightly misaligned due to registration error. Measured electrodes seem to be shifted toward the basal region when compared to simulated potentials. In contrast, Fig. 5 appears to have much better alignment between measured and simulated potentials. Further evidence of alignment error is present in absolute error measures where AEmax consistently arose over the needle hull (Fig. 8 right)—implying that some shift in the location of the data had resulted in the misalignment of potential extrema along the surface. Our simulation framework allowed us to mitigate errors associated with electrode misalignment by allowing the careful selection of correspondence points to use in our registration process—first with digitized sock and needle locations taken at the time of experimentation and later, with activation-based correspondence points extracted from electrogram recordings. By using these registration techniques, we closely approximated sock electrode positions, which resulted in moderate to strong correlation in 75% of all supra-threshold ischemia simulations as shown in Figs. 6 and 7.
Also apparent in Figs. 6 and 7 is the requirement that an ischemic potential threshold of 3.5 mV, corresponding to elevated ischemic stress, be reached along the epicardial surface in order to consistently maximize quantitative correlation between simulated and measured potentials. By this metric, elevated ischemic stress was measured in 82 of the 226 induced ischemic events used in this study. Based on our observations, demand ischemia produced higher levels of ischemic stress more rapidly and more readily than did supply ischemia protocols.3 In total, demand protocols accounted for only 43% of all analyzed runs, but they represented approximately 80% of ischemic events that reached threshold value.
A series of demand ischemia events, however, produced anomalous data and resulted in poor PCC under conditions of elevated ischemic stress (Fig. 6 orange). Needle electrograms recorded during these episodes produced predictable potential elevations and depressions under ischemic conditions while sock electrograms produced signals that were consistent with either healthy or only mildly ischemic tissues. Such incongruity between needle and sock measurements does not have an obvious mechanistic or physiological interpretation. A possible explanation, however, may be a lapse in cardiac moistening protocols during experimental procedures. Inconsistent cardiac moistening, coupled with prolonged exposure to the external environment, leads to partial dehydration of both the heart and the sock, which, in turn, increases the load on the recording circuit and dampens the overall amplitude of epicardial measurements. Indeed, QRS peak amplitudes (not shown) were reduced by as much as 1/3 during anomalous runs. Removing anomalous runs from consideration increased the percentage of highly correlated episodes to 83 and 94% for complete and clipped regions, respectively.
A natural continuation of this research includes improvements to both experimental methods and the simulation pipeline. Revisions to experimental protocols are currently being implemented to improve shortcomings that arise due to limited needle coverage, registration errors, and elevated ischemic stress realization. Such improvements include: (1) high resolution sock electrode labels for improved digitization, (2) epicardial pacing protocols that provide more precise activation times of both sock and needle electrodes, (3) real-time signal monitoring to ensure elevated ischemic stress is achieved, (4) chemical stress protocols to increase cardiac demand and more closely mimic current clinical stress testing, and (5) coronary flow monitoring to better characterize reduced coronary blood supply. Concurrently, simulation approaches are also being developed that (1) simplify intramural ischemic source representations into 3-dimensional zone approximations, (2) consider bidomain modeling approaches, (3) analyze uncertainty associated with conductivity and fiber orientation parameters, and (4) consider other biophysical aspects of ischemia, such as alternative ischemia markers and dynamic electrical models. Through these additional improvements and explorations, we will continue to challenge the paradigm espoused by current clinical practice while providing a computational framework within which future simulation approaches can operate to produce simulated results that are both mathematically tenable and physiologically accurate.
ACKNOWLEDGMENTS
Support for this research was provided by the Nora Eccles Treadwell Foundation and the Richard A. and Nora Eccles Harrison Fund for Cardiovascular Research. Additional support and resources were provided by the NIH/NIGMS Center of Integrative Biomedical Computing (www.sci.utah.edu/cibc) under Grant P41 GM103545-17.
ABBREVIATIONS
- ECG
Electrocardiogram
- EC
Extracellular
- LAD
Left anterior descending coronary artery
- QRSoff
Time point at QRS complex offset
- Tpeak
Time point at T-wave peak
- ST40%
Time point 40% between QRSoff and Tpeak
- FISP
Fast imaging with steady-state precession
- FLASH
Fast low angle shot
- MRI
Magnetic resonance imaging
- DW-MRI
Diffusion weighted magnetic resonance imaging
- PCC
Pearson’s correlation coefficient
- RMSE
Root-mean-square error
- AEmax
Maximum absolute error value
- LV
Left ventricle
- RV
Right ventricle
Footnotes
Associate Editor Elena S. Di Martino oversaw the review of this article.
REFERENCES
- 1.Akkerhuis K and Simoons M. Exercise electrocardiography and exercise testing In: Comprehensive Electrocardiology, Vol. 1, chapter 36, edited by Macfarlane P, van Oosterom A, Pahlm O, Kligfield P, Janse M, and Camm J, 2nd ed. London, England: Springer, 2011, pp. 1677–1719. [Google Scholar]
- 2.Aras K, Burton B, Swenson D, and MacLeod R. Sensitivity of epicardial electrical markers to acute ischemia detection. J. Electrocardiol 47:836–841, 2014. [DOI] [PMC free article] [PubMed] [Google Scholar]
- 3.Aras K, Burton B, Swenson D, and MacLeod R. Spatial organization of acute myocardial ischemia. J. Electrocardiol 49:323–336, 2016. [DOI] [PMC free article] [PubMed] [Google Scholar]
- 4.Arisi G, Macchi E, Corradi C, Lux R, and Taccardi B. Epicardial excitation during ventricular pacing: Relative independence of breakthrough sites from excitation sequence in canine right ventricle. Circ. Res 71:840–849, 1992. [DOI] [PubMed] [Google Scholar]
- 5.Callahan M, Cole M, Shepherd J, Stinstra J, and Johnson C. BioMesh3D: A meshing pipeline for biomedical models SCI Institute Technical Report UUSCI-2007-009, University of Utah, 2007. [Google Scholar]
- 6.CIBC. Seg3D: Volumetric Image Segmentation and Visualization. Scientific Computing and Imaging Institute (SCI). http://www.seg3d.org.
- 7.de Luna AB and Fiol-Sala M. Electrocardiography in Ischemic Heart Disease: Clinical and Imaging Correlations and Prognostic Implications, 4th ed. Singapore: Wiley-Blackwell, 2008. [Google Scholar]
- 8.Eppinger H and Rothberger CJ. Zur analyses des elektrokardiogramms. Wien: Klin. Wochenschr; 22:1091–1098, 1909. [Google Scholar]
- 9.Fozzard H ST-segment mapping is not a clinical tool In: Current Controversies in Cardiovascular Disease, edited by Rapaport E, pp. 281–291, Philadelphia, USA: Saunders; 1980. [Google Scholar]
- 10.Gower J Generalized procrustes analysis. Psychometrika 40:33–51, 1975. [Google Scholar]
- 11.Hearse D Myocardial ischaemia: Can we agree on a definition for the 21st century? Cardiovascular Research 28:1737–1744, 1994. [DOI] [PubMed] [Google Scholar]
- 12.Hopenfeld B, Stinstra J, and MacLeod R. The effect of conductivity on ST-segment epicardial potentials arising from subendocardial ischemia. Ann. Biomed. Eng 33:751–763, 2005. [DOI] [PubMed] [Google Scholar]
- 13.Li D, Li C, Yong A, and Kilpatrick D. Source of electrocardiographic ST changes in subendocardial ischemia. Circ. Res 82:957–970, 1998. [DOI] [PubMed] [Google Scholar]
- 14.Lines G, de Oliveira B, Skavhaug O, and Maleckar M. Simple t-wave metrics may better predict early ischemia as compared to st segment. IEEE Trans. Biomed. Eng 64:1305–1309, 2017. [DOI] [PubMed] [Google Scholar]
- 15.MacLeod R, Stinstra J, and Lew S. Subject-specific, multiscale simulation of electrophysiology: A software pipeline for image-based models and application examples. Philos. Trans. A Math. Phys. Eng. Sci 367:2293–2310, 2009. [DOI] [PMC free article] [PubMed] [Google Scholar]
- 16.Maher J, Markey J, and Ebert-May D. The other half of the story: Effect size analysis in quantitative research. CBE Life Sci Educ 12:345–351, 2013. [DOI] [PMC free article] [PubMed] [Google Scholar]
- 17.Oostendorp T and van Oosterom A. The surface laplacian of the potential: theory and application. IEEE Trans. Biomed. Eng 43:394–405, 1996. [DOI] [PubMed] [Google Scholar]
- 18.Pardee H Electrocardiographic signs of coronary artery obstructions. Arch. Int. Med 26:244, 1920. [Google Scholar]
- 19.Parker S and Johnson C. SCIRun: A scientific programming environment for computational steering. In: Proceedings of the IEEE/ACM SC95 Conference, pp. 52–52, IEEE Press; 1995. [Google Scholar]
- 20.Potse M, Coronel R, Falcao S, LeBlanc A, and Vinet A. The effect of lesion size and tissue remodeling on ST deviation in partial-thickness ischemia. Heart Rhythm. 4:200–206, 2007. [DOI] [PubMed] [Google Scholar]
- 21.Rogers J, Melnick S, and Huang J. Fiberglass needle electrodes for transmural cardiac mapping. IEEE Trans Biomed Eng 49:1639–1641, 2002. [DOI] [PubMed] [Google Scholar]
- 22.Roth B Electrical conductivity values used with the bidomain model of cardiac tissue. J Cardiovasc Electrophysiol 44:326–328, 1997. [DOI] [PubMed] [Google Scholar]
- 23.Smith H, Singh B, Norris R, John M, and Hurley P. Changes in myocardial blood flow and ST segment elevation following coronary artery occlusion in dogs. Circulation Research 36:697–705, 1975. [DOI] [PubMed] [Google Scholar]
- 24.Stinstra J, Hopenfeld B, and MacLeod R. Using models of the passive cardiac conductivity and full heart anisotropic bidomain to study the epicardial potentials in ischemia. Conf Proc IEEE Eng Med Biol Soc 5:3555–3558, 2004. [DOI] [PubMed] [Google Scholar]
- 25.Stinstra J, Hopenfeld B, and MacLeod R. On the passive cardiac conductivity. Ann. Biomed. Eng 33:1743–1751, 2005. [DOI] [PubMed] [Google Scholar]
- 26.Swenson D, Stinstra J, Burton B, Aras K, Healy LJ, and MacLeod RS. Evaluating the effects of border zone approximations with subject specific ischemia models World Congress on Medical Physics and Biomedical Engineering, September 7 – 12, 2009, Munich, Germany: 25/4:1680–1683, 2010. [Google Scholar]
- 27.Tate J, Pilcher T, Aras K, Burton B, and MacLeod R. Verification of a defibrillation simulation using internal electric fields in a human shaped phantom. Comput. Cardiol. Proceedings pp. 689–692, 2014. [PMC free article] [PubMed] [Google Scholar]
- 28.Vadakkumpadan F, Gurev V, Constantino J, Arevalo H, and Trayanova N. Modeling of whole-heart electrophysiology and mechanics: toward patient-specific simulations In: Patient-Specific Modeling of the Cardiovascular System, pp. 145–165, Springer; 2010. [Google Scholar]


