

Abstract
The human genome encodes a variety of poorly understood RNA species that remain challenging to identify using existing genomic tools. We developed chromatin run-on and sequencing (ChRO-seq) to map the location of RNA polymerase using virtually any input sample, including samples with degraded RNA that are intractable to RNA-seq. We used ChRO-seq to map nascent transcription in primary human glioblastoma (GBM) brain tumors. Whereas enhancers discovered in primary GBMs resemble open chromatin in the normal human brain, rare enhancers activated in malignant tissue drive regulatory programs similar to the developing nervous system. We identified enhancers that regulate genes characteristic of each known GBM subtype, identified transcription factors that drive them, and discovered a core group of transcription factors that control the expression of genes associated with clinical outcomes. This study reveals the transcriptional basis of GBM and introduces ChRO-seq to map regulatory programs contributing to complex diseases.
Introduction
Our genomes encode a wealth of functional elements that play critical roles in the molecular basis of disease. RNAs serve as a marker for a surprisingly diverse group of functional elements, revealing the expression level of protein coding genes (mRNAs), as well as the location of enhancers and other non-coding regulatory elements which transcribe short and rapidly degraded non-coding RNAs (ncRNA)1–5. However, the discovery of ncRNA species, especially of enhancer-templated RNAs (eRNAs) characteristic of distal regulatory elements2,5, has proven challenging. Most ncRNAs are not represented in RNA-seq data, owing to the rapid degradation rates of most ncRNAs by the nuclear exosome complex6,7. Chromatin immunoprecipitation and sequencing (ChIP-seq) for RNA polymerase II is of limited value because it has a poor signal-to-noise ratio which obscures less abundant RNA species8. Likewise, assays that measure nuclease accessibility, such as DNase-I-seq9 and ATAC-seq10, are poor sources of information about transcriptional activity because they identify open chromatin regions irrespective of activity, and do not measure critical sources of information about mRNAs such as gene expression levels or transcript boundaries.
Recent studies have shown that sequencing nascent RNAs attached to an actively transcribing RNA polymerase complex is an effective strategy for discovering coding and ncRNAs11–18. Nascent RNA-seq techniques, such as Precision Run-On and Sequencing (PRO-seq)13, provide significantly higher sensitivity in detecting short-lived ncRNAs. Thus, PRO-seq and related assays provide a rich source of information about multiple layers of regulatory control, enabling simultaneous measurements of transcription at protein-coding genes and the discovery of active regulatory elements, including enhancers19–21.
Cancers are a particularly attractive target for nascent RNA sequencing techniques because cancer is a disease of gene regulation22. In most cancers, somatic changes to DNA sequence affect oncogenic or tumor suppressive pathways23,24. In some cases somatic mutations affect the core transcriptional machinery directly25, motivating the use of assays that directly measure the localization of Pol II. Somatic mutations initiate secondary changes in gene expression that are responsible for initiating changes in cell morphology and behavior that are characteristic of malignancy. For this reason, gene expression signatures from RNA-seq and other assays have proven effective as biomarkers, denoting cancer subtypes that are associated with progression and survival. However, which genes undergo regulatory changes in cancer, and especially the identity of key transcription factors that encode the malignant behaviors of cancer cells by their effect on target genes, remain poorly defined.
Nascent RNA sequencing techniques remain challenging to apply in some cell lines and especially to intact clinical isolates derived from cancer patients. Here we introduce a new chromatin-based run-on protocol, called Chromatin Run-On and Sequencing (ChRO-seq). ChRO-seq produces similar maps of transcription to PRO-seq in cell lines, but can also be applied to solid tissue samples, even those in which RNA is highly degraded. We used ChRO-seq to analyze 24 human glioblastoma multiforme (GBM) brain tumors, patient derived xenografts (PDXs), and a primary non-malignant brain sample, revealing new insights into the molecular etiology of GBM.
Results
Run-on assays in solid tissue
We developed Chromatin Run-On and sequencing (ChRO-seq), a new method to map RNA polymerase in cell or tissue samples (Fig. 1a). The primary challenge faced when using PRO-seq is often obtaining nuclei that are suitable for a run-on reaction. We therefore developed an alternative method which relies on fractionating insoluble chromatin, including engaged RNA polymerase II (Pol II)27 (see Online Methods). Insoluble chromatin was re-suspended by sonication and used as input to a run-on reaction (Fig. 1a). The run-on was designed to incorporate a biotinylated nucleotide triphosphate (NTP) substrate into the existing nascent RNA that provides a high-affinity tag used to enrich nascent transcripts. The biotin group prevents the RNA polymerase from elongating after being incorporated into the 3’ end of the nascent RNA when performed in the absence of normal NTPs, thus enabling up to single-nucleotide resolution for the polymerase active site13,28.
Fig. 1. ChRO-seq and leChRO-seq measure primary transcription in isolated chromatin.
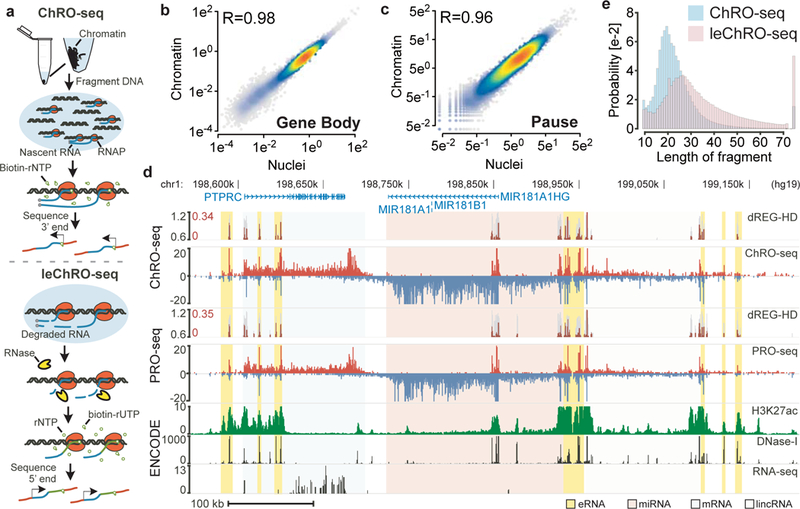
(a) Isolated chromatin is resuspended into solution, incubated with biotinylated rNTPs, purified by streptavidin beads, and sequenced from the 3’ end. leChRO-seq degrades existing RNA, extends nascent transcripts an average of 100 bp, and sequences RNAs from the 5’ end. (b and c) Comparison between matched ChRO-seq and PRO-seq in 41,478 RefSeq annotated gene bodies (b) or at the peak of paused Pol II (c). (d) Comparison between ChRO-seq (top three tracks), PRO-seq (center), and H3K27ac ChIP-seq, DNase-I-seq, and RNA-seq (bottom). dREG-HD shows the raw signal for dREG (gray) and dREG-HD signal (dark red). The shaded background shows the type of RNA produced at each position (e) The distribution of read lengths from ChRO-seq (blue) and leChRO-seq (pink) in a 30 year old primary GBM.
We performed matched ChRO-seq and PRO-seq experiments in the human Jurkat T-cell leukemia line, in which both nuclei and chromatin could be obtained. Median ChRO-seq signal across annotated genes was within the range of variation observed in PRO-seq data from the same cell line (Supplementary Fig. 1). In contrast, we noted differences in the pause peak and transcription past the polyadenylation site compared with mNET-seq and Nascent-seq, two other chromatin-based RNA sequencing assays14,29,30 (Supplementary Note 1). ChRO-seq and PRO-seq produced highly correlated levels of RNA polymerase in the bodies of mRNA encoding genes (R= 0.98; Fig. 1b). Likewise, signal for paused Pol II was highly correlated across the 5’ ends of annotated genes (R= 0.96; Fig. 1c), and pause levels in our test ChRO-seq library were within the range of variation observed using nuclei (Supplementary Fig. 2). The microRNA MIR181 locus illustrates the advantages of ChRO-seq compared with other molecular assays (Fig. 1d). Notably, both ChRO-seq and PRO-seq discovered the primary transcript encoding MIR181 as well as dozens of eRNAs that were not discovered using RNA-seq.
Because RNA prepared from archival tissues is often highly degraded, such samples are poor candidates for genome-wide transcriptome analysis using RNA-seq. The RNA polymerase-DNA complex is more stable than RNA31, suggesting that engaged polymerases may provide an avenue for producing new RNAs in archived samples. We obtained a primary glioblastoma multiforme (GBM) (grade IV, ID# GBM-88–04) that was stored in a tissue bank for 30 years. Bioanalyzer analysis confirmed that RNA was highly degraded in this sample (RIN = 1.0, Supplementary Fig. 3), thus precluding the application of RNA-seq (requires RIN of 2–4). To measure gene expression in this sample, we devised length extension ChRO-seq (leChRO-seq), a variant of ChRO-seq that uses transcriptionally-engaged Pol II and a mix of biotinylated-NTP and normal NTPs to extend degraded nascent RNA transcripts (Fig. 1a). Whereas libraries prepared without an extended run-on had a median insert size of 20 bp, precisely the length of RNA protected from degradation by the polymerase exit channel32, run-on samples achieved a longer RNA length distribution that was better suited for mapping unique reads within the human genome (Fig. 1e). Although RNA degradation could, in principal, destabilize RNA polymerase, we nevertheless observed that leChRO-seq produced maps of transcription that were correlated with those obtained using ChRO-seq and PRO-seq, suggesting that leChRO-seq accurately measures gene expression and pausing (Supplementary Fig. 1a, 2, 4a). Thus, leChRO-seq allows the robust interrogation of archival tissue samples which cannot be analyzed using standard genomic tools.
Maps of transcription in primary GBMs
To demonstrate how ChRO-seq can provide insights into complex disease, we obtained ChRO-seq or leChRO-seq data from 20 primary glioblastomas, three patient derived xenografts (PDX), and a non-malignant brain (Fig. 2a; Supplementary Table 1). Histopathology revealed hallmarks of grade IV malignant astrocytoma in all GBMs (e.g., GBM-15–90, Supplementary Fig. 5). We sequenced ChRO-seq data from each GBM to an average depth of 33 million uniquely mapped reads per sample (10–150M reads/ sample). We confirmed that data collected from biopsies isolated from nearby regions (technical replicates) were highly correlated (Supplementary Fig. 4c-f, Supplementary Note 2).
Fig. 2. ChRO-seq detects transcription in primary human glioblastomas.
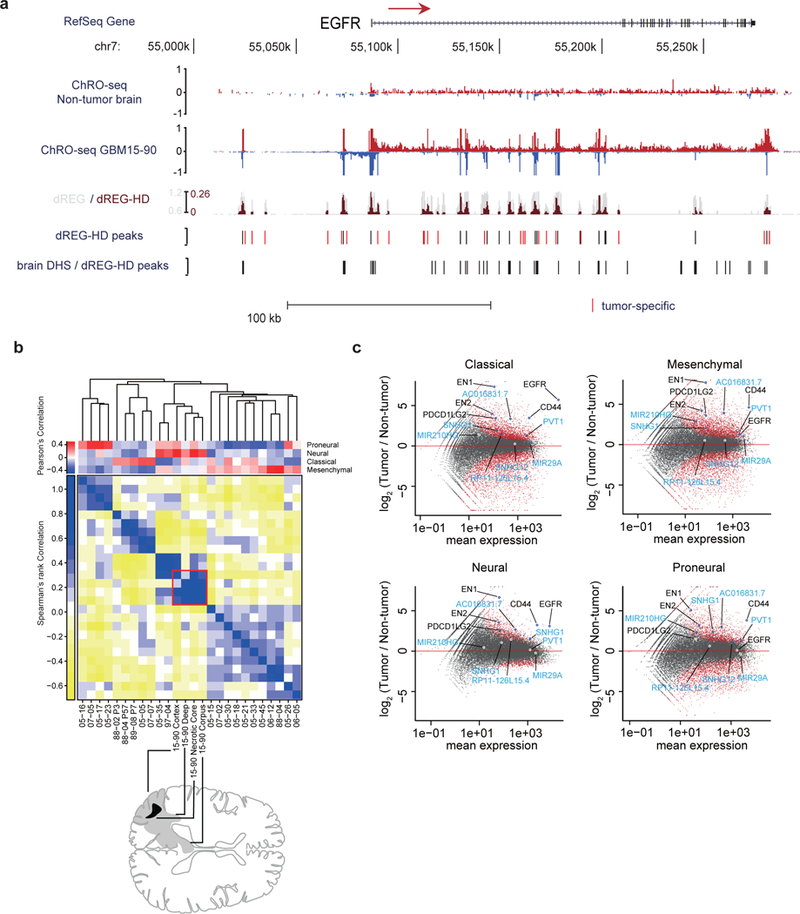
(a) RPM normalized ChRO-seq signal at the EGFR locus in nonmalignant brain (top) and GBM-15–90 (center). dREG (gray) and dREG-HD (dark red) signals are shown for GBM-15–90. dREG-HD peaks that are not DHSs in adult brain reference samples are highlighted in red. DHSs in 6 adult brain reference samples and dREG-HD peaks from the non-malignant brain sample. (b) Upper matrix: subtype scores for each patient, calculated by Pearson’s correlation with the centroid of gene expression of corresponding subtype. Lower matrix: Spearman’s rank correlation over subtype signature genes among 20 primary GBMs. Red square denotes four regions dissected from GBM-15–90. Sample order is based on single-link hierarchical clustering of the lower matrix, shown by the dendrogram. In total, 838 genes were used for calculating the correlation coefficients. (c) Differential gene transcription of primary GBMs in each subtype compared with non-malignant brain. Genes of interest are highlighted. lncRNAs are highlighted in blue.
To gain further insight into how transcription changes in malignant tissue, we analyzed transcription within annotated protein-coding genes and non-coding RNAs. GBMs from our cohort represent each of the four previously reported molecular subtypes26 (Fig. 2b, Supplementary Fig. 6). Though most tumors have transcription patterns characteristic of one dominant molecular subtype, several tumors in our cohort were similar to multiple subtypes, especially those matching neural and mesenchymal signatures, consistent with reports of cellular heterogeneity within the same tumor34,35 (Fig. 2b). We identified 2,381 protein-coding genes and 1,123 ncRNAs that were differentially transcribed across all 20 primary GBMs relative to replicates of the non-malignant brain (p < 0.05, False discovery rate [FDR] corrected Wald test, DESeq236) (Supplementary Table 2). Differentially transcribed genes had notable enrichments in biological processes related to cell cycle, DNA replication / metabolic processes, development (up-regulated in the tumor), and nervous system homeostasis (down-regulated) (Supplementary Fig. 7). For example, multiple transcription factors with a role specifying nervous system development were expressed more highly in nearly all tumors, including the HOX gene clusters and engrailed-1 and 2 (EN1 and EN2) (Fig. 2c; Supplementary Fig. 8). Notably, we discovered several differentially transcribed long non-coding RNAs (lncRNAs) that confer growth advantages to U87 glioblastoma cells37–40 (e.g., AC016831.7, PVT1, SNHG1, etc. Fig. 2c; Supplementary Table 3). Taken together, our analysis of ChRO-seq data identified transcriptional changes in both genes and lincRNAs that were shared between GBMs in our cohort.
GBM enhancers retain signatures of normal brain tissue
Active transcriptional regulatory elements (TREs), including promoters and enhancers, have a characteristic pattern of RNA polymerase initiation that allows their discovery using ChRO-seq data2,5,17,19–21. We developed a novel algorithm to identify the precise location of active TREs, called dREG-HD, which takes PRO-seq or ChRO-seq data as input and identifies TREs that are similar to the subset of DNase-I hypersensitive sites (DHSs) that exhibit local transcription initiation. The dREG-HD algorithm improved the resolution of dREG19 by imputing smoothed DNase-I-seq signal intensity, and identified sites initiating transcriptional activity with 80% sensitivity at >90% specificity (Supplementary Fig. 9). dREG-HD recovered the nucleosome depleted region in histone modification ChIP-seq and MNase-seq data (Supplementary Fig. 10), demonstrating that it had substantially higher resolution compared with dREG alone.
The vast majority (96%) of TREs identified by dREG-HD in each primary GBM sample were DHSs in at least one of the 216 reference tissues analyzed by ENCODE or Epigenome Roadmap41,42. However, most DHSs were discovered in only a few of the tissues in the reference dataset (Fig. 3a) and were distal (>1 kb) to annotated transcription start sites (Fig. 3b), suggesting that many reflect the activity of cell-type specific distal enhancers in the tumor. Rare distal TREs (henceforth referred to as “enhancers”) provide a unique “fingerprint” for quantitatively evaluating the similarity between two samples, and could be used to define the relationship between tumors and normal tissue.
Fig. 3. Comparison between TREs in primary GBM / PDX and reference DHSs.
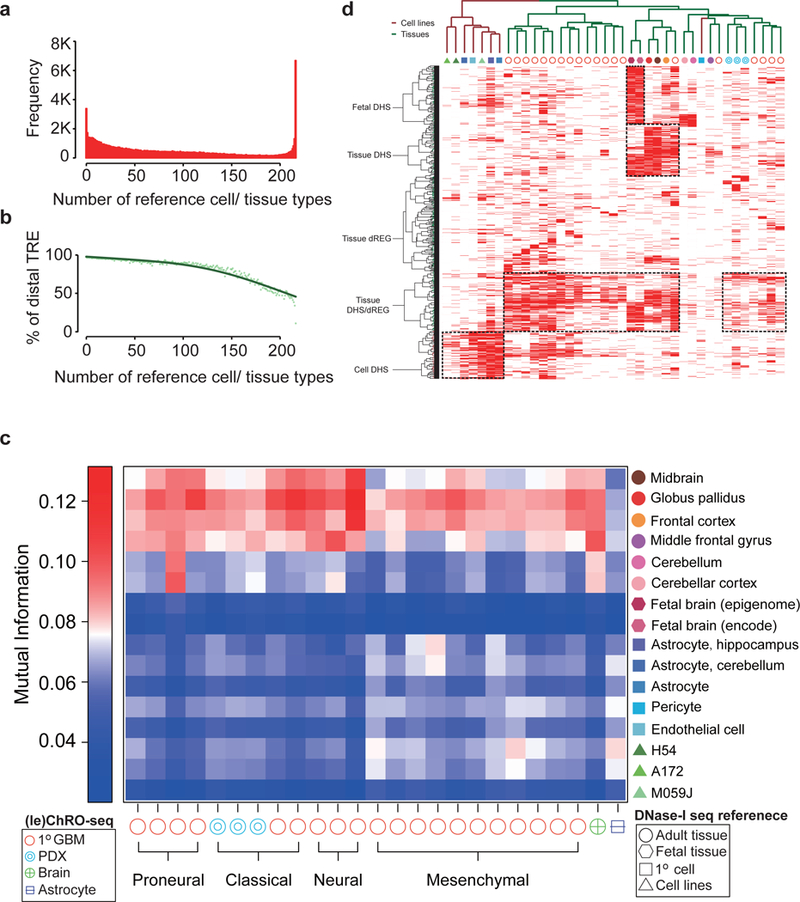
(a) Histogram representing the number of reference samples that have a DHS overlapping each dREG-HD site found in any of the 23 primary GBM / PDX samples. (b) Percentage of TREs >1kb from the nearest GENCODE transcription start site. (c) Mutual information between TREs in the indicated GBM and reference sample. (d) Clustering of reference samples with primary GBM / PDX based on the activation of TREs. Activate TREs are marked in red; inactive ones are in white.
We developed a strategy that compares active enhancer landscapes obtained using dREG-HD with DHSs across all public datasets (see Online Methods). Our strategy consistently discovered the expected cell lines (Supplementary Fig. 11), even identifying the expected genotype (GM12878) among all lymphoblastoid cell lines as the most similar to GM12878 PRO-seq data (Supplementary Fig. 11a). Using unique enhancers to “fingerprint” primary GBM samples revealed enhancer landscapes that were highly similar to normal brain reference samples compared to other reference tissues (Fig. 3c, Supplementary Fig. 12). In GBM-15–90, for instance, 86% of TREs were shared with primary brain tissue, which was greater similarity than observed in either GBM cell lines (62% TRE identity) or in vitro cultured primary brain cells (75%) (Supplementary Fig. 13). Clustering TREs in several brain related cell types suggested that differences between primary tumors and GBM cell lines were caused by differences in the tumor microenvironment (Fig. 3D; Supplementary Fig. 14; Supplementary Note 3).
To evaluate whether contamination of the GBM with normal brain tissue explained the extensive similarity with normal brain reference samples, we used leChRO-seq data from three PDXs, in which primary GBMs were grown in a murine host. In PDXs, murine cells replace both normal tissue and stroma43, and can be distinguished from tumor cells based on species-specific differences in DNA sequence. Mutual information ranked all PDX samples as similar to the normal human brain compared with all other samples (Fig. 3c). Thus we conclude that primary GBM cells are more similar to their cell of origin than may have been anticipated based on prior analysis of cell models.
TREs define three distinct regulatory programs activated in GBM tissue
TREs that were active in tumor tissue, but were not DHSs in any of the available adult brain reference samples, are strong candidates for contributing to the malignant phenotype of the tumor. Such tumor-associated TREs (taTREs) comprised 2–24% of TREs in each tumor (Supplementary Fig. 15, 16, Supplementary Table 4). We developed a statistical test to identify tissues which shared unexpectedly high overlap with taTREs identified in each tumor that controls for DHS scarcity (Supplementary Table 4) (see Online Methods). Hierarchical clustering of the taTREs among significant cell types revealed three regulatory programs that were enriched in the primary GBMs; one resembling a stem-like regulatory program, one associated with differentiated support cells, and a cluster of immune cells (Fig. 4a, Supplementary Fig. 17). taTREs significantly (p < 1e-4, bootstrap test) overlapped DHSs in fetal tissues of the nervous system (2.3–6.6-fold enrichment in 11/ 23 GBMs), especially spinal cord and brain, two fetal tissues derived from the neuroectoderm (Fig. 4a, see “Outlier tissues”). We also found evidence for enrichment in additional developmental tissues, for example embryonic stem cells and other fetal tissues from a variety of germ layers, and for a number of terminally differentiated support cell lineages including astrocytes, endothelial cells, fibroblasts, and osteoblasts. Regulatory programs were partially correlated with previously defined molecular subtypes in GBM (Fig. 4c; Supplementary Note 4). We emphasize that activation of these separate transcriptional regulatory programs may reflect gene expression changes in subsets of cells within the tumor. Overlap between taTREs and fetal brain tissue likely reflects the activation of a regulatory program that promotes stem-like properties observed in a population of GBM cells44. Similarly, overlap with astrocytes, endothelial cells, fibroblasts, or osteoblasts may capture tumor cells that have trans-differentiated into these lineages45,46. Notably, these two signatures were detected in PDX samples as well as primary GBMs, demonstrating that these signatures reflect transcriptional diversity in malignant cells.
Fig. 4. Tumor associated TREs (taTREs) activate three regulatory programs.
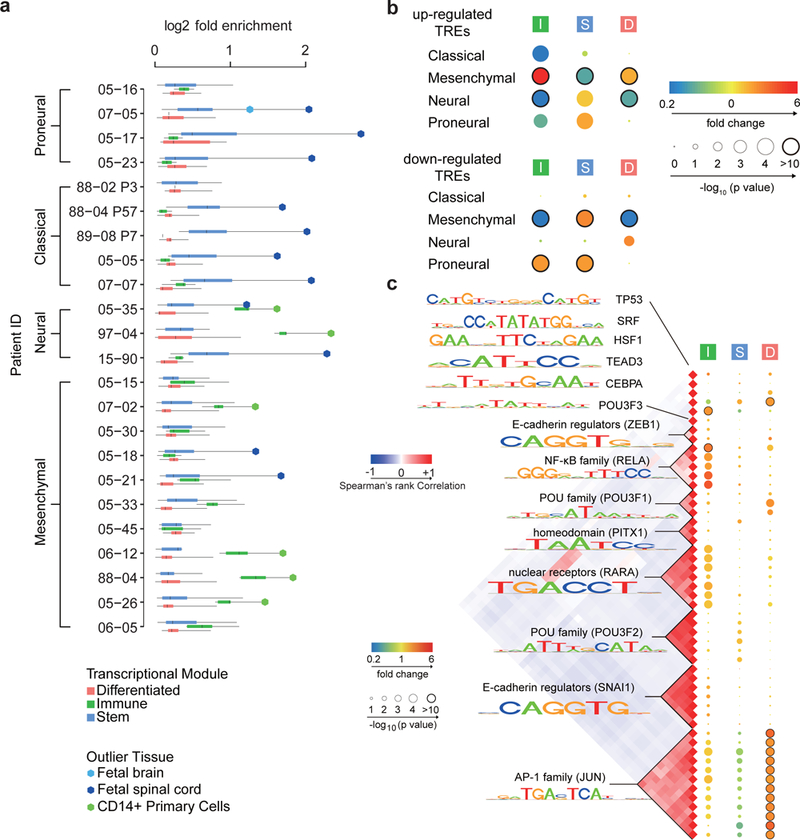
(a) Boxplots show the log2 fold enrichment of reference tissues enriched in the corresponding GBM. Reference samples enriched in each patient were grouped into three regulatory programs, called stem (blue, n= 24), immune (green, n= 5), and differentiated (pink, n= 21). Box plots show the 25th percentile (bottom of box), median (central bar), and 75th percentile (top of box). Whiskers represent minimum and maximum values. Outlier tissues are indicated in the legend. (b) The radius of the circle represents the p value (two-sided Fisher’s exact test) of enrichment of the indicated regulatory programs in subtype-biased TREs. The color represents the magnitude of enrichment (red) or depletion (blue). Number of subtype-biased TREs in each comparison (panels b and c) is shown in Supplementary Table 3 and 4. (c) Transcription factor binding motifs enriched in TREs of the immune (I), stem (S), and differentiated (D) regulatory program compared with TREs active in the normal brain. All motifs shown were significantly enriched following Bonferroni adjustment of the threshold p value in at least one patient (p < 0.05 / 1882, two-sided Fisher’s exact test). The Spearman’s rank correlation heatmap (left) shows the correlation in DNA binding sites matching each motif. The radius of the circle represents the median p value across patients is and the color represents the magnitude of enrichment (red) or depletion (blue).
To identify transcription factors involved in maintaining each regulatory program, we classified the taTREs in each tumor sample into regulatory programs based on their cell type overlap, and searched for enriched transcription factor binding motifs (p < 0.05 / 1882 in at least one patient, Fisher’s exact test, Rtfbsdb47). As we were limited in our ability to distinguish between paralogous transcription factors that share similar DNA binding specificities, we clustered motifs into 14 distinct groups, each associated with multiple transcription factors that may contribute to differences in expression (Fig. 4b). Many of these motifs showed mutually exclusive enrichment in the three regulatory programs (Fig. 4b; Supplementary Fig. 18), supporting the hypothesis that each regulatory program is a transcriptionally distinct program mediated by a different group of transcription factors. We identified POU domain containing transcription factors enriched in taTREs in the stem-like regulatory program. As predicted, taTREs in the stem-like program were enriched in both ChIP-seq reads and peak calls for POU3F2 in cultured glioma neurospheres44 (Supplementary Fig. 19,20). The differentiated support cell program was highly enriched for binding of activating protein 1 (AP-1), a heterodimer of the transcription factors FOS and JUN, a motif resembling heat shock factor 1 (HSF1), and the TEAD family (Fig. 4b). The immune program was enriched for C/EBP family (C/EBPA), NF-κB family (RELA), and the Retinoic Acid Receptor family (RARA), in agreement with reports that at least two of these factors play an important role in inflammatory responses in GBM48,49. Taken together, we have identified taTREs that correlate with complex behaviors intrinsic to malignant cells, for instance the stem-like regulatory program that was shared with neuroectodermal tissue, and identified candidate transcription factors that contribute to each behavior.
Transcription factors controlling GBM subtype
Transcriptional heterogeneity among GBMs is established in large part by the differential activity of transcription factors. To identify transcription factors that are involved, we focused on TREs with evidence of expression changes among the four previously described molecular subtypes (p < 0.01, FDR corrected Wald test, DESeq2) (Supplementary Table 5). We identified 38 binding motif clusters with extremely strong evidence of enrichment in active TREs with biased transcription in any subtype (p < 0.05 / 1882, Fisher’s exact test, Fig. 5a). Significantly enriched motifs passing our stringent multiple testing correction threshold were most common in the mesenchymal and neural subtypes, in which several had previous support in the literature, including those recognized by nuclear factor-κB (NF-κB) family and CCAAT/Enhancer Binding Protein (C/EBP) family enriched in TREs up-regulated in mesenchymal tumors48,49. Additionally, we identified numerous novel motif associations that correlate with subtype-biased expression including, for instance, RARA, SRF, SOX-family, and FOX-family.
Fig. 5. Transcription factors influencing transcriptional heterogeneity in GBM.
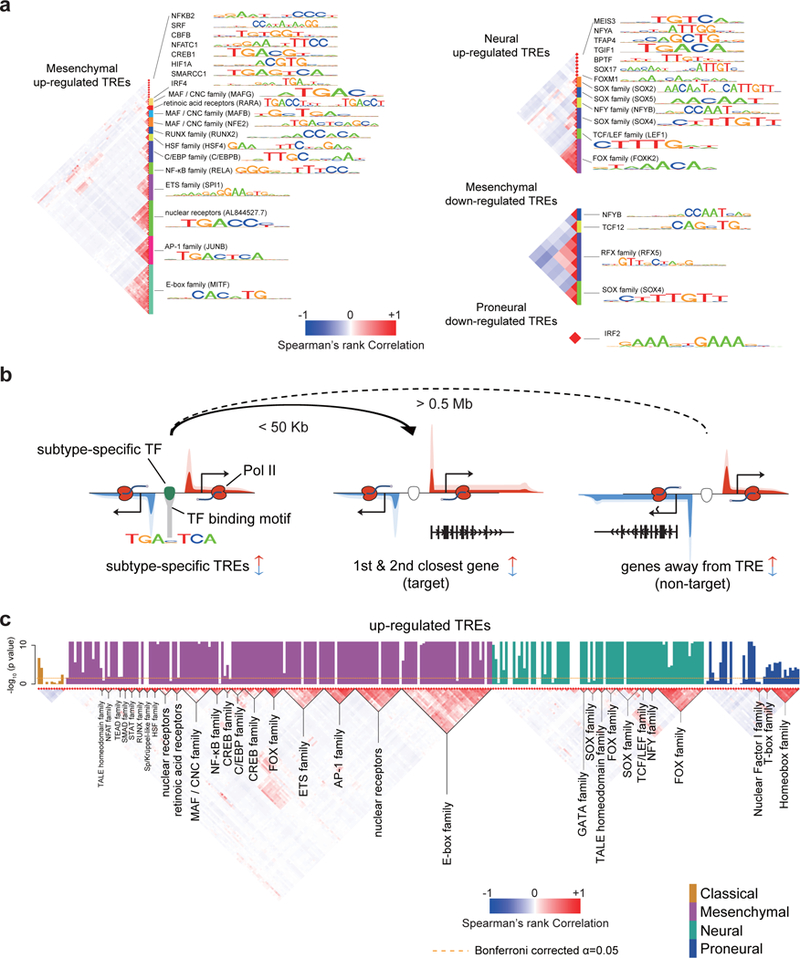
(a) Transcription factor binding motifs enriched in TREs that were up- or down-regulated in the indicated subtype. All motifs shown were significantly enriched following Bonferroni adjustment of the threshold p value (p < 0.05 / 1882, two-sided Fisher’s exact test; sample size shown in Supplementary Table 4). The Spearman’s rank correlation heatmap (left) shows the correlation in motif recognition. Families of transcription factors and their representative motifs are highlighted. (b) Cartoon illustrating heuristics used to identify target genes of subtype-specific transcription factor and for defining non-target (control) genes. Changes in transcription of both target and non-target genes are of the same direction as that of subtype-biased TREs. Target genes are the 1st and 2nd genes within 50 Kb of the TRE. Non-target genes are at least 0.5 Mb away. (c) Barplots show the -log10 Wilcoxon rank sum p value of having higher correlations among target genes of each transcription factor binding motif than a control set (columns; N=174 TCGA patients with RNA-seq data available). Barplots are colored by subtype in which they were found to be enriched (p < 0.05, two-sided Fisher’s exact test). The Spearman’s rank correlation between the binding sites of each motif is shown (bottom). Transcription factor families are indicated below the plot. The dotted line shows the Bonferroni adjusted threshold for the between-target validation experiment.
Next we set out to identify target genes regulated by each transcription factor in GBM cells. First, we assume that molecular subtypes described in current literature do not completely describe the full range of heterogeneity among GBMs. To identify motifs contributing to heterogeneity that are only weakly correlated with the known molecular subtypes, we relaxed our statistical cutoff to a more permissive threshold at which we expected substantially higher sensitivity at an acceptable false discovery rate (p < 0.05, nominal Fisher’s exact test, Supplementary Fig. 21, see Online Methods). We identified bound occurrences of each enriched motif using heuristics that provide substantial performance improvements over existing high-resolution tools50. Motif occurrences were connected with the closest two annotated genes sharing similar subtype-bias within 50 kb (Fig. 5b), using fairly stringent heuristics to limit false discovery rates (see Online Methods). We validated target genes by confirming that genes sharing a common transcription factor were more highly correlated across 174 primary GBMs24 than expected based on randomly selected genes sharing the same subtype specificity (Fig. 5c; Supplementary Note 5). Thus we have identified transcription factors contributing to major GBM expression subtypes and their putative target genes.
Direct inference of transcription factor regulatory activities in GBMs
The gene-regulatory “trans” activities that a transcription factor has on its complement of bound TREs can be regulated by multiple transcriptional and post-transcriptional mechanisms. While some transcription factors are controlled predominantly by the abundance of its protein, many require a subsequent step such as post-transcriptional activation of the protein product to regulate target genes (Fig. 6a). We asked whether we could distinguish between these two broad regulatory activities by using ChRO-seq, and using an integrative analysis incorporating both ChRO-seq and publicly available mRNA-seq data.
Fig. 6. Regulatory activities of transcription factors are controlled by transcription and post-transcriptional mechanisms in GBM.
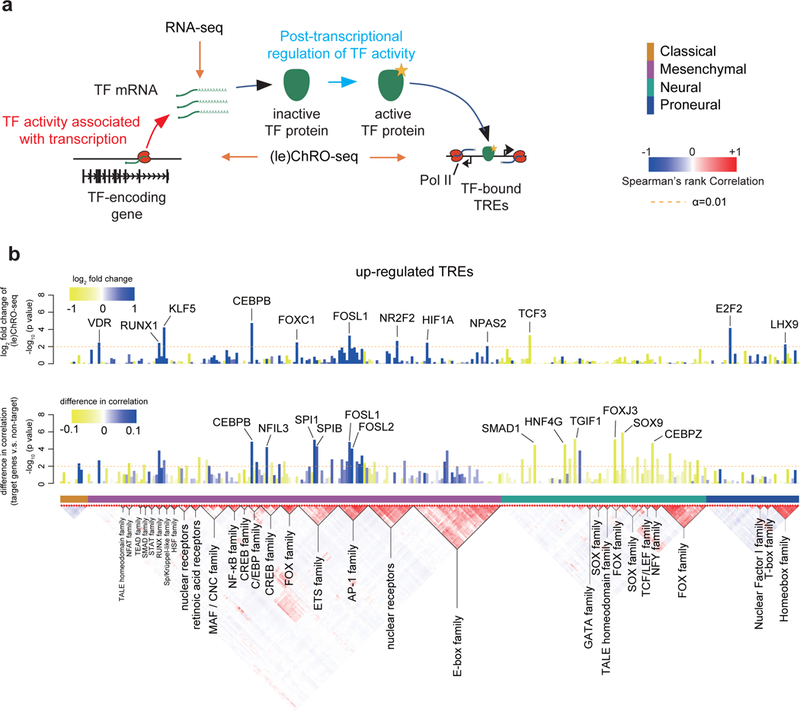
(a) The cartoon illustrates the stages at which transcription factor activities can be regulated and the corresponding signals detected by RNA-seq and (le)ChRO-seq. The activity of some transcription factors correlates predominantly with the abundance of its protein. Many transcription factors require post-transcriptional activation of the protein product before regulating target genes. (b) Barplot shows the FDR corrected -log10 p value (DESeq2, Wald test, n= 2 [classical] or 3 [other subtypes]) representing changes in Pol II abundance detected by (le)ChRO-seq on the gene encoding the indicated transcription factor. The level of upregulation (blue) and downregulation (yellow) in the subtype indicated by the colored boxes (below the barplot) is shown by the color scale. The dashed line shows the the FDR corrected α at 0.01. (c) Barplot shows the -log10 two-sided Wilcoxon rank sum test p value denoting differences in the distribution of correlations between the mRNA encoding the indicated transcription factor and either target or non-target control genes. The blue/ yellow color scale represents the median difference in correlation between target and non-target genes over 174 mRNA-seq samples. The dashed line shows the uncorrected α at 0.01.
In the simplest mode of regulation, the gene-regulatory activity of a transcription factor is determined by the abundance of its protein, which can be correlated with the transcriptional activity of its gene and the abundance of its mRNA. To detect this type of regulatory activity, we asked whether motifs enriched in active TREs of each subtype correspond to changes in Pol II density on the primary transcription unit encoding any one of the transcription factors that recognize the corresponding binding motif. In some cases, we observed transcriptional changes in the transcription factor coding gene in the same subtype in which we also observed motif enrichment (Fig. 6b-c; Supplementary Fig. 24b). For instance, ChRO-seq signal in the gene body encoding the transcriptional activator CEBPB increased by 4.88-fold in mesenchymal tumors (Fig. 6b), consistent with a 2.43-fold enrichment of its corresponding motif in mesenchymal upregulated TREs (Fig. 5a). Likewise, we found several cases in which mRNA encoding each transcription factor was correlated with the expression of its putative target genes across GBMs to a greater extent than expected based on a null model that controls for molecular subtype (Fig. 6c; see Online Methods).
We devised a strategy to estimate which transcription factors have gene-regulatory activities that were regulated by transcriptional or post-translational mechanisms. Focusing on the 25 unique motifs enriched in up-regulated TREs that are associated with multiple transcription factors, we found evidence of correlated changes in ChRO-seq data for eight and in mRNA-seq for 16 (Fig. 6b-c). Several of these correlations were weak in magnitude, which may be consistent with gene-regulatory activities controlled by multiple regulatory mechanisms for these transcription factors. We conservatively identified at least six transcription factors, including TEAD, GATA, HSF, and NF-kB, which had low correlations with their putative targets in RNA-seq and no evidence of transcriptional changes in ChRO-seq. These transcription factors were regulated primarily at a post-transcriptional level in GBM.
Transcription factors control groups of survival-associated genes in mesenchymal GBMs
Known molecular subtypes of GBM do not correlate with survival26, presenting a motivation to identify new classifiers that may have prognostic value. We hypothesized that the activity of transcription factors which control transcriptional heterogeneity among GBM patients may control biological functions correlated with survival. To determine whether gene-regulatory activities of transcription factors may be useful in predicting clinical outcomes, we compared the hazards ratio at putative target genes of each subtype specific binding motif. We analyzed two sets of non-target control genes: 1) The nearest annotated transcription start site (within 50 kb) of each subtype-specific TRE that was not changed in that subtype, and 2) Differentially transcribed genes in the same subtype that were not identified as targets, because the transcription start site was >0.5Mb away from the nearest putative binding site. Our analysis identified six transcription factors significantly associated with poor clinical outcomes, all in mesenchymal tumors (p < 0.05 / 432, Wilcoxon, Fig. 7a, Supplementary Fig. 25), which we clustered into three unique DNA binding specificities (RAR, C/EBP family, and RELA [NF-κB] Supplementary Fig. 26). Only one of these transcription factors, C/EBP, was associated with survival at the mRNA level (Supplementary Fig. 27), consistent with the gene-regulatory activity of C/EBP family correlating with the abundance of its mRNA (Fig. 6b). RELA activity was correlated to radioresistance in GBMs, and in this case its activity was shown to be regulated post-transcriptionally by monitoring the phosphorylated state of the RELA protein48, providing an additional source of support for a second of the transcription factors identified here associated with clinical outcomes. In addition, we also identified RAR, which to our knowledge has not been linked to survival in GBM.
Fig. 7. Transcription factors control survival associated pathways in GBM.
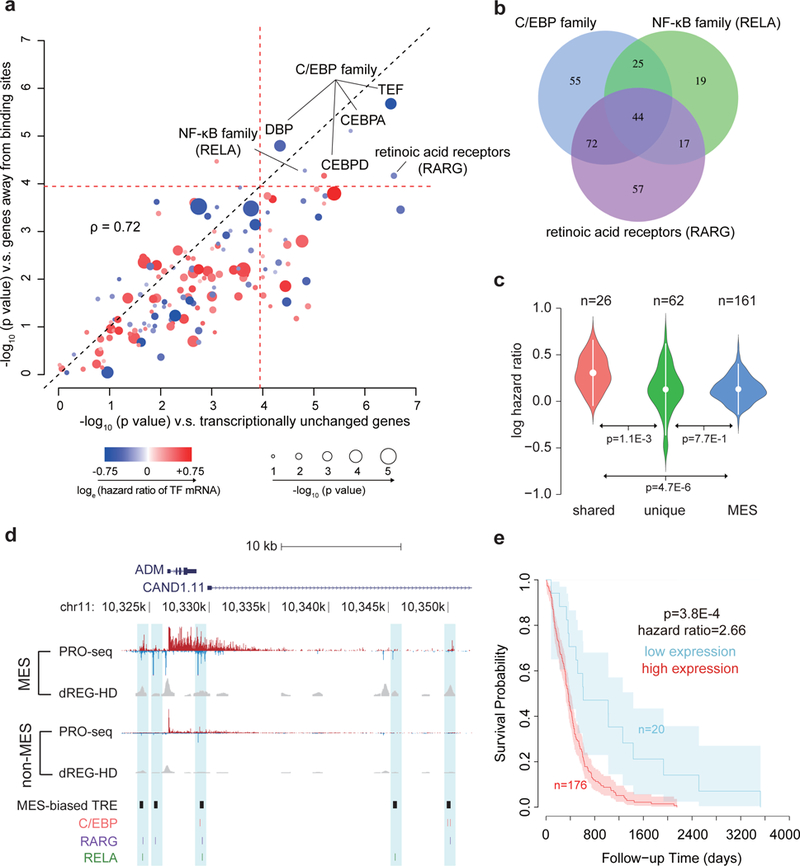
(a) Scatter plot shows the -log10 two-sided Wilcoxon rank sum test p value comparing the distribution of hazards ratios of target genes for each transcription factor and two groups of non-target control genes (see Online Methods). The radius of the circle denotes the -log10 p value of association between transcription factor mRNA levels and survival. Color denotes the loge of the hazard ratio at higher mRNA levels. The dotted red line represents the Bonferroni adjusted α threshold (0.05/ 432). (b) Venn diagram shows overlap between the target genes of the three indicated transcription factors. (c) Violin plot shows the loge hazard ratios for target genes shared among (left, N=26) and unique to (center, N=62) three transcription factors, and for mesenchymal marker genes (right, N=161). Mean hazard ratios are shown by white dots and standard deviations are shown by bars. P values were calculated by a two-sided Wilcoxon rank sum test. (d) Browser track of ADM shows the average of RPM normalized (le)ChRO-seq signals and dREG-HD scores in mesenchymal (MES, n= 3) and non-MES (n= 8) GBMs. MES-biased TREs and motif positions are highlighted in blue. (e) Kaplan–Meier plot shows overall survival between 196 patients with high and low average expression level of 26 shared target genes. The cutoff was determined based on the minimum p value in the difference between survival time using a two-sided Chi-squared test. Shaded regions mark the 95% confidence interval.
Surprisingly all three survival associated transcription factors regulated overlapping sets of putative target genes. Of four different combinations in which multiple transcription factors could regulate overlapping targets, three were more common than expected (p < 0.01; super exact test53; Fig. 7b; Supplementary Fig. 28), including 44 target genes that were shared among all three transcription factors. Target genes shared among all three transcription factors had significantly higher hazard ratios than unique target genes (Fig. 7c,d, p = 1.1e-3, Wilcoxon). Of the 26 shared targets for which hazards ratios were available, all were negatively correlated with survival, and eight were significantly associated with clinical outcomes on their own (a significant enrichment [p = 6e-4, Fisher’s exact test]), including CCL20 (Supplementary Fig. 29a) and ADM (Fig. 7d), (p < 0.05, Chi-squared test) (Supplementary Table 6). High expression of both genes was associated with high risk regardless of subtype assignment, indicating that survival association of these transcription factors was not simply driven by enrichment in the mesenchymal subtype (Supplementary Fig. 29b-c). Moreover, differences in survival among these genes were not driven by IDH1 status (Supplementary Fig. 30). Gene ontology analysis found that targets of all three transcription factors were enriched for immune system process and stress responses (p < 1e-5, false discovery rate (FDR) corrected Fisher’s exact test, Supplementary Table 7). Taken together, our analysis suggests that C/EBP, RARG, and NF-кB work in concert to activate a shared regulatory program that controls inflammatory processes and correlates with poor clinical outcomes in GBM.
Discussion
Nascent transcription is a promising approach for studying the molecular basis of complex disease because unstable RNAs provide deep insights into multiple stages of gene regulation. ChRO-seq maps nascent transcription in virtually any sample that maintains the integrity of protein-DNA interactions – even those in which RNA is highly degraded. ChRO-seq has important applications throughout the biomedical sciences in analyzing regulatory programs that contribute to solid tumors and other tissues which have proven challenging to study using existing molecular tools.
Our analysis of 20 primary tumors revealed several insights into transcriptional regulatory programs in malignant tissue. First, we report that enhancers in malignant tissue were surprisingly similar to DHSs in the tissue of origin. This finding suggests that regulatory programs in GBM often work within the confines of chromatin architecture that is established in the initiating cell. Regulatory programs were also similar to normal brain in PDXs, demonstrating that tumor initiating cells are able to reconstitute a diverse cell environment that bares surprising similarity to primary brain tissue. Yet how are malignant cell behaviors specified by cancer cells despite this similarity? We found a rare population of ectopic enhancers that resembled fetal tissues isolated from the nervous system, immune cells, and differentiated tumor cells. Our observations are consistent with models of tumorigenesis in which tumor cells reactivate regulatory programs that were similar in some respects to an earlier developmental stage54. These regulatory signatures derived from rare ectopic enhancers may have important prognostic value that can be exploited in future studies.
Our study highlights how transcription factors are responsible for coordinated changes in the expression of groups of genes that contribute to expression heterogeneity among tumors. ChRO-seq, like other run on technologies55, provides substantial information about the regulatory activities of transcription factors on chromatin that is independent of transcription factor expression levels. In support of our general approach, transcription factor candidates activating TREs in the stem-like regulatory program were similar to those reported previously to be sufficient for initiating tumors in a murine host44. Additionally, we used ChRO-seq data to identify transcription factors that establish differences in gene expression characteristic of reported GBM subtypes.
We report three transcription factors, C/EBP, RAR, and NF-кB, whose target genes were systematically correlated with poor clinical outcomes. Our work adds new transcription factors to the current literature, as well as additional support for the role of C/EBP in driving mesenchymal transformation49. NF-кB was previously associated with resistance to radiotherapy and involvement in mesenchymal transformation in GBMs48. Our present work builds on these studies to show that NF-кB activation has an unambiguous influence on clinical outcomes. Additionally, we found evidence that a third transcription factor, RAR, drives regulatory programs that contribute to survival in GBMs. Notably, post-transcriptional mechanisms are responsible for activating two of these three transcription factors, NF-кB and RAR. Thus insights reported here were possible only because ChRO-seq is a more direct indicator of transcription factor activity than other tools previously applied in GBM. As the pharmacology for targeting diverse transcription factor families develops, the transcription factors reported here, as well as our strategies for finding them, will become more useful in nominating targeted therapies.
Online Methods:
Cell culture.
Jurkat cells were grown in RPMI-1640 supplemented with 10% fetal bovine serum, 1X Penicillin/Streptomycin Antibiotic, 0.125 mg/ml Gentamicin Antibiotic at 37°C, 5% CO2. 1×10⁶ cells were centrifuged at 700 × g 4°C 5 min. The media was removed and the cells were rinsed with 1X PBS, centrifuged, and PBS was removed.
Tissue collection and preparation.
Glioblastoma-derived cells were prepared from freshly biopsied human tumors obtained with patient consent. Sample collection was approval by the Institutional Review Board at SUNY Upstate Hospital, Syracuse, NY, and followed all relevant ethical regulations. The non-tumor brain sample was dissected from the brain of an epileptic patient, also with informed consent and IRB approval. To establish patient-derived xenografts, small pieces of freshly resected gliomas were implanted subcutaneously in the flank of athymic nude (nu/nu) mice (Harlan Laboratories / Envigo, Indianapolis,IN) and serially passaged (mouse-to-mouse) 3 times for PDX-UMU88–02, 7 times for PDX-UMU89–08, and 57 times for PDX-88–04 p57, as previously described56,57. All mouse work was approved by the SUNY Upstate IACUC and followed all relevant ethical regulations. To prepare chromatin pellets tissue samples were pulverized in a cell crusher. The Cellcrusher was chilled in liquid nitrogen. Frozen glioblastoma tissue (~ 100 mg) was placed in the Cellcrusher, the pestle is placed into the Cellcrusher, and the pestle was stuck with the mallet until the tissue was fractured into a fine powder.
Chromatin isolation.
The chromatin isolation was based on work first described in ref27. For chromatin (ChRO) isolation from cultured cells or tissue we added 1 ml of 1× NUN Buffer (0.3 M NaCl, 1M Urea, 1% NP-40, 20 mM HEPES, pH 7.5, 7.5 mM MgCl2, 0.2 mM EDTA, 1 mM DTT, 20 units/ml RNase Inhibitor (Life Technologies # AM2694), 1× Protease Inhibitor Cocktail (Roche # 11 873 580 001)). Samples were vigorously vortexed for one minute. An additional 500 μl of appropriate NUN Buffer was added to each sample and vigorously vortexed for an additional 30 seconds. For length extension chromatin (leChRO) isolation from cultured cells or tissue we added 1 ml of 1× NUN Buffer, as described previously, spiked with 50 units/ml RNase Cocktail Enzyme Mix (Ambion # 2286) in place of the RNase Inhibitor. The samples were incubated on ice for 30 minutes with a brief vortex every 10 minutes. Samples were centrifuged at 12,500 × g at 4°C for 30 minutes after which the NUN Buffer was removed from the chromatin pellet. The chromatin pellet was washed with 1 ml 50 mM Tris-HCl, pH 7.5 supplemented with 40 units/ml RNase Inhibitor (Life Technologies # AM2694), centrifuged at 10,000 x g, 4°C, for 5 minutes, and buffer discarded. The chromatin was washed two additional times. After washing, 100 μl of chromatin storage buffer (50mM Tris-HCl, pH 8.0, 25% Glycerol, 5mM MgAc2, 0.1mM EDTA, 5mM DTT, 40 units/ml RNase Inhibitor) was added to each sample. The samples were loaded into the Bioruptor and sonicated using the following conditions: power setting on high, cycle time of ten minutes with cycle durations of 30 seconds on and 30 seconds off. The sonication was repeated up to 3 times as needed to get the chromatin pellet into suspension. Samples were stored at −80°C.
Chromatin Run-On and sequencing (ChRO-seq) library preparation.
After chromatin isolation, the chromatin run-on and sequencing library prep closely followed the methods described previously28. Chromatin from 1×10⁶ Jurkat T-cells or 10–100 mg of primary glioblastoma or 100 mg of PDX in 100 μL chromatin storage buffer was mixed with 100 μL of 2x chromatin run-on buffer (10 mM Tris-HCl pH 8.0, 5 mM MgCl2,1 mM DTT, 300 mM KCl, 400 μM ATP (NEB # N0450S), 40 μM Biotin-11-CTP (Perkin Elmer # NEL542001EA), 400 μM GTP (NEB # N0450S), 40 μM Biotin-11-UTP (Perkin Elmer # NEL543001EA), 0.8 units/μl SUPERase In RNase Inhibitor (Life Technologies # AM2694), 1% Sarkosyl (Fisher Scientific # AC612075000)). The run-on reaction was incubated at 37°C for 5 minutes. The reaction was stopped by adding Trizol LS (Life Technologies # 10296–010) and pelleted with GlycoBlue (Ambion # AM9515) to visualize the RNA pellet. The RNA pellet was resuspended in DEPC treated water and heat denatured at 65°C for 40 seconds. In ChRO-seq, we digested RNA by base hydrolysis in 0.2N NaOH on ice for 8 minutes, which ideally yields RNA lengths ranging from 40 – 100 bases. This step was excluded from leChRO-seq. Nascent RNA was purified by binding streptavidin beads (NEB # S1421S) and washed as described28. RNA was removed from beads by Trizol and followed by the 3’ adapter ligation (NEB # M0204L). A second bead binding was performed followed by a 5’ de-capping with RppH (NEB # M0356S). The 5’ end was phosphorylated using PNK (NEB # M0201L) followed by a purification with Trizol (Life Technologies # 15596–026). A 5’ adapter was then ligated onto the RNA transcript. A third bead binding was then followed by a reverse transcription reaction to generate cDNA (Life Technologies # 18080–044). cDNA was then amplified (NEB # M0491L) to generate the ChRO-seq libraries which were prepared based on manufacturer’s’ protocol (Illumina) and sequenced using Illumina NextSeq500 at the Cornell University Biotechnology Resource Center.
Mapping ChRO-seq and leChRO-seq sequencing reads.
We used our publicly available pipeline to align ChRO-seq and leChRO-seq data. Some libraries were prepared using adapters which contained a molecule-specific unique identifier (first 6 bp sequenced; denoted in Supplementary Table 1), and for these we removed PCR duplicates using PRINSEQ lite58. Adapters were trimmed from the 3’ end of remaining reads using cutadapt with a 10% error rate59. Reads were mapped with BWA60 to the human reference genome (hg19) plus a single copy of the Pol I ribosomal RNA transcription unit (GenBank ID# U13369.1). The location of the RNA polymerase active site was represented by a single base which denotes the 3’ end (ChRO-seq) or 5’ end (leChRO-seq) of the nascent RNA, which corresponds to the position on the 5’ or 3’ end of each sequenced read respectively. Mapped reads converted to bigWig format using BedTools61 and the bedGraphToBigWig program in the Kent Source software package62. Downstream data analysis was performed using the bigWig software package. All data processing and visualization was done in the R statistical environment63.
Gene transcription analyses.
Gene transcription activity quantification for ChRO-seq and leChRO-seq.
We quantified transcriptional activity using gene annotations from GENCODE v25 lift 37, expect for the cross-comparison with TCGA RNA-seq data where we used GENCODE v22 lift 37 to match the annotation of TCGA data. We counted reads in the interval between 500 bp downstream of the annotated transcription start site to the end of the gene for comparisons. This window was selected to avoid counting reads in the pause peak near the transcription start site. We limited analyses to gene annotations longer than 1,000 bp in length.
Molecular subtype classification.
Transcriptional activity of characteristic genes for each GBM subtype (n = 23) were quantified by the methods described above. Reads count from each sample are normalized by reads per million total reads count, followed by log2 transformation of pseudo count adjusted data (RPM normalized reads count+1). The transformed read count were centered to a mean of zero for each gene. The similarity between each sample was measured by Spearman’s rank correlation, and clustered using single link clustering. The similarity of each sample to molecular subtypes26 were calculated using Pearson’s correlation with the centroid of corresponding subtype.
Differential expression analysis (DESeq2) for annotated genes.
Patients clustered in each dominant molecular subtype were treated as biological replicates (Fig. 2b and Supplementary Table 3). Two technical replicates of non-malignant brain were used as control. Differential expression analysis was conducted using DESeq2 and differentially expressed genes were defined as those with a false discovery rate (FDR) less than 0.05.
Comparison of TREs with DNase-I hypersensitive sites.
dREG-HD. dREG-HD was run using the default settings. A complete description of dREG-HD can be found in Supplementary Note 6.
Data processing for calling DNase-I hypersensitive sites and dREG-HD sites.
We reprocessed all DNase-I-seq data and identified DNase-I hypersensitive sites (DHSs) using a uniform pipeline. We retrieved mapped reads from either ENCODE or Epigenome roadmap projects aligned to hg19. We called peaks in individual biological replicates, 921 samples in total, using MACS266 and Hotspot. To group DHSs for each cell and tissue type with high confidence, we took the union of peaks (bedtools merge) from biological replicates followed by intersecting peaks called by Hotspot and MACS2. Lastly since peaks resulted from intersection may be too narrow and hence become missed during downstream intersection operations, we expanded all short peaks (<150bp) to 150bp from the peak center. Analyses involving individual replicates, in Supplementary Fig. 11, use only peaks called by MACS2.
ChRO/leChRO-seq data was mapped to hg19 as described above. dREG score was thresholded at 0.7 to generate dREG peak regions for dREG-HD run. dREG-HD runs were done at the stringent condition, except for analysis of subtype biased TREs, where we used dREG-HD sites called at relaxed condition.
Mutual information analysis.
We used mutual information to compare the similarity between TREs observed in any pair of DHS or dREG-HD datasets. DHSs or dREG-HD peaks of sample involved in the comparison were merged in order to construct a sample space in which two or more samples would be compared. Each dataset was then summarized as a random variable, represented by a zero-one vector in which each element represents a TREs in the sample space, and takes a value of 1 if it intersects with that peak and 0 otherwise. We calculated the mutual information between two random variables, X and Y, using the formula below:
Comparison between tumor and reference brain tissues and cell lines.
We selected brain-related samples from uniformly processed DHSs and categorized the reference dataset by sample origin, namely normal adult brain tissues (globus pallidus, midbrain, frontal cortex, middle frontal gyrus, cerebellum and cerebellar cortex), primary brain cells (astrocyte of the hippocampus, astrocyte of the cerebellum, and normal human astrocytes), and GBM cell lines (A172, H54 and M059J).
Mutual information heatmap and clustering analysis.
To compare the similarity between the dREG-HD sites in each query samples and DHSs in each reference sample (Fig. 3c), we computed the pairwise mutual information between each pair of dREG-HD and DHSs (as described above) on the sample space defined by merged peaks among all samples included in the analysis. Information on clustering samples based on mutual information, as in Supplementary Fig. 14, can be found in Supplementary Note 7.
TRE clustering analysis.
We analyzed the activation pattern across TREs, using the same definition of sample space described in the mutual information analysis (above). We assigned two states to each TRE, active if intersected dREG-HD/ DHS, and inactive otherwise. The Jaccard distance was used to quantify the similarity between two samples or between two potential TREs. Clustering across samples (columns) and across TREs (rows) was done using ward.D2 method. To reduce the influence of noise on the clusters, we limited analysis to TREs that were activated in at least two query samples but less than 6 brain-related reference samples (16 samples in total).
taTRE enrichment test and clustering into regulatory programs.
taTREs were defined as TREs from primary GBM / PDX that do not intersect with any dREG-HD peaks from our non-malignant brain control nor with DHSs found in normal brain tissues (including globus pallidus, midbrain, frontal cortex, middle frontal gyrus, cerebellum and cerebellar cortex). These taTREs represent a stringent subset enriched for TREs associated with the malignant phenotypes observed in brain tumors. dREG-HD sites or DHSs that overlapped with ENCODE consensus hg19 blacklist regions were excluded from analysis.
The majority of taTREs intersected DHSs in one or more reference ENCODE and Epigenome Roadmap samples (Fig. 3a). We devised a statistical test to determine whether the observed number of intersections with each reference sample is significantly higher than expected by chance. We generated a null distribution by sampling DHSs with replacement from all TREs found in reference samples, controlling for the distribution of uniqueness (i.e., the number reference samples which each taTRE intersects) of taTREs from a particular GBM / PDX. The simulation was run for 105 times for each sample, each simulation drawing the same number of taTREs observed in that sample. We selected tissues with a stringent statistical significance cutoff of p(Xnull > xobserved) ≤ 1/104. Reference samples that showed significant enrichment in at least one third of (≥8) GBM or PDX were chosen as taTRE-associated references for downstream analysis.
In total 50 significant taTRE-enriched reference samples were clustered by methods described in the TRE clustering analysis section. Fold of enrichment was calculated as the xobserved / E[Xnull]. The dendrogram was cut down to three clusters. DHS regions that show up in more than half of reference samples in each cluster were picked as representative DHS driving a regulatory program that is characteristic for that cluster. taTREs overlapping these representative DHSs unique to each cluster were selected for downstream analysis.
Motif enrichment analysis of tumor-associated TREs and subtype-biased TREs.
Defining subtype-biased TREs.
To search for TREs that differentially activated or repressed in each subtype, we rely on measuring the change of the nascent RNA in the TRE regions. We merged dREG-HD sites called using the relaxed setting across 23 samples. We summed up the reads count of leChRO/ChRO-seq of each merged dREG-HD sites extended by 250bp from the center. TREs in patients of the subtype of interest (Supplementary Table 5) were compared against those of the rest three subtypes. Differential expression analysis was conducted using DESeq236, and subtype-biased TREs are defined as those differentially transcribed with a false discovery rate (FDR) less than 0.01.
Defining genomic regions for motif enrichment comparison.
We examined motif enrichment in the positive set compared with a GC-content matched background control set. In the taTRE motif enrichment, we used the group indicated in Supplementary Fig. 15 as the positive set, and dREG-HD sites that intersect with active DHSs in the normal brain as the background. For subtype-biased TRE motif enrichment analyses we used up or down-regulated subtype-specific TREs as the positive set and TREs that did not show significant differential transcription (FDR DESeq2 p > 0.1) as the background set. For the positive and background sets we selected the center of peaks and then extended by 150bp from the center. We subsampled background peaks to construct >2,500 GC-content matched TREs before scanning for motif enrichment.
Motif enrichment analysis.
We used the R package rtfbsdb to search for motifs that show enrichment in each primary GBM47. We focused on 1,882 human transcription factor binding motifs from the CisBP database68. When scanning genomic regions of interest, we used TFBSs having a loge-odds score ≥7 in positive and background sets, with scores obtained by comparing each representative motif model to a second-order Markov background model. Motif enrichment was tested using Fisher’s exact test. To account for potential bias resulted from difference in GC-content between positive and background sets, we ran statistical test on 50 independently subsampled GC-matched dREG-HD regions, and summarized the p values and the fold enrichment across background sets by the median across samples.
We refined motifs discovered using several heuristics, as follows: 1) The motif was enriched (i.e., with a fold enrichment greater than 1), 2) the enrichment was robustly significant to changes in the GC matched background set (median p < 0.05/ 1882), 3) the positive sets have at least 10 sites with loge-odds score ≥7, 4) the transcription factor was transcribed (for subtype-biased TREs). In the subtype-biased TRE analysis for up-regulated TREs we required at least 2 ChRO/leChRO-seq reads in the gene body in all samples of either the subtype of interest or other three subtypes.
Summarizing motif enrichment statistics across patients (taTREs analysis only).
Motifs in the taTRE analysis that were enriched in at least one primary GBM (all taTRE against all normal brain TRE) were chosen for downstream analysis. The enrichment statistics of three regulatory modules-taTREs were also summarized by median over the patients that show significant enrichment for the motif. Lastly, for each transcription factors with multiple motif IDs, we reported the one with the most significantly enrichment in all taTREs over nbTREs. In the subtype-biased TRE analysis, we used all motifs meeting the enrichment criteria and heuristics described above.
Motif clustering by genomic position.
Because we are not able to rigorously distinguish between paralogous transcription factors that share similar DNA binding specificities, we developed a method of clustering motifs based on their occurrences in the genome. We first scanned motifs enriched over genomic regions defined by the positive set. In clustering motifs enriched in taTREs, we used the taTREs merged over 20 primary GBMs as the positive set; for motifs enriched in subtype biased TREs, we used the corresponding subtype biased TRE in which the motifs were enriched as the positive set. We defined the presence of TFBSs for loci (stand-specific) having a loge-odds score ≥7 in positive and background sets, and absence otherwise, with scores obtained by the method described in the section Motif enrichment analysis of taTRE. The Spearman’s rank order correlation coefficients were computed for each pair of transcription factors, based on their presence/absence pattern across TFBSs of all motifs of interest. Heatmaps were generated using agglomerative hierarchical clustering using the ward.D2 method.
Validation of regulation between transcription factors and target genes.
Associating transcription factors to target genes.
We associated transcription factors to target genes by first identifying its target TREs, and then search for target genes based on location of these TREs. To identify target TREs, we scanned “relaxed dREG-HD all GBM” regions, extended by 150bp from the center, using itself as the second-order Markov background model. For each subtype-specific transcription factor, we defined its binding sites as 1) subtype-biased TREs that undergo differentially transcription in the same subtype, and 2) have a loge-odds score ≥7 for at least one corresponding motif ids that also showed enrichment (p<0.05). This subset of TREs represents the potential binding and regulating sites of the TF of interest, referred to as query TREs. We use stringent heuristics link the query TREs to target genes in order to reduce false positive links. TREs were linked to putative target genes if: 1) the annotated transcriptional start site of the genes is the first two closest to the query TRE and within 50kb, and 2) the gene is differentially transcribed (FDR corrected DESeq2 p < 0.05) in the same direction as the query TRE.
Defining the background set of non-target genes.
We defined background non-target genes of each transcription factor as those distal from (>0.5 Mb) the query TRE, but which show similar changes in transcription as that of target genes (to control for subtype). We required non-target genes had a transcription start site >0.5Mb from the closest query TRE. To match changes in transcription between target and non-target genes, we subsampled half of the genes away from query TREs and differentially transcribed (p<0.05) in the same direction as that of target genes without replacement, such that the distribution of log2 of fold change in transcription was insignificant (two-sided Wilcoxon p > 0.2).
Validation of association between transcription factors and target genes.
To validate of our approach associating transcription factors to target genes, we compared the co-expression of target genes to that of background non-target genes. Specifically, we used the RPKM normalized TCGA RNA-seq data from 174 GBM patients downloaded from, and used the Spearman’s rank correlation to measure the degree of co-expression. To avoid the potential co-expression that might be artificially enriched in target genes due to higher chance of being located in adjacent positions of the genome, we masked the correlations coefficients between adjacent genes. We computed the significance for target genes to have higher co-expression using one-sided Wilcoxon rank-sum test.
Quantifying the association between the transcription level of transcription factors and its target genes.
We used the RPKM normalized TCGA RNA-seq data from 174 GBM patients, and used the Spearman’s rank correlation to measure the monotonic relation between the transcription level of transcription factors and the putative target genes. We compared the difference between the distribution of correlation coefficients for target and non-target genes using the Wilcoxon rank-sum test and derive the two-sided p value.
Identification of transcription factors driving survival-associated programs.
For each subtype-specific transcription factor, we identified the target genes as described above, and compared the hazard ratio of the target genes with that of non-target genes. We defined two sets of background based on non-target genes: 1) the closest genes whose transcription start site was also within 50 kb to the query TRE, but whose transcription unchanged across the samples representing that subtype (p > 0.2, Fig. 7a, x axis), and 2) genes differentially transcribed (p < 0.05) in the same direction as target genes, whose transcription start sites were 0.5Mb away from the closest query TRE (Fig. 7a, y axis). The clinical data, the scaled mRNA abundance level of 11,861 genes across 200 GBM patients (196/200 with information of survival days available), and unified over three microarray platforms, was downloaded from TCGA26. We computed the hazard ratio of each gene by fitting a Cox proportional hazards regression model for survival time of patients with expression level in upper 25% of transcription levels over those with lower 25%. This ensures that all genes were fit for the regression model using the same balanced number of patients. We used the Wilcoxon test to compare the distribution of hazard ratios of target genes and background genes, and derived a two-sided p values for each background set.
The hazard ratio of analysis for individual transcription factors in Fig. 7a and Supplementary Fig. 27a-c, and target genes of survival-related transcription factors in Fig. 7e, Supplementary Fig. 27d-f and 30, were determined by the same regression model. The difference was that, instead of using the upper and lower quartiles as the cutoff, we reported the hazard ratio at the threshold between 0.1 quantile and 0.9 quantile that gave the largest difference between survival times. This difference was calculated by two-sided p value from Chi-squared test. This ensured that we reported the largest possible difference in survival time for each individual gene.
Supplementary Material
Acknowledgements:
We thank M. Viapiano and P. Sethupathy for valuable comments on the manuscript and other members of the Danko, Kwak, and Lis labs for valuable discussions. This research was supported, in part, by US National Institutes of Health (NIH) grants HG009309 to C.G.D. and H.K. and GM25232 to J.T.L. and by the Walbridge Foundation for Brain Cancer Research. T.C. thanks the Croucher Foundation for the Croucher Scholarships for Doctoral Study (2013). The content is solely the responsibility of the authors and does not necessarily represent the official views of the NIH or the Walbridge Foundation.
Footnotes
Accession codes:
All ChRO-seq and leChRO-seq data from human brain samples or PDXs can be downloaded from the database of genotypes and phenotypes (dbGaP) under accession number phs001646.v1.p1. Data collected from Jurkat T-cells is available in Gene Expression Omnibus under accession number GSE117832.
Competing financial interests:
The authors declare no competing financial interests.
URLs: ChRO-seq/ leChRO-seq alignment pipeline: https://github.com/Danko-Lab/utils/tree/master/proseq
dREG-HD implementation: https://github.com/Danko-Lab/dREG.HD
tfTarget implementation: https://github.com/Danko-Lab/tfTarget
bigWig software package: https://github.com/andrelmartins/bigWig
TCGA Microarray data: https://tcga-data.nci.nih.gov/docs/publications/gbm_exp/unifiedScaled.txt
Code availability:
Custom scripts for the tfTarget package can be downloaded form: https://github.com/Danko-Lab/tfTarget. dREG-HD can be obtained from: https://github.com/Danko-Lab/dREG.HD.
Data availability:
All ChRO-seq and leChRO-seq data can be downloaded from the database of genotypes and phenotypes (dbGaP) under accession number phs001646.v1.p1.
References:
- 1.Cheng J et al. Transcriptional maps of 10 human chromosomes at 5-nucleotide resolution. Science 308, 1149–1154 (2005). [DOI] [PubMed] [Google Scholar]
- 2.Kim T-K et al. Widespread transcription at neuronal activity-regulated enhancers. Nature 465, 182–187 (2010). [DOI] [PMC free article] [PubMed] [Google Scholar]
- 3.Ulitsky I & Bartel DP lincRNAs: genomics, evolution, and mechanisms. Cell 154, 26–46 (2013). [DOI] [PMC free article] [PubMed] [Google Scholar]
- 4.Quinodoz S & Guttman M Long noncoding RNAs: an emerging link between gene regulation and nuclear organization. Trends Cell Biol. 24, 651–663 (2014). [DOI] [PMC free article] [PubMed] [Google Scholar]
- 5.De Santa F et al. A large fraction of extragenic RNA pol II transcription sites overlap enhancers. PLoS Biol. 8, e1000384 (2010). [DOI] [PMC free article] [PubMed] [Google Scholar]
- 6.Preker P et al. RNA exosome depletion reveals transcription upstream of active human promoters. Science 322, 1851–1854 (2008). [DOI] [PubMed] [Google Scholar]
- 7.Andersson R et al. Nuclear stability and transcriptional directionality separate functionally distinct RNA species. Nat. Commun. 5, 5336 (2014). [DOI] [PubMed] [Google Scholar]
- 8.Core LJ et al. Defining the status of RNA polymerase at promoters. Cell Rep. 2, 1025–1035 (2012). [DOI] [PMC free article] [PubMed] [Google Scholar]
- 9.Boyle AP et al. High-resolution mapping and characterization of open chromatin across the genome. Cell 132, 311–322 (2008). [DOI] [PMC free article] [PubMed] [Google Scholar]
- 10.Buenrostro JD, Giresi PG, Zaba LC, Chang HY & Greenleaf WJ Transposition of native chromatin for fast and sensitive epigenomic profiling of open chromatin, DNA-binding proteins and nucleosome position. Nat. Methods 10, 1213–1218 (2013). [DOI] [PMC free article] [PubMed] [Google Scholar]
- 11.Core LJ, Waterfall JJ & Lis JT Nascent RNA sequencing reveals widespread pausing and divergent initiation at human promoters. Science 322, 1845–1848 (2008). [DOI] [PMC free article] [PubMed] [Google Scholar]
- 12.Churchman LS & Weissman JS Nascent transcript sequencing visualizes transcription at nucleotide resolution. Nature 469, 368–373 (2011). [DOI] [PMC free article] [PubMed] [Google Scholar]
- 13.Kwak H, Fuda NJ, Core LJ & Lis JT Precise maps of RNA polymerase reveal how promoters direct initiation and pausing. Science 339, 950–953 (2013). [DOI] [PMC free article] [PubMed] [Google Scholar]
- 14.Mayer A et al. Native elongating transcript sequencing reveals human transcriptional activity at nucleotide resolution. Cell 161, 541–554 (2015). [DOI] [PMC free article] [PubMed] [Google Scholar]
- 15.Nojima T et al. Mammalian NET-Seq Reveals Genome-wide Nascent Transcription Coupled to RNA Processing. Cell 161, 526–540 (2015). [DOI] [PMC free article] [PubMed] [Google Scholar]
- 16.Schwalb B et al. TT-seq maps the human transient transcriptome. Science 352, 1225–1228 (2016). [DOI] [PubMed] [Google Scholar]
- 17.Core LJ et al. Analysis of nascent RNA identifies a unified architecture of initiation regions at mammalian promoters and enhancers. Nat. Genet. 46, 1311–1320 (2014). [DOI] [PMC free article] [PubMed] [Google Scholar]
- 18.Scruggs BS et al. Bidirectional Transcription Arises from Two Distinct Hubs of Transcription Factor Binding and Active Chromatin. Mol. Cell 58, 1101–1112 (2015). [DOI] [PMC free article] [PubMed] [Google Scholar]
- 19.Danko CG et al. Identification of active transcriptional regulatory elements from GRO-seq data. Nat. Methods 12, 433–438 (2015). [DOI] [PMC free article] [PubMed] [Google Scholar]
- 20.Azofeifa JG & Dowell RD A generative model for the behavior of RNA polymerase. Bioinformatics (2016). doi: 10.1093/bioinformatics/btw599 [DOI] [PMC free article] [PubMed] [Google Scholar]
- 21.Andersson R et al. An atlas of active enhancers across human cell types and tissues. Nature 507, 455–461 (2014). [DOI] [PMC free article] [PubMed] [Google Scholar]
- 22.Bradner JE, Hnisz D & Young RA Transcriptional Addiction in Cancer. Cell 168, 629–643 (2017). [DOI] [PMC free article] [PubMed] [Google Scholar]
- 23.Parsons DW et al. An integrated genomic analysis of human glioblastoma multiforme. Science 321, 1807–1812 (2008). [DOI] [PMC free article] [PubMed] [Google Scholar]
- 24.Brennan CW et al. The somatic genomic landscape of glioblastoma. Cell 155, 462–477 (2013). [DOI] [PMC free article] [PubMed] [Google Scholar]
- 25.Mohan M, Lin C, Guest E & Shilatifard A Licensed to elongate: a molecular mechanism for MLL-based leukaemogenesis. Nat. Rev. Cancer 10, 721–728 (2010). [DOI] [PubMed] [Google Scholar]
- 26.Verhaak RGW et al. Integrated genomic analysis identifies clinically relevant subtypes of glioblastoma characterized by abnormalities in PDGFRA, IDH1, EGFR, and NF1. Cancer Cell 17, 98–110 (2010). [DOI] [PMC free article] [PubMed] [Google Scholar]
- 27.Wuarin J & Schibler U Physical isolation of nascent RNA chains transcribed by RNA polymerase II: evidence for cotranscriptional splicing. Mol. Cell. Biol. 14, 7219–7225 (1994). [DOI] [PMC free article] [PubMed] [Google Scholar]
- 28.Mahat DB et al. Base-pair-resolution genome-wide mapping of active RNA polymerases using precision nuclear run-on (PRO-seq). Nat. Protoc. 11, 1455–1476 (2016). [DOI] [PMC free article] [PubMed] [Google Scholar]
- 29.Khodor YL et al. Nascent-seq indicates widespread cotranscriptional pre-mRNA splicing in Drosophila. Genes Dev. 25, 2502–2512 (2011). [DOI] [PMC free article] [PubMed] [Google Scholar]
- 30.Menet JS, Rodriguez J, Abruzzi KC & Rosbash M Nascent-Seq reveals novel features of mouse circadian transcriptional regulation. Elife 1, e00011 (2012). [DOI] [PMC free article] [PubMed] [Google Scholar]
- 31.Cai H & Luse DS Transcription initiation by RNA polymerase II in vitro. Properties of preinitiation, initiation, and elongation complexes. J. Biol. Chem. 262, 298–304 (1987). [PubMed] [Google Scholar]
- 32.Choder M & Aloni Y RNA polymerase II allows unwinding and rewinding of the DNA and thus maintains a constant length of the transcription bubble. J. Biol. Chem. 263, 12994–13002 (1988). [PubMed] [Google Scholar]
- 33.Cancer Genome Atlas Research Network. Comprehensive genomic characterization defines human glioblastoma genes and core pathways. Nature 455, 1061–1068 (2008). [DOI] [PMC free article] [PubMed] [Google Scholar]
- 34.Patel AP et al. Single-cell RNA-seq highlights intratumoral heterogeneity in primary glioblastoma. Science 344, 1396–1401 (2014). [DOI] [PMC free article] [PubMed] [Google Scholar]
- 35.Wang Q et al. Tumor Evolution of Glioma-Intrinsic Gene Expression Subtypes Associates with Immunological Changes in the Microenvironment. Cancer Cell 32, 42–56.e6 (2017). [DOI] [PMC free article] [PubMed] [Google Scholar]
- 36.Love MI, Huber W & Anders S Moderated estimation of fold change and dispersion for RNA-seq data with DESeq2. Genome Biol. 15, 550 (2014). [DOI] [PMC free article] [PubMed] [Google Scholar]
- 37.Liu SJ et al. CRISPRi-based genome-scale identification of functional long noncoding RNA loci in human cells. Science (2016). doi: 10.1126/science.aah7111 [DOI] [PMC free article] [PubMed] [Google Scholar]
- 38.Xi Z et al. Overexpression of miR-29a reduces the oncogenic properties of glioblastoma stem cells by downregulating Quaking gene isoform 6. Oncotarget 8, 24949–24963 (2017). [DOI] [PMC free article] [PubMed] [Google Scholar]
- 39.Ma Y et al. PVT1 affects growth of glioma microvascular endothelial cells by negatively regulating miR-186. Tumour Biol. 39, 1010428317694326 (2017). [DOI] [PubMed] [Google Scholar]
- 40.Zhao D et al. Heat shock protein 47 regulated by miR-29a to enhance glioma tumor growth and invasion. J. Neurooncol. 118, 39–47 (2014). [DOI] [PubMed] [Google Scholar]
- 41.Roadmap Epigenomics Consortium et al. Integrative analysis of 111 reference human epigenomes. Nature 518, 317–330 (2015). [DOI] [PMC free article] [PubMed] [Google Scholar]
- 42.ENCODE Project Consortium. An integrated encyclopedia of DNA elements in the human genome. Nature 489, 57–74 (2012). [DOI] [PMC free article] [PubMed] [Google Scholar]
- 43.Tentler JJ et al. Patient-derived tumour xenografts as models for oncology drug development. Nat. Rev. Clin. Oncol. 9, 338–350 (2012). [DOI] [PMC free article] [PubMed] [Google Scholar]
- 44.Suvà ML et al. Reconstructing and reprogramming the tumor-propagating potential of glioblastoma stem-like cells. Cell 157, 580–594 (2014). [DOI] [PMC free article] [PubMed] [Google Scholar]
- 45.Ricci-Vitiani L et al. Tumour vascularization via endothelial differentiation of glioblastoma stem-like cells. Nature 468, 824–828 (2010). [DOI] [PubMed] [Google Scholar]
- 46.Ricci-Vitiani L et al. Mesenchymal differentiation of glioblastoma stem cells. Cell Death Differ. 15, 1491–1498 (2008). [DOI] [PubMed] [Google Scholar]
- 47.Wang Z, Martins AL & Danko CG RTFBSDB: an integrated framework for transcription factor binding site analysis. Bioinformatics (2016). doi: 10.1093/bioinformatics/btw338 [DOI] [PMC free article] [PubMed] [Google Scholar]
- 48.Bhat KPL et al. Mesenchymal differentiation mediated by NF-κB promotes radiation resistance in glioblastoma. Cancer Cell 24, 331–346 (2013). [DOI] [PMC free article] [PubMed] [Google Scholar]
- 49.Carro MS et al. The transcriptional network for mesenchymal transformation of brain tumours. Nature 463, 318–325 (2010). [DOI] [PMC free article] [PubMed] [Google Scholar]
- 50.Danko CG et al. Dynamic evolution of regulatory element ensembles in primate CD4+ T cells. Nature Ecology & Evolution (2018). doi: 10.1038/s41559-017-0447-5 [DOI] [PMC free article] [PubMed] [Google Scholar]
- 51.Luo X, Chae M, Krishnakumar R, Danko CG & Kraus WL Dynamic reorganization of the AC16 cardiomyocyte transcriptome in response to TNFα signaling revealed by integrated genomic analyses. BMC Genomics 15, 155 (2014). [DOI] [PMC free article] [PubMed] [Google Scholar]
- 52.Chuong EB, Elde NC & Feschotte C Regulatory evolution of innate immunity through co-option of endogenous retroviruses. Science 351, 1083–1087 (2016). [DOI] [PMC free article] [PubMed] [Google Scholar]
- 53.Wang M, Zhao Y & Zhang B Efficient Test and Visualization of Multi-Set Intersections. Sci. Rep. 5, 16923 (2015). [DOI] [PMC free article] [PubMed] [Google Scholar]
- 54.Stergachis AB et al. Developmental fate and cellular maturity encoded in human regulatory DNA landscapes. Cell 154, 888–903 (2013). [DOI] [PMC free article] [PubMed] [Google Scholar]
- 55.Azofeifa JG et al. Enhancer RNA profiling predicts transcription factor activity. Genome Res. (2018). doi: 10.1101/gr.225755.117 [DOI] [PMC free article] [PubMed] [Google Scholar]
References (Online Methods):
- 56.Canute GW et al. Hydroxyurea accelerates the loss of epidermal growth factor receptor genes amplified as double-minute chromosomes in human glioblastoma multiforme. Neurosurgery 39, 976–983 (1996). [DOI] [PubMed] [Google Scholar]
- 57.Eller JL, Longo SL, Hicklin DJ & Canute GW Activity of anti-epidermal growth factor receptor monoclonal antibody C225 against glioblastoma multiforme. Neurosurgery 51, 1005–13; discussion 1013–4 (2002). [DOI] [PubMed] [Google Scholar]
- 58.Schmieder R & Edwards R Quality control and preprocessing of metagenomic datasets. Bioinformatics 27, 863–864 (2011). [DOI] [PMC free article] [PubMed] [Google Scholar]
- 59.Martin M Cutadapt removes adapter sequences from high-throughput sequencing reads. EMBnet.journal 17, 10–12 (2011). [Google Scholar]
- 60.Li H & Durbin R Fast and accurate short read alignment with Burrows-Wheeler transform. Bioinformatics 25, 1754–1760 (2009). [DOI] [PMC free article] [PubMed] [Google Scholar]
- 61.Quinlan AR & Hall IM BEDTools: a flexible suite of utilities for comparing genomic features. Bioinformatics 26, 841–842 (2010). [DOI] [PMC free article] [PubMed] [Google Scholar]
- 62.Kuhn RM, Haussler D & Kent WJ The UCSC genome browser and associated tools. Brief. Bioinform. 14, 144–161 (2013). [DOI] [PMC free article] [PubMed] [Google Scholar]
- 63.Team RDCR: A language and environment for statistical computing In R Foundation for Statistical Computing. (2010). [Google Scholar]
- 64.Wang Z, Chu T, Choate LA & Danko CG Rgtsvm: Support Vector Machines on a GPU in R. arXiv [stat.ML] (2017). [Google Scholar]
- 65.Danko CG et al. Signaling pathways differentially affect RNA polymerase II initiation, pausing, and elongation rate in cells. Mol. Cell 50, 212–222 (2013). [DOI] [PMC free article] [PubMed] [Google Scholar]
- 66.Zhang Y et al. Model-based analysis of ChIP-Seq (MACS). Genome Biol. 9, R137 (2008). [DOI] [PMC free article] [PubMed] [Google Scholar]
- 67.Hastie T, Mazumder R, Lee J & Zadeh R Matrix Completion and Low-Rank SVD via Fast Alternating Least Squares. arXiv [stat.ME] (2014). [PMC free article] [PubMed] [Google Scholar]
- 68.Jolma A et al. DNA-binding specificities of human transcription factors. Cell 152, 327–339 (2013). [DOI] [PubMed] [Google Scholar]
Associated Data
This section collects any data citations, data availability statements, or supplementary materials included in this article.