

gpGrouper is a gene-centric peptide inference and quantitation algorithm that prevents gene origin mixing and isoform omission in parsimonious protein-centric approaches. A simple classification schema indicates distinguishable gene products, with shared peptide quantities distributed by ratios of corresponding unique peptides. This approach accurately determines tumor content and deconvolution of proteomes from mixed species patient derived xenografts without elimination of species-shared peptides. iBAQ quantities are calculated from label-free, isotopic, or isobaric data, allowing comparisons within and across samples and methodologies.
Keywords: Bioinformatics software, Mass Spectrometry, Label-free quantification, Quantification, iTRAQ, Mouse models, Cancer Biology, patient derived xenograft, protein inference, shared peptides
Graphical Abstract

Highlights
Gene-centric inference algorithm with classification for distinguishable groups.
Shared peptides are split proportionally to corresponding unique peptide ratios.
iBAQ values are calculated for label-free, isotopic or isobaric labeling methods.
Universally handles single or mixed species PDX data with accurate deconvolution.
Abstract
In quantitative mass spectrometry, the method by which peptides are grouped into proteins can have dramatic effects on downstream analyses. Here we describe gpGrouper, an inference and quantitation algorithm that offers an alternative method for assignment of protein groups by gene locus and improves pseudo-absolute iBAQ quantitation by weighted distribution of shared peptide areas. We experimentally show that distributing shared peptide quantities based on unique peptide peak ratios improves quantitation accuracy compared with conventional winner-take-all scenarios. Furthermore, gpGrouper seamlessly handles two-species samples such as patient-derived xenografts (PDXs) without ignoring the host species or species-shared peptides. This is a critical capability for proper evaluation of proteomics data from PDX samples, where stromal infiltration varies across individual tumors. Finally, gpGrouper calculates peptide peak area (MS1) based expression estimates from multiplexed isobaric data, producing iBAQ results that are directly comparable across label-free, isotopic, and isobaric proteomics approaches.
Mass spectrometry-based proteomics allows for the rapid identification and quantification of proteins in complex biological samples. The bottom-up techniques involve the enzymatic digestion of proteins into peptides, which are detected by a high-resolution mass spectrometer after high performance liquid chromatography (HPLC) separation (1). The resulting peptides are then mapped back to proteins for downstream analyses. However, peptides shared across multiple proteins complicate the process of protein inference and quantitation (2–4). These problems are exacerbated in mixed taxa samples of patient derived xenografts (PDXs)1, where transplantation of human tumors into immune-compromised murine hosts is a common approach employed for biomarker discovery and analysis of drug sensitivities (5, 6). Because of high homology across human and mouse proteomes, a higher proportion of peptides have ambiguous protein assignments, presenting even more significant challenges in the assembly and analysis of these proteomic data as compared with single species samples.
Existing peptide inference tools typically operate on a principle of parsimony that intends to explain peptide data with a minimal protein list (7–9). For cases where multiple proteins cannot be distinguished with available peptide evidence, those proteins are reported as a single protein group, or master proteins are chosen - via logical but arbitrary rules - to represent the group. This approach can also complicate comparison between multiple experiments when incompatible protein isoform groups are reported from similar peptide evidence in different experiments. The current solution to these issues is to regroup all study experiments based on their combined peptide pool, but this approach is computationally consuming and restricts flexibility in exploratory analyses of samples within different cohorts.
Another question is how—or whether—to incorporate shared peptides in protein quantitation. For example, if a shared peptide is parsimoniously assigned to one protein over others in a “winner-take-all” scenario such as a Razor peptide definition by MaxQuant (10), that protein retains the whole quantified value of such peptide peak. Alternatively, the exclusion of shared peptides simplifies the process, but at the expense of a loss of information and quantity.
To address these issues, we have developed a gene-centric peptide grouping program, gpGrouper, which implements a classification method for inference control and a mechanism to distribute shared peak areas. gpGrouper also effectively deconvolutes PDX proteomes where two homologous taxa are present in the sample. In these cases, the host stroma replaces that from the original microenvironment and integrates with the tumor. Because different tumors exhibit different levels of stromal integration (11, 12), it is important to differentiate and accurately quantify proteins from each species. The significance of the host contribution is increasingly recognized in the proteomics community (13), because ignoring the presence of mouse stroma in PDX samples can lead to erroneous conclusions about tumor biology. Although some software now have capabilities to consider multispecies samples (14), to date no other software addresses this challenge while preserving and distributing all peptides shared across species. In addition, we show that unique-to-taxon peptides can be used to estimate fraction of tumor in a PDX sample, which is a useful metric for assessment of sample suitability for further analyses.
Last, gpGrouper has a universal peptide grouping logic that processes label-free, isotopic (e.g. SILAC (15)), and isobaric (e.g. iTRAQ (16) and TMT (17)) proteomic samples and returns peptide peak area MS1-based estimates of iBAQ protein quantities for all of these methodologies. The program can use search results from any peptide identification and quantification pipeline, only requiring spectral match information and peptide abundances. We compare our method with the widely used protein-centric MaxQuant approach (10) to highlight consequences of parsimonious assignments in identification and quantitation. We show that gpGrouper accurately redistributes shared peptides and estimates species ratios in mixed-taxa samples. We also demonstrate the ability of gpGrouper to process data from PDX tissue samples after label-free and iTRAQ-based profiling with comparable results. gpGrouper is implemented in the Python programming language and is freely available at https://github.com/malovannaya-lab/gpgrouper.
MATERIALS AND METHODS
Cell Culture
HeLa cells were grown in DMEM (Catalogue # SH30022.01, HyClone, GE Healthcare Life Sciences) with 5% fetal bovine serum (Catalogue # F0926, Sigma). NIH-3T3 cells were grown in DMEM with 10% bovine calf serum (Catalogue #100–506, Gemini Bio Products). All cell lines were cultured at 37 °C in 5% CO2. For harvesting, cells were incubated with 0.25% trypsin + EDTA (Catalogue # 25053, Corning) and the digestion was quenched with serum-containing media, washed 3 times with phosphate buffered saline, and subjected for cell lysis as described below.
PDX Models
PDX tumors were grown in mice as described previously (18, 19). Briefly, xenografts were transplanted into fat pads of SCID/Beige or NOD/SCID immuno-compromised mice and allowed to reach an approximate volume of 1.5 cm in diameter before harvesting. Only untreated and baseline (vehicle-treated) tumors were used for this study.
Sample Preparation
Label-Free Profiling for Testing Mixed Species Samples
For HeLa and NIH-3T3 cell lines, cells were resuspended in 50 μl of ammonium bicarbonate + 1 mm CaCl2, snap frozen in liquid nitrogen and thawed at 42 °C. This freeze/thaw step was repeated 3 times, and then the samples were boiled at 95 °C for 2 min with vortexing at 20 s intervals and kept for proteolytic digestion. The human/mouse mixture samples at ratios of HeLa:3T3 of 1:0; 1:3; 1:1; 3:1, 0:1 were prepared in new tubes. Finally, mixed peptide samples were dried under vacuum. The preparations of the human/mouse mixtures were repeated 3 times to assess the reproducibility in estimating taxon ratios.
Frozen PDX tumor sections were pulverized (cryoPREP™ CP02, Covaris) or crushed on a liquid nitrogen cooled steel block with mechanical action. The homogenized tissues were then transferred to Eppendorf tubes and proteins were extracted with the same freeze/thaw protocol as described for cell lines.
After isolation, protein concentrations were measured with the Bradford assay. 50 μg of total protein was processed via a 2-step trypsin digestion. First, proteins were digested with a 1:20 solution of 1 μg/μl trypsin/protein in ABC solution (50 mm ammonium bicarbonate, 1 mm CaCl2) overnight at 37 °C with shaking. Next, an additional digestion was carried out with a 1:100 solution of 1 μg/μl trypsin/protein for 4 h in the same conditions. After addition of 10% formic acid at 1:10 volume to neutralize the reaction, an equal volume of 80% acetonitrile + 0.1% formic acid was added to extract the peptides. Peptides were centrifuged at 10,000 × g, and peptide concentration of the supernatant was measured using the Pierce Quantitative Colorimetric Peptide Assay (Cat# 23275, Thermo Fisher Scientific). 50 μg of peptide was vacuum dried and stored at 4 °C before resuspension for fractionation (if applicable) and sequencing.
TMT Labeled Human/Mouse Mixture for Testing Peak Area Distribution
HeLa or NIH-3T3 peptides were labeled with isobaric tandem mass tags (TMTsixplex, Catalogue #90061, Thermo Fisher Scientific) according to the manufacturer's instructions. Briefly, HeLa and NIH-3T3 cell pellets were lysed in Lysis Buffer (100 mm TEAB with 1% SDS). The lysate was sonicated for 10 s at 20% power for 3 times with interval 30 s on ice (Ultrasonic Processor VC 505, Sonics & Materials BE). The lysate was then cleared by centrifugation at 21,000 rcf for 20 min at 4 °C. The protein concentration of the supernatant was measured using Bradford Assay (Catalogue #23238, Thermo Fisher Scientific). Fifty micrograms of protein per sample was transferred to a new tube and adjusted to a final volume of 100 μl with 100 mm TEAB. Five microliters of 200 mm TCEP was added to each sample for 1 h at 55 °C, then 5 μl of 375 mm iodoacetamide was added to sample for 30 min at room temperature in the dark. Total protein was precipitated with 6-volumes of cold acetone overnight at −20 °C. The protein was pelleted by centrifugation and air dried for 3 min. Dried protein was dissolved in 100 μl 50 mm TEAB and digested with 25 ng trypsin per 1 μg protein overnight at 37 °C. After digestion, peptide concentration was measured using Pierce Quantitative Colorimetric Peptide Assay (Catalogue #23275, Thermo Fisher Scientific). 0.8 mg vial of TMT Label Reagent TMT-126 or 129N was dissolved in 41 μl anhydrous acetonitrile, added to 50 μg peptides in 100 μl 50 mm TEAB of HeLa or NIH-3T3, respectively. After labeling peptides for 1 h at room temperature, reactions were quenched by adding 8 μl of 5% hydroxylamine solution and incubating for another 15 min.
Off-Line Basic pH Reverse Phase Peptide Fractionation
Vacuum-dried peptides were dissolved in pH10 ABC buffer (10 mm ammonium bicarbonate, pH 10, adjusted by NH4OH) and subjected to off-line microscaled reverse phase separation (or “sRP”, for small scale RP). A micropipette tip with a C18 resin was made from a 200 μl pipette tip by layering 6 mg of C18 matrix (Reprosil-Pur Basic C18, 3 μm, Dr. Maisch GmbH, Germany) on top of a C18 disk plug (EmporeTM C18, 3M). Vacuum-dried peptides were dissolved with 150 μl of pH10 ABC buffer and loaded on the C18 tip pre-equilibrated with same pH10 ABC solution. Bound peptides were fractionated by elution with a step gradient of 150 μl of increasing concentrations of ACN, combined into pooled fractions non-contiguously, and vacuum dried. For TMT-tagged human and mouse peptide mixtures, a total of 18 fractions (2–36% ACN, 2% steps) were collected and combined into 6 pools (18F6R protocol with 02 + 14 + 26, 04 + 16 + 28, 06 + 18 + 30, 08 + 20 + 32, 10 + 22 + 34, and 12 + 24 + 36% combinations). This is the most extensive sRP protocol used here to achieve better separation of peptide complexity and minimize ratio compression in isobaric methods. For label-free human and mouse mixture profiling samples, a total of 15 (2–30% ACN, 2% steps) fractions were obtained and combined into 5 pools for mass spectrometry sequencing (15F5R protocol with 02 + 12 + 22, 04 + 14 + 24, 06 + 16 + 26, 08 + 18 + 28, and 10 + 20 + 30% combinations). This is our current standard sRP configuration that allows identification and quantification of ∼6000–7000 proteins per 5 μg of peptide in ≤12 h. For the WHIM PDX profiling samples, an older original sRP protocol (20) was used with 9 fractions combined into 6 pools (9F6R protocol with 06 + 25, 09 + 30, 12 + 35, 15, 18, and 21%).
Mass Spectrometry
Fractionated peptides were analyzed on an Orbitrap Fusion or LumosETD mass spectrometer coupled with the Nanospray Flex ion sources and, respectively, an UltiMate 3000 UPHLC or an EASY-nLC 1200 UHPLC (all instrumentation from Thermo Fisher Scientific). For each run on the Fusion instrument, ∼1 μg of peptide was loaded onto a 2 cm 100 μm ID pre-column and resolved on a 12 cm 100 μm ID column, both packed with sub-2 μm C18 beads (Reprosil-Pur Basic C18, Catalogue #r119.b9.0003, Dr. Maisch GmbH). For each run on the LumosETD instrument, ∼500 ng of peptides were loaded onto a 2 cm 100 μm ID pre-column and resolved on a 6 cm 150 μm ID column, both packed with sub-2 μm C18 beads. The gradient mobile phase was mixed from water (solution A) and 90% acetonitrile (solution B), both with 0.1% formic acid. A constant flow rate was maintained with linear gradient elutions. Specific gradients and mass spectrometry method parameters are listed in supplemental Table S1.
Reference Sequence Databases
The raw spectral data were searched against human and mouse NCBI reference sequence databases downloaded on 2015-06-10 and processed to produce RefSeq FASTA files annotated with NCBI GeneID, TaxonID, and HomologeneID. FASTA duplicates were reduced per GeneID as follows. In each case, FASTAs with the NP_ accession and highest Protein GI number were preferentially chosen over the XP_ accessions and lower GI numbers to represent a given group of identical sequence associated with the same GeneID. A total of 73,637 human and 58,549 mouse sequences were compiled. For mixed HeLa:3T3 and PDX experiments, a combined human/mouse RefSeq was made by concatenating the human and mouse databases. A Python script to make these reference databases is provided in RefProtDB (https://github.com/malovannaya-lab/RefProtDB).
Search (Mapping/Quantification) Parameters
Proteome Discoverer (Mascot-based) Search
The Proteome Discoverer software suite (PD version 2.0.0.802; Thermo Fisher Scientific) was used to search the raw files with the Mascot search engine (v2.5.1, Matrix Science, London, UK (21)), validate peptides with Percolator (v2.05 (22)), and provide MS1 quantification through Area Detector Module. MS1 precursors in a 350–10,000 mass range were matched against the tryptic RefProtDB database digest with Mascot permitting up to of 2 missed cleavage sites (without cleavage before P), a precursor mass tolerance of 20 ppm, and a fragment mass tolerance of 0.5 Da. The following dynamic modifications were allowed: Acetyl (Protein N-term), Oxidation (M), Carbamidomethyl (C), DeStreak (C), and Deamidated (NQ). For the Percolator module, the target strict and relaxed FDRs for PSMs were set at 0.01 and 0.05 (1 and 5%), respectively.
MaxQuant Search
MaxQuant version 1.6.0.1 was used for analyzing data via MaxQuant software suite. Default values were used with the following specifications. The dynamic modifications were set: Acetyl (Protein N-term), Oxidation (M), Carbamidomethyl (C), DeStreak (C), and Deamidated (NQ). Trypsin/P proteolytic enzyme was used with a maximum of 2 missed cleavages, a precursor mass tolerance of 20 ppm, and a fragment mass tolerance of 0.5 Da. A PSM FDR cutoff of 1% was used.
Spectrum Mill Search
The original PSMs table from Huang et al. (23) was retrieved from https://cptac-data-portal.georgetown.edu/cptacPublic/.
Inference/Quantitation
gpGrouper
gpGrouper uses peptide spectral matches (PSMs) data produced by a search engine of user's choice (e.g. Mascot, Andromeda, Spectrum Mill, MSGF+) and a RefProtDB FASTA file with Entrez GeneID information for inference (supplemental Fig. S1, https://github.com/malovannaya-lab/gpgrouper, and supplemental README documentation). The tab-delimited PSMs input should at minimum provide sequence, charge, modifications, search engine score, FDR-type statistic, MS1 peak quantification, and, if applicable, isobaric tag MSn reporter quantification. Default gpGrouper parameters are specified for the Mascot search engine output coupled with the Proteome Discoverer Area Detector, but data can originate from any MS peak quantification pipeline that provides the input values gpGrouper requires (see supplemental Note 1 for parameter adjustments made for MaxQuant and SpectrumMill PSMs data). For a full list of fields calculated for PSMs and gene products, see supplemental Figs. S2 and S3, respectively.
MaxQuant
MaxQuant protein results were filtered to 1% FDR. Sum of unique+razor peptides were used for quantitation, with a minimum of 1 razor+unique peptide required.
SpectrumMill
The original protein expression data (log2 ratio) of the Huang et al. study (23) was retrieved from the online publication, supplemental Table S4. Protein accession numbers were mapped to Entrez GeneIDs via accession-2-gene relationship.
Data Normalization for PDX Profiling Comparison
After regrouping the PSMs data from the Huang et al. study, the gene product output table was normalized and converted into log2 ratios for each WHIM for comparison to the previously published data. First, the iBAQ-based fraction of total values (iBAQFOT) were calculated per species by dividing the iBAQ for each gene product by the total species iBAQ. Then, each iBAQFOT was divided by the corresponding gene product iBAQFOT for the internal reference and log2 transformed. These calculations were performed separately for each iTRAQ label using the internal reference within each iTRAQ set. The protein quantities of the label-free (LFree-gpG) dataset were similarly iBAQFOT normalized, and further median-centered per gene. Z-score transformation was applied to each data set separately before comparison.
RESULTS
Advantages of Gene-Centric Peptide Grouping
Here we implement a gene-centric inference and quantitation approach for bottom-up proteomics data that fundamentally differs from mapping protein level results to gene identifiers after inference. This approach solves three major issues of protein inference strategies. gpGrouper is not forced to misleadingly choose isoforms in data lacking and inherently biased against isoform-defining peptides. It eliminates mixing of gene and species origins within protein groups without omission of shared peptides. Last, single species and PDX samples can be analyzed without parameter adjustments to estimate pseudo-absolute protein amounts.
Peptides that differentiate protein isoforms are greatly underrepresented in proteomic profiling data due to their low frequency and an inherent tryptic bias against exon junctions (24). To explore the degree of impact this phenomenon has on the analysis of experimental data, we compared results from the parsimonious protein-centric assembly employed by MaxQuant (10, 25) with the gene-centric inference performed by gpGrouper. Human (HeLa) and human/mouse 1:1 mixture (HeLa/3T3) lysates were profiled to simulate complex single species and mixed-species PDX samples. In this analysis, we did not use the MaxQuant option of omitting species-shared peptides (14) to illustrate the extent of the issue in human/mouse samples. For the protein groups reported through this protein-centric approach, we find evidence for distinct protein isoforms in only a subset of these groups (Fig. 1A). From this protein perspective, 6.86% and 9.83% represent the only one gene product isoform annotated in RefSeq - these are informatically trivial cases that do not require an algorithm to choose a correct isoform product of a gene locus. Only 5.04% and 4.83% of the nontrivial protein assignments have unique-to-isoform peptides in the human and human/mouse samples, respectively. When mapping protein-centric results to the gene locus, we find that 97.59% human and 76.13% human/mouse protein groups map to a single GeneID (Fig. 1B). In the human/mouse mixture sample, 29.42% of single-gene protein groups have isoforms that are completely indistinguishable by peptide evidence, 8.47% of genes have two or more protein groups each with multiple indistinguishable isoforms, and only 14.86% of genes have at least one protein group with a single specific isoform inferred by the software. An additional ∼24% of gene products in both human and human/mouse samples are trivial single isoform cases. Furthermore, a subset of protein-centric groups—2% for the human and 30% for the human/mouse sample—contains multiple GeneIDs and, in the latter case, multiple species within a single group (supplemental Fig. S4A–S4D).
Fig. 1.

Gene-centric grouping is a robust method for inference and quantitation of gene product expression in single and mixed species samples. A, Proportions of distinguishable proteins in HeLa (human, left) and HeLa/3T3 mixture (human/mouse, right) proteome profiling data. A protein can be inferred from the identified peptide pool in ∼5% of cases. An additional 6–10% of unique protein assignments are from trivial cases where only one possible protein isoform is annotated for a given gene product. B, Proportions of protein isoforms that are distinguishable at the gene product level in human and human/mouse proteome profiling data. The majority of protein groups map to a single gene locus; and peptide coverage is insufficient to definitively identify an isoform in the majority of these cases. C, Comparison of human and mouse calumenin protein inference, peptide assignments, and quantitation in the human/mouse mixture sample. The expected quantities are calculated from corresponding profiling of separate HeLa or 3T3 lysates. The results from the mixed sample were assembled via gene-centric approach by gpGrouper and protein-centric approach by MaxQuant (without cross-species peptide elimination). Razor peptides are assigned by winner-take-all method, and the whole quantity of the razor peptide is used in quantitation of its corresponding protein-centric group. Note that ProteinGI 41282022, which is definitively identified in separate 3T3 cell profiling, is parsimoniously eliminated by protein-centric grouping in mixed species data.
These observations highlight where protein-centric grouping approaches are not straightforward in interpretability and should have consequences in quantification. This is further explored by examining the identification and quantitation of calumenin protein levels in a mixed mouse/human proteome. We first estimated how much protein is produced from human calumenin (GeneID 813) and mouse calumenin (GeneID 12321) loci by measuring separate HeLa and 3T3 proteome profiles. All calumenin peptides are unique-to-gene in each species separately, and the total amount of human and mouse calumenin proteins are approximately the same. From these data, we calculated expected amounts and ratio of calumenin proteins in the 1:1 HeLa/3T3 mixture, where more than half of calumenin peptides are shared between species (Fig. 1C). We then profiled this mixture to test how protein-centric and gene-centric algorithms identify and quantify the mixed species proteome (all profiling results are available in supplemental Table S2). If a standard protein-centric inference and winner-take-all (Razor peptides) quantification pipeline is applied, the human/mouse calumenin ratio is estimated to be ∼1:9 instead of expected 1:1. Ignoring all species shared peptides—a mechanism that is often employed in dealing with PDX samples—corrects this ratio, but vastly underestimates protein levels (in this case, by 5-fold). In addition, one expressed mouse isoform is eliminated by parsimony, and a biologically meaningless protein group that contains mixture of human and mouse proteins is assigned. Parsimonious elimination and the mixing of genomic origins in protein groups are unavoidable artifacts of protein-centric grouping algorithms that preserve shared peptide information. In contrast, gpGrouper assigns separate mouse and human gene products and provides information on distinguishable protein isoforms of the same gene, if available, without omitting shared peptides. Because of this, gpGrouper more accurately quantifies the expected amounts of human and mouse proteins on both pseudo-absolute and relative levels.
Qualitative Binning as an Alternative to Subset Elimination
Another issue of inference and quantification is that proteomics alone can never prove that a subset protein is not present. For example, one mouse and one human calumenin isoform do not have any unique peptides in the profiling data from Fig. 1. Although it is important to recognize this, parsimonious elimination of such subsets is unsubstantiated. To this end, rather than excluding gene products or isoforms with a subset of peptide evidence, all potential gene locus identifiers are reported with the level of evidence clearly indicated through a tiered system. Here, each gene product entry is assigned an IDSet value that indicates uniqueness and an IDGroup value that indicates spectral confidence in identification (Fig. 2A–2C). IDSet1 indicates that the peptide group assigned to a gene locus has at least 1 unique-to-gene (u2g) peptide, IDSet2 indicates the group has no u2g peptides but is not a subset of any other group through the available peptide evidence, and IDSet3 indicates that the peptide set assignable to the locus is a subset of at least one other group (Fig. 2B). Although others have proposed and implemented more nuanced levels of evidence groups (2, 9, 26, 27), this simple three-tiered approach covers all possibilities and is easily interpretable. IDGroup is a PSM quality rank that combines the spectral match score with PSM q-values as described in Fig. 2C. The best PSM IDGroup is assigned to each gene product as the gene-level IDGroup. IDSet and IDGroup metrics are combined to form the “SRA” binning system composed of “Strict,” “Relaxed,” and “All” confidence levels (Fig. 2A). Critically, while the approaches are not equivalent, the “Strict” list of assigned gene products gives comparable results to applying a 1% protein FDR cutoff (supplemental Note S2 and supplemental Fig. S4E). The lower “Relaxed” and “All” confidence assignments that would generally be eliminated by parsimony and FDR thresholds are retained, but clearly demarcated. While for an individual sample the evidence in these lower quality bins are less reliable, there is substantial utility to preserving these identifications when comparing across multiple experiments, as shown below.
Fig. 2.

Qualitative binning as an alternative to subset elimination. A, Definition parameters for Strict, Relaxed, and All (SRA) qualities of gene product identifications. B, Definition rules for IDSet classes of gene products. This three-tiered annotation system indicates whether gene product identifications are based on peptides with unambiguous gene locus mapping and demarcates identifications with subset peptide evidence. C, Definition parameters for PSM IDGroup bins. The lowest PSM IDGroup from peptides mapped to a given gene product is assigned as the gene-level IDGroup. D, Exploratory analysis of gpGrouper identification results from profiling of two basal and two luminal PDX tumors. Examples of gpGrouper metrics for (1) a subset of well-characterized PAM50 luminal markers, (2) a selection of gene products with borderline identifications in basal cancers, and (3) a selection of low abundance gene products with consistent expression quantities across in luminal tumors, but variable spectral match qualities.
With SRA bins and several semiquantitative and quantitative parameters from peptide, PSM, and peak-based amounts, gpGrouper provides a wealth of information for exploring proteomics results. In Fig. 2D we show examples of exploratory analyses through comparing proteome profiling of 2 basal and 2 luminal breast cancer PDXs (WHIMs; data in supplemental Table S3). Several known luminal PAM50 markers are identified and quantified nearly exclusively in luminal tumors with strong qualitative evidence (Fig. 2Di). In the next two panels (Figs. 2Dii-iii), we show how SRA binning allows nuanced interpretation of data where the differences between identifications are less robust. Proteins in Fig. 2Dii are identified in both basal and luminal tumors, but both quantities and SRA bins are lower for the basal subset. The agreement between SRA quality and protein quantity, an expectation in MS-based proteomics measurements, reinforces the conclusion that the differences are indeed true. Notably, if we were to eliminate identifications in R and A bins - effectively producing a minimal protein list for each experiment—many identifications of slightly worse quality would become missing values. For protein SGSM3, this will change the observed ∼9.5 fold luminal/basal difference to infinity—a less accurate conclusion of a large difference. In contrast, for TMEM259, where gpGrouper suggest only a minor ∼1.8-fold difference between luminal and basal tumors, a change to “all-or-none” leads to a significantly different conclusion of protein expression only in luminal samples. For proteins of lower abundance that are usually identified with few peptides, cutting data to a minimal list per experiment would sporadically produce missing values where subpar evidence is present. In Fig. 2Diii we see examples of this, where luminal subtype specific proteins of low abundance have different identification qualities but similar quantities.
Traditionally, this type of data analysis is performed by searching and grouping all experiments together as a cohort, which requires reprocessing every time a sample is added or removed from an analysis group. The gpGrouper output format and metrics allow for single-sample results to be interpreted on their own and flexibly combined without the necessity for data reprocessing, effectively mimicking a cohort analysis through assessment of the SRA quality metric.
Testing Area Distribution Accuracy for Shared Peptides
To improve the accuracy of pseudo-absolute quantification, gpGrouper retains and distributes shared peptide peak areas based on unique-to-gene peptide peak area ratios. This allows retention of shared peptides, which comprise 18 and 70% of all peptides by area in human and human/mouse samples (supplemental Fig. 5E and supplemental Note S3 for further discussion). This logic has been implemented previously on PSMs level and has shown to be a more accurate estimate of protein abundance than either full inclusion of shared peptides for each protein or ignoring shared peptides altogether (28). With this issue exacerbated on the MS1 peak area level, we sought to implement and validate a similar mechanism for the peptide peak based quantification. After peak area distribution, gene products are quantified by the iBAQ-based method of summing distributed peptide peak intensities and dividing by the total number of potential peptides, an approach that has been shown to be proportional to the absolute protein quantity (29–32).
To validate the accuracy of splitting shared peptide quantities based on unique-to-gene peptide ratios, we made a specialized human/mouse sample from HeLa and 3T3 cells labeled with separate TMT reporters (126 and 129N, respectively). We mixed them in a 1:1 ratio and analyzed the proteome profile of the combined samples. In this test dataset, cross-species shared peptides have same MS1 peptide peaks, and all signal from one TMT reporter channel (126) should originate from human proteins and all signal from the other (129N) from mouse proteins. This is a unique scenario, where the measured ratio of peptide origins can be obtained from the reporter ion ratios to the extent of the accuracy of the TMT technique (Fig. 3B). We are then able to compare these expected values with the distributed MS1 values as estimated by the ratio of unique-to-gene peptide sums (where the TMT reporter ions were ignored). We examined 5590 values for peptides that map to one gene identifier from each species after filtering for gene products that also contained quantified unique-to-gene peaks. This subpopulation serves to easily examine the validity of peptide peak area splitting based on unique-to-gene peptides by comparing the estimated peak distribution to the observed TMT reporter ion ratio (supplemental Table S4). The measured and estimated ratios have a strong Pearson correlation of 0.89, with a log2 ratio of the label-free estimate over the TMT observed values normally distributed around 0 with a mean ratio of −0.059 and standard deviation 1.024 (Fig. 3C). We also compared peak distribution to no peak splitting, random splitting, or razor allocation. Here, we found the root-mean squared error (RMSE) of 0.31 from the gpGrouper distribution mechanism to be lower than RMSE for no split (0.42), razor (6.37), or random splitting (0.50) (supplemental Fig. S6). These results show that the shared peptide peak splitting procedure performed by gpGrouper is the most accurate method for taking shared peptides into account for the purposes of quantification.
Fig. 3.
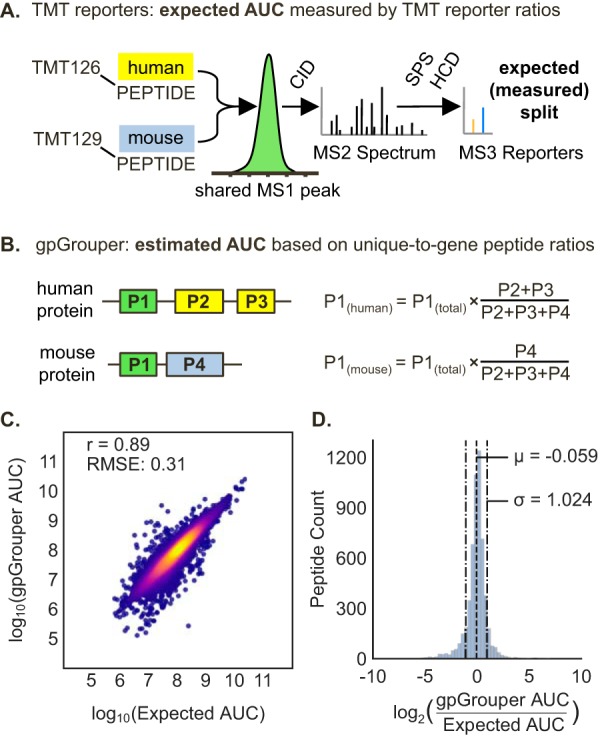
Validation of distribution algorithm for peak areas of peptides shared across multiple gene products. A, Experimental approach for benchmarking the accuracy of splitting shared peptides by unique peptide ratios. A specialized 1:1 mixture of human TMT126-tagged peptides and mouse TMT129-tagged peptides was made. A given peptide mapping to both species will elute as a single MS1 peak. The AUC value of said peak can be split by relative reporter ion ratios from its SPS-MS3 spectrum to determine expected AUC distribution. B, Theoretical scenario by which a shared peptide is split across two gene products (one mouse and one human gene in this dataset), that also have unique-to-gene peptides. The calculation of the distributed peptide area sum for each gene product comprises of the sum of unique peptides and shared peptides after weighting by the unique peptide ratio. C–D, Analyses of peptides that are shared across species and map to genes that also contain one or more unique peptides. C, Correlation plot for 5,590 shared peptide quantities distributed according to unique peptide ratios (gpGrouper AUC) versus expected quantities measured by TMT reporter ion ratios. D, The histogram of differences between expected and gpGrouper estimated quantities for distributed areas of shared peptides.
Extension of Shared Peptide Distribution Algorithm for Proteome Quantification in PDX Samples
Because of the high degree of overlapping peptides and total peptide areas in mixed human/mouse samples (see supplemental Note S3 and supplemental Fig. S5), the ability to retain information from shared peptides for the estimation of pseudo-absolute protein amounts with iBAQ method is more important. Because we showed that even limited numbers of unique-to-gene peptides can be used effectively and fairly to distribute gene product quantities, we surmised that a ratio of all human only and all mouse only peptide peaks should serve as a good proxy for species percentages in a given PDX. To test this hypothesis, we mixed unlabeled human HeLa and mouse 3T3 lysates in predefined ratios, profiled these samples, and evaluated how closely summation of their unique-to-species peak areas matched the expected percentages. A total of 5 mixtures of the same two original lysates were made in triplicate at 90% (9:1), 75% (3:1), 50% (1:1; same as data used in Fig. 1), 25% (1:3), and 10% (1:9) human (Fig. 4A). For the taxon ratios, the measured values were 11.13, 30.57, 55.84, 79.16, and 91.52% human with standard deviations of 0.36, 0.32, 0.73, 0.50, and 0.24%, respectively (Fig. 4B).
Fig. 4.
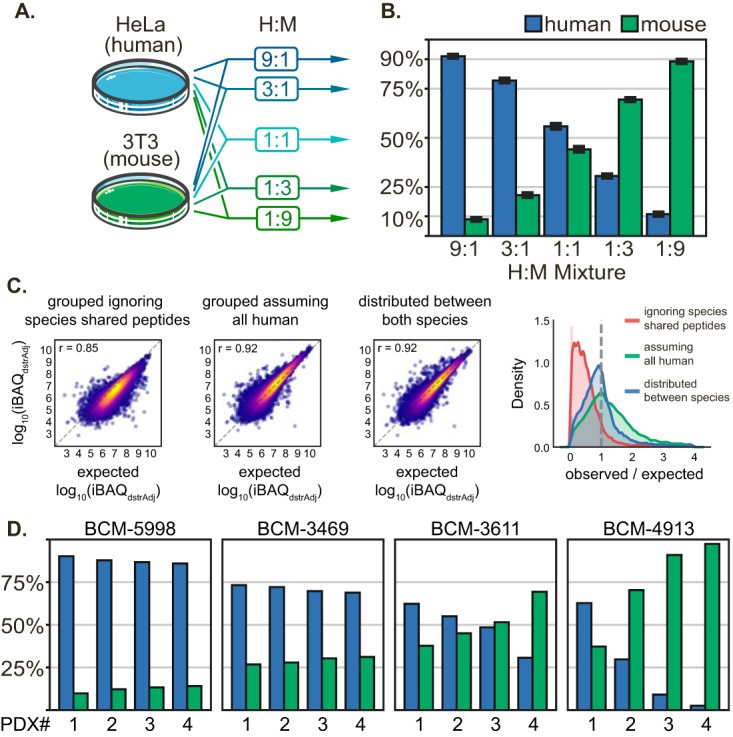
Validation of gpGrouper algorithm for estimation of tumor percentage and protein quantification in PDX samples. A, Schematic depicting the 5 cell mixtures used to test human/mouse proteome deconvolution by gpGrouper. Cells were lysed and digested with trypsin separately before mixing in the given ratios by peptide amount. B, Measured percentages of human and mouse proteins in each mixture reproducibly match the expected values (n = 3), with a slight ∼3% bias toward human assignments. C, Correlation and distribution plots of human gene products in the 1:1 mixture versus their expected levels after (1) only using unique-to-human peptides (2) only grouping with the human RefSeq, and (3) grouping against a human/mouse concatenated RefSeq and distributing peptides peak areas across species when necessary. D, Examples of varying levels of stromal infiltration across PDX replicates of breast cancer tumors from 4 patients. BCM-5998 PDXs consistently shows a human composition above 80%. BCM-3469 PDXs, while lower, are consistent at nearly 75% human. BCM-3611 PDXs are more variable, with percentages ranging from 40 to 60% human. Finally, the BCM-4913 model is extremely inconsistent with the human composition ranging from 3 to 65%.
Approximately 8000 gene products (7700 gene product groups) were identified for 5 μg of each separate species lysates, and 10,000–13,000 gene products (9000–12,000 gene product groups) were identified in mixed samples. Both the number of unique-to-species gene products and gene product groups positively correlate with the percentage of that taxon within the mixture. The species-specific gene products increase from ∼3000 in the 10% fractions to ∼6000 in the 90% fractions. The standard deviation in the number of gene products and groups is 1–3% of the mean (supplemental Fig. S7 and supplemental Table S5). Nearly 3000 gene products (1500 gene product groups) appear in all mixtures and represent highly homologous abundant proteins are fully shared cross-species. Notably, there is a ∼3% bias toward human content, which may be caused by a more complete human RefSeq annotation.
We then asked how accurately gpGrouper predicts label-free quantities for human proteins in a mixed species sample. It is worth noting that distributing cross-species shared peptide peak areas in gene products that also have unique-to-gene peptides follows the same logic as peak distribution for gene products of a single species. In this case, the gpGrouper algorithm works without modification, dividing MS1 intensities based on ratios of quantified unique-to-gene peptides. However, a new scenario arises in PDX data for proteins that are fully indistinguishable across species. For cross-species indistinguishable gene products, gene quantities in PDX experiments are first split by taxon percentage and then by the number of gene products per group, if applicable (supplemental Fig. S8). Although this admittedly represents the best guess in the absence of definitive data, this weighted distribution preserves the total human-to-mouse ratios for inter-species and inter-experimental normalization.
To gauge the accuracy of redistributing peak areas of peptides shared across two taxa, we further analyzed the 50% human mixture. We established an expected iBAQ level value for each human gene product by multiplying the quantities from the 100% human profiling sample by 0.50. Then, we calculated gene product iBAQs for each of the three 50% human replicates with gpGrouper peak distribution or using two common alternative approaches (14, 23). The first ignores all peptides shared between human and mouse, and the second alternative groups peptides against only a human database, assuming that peptide shared across these species belong to human proteins (data in supplemental Table S6). Fig. 4C shows that distribution of quantities to separate species via gpGrouper algorithm is more accurate than the other two approaches. Ignoring all species-shared peptides performs the worst with a Pearson correlation of 0.85 and underestimates protein levels, while searching against the human only database over-estimates human quantities. By considering all peptides and a concatenated human/mouse database we achieve a high Pearson correlation of 0.92 and a narrow, unity centered ratio distribution. To evaluate technological bias from potential under-sampling of lower fraction species, we repeated the same comparison of expected versus observed iBAQs for both species across all mixtures in Fig. 4A–4B. The RMSE between the expected and observed gene products quantified across all samples increases from roughly 0.40 in the 90% fraction up to 0.76 in the 10% fraction (as seen in supplemental Fig. S7F). Unsurprisingly, the accuracy of quantification is affected by the percentage of the species in the sample.
Next, we show several examples that highlight the importance of species deconvolution and show utility of gpGrouper percent estimates in genuine PDX samples. In Fig. 4D, percent human estimates are plotted for single 60-min gradient profiling results of individual PDXs replicates (xenograft tumors derived from different mice) of four different breast cancer tumors. The stromal infiltration, as represented by percent mouse, is largely inherent to the tumor, with some consistently displaying high human content (BCM-5998 tumors at ∼88% and BCM-3469 at ∼71%), and others with lower content (BCM-3611 tumors at ∼51%) and highly heterogeneous stromal patterns (BCM-4913 tumors in 3–64% human range). Therefore, when analyzing PDX samples, it is important to consider the percentage of each species and ensure that the percentages are acceptably consistent across multiple samples. Both amount and consistency of PDX tumor content is critical for downstream informatics analysis (e.g. amount of missing values and the ability to normalize data) and design of multiplexed sets and references for isobaric experiments. An example demonstrating the implications of having widely different human content in PDX samples is shown in supplemental Fig. S10 (data in supplemental Table S7), where alternative methods for handling species-shared peptides lead to drastically lower or higher identities and quantities. Our 1-hour proteome profiling allows for fast, accurate, and cost-efficient estimation of human content in PDXs which can drive a decision to include or reject a tumor sample from a study.
Splitting Isobaric Multiplexes into Separate Experiments with MS1-Based Protein Quantitation
Last, we implemented a multiplex splitting feature to gpGrouper, allowing for separation of isotopic and isobaric experiments into pseudo-absolute protein levels for each biological sample. For splitting of isobaric experiments, we partition each total MS1 peptide peak area into sample-specific AUCs according to reporter signal ratios from the corresponding MS2 or MS3 spectra (Fig. 5A). This differs from simply summing reporter ion ratios (supplemental Fig. S11), which are inherently compositional in nature and do not reliably represent total peptide amounts (33). The peak area splitting is done prior to protein inference to achieve separation of biological samples by the reporter channel. Once the individual PSMs tables with split MS1 AUCs are calculated, gpGrouper operates as previously, building separate experiment-2-gene results with consideration of species and shared peptide distributions.
Fig. 5.

Comparison of gpGrouper iBAQ-based expression estimates from label-free and isobaric proteome profiling of WHIM PDXs. A, Schematic describing the MS1 splitting procedure used by gpGrouper on isobaric profiling data. For a given PSM, the relative ratios of the reporter ions (in this case from an iTRAQ 4-PLEX) are used to split the corresponding MS1 peak area. The quantified value for each PSM and gene product is then reported separately for each channel (representing distinct samples) based on this split. B, Unsupervised clustering of the WHIM PDX breast tumor proteomic data previously published by CPTAC (“iTRAQ” dataset), by gpGrouper using the same input PSMs data (“iTRAQ-gpG” dataset), and on the same tumor models analyzed via label-free profiling (“LFree-gpG” dataset). C, Pearson correlation value matrix for each tumor as analyzed by gpGrouper on the iTRAQ and label-free data.
With this implementation, we first tested whether relative protein expression calculated from isobaric tag reporter ratios and the corresponding expression vectors from gene product iBAQ from gpGrouper are comparable. To do this, we utilized proteome profiling data from a previously published study by Huang et al., where 24 breast cancer PDX samples from Washington University Human In Mouse collection (WHIMs) were analyzed in iTRAQ4-multiplexed experiments (23). The Spectrum Mill based PSMs output from this study was grouped using gpGrouper to obtain “iTRAQ-gpG” results and compared with the protein results provided by the publication (“iTRAQ” results). We also compared these two quantification procedures of iTRAQ4 data with our label-free profiling of the same tumors, referred to as “LFree-gpG” results. Because iTRAQ and label-free WHIM experiments were done on different PDX passage cohorts, we narrowed our evaluation to 15 WHIMs that were present in both datasets (WHIMs 02, 04, 06, 08, 11, 12, 14, 16, 17, 18, 20, 21, 30, 35, and 43). Each dataset was normalized separately before comparison (see Methods). In Fig. 5B, we show that for the human gene products in the intersection of all three results, the two iTRAQ-derived results cluster strongly by their WHIM tumor identity. Furthermore, with exception of LFree-gpG profile from a late passage WHIM04 PDX, WHIM tumor identity is the primary driver of clustering between iTRAQ and LFree-gpG datasets. Secondly, WHIM subtypes cluster as reported previously across all methodologies, with two major clusters of basal and luminal B with HER2-E tumors and separation of claudin-low and EBV lymphoproliferative cancers. We conclude that transformation of isobaric data into MS1-based iBAQ estimates by gpGrouper algorithm works well and produces comparable conclusions to conventional reporter ratio analysis.
The distinguishing feature of iBAQFOT-transformed isobaric data is the estimation of pseudo-absolute protein amounts within each sample. To see whether these estimates agree with the LFree-gpG results, we calculated correlations between iTRAQ-gpG iBAQFOT without internal reference subtraction and corresponding LFree-gpG iBAQFOT across all 15 WHIMs. Fig. 5C shows that, again except for WHIM04, these correlations are strongest between the same WHIM tumor. Therefore, gpGrouper can provide MS1-based within-sample protein abundances from individual isobaric channels that are comparable to label-free data.
DISCUSSION
gpGrouper applies a parsimonious binning approach at the gene product level that is comparable, though not equivalent, to peptide grouping controlled by protein FDR. All gene products, including potential hits with shared-only peptide subsets or subpar spectral evidence, are reported in separate records and are clearly demarcated with Strict, Relaxed, and All - SRA -confidence flags. We show the advantages of such a procedure with a practical example, wherein different conclusions would be made had proteins been parsimoniously eliminated before comparing across samples. Furthermore, for situations where multiple loci with shared peptides are expressed, there is only convenience, but no validity, in winner-take-all assignments. We see how the application of MaxQuant using unique+razor peptides for quantification (10) can lead to convoluted groups with skewed quantitation, which can be remedied only by throwing out shared peptide quantities. For full transparency, gpGrouper reports ranges (minimum unique-to-gene and maximum) of counts for discrete parameters such as peptide sequences, spectral matches, and MS1 area-based quantities, and in addition distributes shared peptide peaks by unique peptide peak ratios when possible. We show that the weighting of shared peptides by unique peptide ratios is an accurate approach for allocating quantities across multiple gene products. With this weighted incorporation, shared peptide peaks are neither double-counted nor ignored. This provides a clear understanding of the experimental evidence behind each gene product without parsimonious elimination.
It is worth noting that gpGrouper can be applied at protein-centric level in its current implementation, but the results would be impractical at the commonly observed depth of proteomic techniques. The main argument against this approach is that most of the resulting indistinguishable proteins converge into single gene loci. Likewise, in most cases, protein isoforms coming from a single gene locus cannot be entirely resolved in current proteomics data. Therefore, we argue that grouping into gene loci is a better reflection of proteomics data. gpGrouper still annotates all evidence-based protein isoform groups (per gene and per taxa) but does not choose isoform subsets as primary identifiers. Future breakthroughs in instrumental sensitivity may improve profiling coverage depths such that a protein-centric gpGrouper inference could become sensible.
We also demonstrate that gpGrouper can accurately report the amount of each species in a mixed-taxa sample, and that this information is an important consideration when analyzing grafted tumors. There are several reasons why knowing the stromal contribution and being able to differentiate nonhuman and human proteins is useful. Host species share substantial number of tryptic peptide sequences with the tumor. Erroneous conclusions may be drawn about changes in human proteins that are caused by differential stromal content or changes in stromal proteins. We implemented a procedure to distribute human and host quantities based only on the acquired proteomics data and showed that this mechanism avoids erroneous conclusions to which alternative methods are susceptible.
From a practical standpoint, it is also useful to be able to quickly and accurately gauge the percentage of tumor to evaluate whether the experiment should proceed to what could be a lengthy and expensive protocol, and for quality control as to whether different samples are comparable. When the percentages of tumor across PDXs are too different, it is inherently difficult, if not impossible, to obtain meaningful results even after normalization procedures. A well-balanced experimental design is particularly crucial for isobarically multiplexed experiments where total composition of the multiplexed samples can induce batch effects, with substitutions of study samples much more complicated than label-free design in terms of required time and implementation.
Last, we show that it is possible to deconvolve isobaric multiplexed experiments into individual sample results with MS1-based quantification, which provides estimation of pseudo-absolute protein expression from isobaric data. It is important to point out that gpGrouper does not assure the accuracy of these estimates; the accuracy of MS1-based estimates from isobaric data is entirely dependent on the accuracy of reporter ratios as implemented in the upstream analysis. It is well recognized that isobaric multiplexing inherently suffers from isolation interference and ratio compression (34). Both instrumental (e.g. narrow isolation windows and synchronous precursor selection) and informatic (e.g. rejection of precursors with high degree of interference, statistical modeling of compositional effects of reporter ions) techniques have been used to overcome some of these problems, most at cost of identifications (33, 35–39). Such approaches may also disproportionally reduce the number of quantified unique-to-gene peptides that are stoichiometrically lower than corresponding shared peptides, which could affect the accuracy of the shared peak distribution. Therefore, although gpGrouper provides an opportunity to have both pseudo-absolute and relative quantification from the isobaric design, it is important to have strict quality assessment procedures for peptidome coverage and reporter intensities to minimize accuracy errors. Because gpGrouper itself is agnostic to data quality beyond peptide identification, this is true for all types of quantification with equally serious consequences from methodological challenges. At the same time, when based on reliable primary data, iBAQ-based quantification is of great benefit for prediction and modeling of precision and confidence intervals, determining of enrichment in affinity experiments, and proteogenomic integration with RNA expression from sample-matched transcriptomic data.
In conclusion, gpGrouper is a universal gene-centric grouping algorithm for bottom up proteomics data that can be incorporated into existing pipelines that make use of any search engine and MS1 peak quantifier. It returns a standardized output format for MS1-based iBAQ quantification from single or mixed species results acquired by label-free, isotopic, and isobaric methodologies.
DATA AVAILABILITY
All raw MS and gpGrouper result files have been deposited to the ProteomeXchange Consortium (http://proteomecentral.proteomexchange.org) in the MassIVE repository (MSV000081870) with the data set identifier PXD008560.
Supplementary Material
Acknowledgments
We thank Drs. Thomas F. Westbrook and Sarah J. Kurley for initial discussions on this project, and Drs. Rainer B. Lanz, Nur Yucer, Nicolas L. Young, and Bing Zhang for critical reading of the manuscript. The authors acknowledge the joint participation by Diana Henry Helis Medical Research Foundation through its direct engagement in the continuous active conduct of medical research in conjunction with Baylor College of Medicine and its “Blood-borne BioMarkers for Detection of Breast Cancer” Program.
Footnotes
* This work was supported by funds from Verna and Marrs McLean Foundation, Biochemistry and Molecular Biology Department, and Alkek Center for Molecular Discovery to A.M., Dan L. Duncan Comprehensive Cancer Center (Osborne (PI), Malovannaya/MS Proteomics Core; P30 CA125123), CPRIT Proteomics and Metabolomics Core Facility Award (Edwards (PI), Malovannaya/MS Proteomics Core, RP170005), CPTAC PGDAC Award (Zhang (PI), U24 CA210954), and CPTAC PTRC Award (Ellis (PI), U01 CA214125). M.J.E. is supported by CPRIT Established Investigator Award (RR140033) and is a McNair Medical Institute Scholar.
 This article contains supplemental Figures and Tables.
1 The abbreviations used are:
- PDX
- patient derived xenograft
- ABC
- ammonium bicarbonate
- e2g
- experiment to gene (result table)
- GPGroup
- gene product group
- iBAQ
- intensity based absolute quantification
- iBAQFOT
- iBAQ-based fraction of total
- IDGroup
- identification group
- IDSet
- identification set
- iTRAQ
- isobaric tag for relative and absolute quantification
- PAM50
- prediction analysis of microarrays 50 (breast cancer subtype gene signature)
- PSM
- peptide spectral match
- SILAC
- stable isotope labeling with aminoacids in culture
- SPS
- synchronous precursor selection
- SRA
- strict, relaxed, all
- TMT
- tandem mass tags
- WHIM
- Washington University Human-In-Mouse.
REFERENCES
- 1. Aebersold R., and Mann M. (2003) Mass spectrometry-based proteomics. Nature 422, 198–207 [DOI] [PubMed] [Google Scholar]
- 2. Nesvizhskii A. I., and Aebersold R. (2005) Interpretation of shotgun proteomic data: the protein inference problem. Mol. Cell. Proteomics 4, 1419–1440 [DOI] [PubMed] [Google Scholar]
- 3. Huang T., Wang J., Yu W., and He Z. (2012) Protein inference: a review. Brief Bioinforma. 13, 586–614 [DOI] [PubMed] [Google Scholar]
- 4. Li Y. F., and Radivojac P. (2012) Computational approaches to protein inference in shotgun proteomics. BMC Bioinformatics 13, S4. [DOI] [PMC free article] [PubMed] [Google Scholar]
- 5. Tentler J. J., Tan A. C., Weekes C. D., Jimeno A., Leong S., Pitts T. M., Arcaroli J. J., Messersmith W. A., and Eckhardt S. G. (2012) Patient-derived tumour xenografts as models for oncology drug development. Nat. Rev. Clin. Oncol. 9, 338–350 [DOI] [PMC free article] [PubMed] [Google Scholar]
- 6. Hidalgo M., Amant F., Biankin A. V., Budinská E., Byrne A. T., Caldas C., Clarke R. B., de Jong S., Jonkers J., Mælandsmo G. M., Roman-Roman S., Seoane J., Trusolino L., and Villanueva A. (2014) Patient-derived xenograft models: an emerging platform for translational cancer research. Cancer Discov. 4, 998–1013 [DOI] [PMC free article] [PubMed] [Google Scholar]
- 7. Nesvizhskii A. I., Keller A., Kolker E., and Aebersold R. (2003) A statistical model for identifying proteins by tandem mass spectrometry. Anal. Chem. 75, 4646–4658 [DOI] [PubMed] [Google Scholar]
- 8. Zhang B., Chambers M. C., and Tabb D. L. (2007) Proteomic parsimony through bipartite graph analysis improves accuracy and transparency. J. Proteome Res. 6, 3549–3557 [DOI] [PMC free article] [PubMed] [Google Scholar]
- 9. Yang X., Dondeti V., Dezube R., Maynard D. M., Geer L. Y., Epstein J., Chen X., Markey S. P., and Kowalak J. A.. DBParser: web-based software for shotgun proteomic data analyses. J. Proteome Res. 3, 1002–1008 [DOI] [PubMed] [Google Scholar]
- 10. Tyanova S., Temu T., and Cox J. (2016) The MaxQuant computational platform for mass spectrometry-based shotgun proteomics. Nat. Protoc. 11, 2301–2319 [DOI] [PubMed] [Google Scholar]
- 11. Tsujino T., Seshimo I., Yamamoto H., Ngan C. Y., Ezumi K., Takemasa I., Ikeda M., Sekimoto M., Matsuura N., and Monden M. (2007) Stromal myofibroblasts predict disease recurrence for colorectal cancer. Clin. Cancer Res. 13, 2082–2090 [DOI] [PubMed] [Google Scholar]
- 12. Park J. H., Richards C. H., McMillan D. C., Horgan P. G., and Roxburgh C. S. D. (2014) The relationship between tumour stroma percentage, the tumour microenvironment and survival in patients with primary operable colorectal cancer. Ann. Oncol. 25, 644–651 [DOI] [PMC free article] [PubMed] [Google Scholar]
- 13. Wang X., Mooradian A. D., Erdmann-Gilmore P., Zhang Q., Viner R., Davies S. R., Huang K.-L., Bomgarden R., Tine Van B. A., Shao J., Ding L., Li S., Ellis M. J., Rogers J. C., Townsend R. R., Fenyö D., and Held J. M. (2017) Breast tumors educate the proteome of stromal tissue in an individualized but coordinated manner. Sci. Signal. 10.1126/scisignal.aam8065 [DOI] [PMC free article] [PubMed] [Google Scholar]
- 14. Grassl N., Kulak N. A., Pichler G., Geyer P. E., Jung J., Schubert S., Sinitcyn P., Cox J., and Mann M. (2016) Ultra-deep and quantitative saliva proteome reveals dynamics of the oral microbiome. Genome Med. 8, 44. [DOI] [PMC free article] [PubMed] [Google Scholar]
- 15. Ong S.-E., and Mann M. (2007) Stable isotope labeling by amino acids in cell culture for quantitative proteomics. Methods Mol. Biol. 359, 37–52 [DOI] [PubMed] [Google Scholar]
- 16. Ross P. L., Huang Y. N., Marchese J. N., Williamson B., Parker K., Hattan S., Khainovski N., Pillai S., Dey S., Daniels S., Purkayastha S., Juhasz P., Martin S., Bartlet-Jones M., He F., Jacobson A., and Pappin D. J. (2004) Multiplexed protein quantitation in Saccharomyces cerevisiae using amine-reactive isobaric tagging reagents. Mol. Cell. Proteomics. 3, 1154–1169 [DOI] [PubMed] [Google Scholar]
- 17. Thompson A., Schäfer J., Kuhn K., Kienle S., Schwarz J., Schmidt G., Neumann T., Johnstone R., Mohammed A. K. A., and Hamon C. (2003) Tandem mass tags: a novel quantification strategy for comparative analysis of complex protein mixtures by MS/MS. Anal. Chem. 75, 1895–1904 [DOI] [PubMed] [Google Scholar]
- 18. Li S., Shen D., Shao J., Crowder R., Liu W., Prat A., He X., Liu S., Hoog J., Lu C., Ding L., Griffith O. L., Miller C., Larson D., Fulton R. S., Harrison M., Mooney T., McMichael J. F., Luo J., Tao Y., Goncalves R., Schlosberg C., Hiken J. F., Saied L., Sanchez C., Giuntoli T., Bumb C., Cooper C., Kitchens R. T., Lin A., Phommaly C., Davies S. R., Zhang J., Kavuri M. S., McEachern D., Dong Y. Y., Ma C., Pluard T., Naughton M., Bose R., Suresh R., McDowell R., Michel L., Aft R., Gillanders W., DeSchryver K., Wilson R. K., Wang S., Mills G. B., Gonzalez-Angulo A., Edwards J. R., Maher C., Perou C. M., Mardis E. R., and Ellis M. J. (2013) Endocrine-therapy-resistant ESR1 variants revealed by genomic characterization of breast-cancer-derived xenografts. Cell Rep. 4, 1116–1130 [DOI] [PMC free article] [PubMed] [Google Scholar]
- 19. Zhang X., Claerhout S., Prat A., Dobrolecki L. E., Petrovic I., Lai Q., Landis M. D., Wiechmann L., Schiff R., Giuliano M., Wong H., Fuqua S. W., Contreras A., Gutierrez C., Huang J., Mao S., Pavlick A. C., Froehlich A. M., Wu M.-F., Tsimelzon A., Hilsenbeck S. G., Chen E. S., Zuloaga P., Shaw C. A., Rimawi M. F., Perou C. M., Mills G. B., Chang J. C., and Lewis M. T. (2013) A renewable tissue resource of phenotypically stable, biologically and ethnically diverse, patient-derived human breast cancer xenograft models. Cancer Res. 73, 4885–4897 [DOI] [PMC free article] [PubMed] [Google Scholar]
- 20. Jung S. Y., Choi J. M., Rousseaux M. W. C., Malovannaya A., Kim J. J., Kutzera J., Wang Y., Huang Y., Zhu W., Maity S., Zoghbi H. Y., and Qin J. (2017) An Anatomically Resolved Mouse Brain Proteome Reveals Parkinson Disease-relevant Pathways. Mol. Cell. Proteomics 16, 581–593 [DOI] [PMC free article] [PubMed] [Google Scholar]
- 21. Perkins D. N., Pappin D. J. C., Creasy D. M., and Cottrell J. S. (1999) Probability-based protein identification by searching sequence databases using mass spectrometry data. Electrophoresis 20, 3551–3567 [DOI] [PubMed] [Google Scholar]
- 22. Käll L., Canterbury J. D., Weston J., Noble W. S., and MacCoss M. J. (2007) Semi-supervised learning for peptide identification from shotgun proteomics datasets. Nat. Methods 4, 923–925 [DOI] [PubMed] [Google Scholar]
- 23. Huang K.-L., Li S., Mertins P., Cao S., Gunawardena H. P., Ruggles K. V., Mani D. R., Clauser K. R., Tanioka M., Usary J., Kavuri S. M., Xie L., Yoon C., Qiao J. W., Wrobel J., Wyczalkowski M. A., Erdmann-Gilmore P., Snider J. E., Hoog J., Singh P., Niu B., Guo Z., Sun S. Q., Sanati S., Kawaler E., Wang X., Scott A., Ye K., McLellan M. D., Wendl M. C., Malovannaya A., Held J. M., Gillette M. A., Fenyö D., Kinsinger C. R., Mesri M., Rodriguez H., Davies S. R., Perou C. M., Ma C., Townsend R. R., Chen X., Carr S. A., Ellis M. J., and Ding L. (2017) Proteogenomic integration reveals therapeutic targets in breast cancer xenografts. Nat. Commun. 8, 14864. [DOI] [PMC free article] [PubMed] [Google Scholar]
- 24. Wang X., Codreanu S. G., Wen B., Li K., Chambers M. C., Liebler D. C., and Zhang B. (2018) Detection of Proteome Diversity Resulted from Alternative Splicing is Limited by Trypsin Cleavage Specificity. Mol. Cell. Proteomics 17, 422–430 [DOI] [PMC free article] [PubMed] [Google Scholar]
- 25. Cox J., and Mann M. (2008) MaxQuant enables high peptide identification rates, individualized p.p.b.-range mass accuracies and proteome-wide protein quantification. Nat. Biotechnol. 26, 1367–1372 [DOI] [PubMed] [Google Scholar]
- 26. Qeli E., and Ahrens C. H. (2010) PeptideClassifier for protein inference and targeted quantitative proteomics. Nat. Biotechnol. 28, 647–650 [DOI] [PubMed] [Google Scholar]
- 27. Matthiesen R., Prieto G., Amorim A., Aloria K., Fullaondo A., Carvalho A. S., and Arizmendi J. M. (2012) SIR: Deterministic protein inference from peptides assigned to MS data. J. Proteomics. 75, 4176–4183 [DOI] [PubMed] [Google Scholar]
- 28. Zhang Y., Wen Z., Washburn M. P., and Florens L. (2010) Refinements to label free proteome quantitation: how to deal with peptides shared by multiple proteins. Anal. Chem. 82, 2272–2281 [DOI] [PubMed] [Google Scholar]
- 29. Carrillo B., Yanofsky C., Laboissiere S., Nadon R., and Kearney R. E. (2010) Methods for combining peptide intensities to estimate relative protein abundance. Bioinformatics 26, 98–103 [DOI] [PubMed] [Google Scholar]
- 30. Schwanhäusser B., Busse D., Li N., Dittmar G., Schuchhardt J., Wolf J., Chen W., and Selbach M. (2011) Global quantification of mammalian gene expression control. Nature 473, 337–342 [DOI] [PubMed] [Google Scholar]
- 31. Arike L., Valgepea K., Peil L., Nahku R., Adamberg K., and Vilu R. (2012) Comparison and applications of label-free absolute proteome quantification methods on Escherichia coli. J. Proteomics 75, 5437–5448 [DOI] [PubMed] [Google Scholar]
- 32. Ahrné E., Molzahn L., Glatter T., and Schmidt A. (2013) Critical assessment of proteome-wide label-free absolute abundance estimation strategies. Proteomics 13, 2567–2578 [DOI] [PubMed] [Google Scholar]
- 33. O'Brien J. J., O'Connell J. D., Paulo J. A., Thakurta S., Rose C. M., Weekes M. P., Huttlin E. L., and Gygi S. P. (2018) Compositional Proteomics: Effects of Spatial Constraints on Protein Quantification Utilizing Isobaric Tags. J. Proteome Res. 17, 590–599 [DOI] [PMC free article] [PubMed] [Google Scholar]
- 34. Ow S. Y., Salim M., Noirel J., Evans C., Rehman I., and Wright P. C. (2009) iTRAQ underestimation in simple and complex mixtures: “the good, the bad and the ugly”. J. Proteome Res. 8, 5347–5355 [DOI] [PubMed] [Google Scholar]
- 35. Shirran S. L., and Botting C. H. (2010) A comparison of the accuracy of iTRAQ quantification by nLC-ESI MSMS and nLC-MALDI MSMS methods. J. Proteomics 73, 1391–1403 [DOI] [PMC free article] [PubMed] [Google Scholar]
- 36. Karp N. A., Huber W., Sadowski P. G., Charles P. D., Hester S. V., and Lilley K. S. (2010) Addressing accuracy and precision issues in iTRAQ quantitation. Mol. Cell. Proteomics 9, 1885–1897 [DOI] [PMC free article] [PubMed] [Google Scholar]
- 37. Ting L., Rad R., Gygi S. P., and Haas W. (2011) MS3 eliminates ratio distortion in isobaric multiplexed quantitative proteomics. Nat. Methods 8, 937–940 [DOI] [PMC free article] [PubMed] [Google Scholar]
- 38. Wenger C. D., Lee M. V., Hebert A. S., McAlister G. C., Phanstiel D. H., Westphall M. S., and Coon J. J. (2011) Gas-phase purification enables accurate, multiplexed proteome quantification with isobaric tagging. Nat. Methods 8, 933–935 [DOI] [PMC free article] [PubMed] [Google Scholar]
- 39. McAlister G. C., Nusinow D. P., Jedrychowski M. P., Wühr M., Huttlin E. L., Erickson B. K., Rad R., Haas W., and Gygi S. P. (2014) MultiNotch MS3 enables accurate, sensitive, and multiplexed detection of differential expression across cancer cell line proteomes. Anal. Chem. 86, 7150–7158 [DOI] [PMC free article] [PubMed] [Google Scholar]
Associated Data
This section collects any data citations, data availability statements, or supplementary materials included in this article.
Supplementary Materials
Data Availability Statement
All raw MS and gpGrouper result files have been deposited to the ProteomeXchange Consortium (http://proteomecentral.proteomexchange.org) in the MassIVE repository (MSV000081870) with the data set identifier PXD008560.