

Abstract
Here we present an optimized workflow for global proteome and phosphoproteome analysis of tissues or cell lines that uses isobaric tags (TMT (tandem mass tags)-10) for multiplexed analysis and relative quantification, and provides 3× higher throughput than iTRAQ (isobaric tags for absolute and relative quantification)-4-based methods with high intra- and inter-laboratory reproducibility. The workflow was systematically characterized and benchmarked across three independent laboratories using two distinct breast cancer subtypes from patient-derived xenograft models to enable assessment of proteome and phosphoproteome depth and quantitative reproducibility. Each plex consisted of ten samples, each being 300 μg of peptide derived from <50 mg of wet-weight tissue. Of the 10,000 proteins quantified per sample, we could distinguish 7,700 human proteins derived from tumor cells and 3100 mouse proteins derived from the surrounding stroma and blood. The maximum deviation across replicates and laboratories was <7%, and the inter-laboratory correlation for TMT ratio-based comparison of the two breast cancer subtypes was r > 0.88. The maximum deviation for the phosphoproteome coverage was <24% across laboratories, with an average of >37,000 quantified phosphosites per sample and differential quantification correlations of r > 0.72. The full procedure, including sample processing and data generation, can be completed within 10 d for ten tissue samples, and 100 samples can be analyzed in −4 months using a single LC-MS/MS instrument. The high quality, depth, and reproducibility of the data obtained both within and across laboratories should enable new biological insights to be obtained from mass spectrometry-based proteomics analyses of cells and tissues together with proteogenomic data integration.
Introduction
Genetic alterations in human cancer have been systematically mapped by genomic landscape studies in the past decade, but the direct consequences of these alterations on the functional proteome remain poorly understood. Deep-scale, mass spectrometry (MS)-based proteomic studies by the Clinical Proteomics Tumor Analysis Consortium (CPTAC) program have revealed that integration of proteomic and phosphoproteomic data with genomic data for human tumor samples can improve specificity for identifying cancer-relevant pathways triggered by somatic DNA variants or DNA copy-number alterations, as compared with genomic characterization alone. The proteomics results also serve to elucidate pathways activated by genomic alterations and help to narrow target selection for potential therapeutic intervention1–3.
Various proteomic methods have been developed for global proteome profiling by MS. Typically, proteins are reduced and alkylated to open disulfide bonds and block newly formed and preexisting cysteine side-chain residues. These unfolded proteins are subsequently digested to peptides using the proteolytic enzyme trypsin or LysC followed by trypsin to form tryptic peptides. This approach is referred to by various names, including ‘bottom-up’, ‘discovery’, ‘global’, and ‘shotgun’ proteomics. Methods exist that enable purified or simple mixtures of intact proteins to be analyzed (top down), but these approaches are, at present, inadequate for the comprehensive analysis of complex protein samples derived from cells or tissues4. For global profiling, proteolytic peptides are chromatographically separated in one or two dimensions to enable detection of low-abundance peptides, signals of which would otherwise be suppressed and quantification of which would be affected due to interference by co-isolated high-abundance peptides. One-dimensional or ‘single-shot’ separation methods are typically performed in a label-free manner in which one sample is analyzed at a time, usually with two to three replicate injections to achieve statistical significance for confident detection of lower-abundance proteins5. Using ultra-high-pressure separations on 75-μm inner diameter (i.d.) fused silica columns packed with sub-2 μm C18 packing material and gradient durations of up to 5 h, samples of moderate complexity, such as cancer cell lines, have been analyzed to a depth of ~6,100 proteins when using the standard, conservative metric of at least two unique peptides to identify a protein6.
Solid tumor tissues are compositionally more complex than cell lines, typically consisting of at least epithelial, stromal, and hematologic components. To detect low-abundance proteins such as oncogenes and tumor suppressors in a tumor tissue background or to reach a depth of >9,000 proteins in individual cell-line backgrounds, sample complexity must be reduced before LC-MS/MS. This is most often accomplished using a 2D separation approach involving a mode of off-line chromatography at the peptide level that is orthogonal to the final acidic reversed-phase liquid chromatography separation into the mass spectrometer. A variety of methods have been proposed to accomplish this at the peptide level, including off-gel electrophoresis7, strong cation exchange chromatography8, and high pH/basic reversed-phase chromatography (bRP9). Of these methods, bRP has proven to have the best balance of excellent chromatographic resolution, high peak capacity, reproducible retention times, and orthogonality to low-pH reversed-phase (RP) separation9,10. These properties have also been shown to extend to phosphopeptide separation11. A 2D separation method using bRP as the first dimension of separation, followed by analysis of concatenated fractions by LC-MS/MS, was developed and optimized by groups of the NCI-CPTAC consortium12,13 and others8,14. These sequential high pH/low pH RP separation approaches are equally suited for deep proteome and post-translational modification (PTM) analysis including those of phosphorylation, ubiquitination, and acetylation13. This 2D approach has been demonstrated in our previous work to provide a coverage of >10,000 proteins (at ≥2 peptides per protein) and 26,000 phosphosites per sample in cancer tissues2. Proteins and phosphosites are quantified indirectly by measuring the peptides derived from each protein by enzymatic digestion. Three methods are currently used for protein quantification15,16. In label-free quantification, the response (i.e., observed signal intensity in the mass spectrometer) of peptides or the number of peptide-to-spectrum matches (PSMs; spectral count) of peptides derived from a given protein are used to quantify that protein. In metabolic labeling, heavy isotopically labeled amino acids (typically Arg and Lys) are incorporated into proteins during cell culture (SILAC)15 or a mixture of labeled cell lines is used as an internal standard, a method referred to as ‘super SILAC’17. Up to three states can be typically achieved with SILAC, and up to five can be achieved in specialized SILAC applications18. Relative quantification is accomplished at the MS-1 level by calculating the ratios of the intensity of a given peptide between one label state and another. A limitation of the SILAC method is that humans cannot be labeled, and the multiplex level is therefore limited to two using the super SILAC approach.
The third common method for protein and PTM peptide quantification involves chemical labeling at the peptide level using isobaric mass-tag reagents that react with the free N-termini of peptides, as well as the side-chain primary amine of lysine residues19,20. The two most common reagents are iTRAQ21 and TMT22. The iTRAQ reagents are available as kits with four or eight distinct labels19–21,23. The TMT reagents are available as kits with six or ten distinct labels, meaning that up to ten different samples can be labeled, mixed, fractionated, and analyzed by LC-MS/MS as a single ‘plex’22–25. The differentially labeled peptides have identical (or nearly identical) masses (i.e., they are isobaric), but their relative quantities become distinguishable after fragmentation in the mass spectrometer, which releases the mass tags from the labeled peptides, generating low-mass reporter ions in the MS/MS spectra. Quantification using either the iTRAQ or TMT reagents is based on the relative intensities or ratios of the tags to one another or to a common reference in one of the channels2,3,19–26. Isobaric mass tagging has a number of important advantages relative to either label-free or SILAC methods. First, the isobaric nature of TMT reagents leads to a summation of the abundances of peptides from individual samples. This increases the observed signals for labeled peptides and decreases the amount of any given sample required in a plex roughly by the number of channels in that plex. Second, there are few missing values in each multiplex, as each sequenced peptide can be quantified across all ten states. Third, for the analysis of PTMs, in which the majority of quantification events rely on the quantification of single peptides, isobaric tagging methods have been shown to improve the precision of quantification, whereas label-free methods suffer from high technical variation for PTM applications.
Development of the protocol
The CPTAC consortium has previously published landmark proteogenomic studies utilizing iTRAQ4-plex quantification for high-pH RP global proteome and phosphoproteome profiling that enabled a throughput for deep-scale profiling of 100 tumor samples within 9 months per laboratory2,3. In this detailed protocol, we present an improved method implementing TMT-10 quantification, which increases the throughput threefold relative to iTRAQ4, at similar proteome coverage and with high reproducibility of quantification (Fig. 1a). To study tumor patient cohorts, we typically use one isobaric channel for a common reference sample; therefore, three individual samples can be analyzed in an iTRAQ4-plex experiment and nine samples in a TMT-10-plex experiment. The procedure was developed for tumor samples that were cryo-fractured to particle sizes <100 μm using a device from Covaris (see protocol for details). Typically, a 1–3% weight-by-weight protein yield per wet-weight tissue can be expected with this protocol for breast tumor tissue, but yields can be higher depending on the type of tumor tissue analyzed. Wet weights of 50 mg per tumor sample provide sufficient amounts of total protein in the range of 0.5–1.5 mg for deep-scale proteome and phosphoproteome characterization. Proteins are extracted with an 8 M urea-based extraction buffer, reduced and alkylated, and digested first with LysC endopeptidase and subsequently with trypsin (Fig. 1a). We observed that digestion efficiencies, as measured by missed-cleavage rates, are improved by working with more-concentrated protein extracts, most likely due to the higher enzyme concentrations in these samples (see troubleshooting section). To enable multiplexing, peptide samples are labeled with TMT-10 reagents. The TMT-labeled samples are separated by high-pH reversed-phase liquid chromatography into 96 fractions that are combined in a step-wise manner, into 24 fractions for proteome analysis and 12 fractions for phosphoproteome analysis. Early-, middle-, and late-eluting peptides are combined by mixing every 24th original fraction for the proteome (e.g., combining fractions 1, 25, 49, and so on) and every 12th original fraction for the phosphoproteome analysis (e.g., combining fractions of 1, 13, 25, and so on). This step-wise concatenation strategy further improves the orthogonality of the high-pH and low-pH RP separation steps. A total of 5% by volume of the material is used for proteome analysis, and the remaining 95% of the sample is enriched for phosphopeptides by immobilized affinity chromatography (IMAC) with Fe3+-loaded nitrilotriacetic acid (NTA) beads.
Fig. 1 |. Optimized workflow and experimental design of global proteome and phosphoproteome analysis in tissues using TMT.
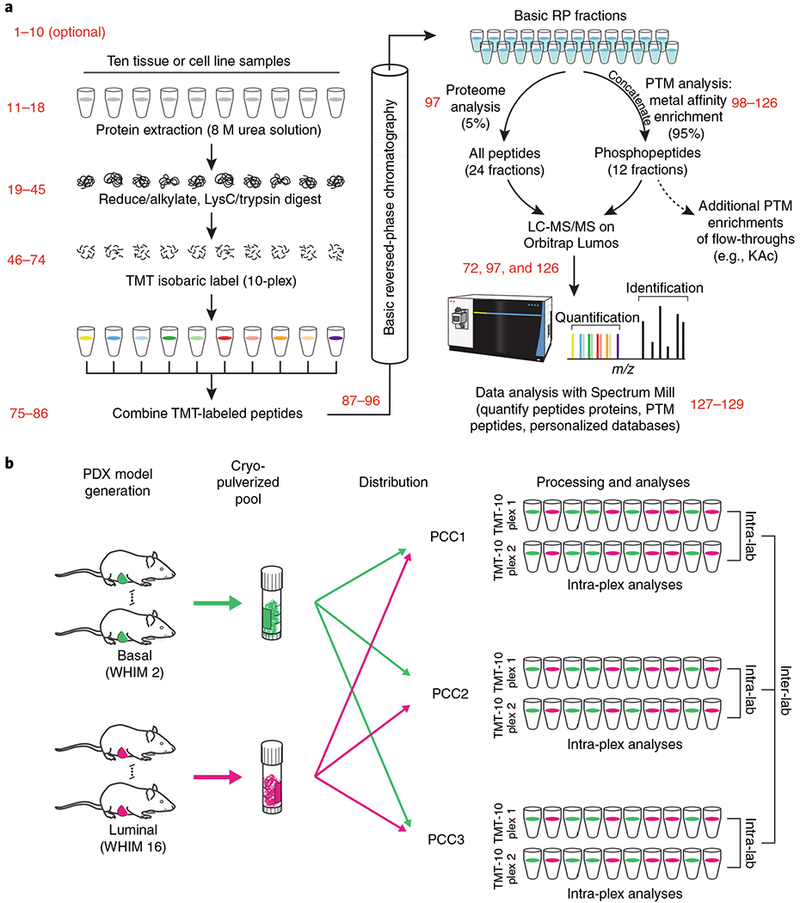
a, Multiple aspects of sample handling were optimized based on a preexisting workflow for global proteome and phosphoproteome analysis (Mertins et al.2). Some of the conditions tested relative to the preexisting workflow were (i) digestion at higher protein concentrations, which effectively increases the enzyme concentration during digestion, resulting in lower missed cleavage rates; (ii) reconstitution of lysyl endopeptidase in water, instead of 50 mM acetic acid, which better maintains the activity of the enzyme; (iii) quantification of peptides by BCA before isobaric labeling, which yields more accurate input amounts than BCA at the protein level; (iv) offline basic RP fractionation using either Agilent or Waters columns, which yield equivalent results; and (v) optimization of HCD energy for each individual instrument, rather than the use of a common collision energy, which improved spectral quality. The relevant steps of the Procedure are indicated in red. b, Multiple mice of basal (WHIM 2) and luminal (WHIM16) subtypes were grown, and the tumors of each subtype were pooled together. Tumors of each subtype from multiple mice were cryofractured and aliquots of the homogenized powders were distributed to the three different laboratories for global proteome and phosphoproteome analysis. Each laboratory analyzed 2× TMT-10 plexes. Intra-plex, intra-lab, and inter-lab comparisons were conducted to test depth of coverage and reproducibility. PCC1–3 indicate Protein Characterization Centers 1 (Broad Institute), 2 (Johns Hopkins University), and 3 (Pacific Northwest National Laboratory), respectively. BCA, bicinchoninic acid; HCD, higher-energy collision dissociation. a Adapted from Extended Data Fig. 1 in ref. 2, Springer Nature.
In the described protocol, off-line, high-pH RP separation is accomplished using standard HPLC equipment and columns packed with 3.5-μm C18 beads, whereas the second, online acidic RP separation uses ultra-high-performance HPLC (UHPLC) instruments and columns packed with 1.9-μm C18 beads. The datasets described in the Anticipated results section were acquired on high-performance Orbitrap Fusion Lumos instruments in three independent laboratories. All three laboratories generated highly reproducible datasets by following this procedure, with coverages of >10,000 proteins (≥2 unique peptides per protein) and >37,000 phosphorylation sites. In studies of human-only breast tumor tissue, we have achieved typical coverage depth of >8,000 proteins per experiment (≥2 unique peptides per protein) and >25,000 phosphorylation sites per experiment using the protocol described here (P.M., L.C.T., K.R.C., D.R.M., F.M. and S.A.C., unpublished data; the data are accessible at https://cptac-data-portal.georgetown.edu/cptac/s/S039?: Study name, ‘CPTAC breast cancer confirmatory study’). The optimized protocol enables deep-scale and reproducible results to be obtained within and across laboratories conducting tissue or cell-line analyses, producing high-quality data for proteogenomic data integration and facilitating proteomics-based pan-cancer studies. Information on how to identify and manage common sources of variability, such as proteolytic digest efficiency and overlabeling with TMT-10 reagents, is also provided.
Applications of the method
Although this protocol was developed for tissue samples, it is also directly applicable to analysis of mammalian cell culture samples. The starting material amounts for 300 μg of peptide per sample/TMT channel described here allow for reproducible generation of deep-scale proteome and phosphoproteome datasets. In addition, the unbound material after phosphopeptide capture (Fig. 1a) can be used for deep lysine acetylation profiling, as has been described previously (refs 13,27). If sample amounts are limited, lower peptide quantities (50–100 μg of peptides per TMT channel) can be used. Reduced amounts do not affect overall proteome coverage or quantification but will reduce phosphoproteome coverage by 20–30% (P.M., L.C.T., K.R.C., D.R.M., F.M. and S.A.C., unpublished data). For proteome quantification, only 0.5–1.0 μg of peptides per bRP fraction is needed to achieve the depth of proteome coverage described here, so for a 24-fraction proteome analysis, typically, a minimum of 50 μg of peptides per TMT-10-plex or 5 μg per sample is needed. The 300-μg amount of input peptide is needed for deep-scale phosphoproteome analysis. Improvements in isobaric tagging chemistries already allow higher degrees of multiplexing, for example, by using TMT-11 reagents, which provide an 11th multiplexing channel. The higher the degree of multiplexing, the more sample fractions and MS time can be dedicated to a given multiplex experiment to increase proteome coverage at a similar time and cost.
Current limitations and future directions
Although the present protocol represents the current state of the art, advances in sample processing, chromatography, and MS technologies, as well as data analysis methods, will inevitably enable this multistep protocol to be improved, including reducing the amount of input protein per sample required to achieve the depth we report. When considering changes to any individual step, it is critical to consider the impact on the entire protocol in terms of sensitivity, dynamic range, throughput, speed, cost, time, and other relevant factors.
Not every possible sample-processing variable was examined in this study, and it is possible that further refinements resulting in additional incremental improvements can be realized. Many such process modifications will represent tradeoffs, however. For example, increasing the temperature at which enzymatic digestions are carried out could decrease the overall time required for digestion and decrease the percentage of missed cleavages observed. However, the extent of carbamylation of peptide N termini and lysines will also certainly increase at elevated temperatures, and this may have an effect on quantification. Similarly, the higher-multiplex reagents that are becoming available will further increase sample-analysis throughput, albeit at some to-be-determined cost to depth of proteome and phosphoproteome coverage23.
The described protocol benefits from the use of UHPLC in the second separation dimension, but the first dimension high-pH RP separation is performed using conventional HPLC instrumentation. Further improvements in semipreparative column technology with smaller bead sizes and the use of the latest high-flow UHPLC instrumentation may enhance the separation power and increase the uniqueness per fraction to greater than the 75% achieved here (Supplementary Fig. 1). The more unique each peptide fraction is, the more efficiently each individual fraction’s LC-MS/MS run contributes to the unique peptide count of the overall experiment.
The number of fractions collected per sample gates the overall analysis throughput, so reducing this number is highly desirable. Maintaining the sensitivity of the online LC-MS/MS analysis when analyzing fewer first-dimension high-pH RP fractions would require both increased peak capacity of the online column (e.g., through the use of smaller-dimension packing material or a longer online column) and loading of more peptide weight per fraction to maintain the same total weight of peptides used in the overall analysis. Reducing the number of fractions analyzed by LC-MS/MS would reduce the number of MS/MS spectra acquired and would thereby diminish the depth of coverage, unless the repeat peptide observation rate falls, the MS/MS interpretation rate rises, or the MS/MS scan rate increases.
TMT-labeling chemistry can result in low levels of overlabeling, whereby an additional TMT label is incorporated into peptides via O-acylation of Ser, Thr, and Tyr sites with a nearby His residue, which increases the nucleophilicity of the side-chain hydroxyl group via hydrogen bonding with the histidyl imidazole group28,29. We do not routinely allow for these variable modifications in our database searches because allowing for overlabeling substantially increases the search space (3–10×). Instead, we are working to routinely measure the extent of overlabeling present and adjust our TMT-labeling methodology to diminish the overlabeling rate. Adjustments in the labeling reaction conditions, such as use of lower pH, use of ethanol instead of acetonitrile in the labeling step, decreased TMT reagent-to-substrate ratios, and/or shorter reaction times, may lead to a decrease in the proportion of MS/MS spectra attributable to overlabeling.
Multiplexed reporter-ion quantification in MS2 mode provides many advantages, as listed above, and new chemistries enabling even higher levels of multiplexing beyond 11 plex are anticipated. However, some limitations have been noted. The reagents are expensive, but lower-cost alternatives that match the multiplex level are not currently available. The tags also increase the overall charge state of the labeled peptides, which can decrease identification rates, relative to label-free methods30. Most importantly, the accuracy of quantification is distorted by co-isolation phenomena31. Reporterion signals for a peptide of interest are contributed to by not only the primary precursor ion isolated but also background signals with similar m/z values that are co-isolated. Co-isolation correction approaches have been described32, but these need to be further improved to enhance the accuracy of TMT ratio-based quantification. Strategies to mitigate this effect include decreasing the sample and background complexity by extensive fractionation, decreasing the isolation m/z window size before MS2 scans, using MS3 fragmentation strategies33, and, very importantly, designing TMT experiments and using TMT datasets in ways that compensate for co-isolation problems.
Other foreseeable data acquisition methods may also diminish co-isolation problems. Ion mobility (IM) is a gas-phase ion separation method that separates ions on a millisecond time scale before the microsecond time scale MS analyses that occur in the mass spectrometer34. The addition of FAIMS (field asymmetric ion mobility spectrometry), which is already commercially available, to the front end of current high-performance MS instruments can improve the accuracy of quantification using isobaric labeling methods by discriminating against singly charged interferences. This and other potential advantages of FAIMS in the context of proteomics experiments have been described35. In the future, devices such as SLIM (structures for lossless ion manipulations36) may provide even higher sensitivity, resolution, and speed, as compared with current devices. Diminished co-isolation and increased sensitivity should also be achievable by increasing the chromatographic resolution of the online chromatography with longer columns, more efficient and uniform column packing, or use of smaller bead sizes to the extent the column back pressure can be handled by the LC pumping system. Narrower chromatographic peaks should increase sensitivity and decrease the spectrum acquisition rate by increasing each peptide’s effective concentration at its chromatographic peak apex.
Experimental design
One of the greatest advantages of isotopic labeling techniques in MS is that peptides in multiplexed samples are measured simultaneously, limiting the effect of detection and quantification interference by variable background signals that is observed in label-free experiments. For this reason, we primarily use TMT quantification as a relative quantification technique. Samples of interest are directly referenced to other samples or internal reference samples within the same multiplexed experiments, and intensity ratios are used for all following analyses. The use of internal reference samples is of particular use for larger sample cohorts, as has been demonstrated in our previous analysis of 80 breast tumor samples2 and 174 ovarian cancer samples3. Internal reference samples should be designed to contain the average protein concentrations of all different sample types to be investigated in a cohort of multiplexed experiments. To avoid batch effects, all different constituent sample types should be evenly distributed across multiple TMT-plex experiments. It is also important to consider the effects of isotopic impurities that lead to reporter intensity cross-contributions of up to 5% to neighboring TMT channels. Correction approaches for isotopic impurities based on the impurity factors provided by the manufacturer have been previously described37 and were adapted here for TMT-10 applications. Additional caution should be applied when samples of extremely different compositions, such as human and xenograft tumors, are placed in the same multiplexed experiments.
To resolve and accurately measure the near-isobaric N- and C-labeled reporter ions in the TMT-10 reagents, the instrument used must be able to achieve a minimum MS/MS resolution of 50,000 at m/z 150. Compatible instruments include the Thermo QE series of mass spectrometers (QE, QEplus, QE-HF, and QE-HF-X), as well as the Fusion and Lumos instruments also from Thermo. The QE series of instruments lack the linear ion trap that constitutes the ‘back-end’ of the Fusion and Lumos Tribrid mass spectrometers. As the linear trap portion of the Lumos was not used in this protocol, the less expensive QE series instruments may be used, with results differing depending on the model employed. Of the QE systems, only the QE-HF-X has what is effectively the same ion optical front end as the Lumos, and therefore results obtained when using this instrument are expected to be of similar depth and overall quality and reproducibility as those obtained when using the Lumos in the manner described in this protocol, provided that the data acquisition control feature ‘advanced peak determination’ (APD) can be turned off, to minimize the acquisition of MS/MS spectra with co-isolated precursors.
Some instrument types, such as orthogonal time-of-flight mass spectrometers, may not have sufficient mass resolution and therefore may not be compatible with the use of TMT-10 reagents. In such cases, a lower multiplex reagent such as TMT-6 that does not have as high a resolution requirement may be used, with consequent decrease in overall sample analysis throughput as well as differences in the depth of analysis.
Materials
Reagents
Cells or tissue samples. The patient-derived xenograft tumors used in this study were from previously established basal (WHIM2) and luminal (WHIM16) breast cancers2. The xenograft tumors were grown subcutaneously in 8-week-old NOD.Cg-Prkdescid Il2rgtm1Wjl/SzJ mice (Jackson Laboratories, strain code 005557). All patient-derived xenograft (PDX) models are available through the application from the Human and Mouse-Linked Evaluation of Tumor’s Core at http://digitalcommons.wustl.edu/ hamlet/. Xenograft tumors were grown in multiple animals. Tumor pieces for each subtype were cryopulverized, and the tissue powder was mixed in an aluminum weighing boat on dry ice, as previously described2. Tissue was stored at −80 °C until shipment on dry ice to each of the three participating laboratories. A sufficient amount of material was generated for all three laboratories for the duration of the project to prevent batch effects with regard to the xenograft material generation. Full proteome and phosphoproteome process replicates for each of the two xenografts were prepared as described in this study. The details for preparing bulk cryopulverized tissue in a sustained frozen state can be found in the supplementary methods of Mertins et al.2 ! CAUTION Informed consent must be in place when using patient tissues. Human material should be handled in a Biosafety Level 2 (or higher) environment and with strict attention to Biosafety Level 2 procedures. Refer to the Centers for Disease Control website (http://www.cdc.gov/biosafety/publications/bmbl5/BMBL5_sect_IV.pdf) for additional information ! CAUTION All experiments with live mice should be performed according to institutional and national regulations. The procedures in this protocol were reviewed and approved by the institutional animal care and use committee at Washington University in St. Louis.
Urea (Sigma-Aldrich, cat. no. U0631–1KG; or Thermo Scientific, cat. no. 29700–1KG) ! CAUTION Urea is a health hazard level 2 compound. Avoid contact with skin and eyes, and avoid inhalation.
Tris (hydroxymethyl) aminomethane hydrochloride (Tris-HCl; Ambion, cat. no. AM9855G; or Sigma-Aldrich, cat. no. T2694–1L) ! CAUTION Tris-HCl is a health hazard level 2 compound. Avoid contact with skin and eyes, and avoid inhalation.
Sodium chloride (NaCl; Sigma-Aldrich)
Ethylenediaminetetraacetic acid (EDTA; Sigma-Aldrich, cat. no. E7889) ! CAUTION EDTA is a health hazard level 1 compound. Avoid contact with skin and eyes, and avoid inhalation.
Aprotinin (Sigma-Aldrich, cat. no. A610)
Sodium fluoride (NaF; Sigma-Aldrich, cat. no. S7920) ! CAUTION NaF is a health hazard level 3 compound. Avoid contact with skin and eyes, and avoid inhalation.
Leupeptin (Roche, cat. no. 11017101001)
PMSF (Sigma-Aldrich, cat. no. 93482)
Phosphatase inhibitor cocktail 2 (Sigma-Aldrich, cat. no. P5726)
Phosphatase inhibitor cocktail 3 (Sigma-Aldrich, cat. no. P0044)
O-(2-Acetamido-2-deoxy-D-glucopyranosylidenamino) N-phenylcarbamate (PUGNAc; Sigma-Aldrich, cat. no. A7229)
DTT (Pierce, cat. no. 20291) ! CAUTION DTT is a health hazard level 2 compound. Avoid contact with skin and eyes, and avoid inhalation.
Iodoacetamide (IAM; Sigma-Aldrich, cat. no. A3221) ! CAUTION IAM is a health hazard level 3 compound with a reactivity level of 1. Avoid contact with skin and eyes, and avoid inhalation.
Lysyl endopeptidase (LysC; Wako Chemicals, cat. no. 129–02541)
Sequencing-grade modified trypsin (500 μg per vial or 5 × 20 μg per vial; Promega, cat. no. V511X or V5113)
BCA bicinchoninic acid Protein Assay Kit (Pierce, cat. no. 23225)
Formic acid (FA; Sigma-Aldrich, cat. no. 56302) ! CAUTION FA is a health hazard level 4 compound with a flammability level of 3. Avoid contact with skin and eyes, and avoid inhalation. Use it in a well-ventilated area per MSDS recommendations. Store at room temperature (RT; 25 °C) for up to 6 months.
Trifluoroacetic acid (TFA; Sigma-Aldrich, cat. no. 91707) ! CAUTION TFA is a health hazard level 3 compound with a flammability level of 1 and reactivity of 1. Avoid contact with skin or eyes, and avoid inhalation.
Acetonitrile (MeCN; J.T. Baker, cat. no. 9829–03) ! CAUTION MeCN is a health hazard level 4 compound with a flammability level of 2. Avoid contact with skin and eyes, and avoid inhalation. Store and use it in a well-ventilated area per MSDS recommendations. Store at RT for up to 6 months. ▲ CRITICAL Requires LC/MS-grade quality.
Methanol (MeOH; Fluka, cat. no. 34966) ! CAUTION MeOH is a health hazard level 1 compound with a flammability level of 3 and an instability/reactivity level of 0. Avoid contact with skin and eyes, and avoid inhalation. Store and use it in a well-ventilated area per MSDS recommendations. Store at RT for up to 6 months.
Ammonium hydroxide solution (28% (wt/vol) NH4OH; Sigma-Aldrich, cat. no. 338818) ! CAUTION Ammonium hydroxide is a health hazard level 4 compound. Avoid contact with skin and eyes, and avoid inhalation.
HPLC-grade water (J.T. Baker, cat. no. 4218–03)
TMT-10 Reagent Kit (Thermo Fisher Scientific, cat. no. 90046)
HEPES (0.5 M buffer solution, pH 8.5, liquid; Alfa Aesar, cat. no. J63218)
50% (vol/vol) Hydroxylamine solution (Sigma-Aldrich, cat. no. 467804) ! CAUTION A 50% (vol/vol) hydroxylamine solution is a health hazard level 2 compound. Avoid contact with skin or eyes, and avoid inhalation.
Acetic acid, glacial (EMD Millipore, cat. no. AX0074–6) ! CAUTION Acetic acid is a health hazard level 3 compound with a flammability level of 2 and reactivity of 0. Avoid contact with skin or eyes, and avoid inhalation.
mColorpHast pH test strips (5–10 range; VWR, cat. no. EM1.09533.0001)
Ni-NTA superflow agarose beads (Qiagen, cat. no. 30410)
Iron (III) chloride (Sigma-Aldrich, cat. no. 451649) ! CAUTION Iron (III) chloride is a health hazard level 2 compound. May be corrosive to metals. Avoid contact with skin or eyes, and avoid inhalation/ingestion.
Potassium phosphate, dibasic (Sigma-Aldrich, cat. no. P3786)
Potassium phosphate, monobasic (Sigma-Aldrich, cat. no. P0662)
Ethanol (EtOH; Sigma-Aldrich, cat. no. 270741) ! CAUTION EtOH is a health grade level 2 compound with a flammability level of 3 and reactivity level of 0.
Synthetic peptide standards: we use an in-house set of synthetic peptides (Reagent setup), but commercial peptide standard alternatives include the Pierce Peptide Retention Time Calibration Mixture (Thermo Fisher Scientific, cat. no. 88320) or custom synthetic peptides from commercial vendors such as New England Peptide.
ReproSil-Pur (120 A, C18-AQ, 1.9-μm resin; Dr. Maisch, cat. no. r119.aq)
Equipment
Needle to make stage tips (laboratory pipetting needles with 90° blunt ends, 16-gauge, 2-inch length; Cadence Science, cat. no. 7938)
Puncher to make stage tips
Tubing (PEEK, 25 μm × 1/32 × 5 feet, natural; Idex Health & Science, cat. no. 1567)
Stage-tip C18 material (solid-phase C18 extraction disks, diam. = 47 mm, 20 pack; Empore, cat. no. 66883-U)
Adapter for stage tipping (Glygen, cat. no. CEN.24)
BCA plate (96-well microplate, flat bottom, clear; Greiner Bio-One, cat. no. 655101)
SepPak tC18 3cc Vac cartridges (200 mg of sorbent per cartridge; Waters Technologies, cat. no. WAT054925)
Offline HPLC system (Agilent, 1100 series HPLC instrument or similar)
Offline HPLC column (3.5-μm, 4.6 × 250 mm; Agilent, model no. Zorbax 300 Extend-C18)
Offline fractionation plate (96-well, 2-ml polypropylene, round-bottom; Whatman Microplate Devices Uniplate, cat. no. 7701–5200)
1-ml Autosampler vial for bRP (National Scientific, cat. no. C4010–14)
1-ml Autosampler cap for bRP (National Scientific, cat. no. C4010–55A)
LC system for online LC-MS analysis (Easy Nano liquid chromatography instrument, Thermo Fisher Scientific, model no. EASY-nLC 1200, or similar) ▲ CRITICAL We use a Proxeon Easy-nLC 1200 and operate under ultra-performance liquid chromatography (UPLC) conditions. However, any LC system that can deliver nanoflow rates and can operate up to a pressure of 1,000 bar can be used for peptide separation.
MS system for online LC-MS analysis (Thermo Fisher Scientific, Orbitrap Fusion Lumos model) ▲ CRITICAL Although we use an Orbitrap Fusion Lumos, other LC-MS/MS systems could be used, as long as they have sufficient resolution in MS/MS mode to resolve the low-mass N and C series TMT-10 reporter ions. To resolve and accurately measure the near-isobaric N- and C-labeled reporter ions in the TMT-10 reagents, the instrument used must be able to achieve a minimum MS/MS resolution of 50,000 at m/z 150. Compatible instruments include the Thermo Fisher Scientific QE series of mass spectrometers (QE, QEplus, QE-HF, and QE-HF-X), as well as the Fusion and Lumos instruments also from Thermo Fisher Scientific. If the data acquisition control feature APD is present, it should be turned off to minimize the acquisition of MS/MS spectra with co-isolated precursors.
PicoFrit column (360-μm outer diameter (o.d.) × 75-μm i.d., 10-μm i.d. tip, 50-cm length; New Objective, cat. no. PF360–75-10-N-5)
300-μl Autosampler vial for LC-MS (Waters, cat. no. 186002639)
300-μl Autosampler cap for LC-MS (Waters, cat. no. 186000305)
20-cm Nanospray column heater (Phoenix S&T, cat. no. PST-CH-20U)
Column heater controller (Phoenix S&T, cat. no. PST-CHC)
Vacuum centrifuge (Electron Savant SpeedVac Concentrator; Thermo Fisher Scientific, model no. SPD121P)
Lyophilizer (Freezone 4.5; Labconco, cat. no. 7750020)
Vortex (Scientific Industries, model no. Vortex-Genie 2)
Incubator shaker (New Brunswick, model no. 22331)
Shaker (Thermomixer; Eppendorf, model no. C1213)
Tabletop centrifuge (Galaxy Mini; VWR, model no. C1213)
Tubes (microtubes, polypropylene; 1.5 ml, 2.0 ml, and 1.5 ml with cap; Sarstedt, cat. nos. 72.607, 72.693, 72.692)
Cryopulverizer (Covaris, model no. CP02 cryoPREP Impactor)
Tissue bags (tissueTUBE TT1 and tissueTUBE TT1 plug) (Covaris, cat. nos. 520001, 520006)
Software
Spectrum Mill MS Proteomics Workbench v6.0 (Agilent Technologies, https://www.agilent.com/en/ products/software-informatics/masshunter-suite/masshunter-for-life-science-research/spectrum-mill) ▲ CRITICAL Although we used Spectrum Mill, other software packages can be used that support the identification and quantitation of high-resolution LC-MS/MS with TMT-10 reagents. Throughout the data analysis portions of the protocol, we have tried to explain the metrics, parameters, and approaches that may be somewhat different in other software packages.
All mass spectra contributing to this study can be downloaded in the original instrument vendor format from: https://cptac-data-portal.georgetown.edu/cptac/s/S036 for the study name ‘reproducible workflow for multiplexed deep-scale analysis of the proteome and phosphoproteome of tumor tissues by LC-MS’.
Reagent setup
Stock solutions for lysis buffer
Stock solutions are: 1 M Tris HCl (pH 8.0), 1 M NaCl, 500 mM EDTA, 1 mg/ml aprotinin, 2 mg/ml leupeptin, 100 mM PMSF in ethanol, 1 M NaF, Phosphatase Inhibitor Cocktail 2, Phosphatase Inhibitor Cocktail 3, 14 mM PUGNAc. Stock solutions for lysis buffer can be made in advance and stored for up to 6 months, if stored properly. 1 M Tris-HCl (pH 8.0), 1 M NaCl, and 500 mM EDTA can be stored at RT for up to 12 months. 1 mg/ml aprotinin, 1 M NaF, and Phosphatase Inhibitor Cocktail 2 can be stored at 4 °C for up to 6 months. 2 mg/ml leupeptin, 100 mM PMSF in ethanol, 14 mM PUGNAc, and Phosphatase Inhibitor Cocktail 3 can be stored at −20 °C for up to 6 months.
Urea lysis buffer
Urea lysis buffer contains 8 M urea, 75 mM NaCl, 50 mM Tris (pH 8.0), 1 mM EDTA, 2 μg/ml aprotinin, 10 μg/ml leupeptin, 1 mM PMSF, 1:100 (vol/vol) Phosphatase Inhibitor Cocktail 2, 1:100 (vol/vol) Phosphatase Inhibitor Cocktail 3, 10 mM NaF, and 20 μM PUGNAc. ▲ CRITICAL Urea lysis buffer should be made fresh each time immediately before use. Make sure that the urea goes into solution before adding the additional enzymes. Add aprotinin, leupeptin, PMSF, NaF, Phosphatase Inhibitor Cocktail 2, Phosphatase Inhibitor Cocktail 3, and PUGNAc to the urea solution while it is on ice. Do not vortex after adding the additives. Swirling is sufficient. In addition, the additives should be added only immediately before use. The solution should be kept on ice once the additives are added.
BSA curve for BCA protein assay
Using the 2 mg/ml albumin stock included in the Pierce BCA Protein Assay Kit, make a serial dilution curve with HPLC-grade water. The 8-point curve we use includes albumin concentrations of 2 mg/ml, 1.5 mg/ml, 1.0 mg/ml, 0.75 mg/ml, 0.5 mg/ml, 0.25 mg/ml, 0.125 mg/ml, and 0.0625 mg/ml. The BSA curve can be made in advance and stored at 4 °C for up to a year.
Preparation of digestion enzymes
Dissolve lyophilized 10 AU Wako LysC in 20 ml of HPLC water for a final concentration of 0.5 AU/ml. Reconstituted LysC should be stored at −80 °C, can be made in advance, and is stable in storage for up to 6 months. Promega-sequencing grade modified trypsin can be purchased as 5 × 20-μg vials at 0.5 μg/μl already reconstituted in 50 mM acetic acid. To facilitate larger digestion batches and avoid pooling multiple small tubes together, we place a custom order of trypsin with Promega, in which the trypsin is in 500-μg aliquots at 0.5 μg/μl in 50 mM acetic acid solution. Reconstituted trypsin should be stored at −80 °C and is stable in storage for up to a year.
Solid-phase extraction desalting solvents
A total of 100% (vol/vol) MeCN is used for conditioning. The solvents for equilibration and washing the cartridge are 0.1% (vol/vol) TFA and 1% (vol/vol) FA. The elution solvent is 50% MeCN/0.1% (vol/vol) FA. Solid-phase extraction (SPE) desalting solvents can be made in advance and stored at RT, and are stable for up to a year.
Stage-tip desalting solvents
Solvent A for equilibration and washing is 0.1% (vol/vol) FA. Solvent B for elution is 50% (vol/vol) MeCN/0.1% (vol/vol) FA. Stage-tip desalting solvents can be made in advance and stored at RT, and are stable for up to a year.
Ammonium formate (NH4HCO2) stock solution (pH 10) for basic-pH RP solvents
To make 1 liter of 180 mM ammonium formate, add 25 ml of 28% (wt/vol) ammonium hydroxide (density 0.9 g/ml) to ~500 ml of HPLC-grade water, then add ~45 ml of 10% (vol/vol) FA to titrate the pH to 10.0, and then bring the final volume to 1 liter with HPLC-grade water. Ammonium formate stock solution is stable for up to a year at RT; check the pH before use to prepare basic-pH RP solvents.
Basic-pH RP solvent A
Basic-pH RP solvent A is 4.5 mM ammonium formate (pH 10) in 2% (vol/vol) acetonitrile. To make 1 liter, add 25 ml of ammonium formate stock solution (pH 10) and 20 ml of acetonitrile (2% (vol/vol)) to 955 ml of water. Basic RP solvents are stable at RT for up to 2 weeks.
Basic-pH RP solvent B
Basic-pH RP solvent B is 4.5 mM ammonium formate (pH 10) in 90% (vol/vol) acetonitrile. To make 1 liter, add 25 ml of ammonium formate stock solution (pH 10) and 900 ml of acetonitrile (90% (vol/vol)) to 75 ml of water. Basic RP solvents are stable at RT for up to 2 weeks. ▲ CRITICAL The ionic strength of solvents A and B, ~5 mM, is deliberately low, so that collected fractions can be readily desalted by vacuum centrifugation and are compatible with the subsequent IMAC-enrichment step of the protocol.
Synthetic peptide standards
Selection of synthetic peptides should be based on their availability as well as their chromatographic behavior, such as retention times spanning the duration of the gradient. For example, tryptic peptides of 10–15 amino acids in length with good solubility in aqueous buffer and consistent elution behavior on RP C18 are ideal. We choose peptides that are either from a different species than our sample of interest or are isotopically labeled with heavy amino acids to reduce any contamination in subsequent runs on the column. In addition, column back pressure is informative for system performance. For this scale and configuration, back pressure for the 4.6-mm i.d. columns at 1 ml/min flow is typically in the 180–220 bar range. The synthetic peptide standards can be stored dry at −80 °C indefinitely.
Solvents for conditioning and equilibrating the stage tips during IMAC
These include 100% (vol/vol) MeOH, 50% (vol/vol) MeCN/0.1% (vol/vol) FA, and 1% (vol/vol) FA. Solvent for binding and washing agarose beads is 80% (vol/vol) MeCN/0.1% (vol/vol) TFA. The stage-tip elution buffer is 50% (vol/vol) MeCN/0.1% (vol/vol) FA. The stage-tip solvents are stable for up to a year at RT.
Agarose-bead elution buffer
To make 500 ml of 500 mM potassium phosphate buffer, combine 96.25 ml of 1 M monobasic potassium phosphate with 153.75 ml of dibasic potassium phosphate in 250 ml of HPLC water. Monobasic and dibasic potassium phosphate stock solutions are stable for up to a year at RT. The 500 mM potassium phosphate buffer is stable for up to 6 months at RT.
Ten mM iron (III) chloride solution
Dissolve solid iron (III) chloride in HPLC water; this solution should be made fresh immediately before use. The agarose-bead slurry solution consists of acetonitrile, methanol, and 0.01% (vol/vol) acetic acid in a 1:1:1 ratio by volume, which can be made in advance and stored at RT for up to year.
UPLC-MS/MS solvents
Solvent A is 3% (vol/vol) MeCN/0.1% (vol/vol) FA and solvent B is 90% (vol/vol) MeCN/0.1% (vol/vol) FA. UPLC solvents are stable for up to a month at RT.
Nanoflow C18 column
The nanospray column for online UPLC-MS/MS analysis is self-packed into a 75-μm i.d. PicoFrit column with ReproSil-Pur 120 A, C18-AQ, 1.9 μm to a length of 20–24 cm using a pressure bomb set to 950 p.s.i. These columns can be stored at RT for up to 3 months without drying out.
Equipment setup
Basic RP chromatography blank gradient
A timetable summarizing the gradient used for conditioning the column before the injection of the sample at flow rate of 1 ml/min (Step 90) is given below.
| Time interval (min) | Gradient (%B) |
|---|---|
| 0 | 60 |
| 2 | 0 |
| 4 | 0 |
| 19 | 100 |
| 21 | 100 |
| 22 | 0 |
| 24 | 0 |
| 39 | 100 |
| 41 | 100 |
| 42 | 0 |
| 70 | 0 |
Basic RP chromatography label-free/iTRAQ-labeled sample gradient
A timetable summarizing the gradient used for fractionation of iTRAQ-labeled sample at a flow rate of 1 ml/min (Step 90) is given below.
| Time interval (min) | Gradient (%B) |
|---|---|
| 0 | 0 |
| 9 | 0 |
| 13 | 6 |
| 63 | 28.5 |
| 68.5 | 34 |
| 81.5 | 60 |
| 90 | 60 |
Basic RP chromatography TMT-labeled sample gradient
A timetable summarizing gradient used for fractionation of TMT-labeled sample at a flow rate of 1 ml/min (Step 94) is given below.
| Time interval (min) | Gradient (%B) |
|---|---|
| 0 | 0 |
| 7 | 0 |
| 13 | 16 |
| 73 | 40 |
| 77 | 44 |
| 82 | 60 |
| 96 | 60 |
UPLC-MS RP chromatography gradient
A timetable summarizing the gradient for LC-MS/MS analysis of label-free samples, TMT-labeled basic RP fractions, and TMT-labeled phosphorus-enriched fractions (Steps 44, 72, 97, and 126) is given below.
| Time interval (min) | Gradient (%B) | Flow rate (nl/min) |
|---|---|---|
| 0 | 2 | 200 |
| 1 | 6 | 200 |
| 85 | 30 | 200 |
| 94 | 60 | 200 |
| 95 | 90 | 200 |
| 100 | 90 | 200 |
| 101 | 50 | 500 |
| 110 | 50 | 500 |
Orbitrap Fusion Lumos MS/MS method
MS parameters used for the LC-MS/MS analysis of label-free samples (Step 44) are given below.
| Parameter | Value |
|---|---|
| Polarity | Positive |
| Full MS | |
| Microscans | 1 |
| Orbitrap resolution | 60,000 m/Δ(m) at 200 m/z |
| Automatic Gain Control (AGC) target | 4 × 10⁵ ion counts |
| Maximum ion time | 50 ms |
| Scan range | 350–1,800 m/z |
| Data-dependent dd-MS2 | |
| Microscans | 1 |
| Detector type | Orbitrap |
| Orbitrap resolution | 15,000 m/delta(m) at 200 m/z |
| AGC target | 5 × 10⁴ ion counts |
| Maximum ion time | 50 ms |
| Number of dependent scans | 20 |
| Isolation window | 0.7 m/z |
| Fixed first mass | 110 m/z |
| Activation type | Higher-energy collision dissociation (HCD) |
| HCD energy (%) dd settings | 34 |
| Charge exclusion | Include 2–6 charge states |
| Peptide match | Preferred |
| Exclude isotopes | On |
| Dynamic exclusion | 45 s |
Orbitrap Fusion Lumos MS/MS method
MS parameters used for the LC-MS/MS analysis of TMT-labeled fractionated and phospho-enriched samples (Steps 72, 97, and 126) are given below.
| Parameter | Value |
|---|---|
| Polarity | Positive |
| Full MS | |
| Microscans | 1 |
| Orbitrap resolution | 60,000 |
| AGC Automatic Gain Control target | 4 × 10⁵ ion counts |
| Maximum ion time | 50 ms |
| Scan range | 350–1,800 m/z |
| dd-MS2 | |
| Microscans | 1 |
| Detector type | Orbitrap |
| Orbitrap resolution | 50,000 (TMT-10) |
| AGC target | 1 × 10⁵ ion counts |
| Maximum ion time | 105 ms |
| Cycle time: time between master scans | 2 s |
| Isolation window | 0.7 m/z |
| Fixed first mass | 110 m/z |
| Activation type | Higher-energy collision dissociation (HCD) |
| HCD energy (%) dd settings | 38 (TMT) |
| Monoisotopic peak determination | Peptide |
| Charge exclusion | Include 2–6 charge states |
| Exclude isotopes | On |
| Dynamic exclusion | 20 s |
▲ CRITICAL The performance of the combined LC-MS/MS system must be evaluated before the analysis of any precious biological materials such as tissue samples. It is difficult to be prescriptive, as each laboratory will have its own metrics for optimal instrument performance. System performance is typically evaluated relative to the maximum obtainable system performance previously established, using a highly complex sample such as a cell-line digest that can be repeatedly produced or purchased. System performance is typically evaluated using single-shot analyses and a set gradient duration (e.g., 60–90 min). The number of peptides obtained under these conditions is compared to prior ‘best performance’ to ascertain if the system is usable. A decrease on the order of 15–20% in the number of peptides identified indicates that either the column, LC, or MS is underperforming and probably needs adjustment or maintenance. The overall appearance of the chromatogram, including start and end times for eluting peptides and chromatographic peak width, as compared with that obtained when the system is operating well, can help to determine if the problem is with chromatography (LC or column) or the mass spectrometer. ▲ CRITICAL To resolve C and N series reporter ions for the TMT-10-labeling strategy, 50,000 at 200 m/z resolution is used for MS2. ▲ CRITICAL To minimize the acquisition of MS/MS spectra with co-isolated precursors, the data acquisition control feature, APD, should be turned off. ▲ CRITICAL Each center optimized the collision energy for its own instrument. The listed collision energy is one center’s value and can be used as a benchmark to further optimize individual instruments. To achieve optimal fragmentation of TMT-labeled peptides, collision energy should be optimized on the instrument used for analyses of those samples.
Procedure
(Optional) Cryopulverization of tissue blocks ● Timing 2.5 h for ten non-OCT tissue blocks; 3.5 h for ten OCT tissue blocks.
! CAUTION We recommend that Steps 1–10 be performed in a chemical hood to protect against unintended exposure to tissue fragments.
▲ CRITICAL If working with frozen cell pellets or already-cryopulverized tissue, Steps 1–10 can be skipped. If the frozen tissue blocks are not embedded in optimal-cutting temperature compound (OCT), skip Steps 1–4.
Precool a sterile, unopened Petri dish on dry ice.
Starting with a tissue block embedded in OCT, unwrap the packaging and place the block on the Petri dish. Do not open the Petri dish until immediately before starting this procedure.
-
Dip a clean, sterile scalpel into liquid nitrogen for 10 s and then use it to shave-off slices of OCT away from the tissue block. Dip a pair of tweezers into liquid nitrogen for 10 s every few minutes to use to hold the tissue block down while cutting away the OCT slices. Before freezing the tweezers each time, first clean them with 70% (vol/vol) EtOH.
▲ CRITICAL STEP The first few slices will be difficult to make because the OCT block may be too frozen. Sometimes it is helpful to wait for 15 s for the outer layers of OCT to become softer before proceeding to cut. Attempting to make cuts while the OCT block is still rock-solid frozen may lead to sample losses and could possibly introduce contamination because the tissue block may flip out of the Petri dish.
Slice the OCT away until the OCT constitutes <10% of the sample by volume. Any more than that risks the loss of too much tissue material. Use a new, freshly cooled scalpel every few cuts to ensure that the scalpel itself is not unnecessarily warming the sample.
-
Once a satisfactory amount of OCT has been cut away from the tissue block, clean and refreeze the tweezers, then use them to put the tissue block into a precooled Covaris cryopulverization bag. If the tissue block is too big, first cut the tissue block in half or thirds so that the tissue blocks fit through the mouth of the bag.
▲ CRITICAL STEP If the frozen tissue blocks are not embedded in OCT, a frozen 300-mg tissue piece can be directly placed in the tissue bag.
Once the tissue blocks are in the cryopulverization bag and the bag is capped, redip the entire bag in liquid nitrogen. Keep the tissue on dry ice until one is ready for the next step.
For the actual cryofractionation procedure, prepare dry ice, liquid nitrogen, and tweezers to prepare, store, and handle the sample bag.
-
The impact level should be adjusted depending on the amount of tissue in the tissue bag. For a tissue piece that is between 200 and 400 mg wet weight (approximated by eye), the impact level should be ~3. Smaller tissue blocks should use less impact and larger tissue blocks should use high impact. Tissue of ~300 mg wet weight is ~10 × 10 × 3 mm. This approximation can vary depending on tissue type. For example, breast cancer is less dense than lung cancer because it has higher proportions of fat.
▲ CRITICAL STEP In this protocol, we recommend a minimum of 50–100 mg of wet-weight tissue starting material because the protein yield of breast cancer tissue is ~1–3%, and the peptide yield from protein is ~40–50%. Note, however, that different tissue types will have different protein yields from wet-weight tissue, which should be taken into consideration when determining the amount of starting material needed.
▲ CRITICAL STEP To achieve best cryofracture results, the bagged tissue sample must be transferred from dry ice to liquid nitrogen for 5 s and then immediately cryofractured.
▲ CRITICAL STEP Do not hammer a tissue piece more than once, or else the bag will be pierced, and the tissue will fall out. If the impact level is too low and the tissue is not cryopulverized properly, either transfer the sample to a new bag or perform manual pulverizing with a frozen spatula. If the impact is too high, the cryofracture bag will burst on the first hammer hit and the tissue will fall out. It may be helpful to use practice tissue samples to familiarize oneself with the relative impact levels. Note that the lid of the cryofracture bag must be screwed on loosely to allow air to move out of the bag when it is hit by the metal plates; otherwise the bag may rupture.
To transfer the cryopulverized tissue from the cryofracture bag to a 1.5-ml tube, dip a capped 1.5-ml tube in liquid nitrogen for 10 s or until the boiling stops. Keep the uncapped tube on dry ice. Dip a new or clean spatula into liquid nitrogen for 10 s and then transfer the tissue from the bag to a weighing boat kept on dry ice. Transfer the sample to the cooled tube after weighing. Change spatulas between different patient samples. Clean the spatula with 70% EtOH before using and after every two to three scoops.
-
Cap the tube once the cryofracture bag is emptied into the tube and store the tube at −80 °C until ready for lysis.
■ PAUSE POINT Frozen tissue samples should be stored at −80 °C until ready for lysis. We recommend that the length of storage not exceed 1 year.
Tissue lysis ● Timing 90 min
-
11
Keep the cryopulverized tissue on ice and add 200 μl of chilled urea lysis buffer (4 °C) for each ~50-mg portion of wet-weight tissue.
▲ CRITICAL STEP Keep excess urea lysis buffer on ice to be used in later steps.
-
12
Vortex the tissue-lysis buffer mixture on the highest setting for 5–10 s.
-
13
Lyse the cells at 4 °C for 15 min by letting the tissue-lysis buffer mixture sit on ice.
-
14
Vortex the tissue-lysis buffer mixture on the highest setting for 5–10 s.
-
15
Incubate the sample for an additional 15 min on ice.
-
16
If the cryopulverized tissue was originally in a cryovial that is not compatible with the centrifuge, transfer the contents of the cryovial to a 2-ml screw-cap vial.
-
17
Centrifuge the tissue-lysis buffer solution at 20,000g at 4 °C for 10 min to clear the lysate.
▲ CRITICAL STEP When this protocol was used on human breast cancer patient material, the fat would rise to the top at this step. It is largely at the lysis step that we eliminate excess amounts of lipid, if present.
-
18
Transfer the supernatant to a 2-ml conical tube, measuring the volume of the supernatant when transferring.
! CAUTION When removing the supernatant, slide the pipette tip down the side of the tube to avoid a potential fat layer that will float above the supernatant and not pellet out with the other cellular debris.
▲ CRITICAL STEP Keep the insoluble pellet that collected at the bottom of the original tube on ice and store it at −80 °C. This pellet can be used for whole-exome sequencing at a quality comparable to that of the original samples2.
■ PAUSE POINT The cell pellets can be stored at −80 °C for up to 1 year.
Estimation of the protein yield using a Pierce BCA Kit ● Timing 60 min
-
19
Dilute the samples in water at a 1:19 (vol/vol) ratio, by removing 2 μl of sample and putting it in a 1.5-ml conical tube containing 38 μl of HPLC water. Plate 10 μl of the diluted sample in triplicate per sample in a clear, flat-bottom 96-well microplate.
-
20
Plate 10 μl of HPLC water as a blank and plate a urea lysis buffer dilution sample (1:19 (vol/vol), urea lysis buffer to water), each in triplicate.
-
21
Plate eight wells of 10 μl each of an 8-point BSA curve, ranging in concentration from 50 μg/ml to 2 mg/ml.
-
22
Prepare the BCA reagent by mixing reagent B and reagent A in a 1:49 (vol/vol) ratio.
▲ CRITICAL STEP This solution must be made fresh right before use.
-
23
Add 200 μl of freshly prepared BCA reagent to each well containing 10 μl of sample.
-
24
Incubate the microplate at 37 °C for 30 min.
-
25
Read the plate at 562 nm and determine the protein concentrations of the samples.
-
26
Adjust each sample concentration to 8 μg/μl with urea lysis buffer. If the sample concentration does not reach 8 μg/μl, record the maximum concentration achieved and adjust subsequent amounts of reducing reagents accordingly.
-
27
Prepare 1-mg aliquots per sample for reduction, alkylation, and digestion.
■ PAUSE POINT Samples can be frozen and stored at −80 °C for several weeks. Thawing of previously frozen samples is performed gently on ice.
Reduction and alkylation ● Timing 2 h
-
28
Reduce the disulfide bonds in the denatured proteins by adding DTT to 1 mg of sample (one of the aliquots prepared in Step 27) at a final concentration of 5 mM DTT, followed by incubation for 1 h at 37 °C in a Thermomixer.
-
29
Alkylate the reduced cysteine residues by adding IAM to a final concentration of 10 mM IAM, followed by incubation for 45 min in the dark at 25 °C.
In-solution digestion ● Timing 2 h + overnight digestion + 30 min
-
30
Dilute the samples 1:3 (vol/vol) with 50 mM Tris-HCl (pH 8.0) to decrease the urea concentration to <2 M.
-
31
Add LysC in an enzyme/substrate ratio of 1 mAU LysC per 50 μg of total protein, followed by incubation for 2 h at 25 °C in the incubator shaker.
▲ CRITICAL STEP The manufacturer of the LysC (Wako) provides quantities only in milli-Anson units and not in micrograms. It is impossible for us to know exactly how much LysC we are adding when measured in micrograms. Our general rule is that for each milli-Anson unit of LysC, we use 1 μg of enzyme. A sequencing-grade version of the enzyme is also available at substantially higher cost from the same vendor, and it is indicated as being packaged at 20 μg/vial. However, we have not used this version of the product.
-
32
Add trypsin in an enzyme/substrate ratio of 1:49 (wt/wt) for overnight digestion at 25 °C in the incubator shaker.
▲ CRITICAL STEP Use of higher temperatures will increase the extent of carbamylation of peptide N termini and lysines, and may have an unfavorable effect on quantification.
-
33
Quench the digestion reaction by acidifying the digestion mixture to a final concentration of 1% (vol/vol) FA using 100% (vol/vol) FA.
▲ CRITICAL STEP Using pH paper, check that the pH of the final solution is at pH 3. If not, add 100% (vol/vol) FA until a pH = 3 is reached.
-
34
Dilute the samples with 0.1% (vol/vol) FA to a 1.5-ml volume for ease of handling in subsequent steps.
-
35
Centrifuge the solution at 1,500g at RT for 15 min. The supernatant containing the peptides to be analyzed is subsequently desalted (Step 41). The pellet is generally discarded but can be saved for possible additional processing.
Peptide desalting of the digest by SPE ● Timing 90–120 min per set of ten samples
-
36
Use a 200-mg tC18 SepPak cartridge with a vacuum manifold to desalt the peptide samples.
▲ CRITICAL STEP Do not let the cartridges run dry during washing or loading, as this can increase sample loss during desalting from 5 to >20%.
-
37
Condition the cartridge with 3 ml of 100% (vol/vol) MeCN.
-
38
Condition the cartridge with 3 ml of 50% (vol/vol) MeCN/0.1% (vol/vol) FA.
-
39
Equilibrate the cartridge with 4 × 3 ml of 0.1% (vol/vol) TFA.
-
40
Load the sample supernatant from after centrifugation (from Step 35).
-
41
Desalt the sample with 3 × 3 ml of 0.1% (vol/vol) TFA.
-
42
Wash the cartridge with 1 × 3 ml of 1% (vol/vol) FA to remove the TFA.
-
43
Elute the sample from the tC18 cartridge with 2 × 1.5 ml of 50% (vol/vol) MeCN/0.1% (vol/vol) FA.
-
44
(Optional) To check for digestion success of individual samples by metrics such as missed cleavage rates and peptide counts, as read by LC-MS/MS, prepare a single-shot quality control (QC) per sample. This QC sample can also be used to detect the amount of OCT contamination in each sample. To generate the QC sample, remove 15 μg of the 3 ml eluate and dry it in an HPLC vial using a vacuum centrifuge. Reconstitute the sample in 30 μl of 3% (vol/vol) MeCN/0.1% (vol/vol) FA and analyze by LC-MS/MS, injecting 1 μg onto the column. Run QC on the sample and digestion by checking parameters such as missed-cleavage rates (Supplementary Fig. 2). Skip this step if instrument time on an LC-MS/MS system is limited.
? TROUBLESHOOTING
-
45
Freeze the eluate in liquid nitrogen or in a −80 °C freezer space before drying down with a vacuum centrifuge.
■ PAUSE POINT Dried peptides can be stored in a −80 °C freezer space.
Estimation of the peptide amount using a Pierce BCA Kit ● Timing 60 min
-
46
Reconstitute the sample in 500 μl of 50 mM HEPES (pH 8.5) by mixing well.
-
47
Remove a 25-μl aliquot for the peptide-level BCA estimation.
-
48
Dilute the 25-μl aliquot of sample 1:1 (vol/vol) with 25 μl of 50 mM HEPES (pH 8.5).
-
49
Plate 10 μl of the diluted sample in triplicate per sample in a clear, flat-bottom 96-well microplate.
-
50
Plate a 10-μl HPLC water blank and a 50 mM HEPES, pH 8.5, blank, each in triplicate.
-
51
Plate eight wells of 10 μl each of an 8-point BSA curve, ranging from 50 μg/ml to 2 mg/ml.
-
52
Prepare the BCA reagent by mixing reagent B and reagent A in a 1:49 (vol/vol) ratio.
▲ CRITICAL STEP This solution must be made fresh immediately before use.
-
53
Add 200 μl of freshly prepared BCA reagent to each well containing 10 μl of sample.
-
54
Incubate the microplate at 37 °C for 30 min.
-
55
Read the plate at 562 nm. We usually recover 40–50% of the starting material at this step. When using 1 mg of protein starting material, we usually recover 400–500 μg of tryptic peptides.
-
56
On the basis of the BCA results at the peptide level, dilute the samples with 50 mM HEPES (pH 8.5) for a concentration of 1 μg/μl. Vortex the well to mix.
■ PAUSE POINT Peptides in 50 mM HEPES (pH 8.5) can be stored in a −80 °C freezer space for up to 1 week.
TMT labeling of 300 μg of peptide per channel ● Timing 90 min
-
57
Remove 300 μg of peptides, as measured by peptide-level BCA, which should be in 300 μl of 50 mM HEPES (pH 8.5) at this point, and transfer it to a 2-ml screw-cap tube.
-
58
Reconstitute each 5-mg TMT reagent vial in 256 μl of anhydrous acetonitrile. Allow it to sit for 5 min.
-
59
Vortex the reagent tubes briefly and spin down on a benchtop centrifuge at 1,000g at RT for 30 s.
-
60
Add 123 μl of each reagent to the corresponding aliquot of peptides. Mix well and incubate at RT for 1 h with shaking on a tabletop shaker set at 1,000 r.p.m.
-
61
After 1 h, remove 2-μg aliquots from each sample and combine these to create a mixing QC test sample. Using a vacuum centrifuge, dry down this mixture of the ten channels and desalt these QC samples as described in Steps 63–72.
-
62
Freeze the rest of the samples at −80 °C until the mixing QC test is analyzed.
▲ CRITICAL STEP Do not quench the labeling reaction until after assessment of the label incorporation test results.
■ PAUSE POINT Peptides in 50 mM HEPES (pH 8.5) with TMT-labeling reagent can be stored in a −80 °C freezer space for up to 2 weeks.
Desalting of the mixing QC test sample ● Timing 30 min
-
63
Prepare C18 stage tips by using Empore C18 extraction disks, as described in ref. 38. Pack two plugs of C18 material into the tip of each stage tip (200-μl pipette tip) for a total binding capacity of ~40 μg. Create extraction disks using a 16-gauge blunt-end metal needle to hole-punch the ~1-mm disks. We recommend using adapters to hold the stage-tip pipette tip at the orifice of each 2 ml microcentrifuge tube.
-
64
Condition the stage tip with 100 μl of MeOH. Centrifuge at 3,000–3,500g for 3 min at RT and discard the liquid from the collection vial. All subsequent centrifugation steps are for the same duration or until all the solvent has passed through the stage tip at the same speed and at RT.
▲ CRITICAL STEP Do not centrifuge the stage tips at speeds above 3,500g or else the C18 material will dry out.
-
65
Wash the stage tips with 100 μl of 50% (vol/vol) MeCN in 0.1% (vol/vol) FA (stage-tip desalting solvent B). Centrifuge the stage tip at 3,000–3,500g for 3 min at RT. Discard the liquid.
-
66
Equilibrate the stage tips twice with 100 μl of 0.1% (vol/vol) FA (stage-tip desalting solvent A). Centrifuge the stage tip at 3,000–3,500g for 3 min at RT after each solvent loading. Discard the liquid.
-
67
Reconstitute the sample in 100 μl of 3% (vol/vol) MeCN/0.1% (vol/vol) FA and add the samples to the stage tip. Centrifuge the stage tip at 3,000–3,500g for 3 min at RT and discard the liquid from the collection vial.
-
68
Wash the samples twice with 100 μl of stage-tip desalting solvent A. Centrifuge the stage tip at 3,000–3,500g for 3 min at RT. Discard the liquid.
-
69
Replace the collection vial with a new 1.5 ml screw-cap vial for the collection of the eluate.
-
70
Elute the sample with 60 μl of stage-tip desalting solvent B. Centrifuge the stage tip at 3,000–3,500g for 3 min at RT.
-
71
Transfer the eluate to an HPLC vial, freeze it, and completely dry it by vacuum centrifugation.
-
72
Reconstitute the dried sample in 40 μl of 3% (vol/vol) MeCN/0.1% (vol/vol) FA and analyze the sample by LC-MS/MS (using the parameters described in the ‘Equipment setup’ section) to check the label incorporation and relative channel abundance. For the LC-MS/MS analysis, inject 2 μl onto the column.
▲ CRITICAL STEP As it can take a considerable amount of instrument time to analyze each of the individual label-incorporation test samples, particularly for TMT-10, one can consider analyzing the mixing QC test sample for both labeling efficiency and mixing consistency, and only analyzing the individual label-incorporation test samples for troubleshooting purposes if the labeling efficiency is suspect in the mixing test sample.
Data analysis for assessment of labeling efficiency and mixing ● Timing 1 h
-
73
To evaluate the completeness of free-amine labeling, database searches should be configured to allow for both peptide N termini and lysine side chains to be present in either labeled or unlabeled form. With Spectrum Mill, accounting for partial labeling is accomplished with a fixed/mix search cycle strategy that runs a search four consecutive times with different sets of modifications in each round and then produces a single integrated output. The four cycles are as follows: all unmodified, both peptide N termini and lysines labeled, only lysines labeled, and only peptide N termini labeled. As the primary amine groups of lysine side chains (pKa ~10) are more reactive than peptide N-terminal amines (pKa ~7.5), incomplete labeling tends to be observed predominantly in the form of unlabeled peptide N termini. Furthermore, so long as a peptide includes at least 1 label, reporter-ion quantitation is viable. After running a four-cycle partial-labeling database search configuration with a suitable (1%) PSM-level false-discovery rate (FDR) threshold on a label-check aliquot, labeling efficiency percentage metrics are calculated in the Spectrum Mill Quality Metrics module: full label % = 100 × fully labeled PSMs/total PSMs and label % = 100 × 1 or more labeled PSMs/total PSMs.
▲ CRITICAL STEP We typically apply a threshold for minimal labeling efficiency of >99% labeling by PSM identifications. If the threshold is not met, then the samples will be relabeled (see Troubleshooting section for relabeling procedure) before proceeding with further peptide-level fractionation. In our experience, TMT labeling is more robust and less likely to require relabeling than iTRAQ labeling.
? TROUBLESHOOTING
-
74
Analyze the resulting MS data from the mixing test sample to check if the total protein amount from each sample is the same. The Spectrum Mill Quality Metrics module does this by summing the reporter-ion intensity (after applying isotopic correction) for each channel across all the confidently identified PSMs in the dataset. Then, per-sample mixing percentages are calculated using the most abundant reporter-ion channel sum as a common denominator and each of the other channels as a numerator.
▲ CRITICAL STEP Unless particular samples are available in limited quantity, we require each sample to have a reporter-ion intensity sum for all identified PSMs in the mixing test sample LC-MS/MS run that deviates <25% from the reporter-ion intensity sum of the reference channel, if present, or from the average reporter-ion intensity sum of all channels.
? TROUBLESHOOTING
Quenching of the TMT-labeling reaction ● Timing 20 min
-
75
Quench all individual TMT-labeling reactions by adding 32 μl of 5% (vol/vol) hydroxylamine, followed by incubation at RT for 15 min with shaking at 1,000 r.p.m.
-
76
Combine the volumes of each of the ten TMT-labeled samples in a 15-ml conical tube before freezing in liquid nitrogen or by placing into a −80 °C freezer space. Dry down the combined sample.
■ PAUSE POINT Dried peptides can be stored in a −80 °C freezer space for up to 1 month.
Peptide desalting of labeled peptides by SPE ● Timing 30 min
-
77
Use a 200-mg tC18 SepPak cartridge with a vacuum manifold to desalt the peptide samples.
▲ CRITICAL STEP Do not let the cartridges run dry during washing or loading, as this can increase sample losses during desalting from 5% to >20%.
-
78
Reconstitute the combined sample of TMT-labeled peptides in 3 ml of 3% (vol/vol) MeCN/0.1% (vol/vol) FA.
▲ CRITICAL STEP Measure the pH with pH-indicator paper and adjust the pH to 3 with 100% (vol/vol) FA if necessary.
-
79
Condition the cartridge with 3 ml of 100% (vol/vol) MeCN.
-
80
Condition the cartridge with 3 ml of 50% (vol/vol) MeCN/0.1% (vol/vol) FA.
-
81
Equilibrate the cartridge with 4 × 3 ml of 0.1% (vol/vol) TFA.
-
82
Load the sample onto the cartridge.
-
83
Desalt the sample with 3 × 3 ml of 0.1% (vol/vol) TFA.
-
84
Wash the cartridge with 1 × 3 ml of 1% (vol/vol) FA to remove the TFA.
-
85
Elute the sample from the tC18 cartridge with 2 × 1.5 ml of 50% (vol/vol) MeCN/0.1% (vol/vol) FA.
-
86
Freeze the eluate in liquid nitrogen or in a −80 °C freezer space before drying down with a vacuum centrifuge.
■ PAUSE POINT Dried peptides can be stored in a −80 °C freezer space for up to 1 year.
Offline HPLC fractionation ● Timing 60 min + overnight QC + 5 h
-
87
Prepare the HPLC system by purging solvent lines A and B of air. Equilibrate the bRP fractionation column with 100% (vol/vol) solvent B, then 100% (vol/vol) solvent A, and finally with 50% (vol/vol) solvent A/50% (vol/vol) solvent B. Equilibrate with each of these conditions for 30 min, for a total of 1.5 h. The flow rate for equilibration is that of the method, which in our method is 1 ml/min.
-
88
Perform a QC of the HPLC system before fractionation. We typically accomplish this by injecting peptide standards in duplicate before running the actual sample. For this scale of bRP, 200 pmol of a mixture of ten in-house synthetic peptide standards (Reagent setup) is injected and evaluated for retention time reproducibility, signal intensity, and peak resolution (Supplementary Fig. 3a).
-
89
Prepare the LC system for QC sample injection: the composition of a single sample separation is a sequence of two methods: a blank gradient, used to condition the column, followed by the sample gradient. For the QC run, we typically use a method that is meant for label-free peptides for better separation and resolution peaks for the peptides.
-
90
Once the QC of the peptide standards indicates the system is running properly, run a blank gradient to condition the column for the TMT-labeled sample (Equipment setup). This is achieved by injecting 50 μl of bRP solvent A (refer to ‘Reagent setup’ for basic-pH RP solvents) from an HPLC vial with the gradient outlined in the ‘Equipment setup’ as a blank gradient.
-
91
Upon completion of the blank run, reconstitute the sample in 900 μl of bRP solvent A (see ‘Reagent setup’ for basic-pH RP solvents). Vortex until the sample is in solution.
▲ CRITICAL STEP Do not pipette up and down to bring the sample into solution, as this will result in the formation of bubbles.
-
92
Transfer the sample to a 1.5-ml screw-cap vial and centrifuge at 20,000g at RT for 5 min to remove any material that did not go into solution.
-
93
Transfer the sample, avoiding the pelleted insoluble peptides, to an HPLC vial. Inject 850 μl of the sample into the sample loop of the HPLC system.
▲ CRITICAL STEP The sample volume is brought to 900 μl, but only 850 μl is injected, because extra volume is needed to avoid injecting air bubbles into the system during sample injection.
-
94
For separation of the TMT-labeled samples, use the corresponding gradient and flow rate settings outlined in the tables in the ‘Equipment setup’ section. For an example chromatogram, see Supplementary Fig. 3b. In the bRP separation, 96 fractions are collected into a Whatman 2-ml 96-well plate at a flow rate of 1 ml/min.
▲ CRITICAL STEP To store the HPLC column after separation, flow water through the column at 1 ml/min and then flow methanol through the column, also at 1 ml/min. Do not store or maintain the column in basic solvent when samples are not being run, as this will substantially speed up the aging of the column and cause premature widening of peaks.
-
95
After separation, pool the bRP fractions (as described in Table 1) in 15-ml conical vials to generate 24 final fractions and fraction A. Fraction A does not contain many peptides, acts as a negative control, and contains multiply phosphorylated peptides that do not bind well to the RP column. The plate layout describes the recombination of wells in which B10 is combined with D10 and F10 as fraction 1, B9 is combined with D9 and F9 as fraction 2, and so on (Table 1).
▲ CRITICAL STEP In our method of pooling, we have factored in the fact that our sample is eluted in a serpentine manner. For methods that do not eluate in a serpentine method, please correct the pooling scheme to still allow pooling of the fractions from the beginning, middle, and end of the gradient in an even and recurring manner. Our method reduces 96 individual wells into 23 final fractions (three wells with disparate hydrophobicity) plus two fractions from the early and late portions of the chromatogram that are sparser in peptide content.
-
96
Acidify each pooled fraction using 10% (vol/vol) FA to achieve a final concentration of 0.1% (vol/vol) FA and a pH of 3.
-
97
From each pooled fraction, collect 5% of each fraction into an HPLC vial for proteome analysis by LC-MS/MS. Vacuum-centrifuge each HPLC vial with the proteome analysis fraction. For analysis, bring the sample up in 3% (vol/vol) MeCN/0.1% (vol/vol) FA to a final concentration of 0.5 μg/μl and inject 1 μl onto the column. In practice, we assume there is 6.25 μg in each of the 24 fractions and we bring the sample up in 12.5 μl of 3% (vol/vol) MeCN/0.1% (vol/vol) FA. We have previously found that the columns can accommodate 1 μg without overloading when samples are measured on the protein level. In our current protocol, we are quantifying the amounts on the peptide level. Peptide yields are approximately half of protein yields. Therefore, by loading 0.5 μg (peptide-level BCA), we are effectively reproducing our previous 1 μg on the column (protein-level BCA). Experience from one of the three labs indicates that results with 0.5- and 1-μg loads (by peptide BCA) are very similar. In general, it should be noted that the higher the peptide load, the greater the possibility of the chromatographic separation decreasing because of overloading.
? TROUBLESHOOTING
-
98
Combine the remaining 95% of each fraction into 12 fractions + fraction A for enrichment of phosphopeptides as follows:
Fraction no. bRP fractions 1 1 + 13 2 2 + 14 3 3 + 15 4 4 + 16 5 5 + 17 6 6 + 18 7 7 + 19 8 8 + 20 9 9 + 21 10 10 + 22 11 11 + 23 12 12 + 24 A A -
99
Freeze the 13 fractions with liquid nitrogen or in the −80 °C freezer space before drying the samples down in a vacuum centrifuge or lyophilizer.
■ PAUSE POINT Dried peptides can be stored in a −80 °C freezer space for up 1 week.
Table 1 |.
Pooling fractions for proteome analysis
| 1 | 2 | 3 | 4 | 5 | 6 | 7 | 8 | 9 | 10 | 11 | 12 | |
|---|---|---|---|---|---|---|---|---|---|---|---|---|
| A | A | A | A | A | A | A | A | A | A | A | ||
| B | 10 | 9 | 8 | 7 | 6 | 5 | 4 | 3 | 2 | 1 | A | A |
| C | 11 | 12 | 13 | 14 | 15 | 16 | 17 | 18 | 19 | 20 | 21 | 22 |
| D | 10 | 9 | 8 | 7 | 6 | 5 | 4 | 3 | 2 | 1 | 24 | 23 |
| E | 11 | 12 | 13 | 14 | 15 | 16 | 17 | 18 | 19 | 20 | 21 | 22 |
| F | 10 | 9 | 8 | 7 | 6 | 5 | 4 | 3 | 2 | 1 | 24 | 23 |
| G | 11 | 12 | 13 | 14 | 15 | 16 | 17 | 18 | 19 | 20 | 21 | 22 |
| H | 24 | 24 | 24 | 24 | 24 | 24 | 23 |
Combining strategy for a 4.6-mm column. Underlined numbers indicate the fractions meant to be pooled into fraction 1. Italicized numbers indicate the fractions meant to be pooled into fraction 2. These indications are meant to make pooling easier visually.
Combined IMAC enrichment and phosphopeptide desalting: bead preparation ● Timing 90 min
-
100
Fully resuspend the Ni-NTA Superflow Agarose beads before removing an appropriate aliquot of slurry, in which the beads/solvent ratio is 1:1 (vol/vol). This protocol is written for the preparation of up to 500 μl of beads. Scale up appropriately if >300 μl of beads need to be prepped at once. For a 13-fraction IMAC enrichment, 130 μl of beads is needed. To account for proper overhead, remove 160 μl of beads or 320 μl of slurry.
▲ CRITICAL STEP Prepare the beads fresh on the day of the enrichment.
-
101
Centrifuge the slurry in a tabletop centrifuge at 1,000g at RT for 1 min. Remove the stock supernatant.
-
102
Wash the beads 3× in 1 ml of HPLC water, centrifuging in the tabletop centrifuge (1,000g at RT for 1 min) each time to remove the supernatant.
-
103
Incubate the beads in 1,200 μl of 100 mM EDTA (1:5 (vol/vol) dilution of the stock 500 mM EDTA solution) for 30 min at RT with end-over-end turning to strip the beads of nickel.
-
104
Wash the beads 3× in 1 ml of HPLC water, centrifuging in the tabletop centrifuge (1,000g at RT for 1 min) each time to remove the supernatant.
-
105
Incubate the beads with 1,200 μl of 10 mM iron (III) chloride aqueous solution (solid iron (III) chloride in HPLC water) for 30 min at RT with end-over-end turning. Wash the beads 3× in 1 ml of HPLC water, centrifuging in the tabletop centrifuge each time (1,000g at RT for 1 min) to remove the supernatant.
-
106
Bring the beads up with a 1:1:1 (vol/vol/vol) ratio of acetonitrile/methanol/0.01% (vol/vol) acetic acid so that it is a slurry of 1:1:1:1 beads/acetonitrile/methanol/0.01% (vol/vol) acetic acid. If 160 μl of beads were originally removed, the total volume would be 640 μl at this point.
-
107
Pipette 40 μl of bead slurry into each of 13 × 1.5-ml screw-cap tubes, shaking the slurry from which you are drawing aliquots after every few aliquots to maintain the suspension. The 40 μl of slurry in each tube corresponds to 10 μl of beads for enrichment per fraction.
▲ CRITICAL STEP Pipette 40 uL of bead slurry into each of thirteen × 1.5 mL screw-cap tubes, shaking the slurry from which you are drawing aliquots after every few aliquots to maintain the suspension. The 40 uL of slurry in each tube corresponds to 10 uL of beads for enrichment per fraction.
■ PAUSE POINT Beads cannot be prepared before the day of the enrichment. Beads that are not prepared fresh on the day of the enrichment have been found to show decreased enrichment specificity. However, beads can be kept in this 1:1:1:1 slurry for up to 1–2 h.
Peptide sample preparation ● Timing 15 min
-
108
Bring the peptide concentration to 0.5 μg/μl in 80% (vol/vol) MeCN/0.1% (vol/vol) TFA. Because it is difficult to solubilize peptides in such high organic solvents, first solubilize the peptides in 50% (vol/vol) MeCN/0.1% (vol/vol) TFA and add 100% (vol/vol) MeCN/0.1% (vol/vol) TFA to achieve an 80% (vol/vol) MeCN/0.1% (vol/vol) TFA concentration. For example, in a 3-mg sample that was fractionated into 24 fractions (with 5% removed for proteome analysis) and then pooled into 12 fractions, there is 237.5 μg of peptides in each of the phosphofractions for enrichment. Fraction A is not counted in the calculations because it is nearly empty, except for a few multiphosphorylated peptides. Bring each fraction, including fraction A, into solution. First dissolve each fraction in 190 μl of 50% (vol/vol) MeCN/0.1% (vol/vol) TFA with vortexing. Once all the peptides are in solution, add 285 μl of 100% (vol/vol) MeCN/0.1% (vol/vol) TFA.
▲ CRITICAL STEP A concentration of 0.1% (vol/vol) TFA is used in the IMAC binding buffer to control the pH at 2. This ensures that the carboxyl groups of glutamic and aspartic acid, and the peptide C termini are protonated to avoid background binding of nonphosphorylated peptides to the IMAC resin. At pH 2, S/T/Y-phosphorylated residues remain negatively charged and bind strongly to the resin.
-
109
Spin down the samples (1,500g at RT for 10 min) to pellet any un-reconstituted peptides.
▲ CRITICAL STEP Check if the pH is 2 with pH-indicator paper.
Combined IMAC enrichment and phosphopeptide desalting: phosphoenrichment ● Timing 45 min
-
110
Add the peptide solution to the aliquoted beads and incubate for 30 min at RT on a shaker at 1,000 r.p.m.
▲ CRITICAL STEP Do not let the incubation go beyond 30 min.
-
111
Spin down the bead-peptide solution for 1 min at 1,000g at RT in a centrifuge.
-
112
Remove the supernatant from each tube and keep this as a ‘flow through’ sample for potential subsequent enrichments.
-
113
Add 200 μl of 80% (vol/vol) MeCN/0.1% (vol/vol) TFA to the beads, creating a slurry that can later be pipetted and transferred in Step 118.
Combined IMAC enrichment and phosphopeptide desalting: stage-tip desalting of phosphoenrichment ● Timing 90 min
-
114
Prepare 13 2-plug C18 stage tips by using Empore C18 extraction disks as described in Step 63.
-
115
Condition the stage tips with 100 μl of MeOH. Centrifuge at 3,000–3,500g for 3 min at RT and discard the liquid from the collection vial. Condition the stage tips a second time with another 100 μl of MeOH. All subsequent centrifugation steps are for the same duration or until all the solvent has passed through the stage tip at the same speed and at RT.
▲ CRITICAL STEP Do not centrifuge the stage tips at speeds >3,500g or else the C18 material will dry out.
-
116
Wash the stage tips with 50 μl of 50% (vol/vol) MeCN in 0.1% (vol/vol) FA (stage tip solvent B). Centrifuge the stage tips at 3,000–3,500g for 3 min at RT. Discard the liquid.
-
117
Equilibrate the stage tips twice with 100 μl of 1% (vol/vol) FA. Centrifuge the stage tips at 3,000–3,500g for 3 min at RT after each solvent loading. Discard the liquid.
-
118
Load the enriched beads onto the stage tip. Centrifuge the stage tips at 3000–3500g for 3 min at RT and discard the liquid from the collection vial.
-
119
Wash the beads twice with 50 μl of 80% (vol/vol) MeCN/0.1% (vol/vol) TFA. Centrifuge the stage tips at 3000–3500g for 3 min at RT after each solvent loading. Discard the liquid.
▲ CRITICAL STEP A concentration of 0.1% (vol/vol) TFA is used to ensure that the pH is 2. This ensures that the carboxyl groups of glutamic and aspartic acid, and the peptide C termini are protonated to avoid background binding of nonphosphorylated peptides to the IMAC resin. At pH 2, S/T/Y-phosphorylated residues remain negatively charged and bind strongly to the resin.
-
120
Wash the beads with 50 μl of 1% (vol/vol) FA. Centrifuge the stage tip at 3,000–3,500g for 3 min at RT. Discard the liquid.
-
121
Elute the peptides from the beads and onto the C18 plugs with three iterations of 70 μl of agarose-bead elution buffer. Centrifuge the stage tip at 3,000–3,500g for 3 min at RT after each solvent loading. Discard the liquid.
-
122
Wash the C18 material with 100 μl of 1% (vol/vol) FA. Centrifuge the stage tip at 3,000–3,500g for 3 min at RT and discard the liquid.
-
123
Replace the collection vial with a new 1.5-ml screw-cap vial for the collection of the eluate.
-
124
Elute the sample from the C18 plugs with 60 μl of StageTip solvent B. Centrifuge the stage tip at 3,000–3,500g for 3 min at RT.
-
125
Transfer the eluate to an HPLC vial, then freeze and completely dry the samples by vacuum centrifugation.
-
126
Reconstitute the dried sample in 9 μl of 3% (vol/vol) MeCN/0.1% (vol/vol) FA and analyze by LC-MS/MS (using the parameters described in the ‘Equipment setup’ section). For LC-MS/MS analysis, inject 4 μl onto the column.
▲ CRITICAL STEP TFA reduces the ionization efficiency in the electrospray, so we wash it out of the stage tips using 1% (vol/vol) FA. The concentration of FA is reduced to 0.1% at the last elution step to ensure the best sensitivity before injection into the mass spectrometer.
? TROUBLESHOOTING
Data analysis ● Timing <1 d
-
127
We typically analyze the data using Spectrum Mill MS Proteomics Workbench. However, other search engines can be used for searching the data, as long as the program can handle TMT-10 data. The table below shows the search parameters we use.
Parameter Value Variable modification Oxidation (M) Acetyl (protein N-term) Deamidation (N) PyroGlu (Q) Fixed modification Carbamidomethyl (C) TMT-10 (peptide N-term, K) Digest Trypsin Allow P Maximum missed cleavages 4 Maximum charge 5 Precursor mass tolerance (p.p.m.) 20 Product mass tolerance (p.p.m.) 20 Peptide FDR (%) 1 Protein FDR (%) 0 ▲ CRITICAL STEP The digestion enzyme search parameter used, Trypsin Allow P, allows K-P and P cleavages that are typically disallowed by search engines when configured for trypsin specificity. These two additional bond cleavages are allowed because the digestion protocol employs both Lys-C and trypsin. Lys-C often cleaves at K-P linkages, and trypsin can occasionally cleave at both R-P and K-P39, Therefore, the missed cleavage allowance is set to 4 instead of a typical value of 2 when using trypsin. Other search engines may have the flexibility to configure custom digestion specificity to explicitly allow K-P cleavage when disallowing R-P cleavage.
▲ CRITICAL STEP Deamidation of glutamine (Q) residues is much slower than deamidation of asparagine (N) residues, because of the kinetics of a reaction mechanism intermediate with a six-membered ring (Q) versus a five-membered ring (N). However, some search engines may not readily allow for selection of a deamidation variable modification only at N. Deamidation reactions are kinetically more favored at the elevated pH (10) encountered during the basic RP step in this protocol after the samples are mixed.
-
128
Analyze the final sample dataset with a two-cycle fixed/mix modifications search in Spectrum Mill that runs two consecutive searches with different sets of fixed modifications in each round and then produces a single integrated output. The two cycles allow for (i) labeling of both peptide N termini and lysines, and (ii) labeling of only lysines. Other search engines might allow similar strategies to be executed by configuring the label as a variable modification on peptide N termini and on lysines.
▲ CRITICAL STEP Including variable modifications during peptide identification of MS/MS spectra to account for common foreseeable sample handling modifications is not only important for calculating the metrics to monitor sample-handling QC, but also diminishes the potential for falsepositive identification of otherwise lower-scoring unmodified sequences. Depending on the capabilities and calculation methods of the quantitation software used, it may be appropriate to exclude PSMs related to sample handling modifications from quantitative calculations that are expected to occur disproportionately in individual samples before the point of mixing.
-
129
Correct the reporter-ion intensities for isotopic impurities37 before using the reporter-ion signals in each MS/MS spectrum for quantitative calculations.
▲ CRITICAL STEP Each lot of reagent obtained from its manufacturer is accompanied by a certificate of analysis (this is also available on the manufacturer’s website) that contains isotopic correction factors to be used by the quantitation software. These correction factors are primarily used to account for naturally occurring levels of 13C at the unlabeled carbons in the mass-tag portion of the labeling reagents. Because very-high-purity sources of 15N and 13C are routinely available and are used for the labeled positions in the reagent, near-full incorporation is typical. The correction factors provided by the reagent manufacturer represent MS measurements of the isotope profile for each lot of reagent and thus comingle the contributions of the unlabeled carbon and the source of heavy isotope. Because there are more unlabeled carbons in the TMT structure than in the iTRAQ structure, attention to isotopic correction to achieve accurate quantitation is more important for TMT than for iTRAQ.
▲ CRITICAL STEP In complex samples such as tissue, the typical precursor mass window used for MS/MS (i.e., 0.7–2.0 m/z) passes more ions than just the dominant peak in any given m/z window. If these additional ions have an isobaric mass-tag reporter as part of the structure, then fragmentation of these ions will produce mass-tag ions that add to the reporter-ion series from the dominant peak16,31. As most peptides in a sample are derived from proteins whose levels are not changing (or not changing substantially), the interfering signals from this background in every mass-tag channel compress the observed ratios of regulated peptides/proteins in the samples. When combining reporter-ion quantitation from multiple PSMs to the protein level, several software programs offer mechanisms to exclude PSMs that exhibit substantial interference. A precursor-ion purity filter is commonly used that determines the ratio of the intensity of the precursor ion and isotopes of the primary peptide identified in the MS/MS spectrum to the total intensity in the mass window isolated for precursor-ion transmission40,41. Use of a precursor-ion purity of >50% to 70% is recommended. Various software packages employ different mechanisms for combining the PSM-level measurements to the protein level from which the constituent peptides are derived. Spectrum Mill takes the ratios at the PSM level, then calculates the protein-level ratio as the median of all PSM ratios40. This strategy diminishes the overall impact of outliers but otherwise gives each PSM an equal contribution to the protein-level ratio. Another common strategy is to sum the intensity for each reporter-ion channel from multiple PSMs contributing to the protein before taking the ratios. This strategy seeks to weight the contribution of each PSM by the reporter-ion signal strength, with the implicit assumption that low-abundance signals are less accurate. Other variants of these basic approaches involve combining multiple PSMs to the peptide level first before combining to the protein level. These strategies seek to limit the bias of individual peptides that are observed in multiple PSMs because of different precursor charge states or sample-handling modifications.
Troubleshooting
Troubleshooting advice can be found in Table 2.
Table 2 |.
Troubleshooting table
| Step | Problem | Possible reason | Solution |
|---|---|---|---|
| 44 | Large amounts of OCT contamination seen in QC mass spectrometry runs High missed-cleavage rates for tryptic peptides (Supplementary Fig. 2) |
Large contamination of OCT in cryopulverized tissue Digest efficiency, especially for trypsin, is dependent on enzyme concentration during digestion |
Use basic RP fractionation to dilute OCT signal across multiple fractions Use low volumes of extraction buffer to increase the initial protein concentrations |
| 73, 74 | Poor labeling efficiency and/or poor mixing control | High levels of plasma contamination, leading to poor labeling efficiency or inaccurate protein BCA assay | If a channel does not have sufficient labeling incorporation, additional TMT is added to the sample and another 1-h incubation is performed with shaking. If the samples are too variable from each other in the mixing control, additional material should be labeled and incorporated, or material should be removed, depending on the nature of the channel, until the channels are ~1:1:1… |
| 97 | High-pH separation resolution is <75-80% uniqueness per fraction. For optimal performance across three laboratories and different column types, see Supplementary Fig. 1 | Column is overloaded or deteriorated | Use standard runs of synthetic peptides to monitor column performance and do not load more than 4 mg of peptides onto 4.6 × 250-mm columns |
| 126 | Phosphopeptide enrichment yields <90% enrichment specificities. For optimal performance across three laboratories, see Supplementary Fig. 4 | pH of peptides in IMAC-binding buffer is >2, IMAC beads were not prepared freshly, or IMAC incubation was longer than 30 min | Check pH with filter paper, prepare new IMAC beads for each experiment, and do not incubate for >30 min |
Timing
All approximate timing given below is for a single 10-plex sample.
Steps 1–10, (optional) cryopulverization of tissue blocks: 2.5 h for ten non-OCT tissue blocks; 3.5 h for ten OCT tissue blocks
Steps 11–18, tissue lysis: 90 min
Steps 19–27, estimation of protein yield using a Pierce BCA Kit: 60 min
Steps 28 and 29, reduction and alkylation: 2 h
Steps 30–35, in-solution digestion: 2 h + overnight digestion + 30 min
Steps 36–45, peptide desalting of the digest by SPE: 90–120 min per set of ten samples
Steps 46–56, estimation of peptide amount using a Pierce BCA Kit: 60 min
Steps 57–62, TMT labeling of 300 μg of peptide per channel: 90 min
Steps 63–72, desalting of mixing QC test sample: 30 min
Steps 73 and 74, data analysis for the assessment of labeling efficiency and mixing: 1 h
Steps 75 and 76, quenching of the TMT-labeling reaction: 20 min
Steps 77–86, peptide desalting of the labeled peptides by SPE: 30 min
Steps 87–99, offline HPLC fractionation: 60 min + overnight QC + 5 h
Steps 100–107, combined IMAC enrichment and phosphopeptide desalting: bead preparation: 90 min
Steps 108 and 109, peptide sample preparation: 15 min
Steps 110–113, combined IMAC enrichment and phosphopeptide desalting: phosphoenrichment: 45 min
Steps 114–126, combined IMAC enrichment and phosphopeptide desalting: stage-tip desalting of phosphoenrichment: 90 min
Steps 127–129, data analysis: <1 d
Anticipated results
Assessing intra-plex, inter-plex, and inter-laboratory variation
The protocol was tested across three independent laboratories with full process replicates, starting with cryofractured tissue material, for a total of 20 patient-derived xenograft tumor tissue samples per laboratory. As established in previous methods comparison studies42, we analyzed the proteome differences in two very different breast cancer subtypes, basal-like (WHIM2) and luminal (WHIM16) breast samples. The experimental design for this benchmarking study across three laboratories is depicted in Fig. 1b. As all three groups used the same experimental design and samples, the Procedure can be tested for intra-plex, inter-plex, and inter-laboratory variation. All participating laboratories followed this protocol, with similar chromatography and MS setups. Although all three laboratories used the same model of mass spectrometer, a Thermo Fisher Scientific Orbitrap Fusion Lumos, the LC models were not all the same. The off-line systems used for bRP were an Agilent 1100 (Broad Institute), an Agilent 1220 (Johns Hopkins), and an Agilent 1100 (PNNL). For online LC systems, a Thermo Fisher Scientific Easy nLC 1200 was used by both the Broad Institute and Johns Hopkins, whereas a Waters nanoAcquity instrument was used by PNNL. The gradient-mixing performance inevitably varies between LC manufacturers. Data from all three laboratories were analyzed centrally using the Spectrum Mill software package, so that all the described variances are due to experimental factors rather than introduced data analysis differences between the participating laboratories.
Comparison of proteome and phosphoproteome datasets
We observed highly reproducible proteome and phosphoproteome datasets across three independent laboratories after following the described protocol. Each laboratory achieved proteome coverages of, on average, 145,000 distinct tryptic peptides (Fig. 2a) and >10,000 proteins, with a maximum deviation across replicates and centers of <7% for protein observations (Fig. 2b). For each protein, we required at least two distinct peptides for identification and two TMT ratio counts for quantification. Out of all quantified proteins, 77% were detected by all three centers (Supplementary Fig. 5a). The protein analysis presented here was restricted to ortholog-specific peptides for protein identification and quantification, and up to 7,700 human proteins derived from tumor cells and up to 3,100 mouse proteins derived from mouse stroma and blood were quantified (Fig. 2b). The phosphoproteome coverage at the peptide level was, on average, 35,000 phosphopeptides per experiment across laboratories and >31,000 phosphosites in every analyzed TMT-plex experiment (Fig. 2c,d). As, in general, ~35% of human and mouse tryptic peptides are identical in their amino acid sequences, we did not filter out peptides shared between human and mouse orthologs. Most of the shared signal in the PDX samples is contributed by the human tumor material, which contributes up to 55–64% of the total protein signal. The overlap of all quantified phosphosites across three laboratories is 40% (Supplementary Fig. 5b). For each of the three laboratories, 64–69% of phosphosites were observed in both replicate experiments (Supplementary Fig. 5c-e). In each experiment, more than half of all the phosphosites were detected by only a single MS2 scan, whereas every quantified protein is detected by at least two distinct peptides. Reduced overlap at the phosphosite-level relative to protein-level observations may arise because of the variable recovery of phosphopeptides from the additional experimental steps associated with IMAC phosphopeptide enrichment, as well as stochasticity in sampling by the mass spectrometer and minor variability in LC-MS performance. Nonetheless, reproducible and overlapping quantification of >21,000 phosphosites covering 5,384 phosphoproteins across three laboratories was achieved (Supplementary Fig. 5b).
Fig. 2 |. Deep and reproducible coverage of tumor tissue proteomes and phosphoproteomes across three laboratories.
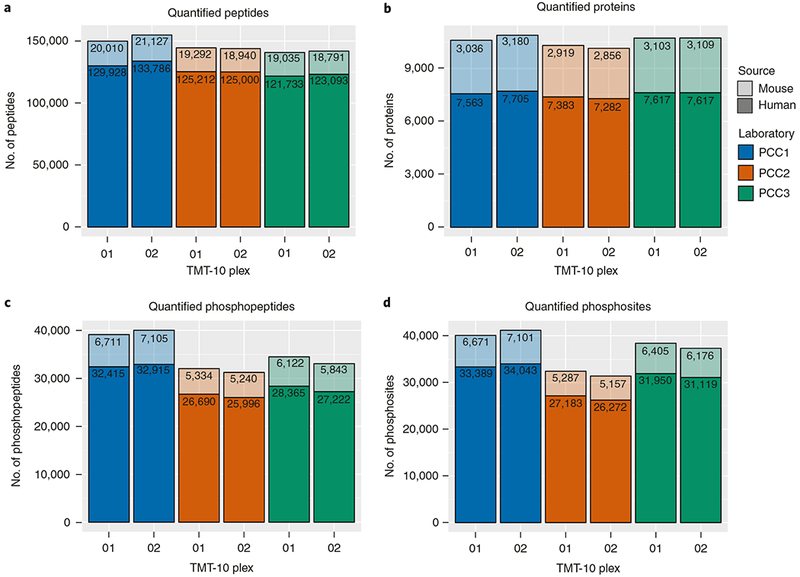
a-d, Bar charts depicting the number of quantified distinct peptide sequences (a) and proteins (b) identified in basic RP fractions of proteome measurements, and the number of distinct phosphorylated peptides (c) and individual phosphorylation sites (d) quantified in the metal-affinity enriched fractions. Solid-colored bars represent the proportion of human features and shaded bars represent the proportion of mouse-specific features. Numbers inside the bars represent the numbers of quantified human and mouse features, respectively. PDX models used in this study were approved by the institutional animal care and use committee at Washington University in St. Louis.
Comparison of the reproducibility of protein and phosphoprotein quantification
To compare the reproducibility of protein and phosphosite quantification, we referenced the reporter intensity of each individual channel against the average across all ten channels at the PSM level. This strategy allows comparison of the quantification data of each individual tumor sample within a TMT-10-plex experiment, as well as across multiplex experiments and across different laboratories. For both the proteome and the phosphoproteome data, we observe better correlations for the human-only subset of the dataset, as compared with the combined human plus mouse dataset (Supplementary Fig. 6). This is due to the varying contributions of mouse stroma components in the different cryofractured aliquots used for this study (Supplementary Fig. 7); therefore, we focused on human proteins and phosphosites for subsequent analyses.
As expected, the best correlations were observed within a TMT-10-plex, with average r values of 0.94 and 0.85 for protein and phosphosite quantification, respectively (Fig. 3). The high degree of reproducibility of this approach was demonstrated by very similar correlations for the intra- and inter-laboratory comparisons, with median r values of 0.88–0.94 and 0.72–0.88 at the protein and phosphosite levels, respectively. We also studied the relationship between minimal ratio counts of proteins and phosphosites with regard to quantification reproducibility (Supplementary Fig. 8). For the analyzed datasets, we find the best tradeoff between the highest quantitative reproducibility and the best coverage at two ratio counts for proteins and one ratio count for phosphosites. Isobaric tagging methods have been shown to improve the precision of quantification, whereas label-free methods suffer from high technical variation for PTM applications, in which the majority of quantification events rely on the quantification of single peptides43.
Fig. 3 |. Assessment of the variability of TMT quantitation.
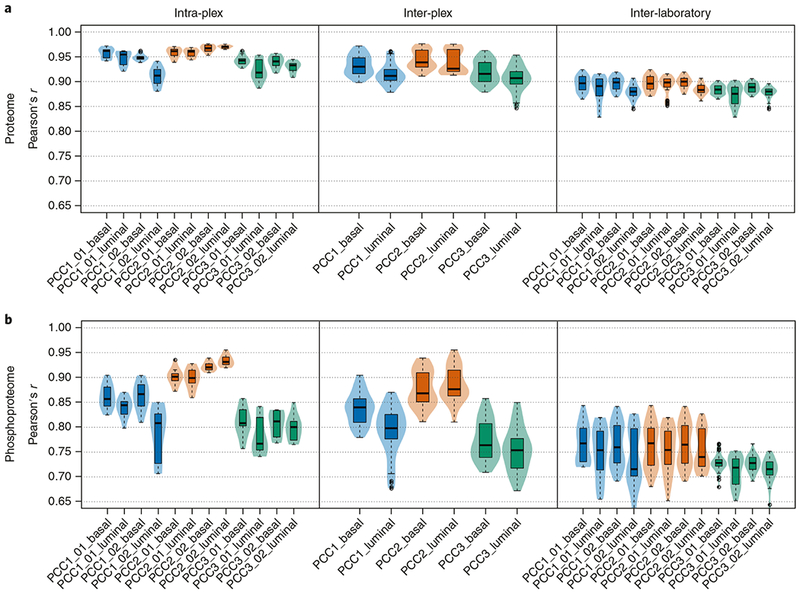
Our experimental design enables the assessment of intra-plex, inter-plex, and inter-laboratory variation of TMT quantitation. Pearson correlation coefficients between replicate measurements were calculated and visualized in box-and-whiskers plots. a, Correlations calculated from proteome measurements comparing intra-plex replicates (left), inter-plex replicates (middle), and inter-laboratory replicates (right). b, Correlations of quantified phosphorylation sites. PDX models used in this study were approved by the institutional animal care and use committee at Washington University in St. Louis.
Using the optimal filtering steps described above, we found very consistent results for the analysis of breast cancer-relevant driver and biomarker proteins such as ESR1, GATA3, FOXA1, TP53, EGFR, and KRT5 (Supplementary Fig. 9). These proteins were all quantified at similar amplitudes across experiments with levels matching the known luminal and basal subtypes. To identify proteins and phosphosites that are specific for the luminal and basal PDX samples, we used a two-sample t test and compared the overlap of proteins that were called to be specific to either of the subtypes across the different laboratories (FDR 1%). On the protein level, we observed an overlap of 62.3% and 61.8% for the luminal and basal proteomes, respectively (Fig. 4a,c). For phosphoproteome, the overlap was 27.7% and 28% for luminal and basal phosphosites, respectively (Fig. 4b,d). Using Gene Set Enrichment Analysis44, we also converted the proteome and phosphoproteome data to pathways from the Molecular Signature database, MSigDB. As single protein and phophosite measurements are further collapsed at the pathway level, even higher correlations can be observed for the proteome and phosphoproteome pathway datasets (Supplementary Fig. 10). Data from all laboratories confirmed the subtype identity of the analyzed PDX tumor sample at the pathway level.
Fig. 4 |. Breast cancer subtype-specific protein and phosphorylation site expression identified by three laboratories.
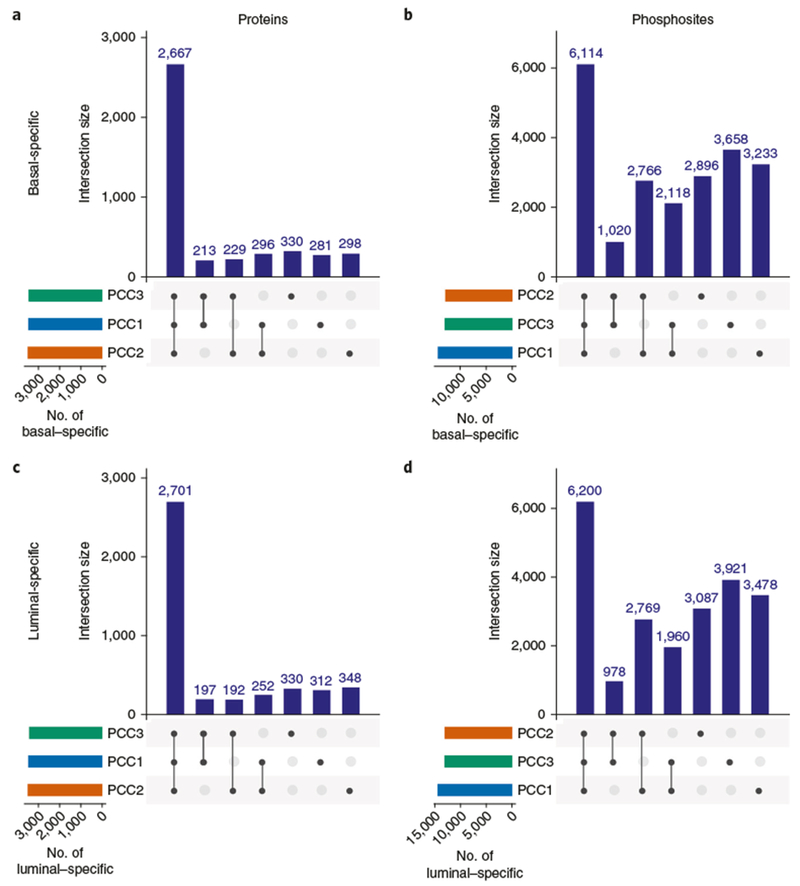
Differences in the expression of proteins and phosphorylation sites between luminal and basal tumor subtypes were determined by a two-sample moderated t test at a 1% FDR. The results of the analysis are illustrated as ‘UpSet’ plots. Horizontal bars indicate total number of features detected by each laboratory; vertical bars depict the number of jointly detected features, as indicated by the layout matrix below. a,b, Comparison of proteins (a) and phosphorylation sites (b) highly expressed in the basal subtype. c,d, Comparison of proteins (c) and phosphorylation sites (d) highly expressed in the luminal subtype. Approximately two-thirds of the phosphosites that were quantified as differentially expressed by a single laboratory were also only detected by a single laboratory. PDX models used in this study were approved by the institutional animal care and use committee at Washington University in St. Louis.
In studies of human-only breast tumor tissue, we have achieved typical coverage depth of >8,000 proteins per experiment (>2 unique peptides/protein) and >25,000 phosphorylation sites per experiment using the protocol described here (P.M., L.C.T., K.K., K.R.C., M.A. Gillette, D.R.M., F.M., H.K., S.R.D., S.A.C. & S. Satpathy, Broad Institute; M. Ellis, Baylor College of Medicine; L. Ding, Washington University School of Medicine; K. Ruggles and D. Fenyo, New York University; B. Zhang, Baylor College of Medicine; H. Rodriguez, C. Kinsinger, E. Boja and M. Mesri, National Cancer Institute; data accessible at https://cptac-data-portal.georgetown.edu/cptac/s/S039?; Study name: CPTAC breast cancer confirmatory study).
Concluding remarks
The optimized protocol presented here enables deep-scale and reproducible proteomics data and results to be obtained within and across laboratories conducting tissue or cell analyses. The workflow was systematically characterized and analytically validated across three independent laboratories using two distinct breast cancer subtypes. Proteome coverages of >10,000 proteins per sample and >37,000 quantified phosphosites per sample were obtained for each PDX-tumor sample with high reproducibility with respect to both the overall numbers, differentially detected proteins and phosphosites, and the biology represented. The high-quality data obtained are suitable for proteogenomic data integration and will enable proteomics-based pan-cancer studies. The entire procedure, including sample processing and data generation, can be completed within 10 d for ten tissue samples, and 100 samples can be completed in ~4 months, using a single LC-MS/MS instrument. Although the present study focuses on tissue analysis, the procedure is equally applicable to cell lines.
Supplementary Material
Acknowledgements
We thank M.J. Ellis of the Lester and Sue Smith Breast Center, the Dan L. Duncan Comprehensive Cancer Center and the Departments of Medicine and Molecular and Cellular Biology, Baylor College of Medicine, and S. Li of the Human and Mouse Linked Evaluation of Tumor Core, Division of Oncology, Washington University School of Medicine, for development of the breast xenograft samples used; and J. Snider and P. Erdmann-Gilmore for the large-scale preparation of the cryopulverized tumor tissue. We also thank S. Stein and S. Markey of the National Institutes of Science and Technology for insightful comments. This work was supported by grants from the National Cancer Institute (NCI) Clinical Proteomic Tumor Analysis Consortium ((CPTAC) to S.A.C. and M.A.G. at the Broad Institute of MIT and Harvard (1U24CA210986); to T.L. and R.D.S. at the Pacific Northwest National Laboratories (U24CA210955); to D.W.C., H.Z. and Z.Z. at Johns Hopkins University (U24CA210985); and to R.R.T. (U24CA160035). Proteomics work at PNNL described herein was carried out in the Environmental Molecular Sciences Laboratory, a U.S. Department of Energy (DOE) national scientific user facility located at PNNL in Richland, Washington. PNNL is a multiprogram national laboratory operated by the Battelle Memorial Institute for the DOE under contract DE-AC05-76RL01830. Research reported in this publication was supported by a Washington University Institute of Clinical and Translational Sciences grant (UL1 TR000448) from the National Center for Advancing Translational Sciences (NCATS) of the National Institutes of Health (NIH). The content is solely the responsibility of the authors and does not necessarily represent the official view of the NIH.
Competing interests
The authors declare no competing interests.
Additional information
Supplementary information is available for this paper at https://doi.org/10.1038/s41596-018-0006-9.
Reprints and permissions information is available at www.nature.com/reprints.
Related links
1. Mertins, P. et al. Nature 534, 55–62 (2016) http://dx.doi.org/10.1038/nature18003
2. Zhang, H. et al. Cell 166, 755–765 (2016) http://dx.doi.org/10.1016/j.cell.2016.05.069
3. Mundt, F. et al. Cancer Res. 78, 2732–2746 (2018) http://dx.doi.org/10.1158/0008-5472.CAN-17-1990
References
- 1.Zhang B et al. Proteogenomic characterization of human colon and rectal cancer. Nature 513, 382–387 (2014). [DOI] [PMC free article] [PubMed] [Google Scholar]
- 2.Mertins P et al. Proteogenomics connects somatic mutations to signaling in breast cancer. Nature 534, 55–62 (2016). [DOI] [PMC free article] [PubMed] [Google Scholar]
- 3.Zhang H et al. Integrated proteogenomic characterization of human high-grade serous ovarian cancer. Cell 166, 755–765 (2016). [DOI] [PMC free article] [PubMed] [Google Scholar]
- 4.Ntai I et al. Integrated bottom-up and top-down proteomics of patient-derived breast tumor xenografts. Mol. Cell. Proteomics 15, 45–56 (2016). [DOI] [PMC free article] [PubMed] [Google Scholar]
- 5.Geiger T, Wehner A, Schaab C, Cox J & Mann M Comparative proteomic analysis of eleven common cell lines reveals ubiquitous but varying expression of most proteins. Mol. Cell. Proteomics. 11, M111.014050 (2012). [DOI] [PMC free article] [PubMed] [Google Scholar]
- 6.Coscia F et al. Integrative proteomic profiling of ovarian cancer cell lines reveals precursor cell associated proteins and functional status. Nat. Commun. 7, 1–14 (2016). [DOI] [PMC free article] [PubMed] [Google Scholar]
- 7.Geiser L, Dayon L, Vaezzadeh AR & Hochstrasser DF Shotgun proteomics: a relative quantitative approach using off-gel electrophoresis and LC-MS/MS. Methods Mol. Biol. 681, 459–472 (2011). [DOI] [PubMed] [Google Scholar]
- 8.Dwivedi RC et al. Practical implementation of 2D HPLC scheme with accurate peptide retention prediction in both dimensions for high-throughput bottom-up proteomics. Anal. Chem. 80, 7036–7042 (2008). [DOI] [PubMed] [Google Scholar]
- 9.Gilar M, Olivova P, Daly AE & Gebler JC Orthogonality of separation in two-dimensional liquid chromatography. Anal. Chem. 77, 6426–6434 (2005). [DOI] [PubMed] [Google Scholar]
- 10.Delmotte N, Lasaosa M, Tholey A, Heinzle E & Huber CG Two-dimensional reversed-phase × ionpair reversed-phase HPLC: an alternative approach to high-resolution peptide separation for shotgun proteome analysis. J. Proteome Res. 6, 4363–4373 (2007). [DOI] [PubMed] [Google Scholar]
- 11.Song C et al. Reversed-phase-reversed-phase liquid chromatography approach with high orthogonality for multidimensional separation of phosphopeptides. Anal. Chem. 82, 53–56 (2010). [DOI] [PubMed] [Google Scholar]
- 12.Wang Y et al. Reversed-phase chromatography with multiple fraction concatenation strategy for proteome profiling of human MCF10A cells. Proteomics 11, 2019–2026 (2011). [DOI] [PMC free article] [PubMed] [Google Scholar]
- 13.Mertins P et al. Integrated proteomic analysis of post-translational modifications by serial enrichment. Nat. Methods 10, 634–637 (2013). [DOI] [PMC free article] [PubMed] [Google Scholar]
- 14.Batth TS, Francavilla C & Olsen JV Off-line high-pH reversed-phase fractionation for in-depth phosphoproteomics. J. Proteome Res. 13, 6176–6186 (2014). [DOI] [PubMed] [Google Scholar]
- 15.Ong SE & Mann M Mass spectrometry-based proteomics turns quantitative. Nat. Chem. Biol. 1, 252–262 (2005). [DOI] [PubMed] [Google Scholar]
- 16.Rauniyar N & Yates JR Isobaric labeling-based relative quantification in shotgun proteomics. J. Proteome Res. 13, 5293–5309 (2014). [DOI] [PMC free article] [PubMed] [Google Scholar]
- 17.Geiger T, Cox J, Ostasiewicz P, Wisniewski JR & Mann M Super-SILAC mix for quantitative proteomics of human tumor tissue. Nat. Methods 7, 383–385 (2010). [DOI] [PubMed] [Google Scholar]
- 18.Molina H et al. Temporal profiling of the adipocyte proteome during differentiation using a five-plex SILAC based strategy. J. Proteome Res. 8, 48–58 (2009). [DOI] [PMC free article] [PubMed] [Google Scholar]
- 19.Bantscheff M, Schirle M, Sweetman G, Rick J & Kuster B Quantitative mass spectrometry in proteomics: a critical review. Anal. Bioanal. Chem. 389, 1017–1031 (2007). [DOI] [PubMed] [Google Scholar]
- 20.Rauniyar N & Yates JR III Isobaric labeling-based relative quantification in shotgun proteomics. J. Proteome Res. 13, 5293–5309 (2014). [DOI] [PMC free article] [PubMed] [Google Scholar]
- 21.Ross PL et al. Multiplexed protein quantitation in Saccharomyces cerevisiae using amine-reactive isobaric tagging reagents. Mol. Cell. Proteomics 12, 1154–1169 (2004). [DOI] [PubMed] [Google Scholar]
- 22.Thompson A et al. Tandem mass tags: a novel quantification strategy for comparative analysis of complex protein mixtures by MS/MS. Anal. Chem. 75, 1895–1904 (2003). [DOI] [PubMed] [Google Scholar]
- 23.Pichler P et al. Peptide labeling with isobaric tags yields higher identification rates using iTRAQ 4-plex compared to TMT 6-plex and iTRAQ 8-plex on LTQ Orbitrap. Anal. Chem. 82, 6549–6558 (2010). [DOI] [PMC free article] [PubMed] [Google Scholar]
- 24.Raso C et al. Characterization of breast cancer interstitial fluids by TmT labeling, LTQ-Orbitrap Velos mass spectrometry, and pathway analysis. J. Proteome Res. 11, 3199–3210 (2012). [DOI] [PMC free article] [PubMed] [Google Scholar]
- 25.Werner T et al. Ion coalescence of neutron encoded TMT 10-plex reporter ions. Anal. Chem. 86, 3594–3601 (2014). [DOI] [PubMed] [Google Scholar]
- 26.Mertins P et al. Ischemia in tumors induces early and sustained phosphorylation changes in stress kinase pathways but does not affect global protein levels. Mol. Cell. Proteomics. 13, 1690–1704 (2014). [DOI] [PMC free article] [PubMed] [Google Scholar]
- 27.Svinkina T et al. Deep, quantitative coverage of the lysine acetylome using novel anti-acetyl-lysine antibodies and an optimized proteomic workflow. Mol. Cell. Proteomics 14, 2429–2440 (2015). [DOI] [PMC free article] [PubMed] [Google Scholar]
- 28.Böhm G et al. Low-pH solid-phase amino labeling of complex peptide digests with TMTs improves peptide identification rates for multiplexed global phosphopeptide analysis. J. Proteome Res. 14, 2500–2510 (2015). [DOI] [PubMed] [Google Scholar]
- 29.Wiktorowicz JE, English RD, Wu Z & Kurosky A Model studies on iTRAQ modification of peptides: sequence-dependent reaction specificity. J. Proteome Res. 11, 1512–1520 (2012). [DOI] [PMC free article] [PubMed] [Google Scholar]
- 30.Thingholm TE, Palmisano G, Kjeldsen F & Larsen MR Undesirable charge-enhancement of isobaric tagged phosphopeptides leads to reduced identification efficiency. J. Proteome Res. 9, 4045–4552 (2010). [DOI] [PubMed] [Google Scholar]
- 31.Karp NA et al. Addressing accuracy and precision issues in iTRAQ quantitation. Mol. Cell. Proteomics 9, 1885–1897 (2010). [DOI] [PMC free article] [PubMed] [Google Scholar]
- 32.Savitski MM et al. Measuring and managing ratio compression for accurate iTRAQ/TMT quantification. J. Proteome Res. 12, 3586–3598 (2013). [DOI] [PubMed] [Google Scholar]
- 33.Ting L, Rad R, Gygi SP & Haas W MS3 eliminates ratio distortion in isobaric multiplexed quantitative proteomics. Nat. Methods 8, 937–940 (2011). [DOI] [PMC free article] [PubMed] [Google Scholar]
- 34.May JC & McLean JA Ion mobility-mass spectrometry: time-dispersive instrumentation. Anal. Chem. 87, 1422–1436 (2014). [DOI] [PMC free article] [PubMed] [Google Scholar]
- 35.Pfammatter S, Bonneil W & Thibault P Improvement of quantitative measurements in multiplex proteomics using high-field asymmetric waveform ion mobility spectrometry. J. Proteome Res. 15, 4653 (2016). [DOI] [PubMed] [Google Scholar]
- 36.Ibrahim YM et al. New frontiers for mass spectrometry based upon structures for lossless ion manipulations. Analyst 142, 1010–1021 (2017). [DOI] [PMC free article] [PubMed] [Google Scholar]
- 37.Shadforth IP, Dunkley TP, Lilley KS & Bessant C i-Tracker: for quantitative proteomics using iTRAQ. BMC Genomics 6, 145–150 (2005). [DOI] [PMC free article] [PubMed] [Google Scholar]
- 38.Rappsilber J, Mann M & Ishihama Y Protocol for micro-purification, enrichment, pre-fractionation and storage of peptides for proteomics using StageTips. Nat. Protocols 2, 1896–1906 (2007). [DOI] [PubMed] [Google Scholar]
- 39.Rodriguez J, Gupta N, Smith RD & Pevzner PA Does trypsin cut before proline? J. Proteome Res. 7, 300–305 (2008). [DOI] [PubMed] [Google Scholar]
- 40.Mertins P et al. iTRAQ labeling is superior to mTRAQ for quantitative global proteomics and phosphoproteomics. Mol. Cell. Proteomics 11, M111.014423 (2012). [DOI] [PMC free article] [PubMed] [Google Scholar]
- 41.Wenger CD et al. Gas-phase purification enables accurate, multiplexed proteome quantification with isobaric tagging. Nat. Methods 8, 933–935 (2011). [DOI] [PMC free article] [PubMed] [Google Scholar]
- 42.Tabb D et al. Reproducibility of differential proteomic technologies in CPTAC fractionated xenografts. J. Proteome Res. 15, 691–706 (2016). [DOI] [PMC free article] [PubMed] [Google Scholar]
- 43.Hogrebe A et al. Benchmarking common quantification strategies for large-scale phosphoproteomics. Nat. Commun 9, 1045 (2018). [DOI] [PMC free article] [PubMed] [Google Scholar]
- 44.Subramanian A et al. Gene set enrichment analysis: a knowledge-based approach for interpreting genomewide expression profiles. Proc. Natl. Acad. Sci. USA 102, 15545–15550 (2005). [DOI] [PMC free article] [PubMed] [Google Scholar]
Associated Data
This section collects any data citations, data availability statements, or supplementary materials included in this article.