

Abstract
RNA binding proteins play an important role in regulating alternative pre-mRNA splicing and in turn cellular gene expression. Many of these RNA binding proteins occur as gene families with members sharing a high degree of primary structure identity and domain organization yet have tissue-specific expression patterns and regulate different sets of target exons. How highly similar members in a gene family can exert different splicing outcomes is not well understood. We conducted mass spectrometry analysis of post-translational phosphorylation and acetylation modifications for two paralogs of the polypyrimidine tract binding protein family, PTBP1 and PTBP2, to discover modifications that occur in splicing reaction mixtures and to identify discrete modifications that may direct their different splicing activities. We find that PTBP1 and PTBP2 have many distinct phosphate modifications located in the unstructured N-terminal, linker 1, and linker 2 regions. We find that the two proteins have many overlapping acetate modifications in the RNA recognition motifs (RRMs) with a few distinct sites in PTBP1 RRM2 and RRM3. Our data also reveal that lysine residues in the nuclear localization sequence of PTBP2 are acetylated. Collectively, our results highlight important differences in post-translational modifications between the paralogs and suggest a role for them in the differential splicing activity of PTBP1 and PTBP2
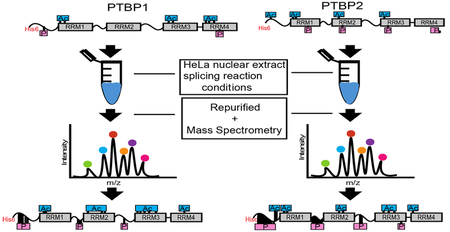
Graphical Abstract
Alternative pre-mRNA splicing, a key process that contributes to the increase in protein diversity, allows single multiexon genes to encode more than one protein isoform.1,2 RNA binding proteins play an important role in regulating this process; they bind with sequence specificity to cis regulatory elements on pre-mRNA substrates and either enhance or disrupt the formation of a functional spliceosome at adjacent splice sites.3–5 The spliceosome, a large ribonucleo-protein complex, has many protein−RNA and protein−protein interactions that are critical for splice site selection and splicing activity.6
Many of these RNA binding proteins occur as gene families with members sharing a high degree of amino acid sequence identity and similar domain organization but have distinct tissue-specific expression patterns and exert different splicing outcomes on certain regulated exons.7,8 How structurally related proteins within a gene family dictate different splicing outcomes is not well understood. The polypyrimidine tract binding proteins, PTBP1 and PTBP2, are paralogous RNA binding proteins derived from two genes related via gene duplication.8,9 There is also a third family member, PTBP3 (Rod1), expressed primarily in hematopoietic cells.10,11 PTBP1 and PTBP2 share 74% sequence identity and a similar domain organization: four RNA recognition motifs (RRMs) joined by three linker regions and an N-terminal region containing a nuclear localization and nuclear export sequence. PTBP1 and PTBP2 most often function as splicing repressors, but can also enhance splicing of exons.12–20 PTBP1 represses inclusion of certain regulated exons in neuronal transcripts such as the c-Src N1 exon and CaV1.2 exon 8 while PTBP2 does not.21,22 Moreover, the two proteins have tissue-specific expression patterns where PTBP1 is expressed in most cell types and neuronal progenitor cells whereas PTBP2 is expressed primarily in neurons and testis.8 During neuronal differentiation, the levels of PTBP1 decrease and the levels of PTBP2 increase.14,18,23 This change in protein concentrations influences the splicing of PTBP1 sensitive exons, which can now be included or excluded in final spliced mRNA. This in turn generates protein isoforms critical for neuronal differentiation.19,24 Later, during neuronal maturation, the level of PTBP2 also decreases, causing a second switch in the neuronal splicing program. Splicing changes accompanied by alterations in the amounts of PTBP1 and PTBP2 are critical for neuronal differentiation and maturation.17–19,25,26
Our recent study using PTBP1−PTBP2 chimeric proteins highlighted that determinants of PTBP repression activity are distributed over multiple regions of the protein.27 For the two cassette exons analyzed, chimeras that had PTBP1 RRM2 in an otherwise PTBP2 protein were repressive for both exons. However, chimeras that contained either PTBP1 RRM1 or the linker 2 region in an otherwise PTBP2 protein affected repression of the two exons differently; both chimeras repressed inclusion of one exon but not the other. These findings highlight the fact that additional features of PTBP1 and PTBP2 such as interdomain interactions, protein−protein interactions, and/or post-translational modifications may regulate their different splicing activities. Notably, the study also highlighted that the different splicing activities observed for the two proteins in vivo could be reproduced in vitro with bacterially expressed and purified recombinant PTBP1 and PTBP2.
In a previous study conducted by Chou et al., PTBP1 and PTBP2 displayed different RNA binding affinities in splicing reaction mixtures containing ATP; PTBP1 remained bound to the RNA, whereas PTBP2 dissociated, suggesting a role for ATP-dependent phosphorylation in PTBP2 splicing regulation.28 In a separate study conducted to determine the lysine acetylome of three different cell lines, RNA recognition motifs were found to be the most acetylated versus other domains.29 These studies suggest that PTBP1 and PTBP2 might be post-translationally modified in specific regions and that there may be respective differences in how they are modified. To identify post-translational phosphate and acetate modifications that occur on PTBP1 and PTBP2, we incubated the proteins under splicing reaction conditions and assayed for modifications via mass spectrometry. Our data reveal many distinct and overlapping phosphate and acetate modifications, respectively, over the entire length of the two proteins. We discuss our results highlighting distinct modifications in PTBP1 and PTBP2 that may dictate their divergent splicing activities
■. MATERIALS AND METHODS
Expression and Purification of Recombinant Protein.
The His6−tagged PQE80L-PTBP1 and PQE80L-PTBP2 plasmids were transformed into Escherichia coli BL21 (DE3). Bacterial cultures (500 mL) were grown at 37 °C in LB medium containing 0.1 mg/mL ampicillin until the A600 reached ~0.6. The culture was adjusted to 0.4 mM isopropyl β−D-1-thiogalactopyranoside and incubated at 37 °C for 4 h while being constantly shaken. Cells were harvested by centrifugation, and the pellets were stored at −80 °C. All subsequent procedures were performed at 4 °C. Cells were resuspended in 25 mL of binding buffer [50 mM Na.PO4 (pH 8.0), 300 mM NaCl, 10 mM imidazole, 1× PhosStop phosphatase inhibitor, and 1× SigmaFast protease inhibitor]. Cell lysis was achieved by the addition of lysozyme to a final concentration of 1 mg/mL, and cells were sonicated to reduce viscosity. Insoluble material was removed by centrifugation. The soluble fractions were applied to 3 mL columns of Ni-NTA agarose beads that had been equilibrated with binding buffer. The columns were washed with 20 mL of wash buffer [50 mM Na.PO4 (pH 8.0), 300 mM NaCl, 20 mM imidazole, 1× PhosStop phosphatase inhibitor, and 1X SigmaFast protease inhibitor] and then eluted with 0.5 mL aliquots of elution buffer [50 mM Na.PO4 (pH 8.0), 300 mM NaCl, 350 mM imidazole, 1× PhosStop phosphatase inhibitor, and 1× SigmaFast protease inhibitor]. Peak fractions were pooled and dialyzed against 2 × 2 L of buffer DG [20 mM HEPES-KOH (pH 7.9), 80 mM potassium glutamate, 0.1 mM EDTA, 1 mM DTT, 0.1 mM PMSF, 20% glycerol, 1× PhosStop phosphatase inhibitor, and 1× SigmaFast protease inhibitor].
Purification of His-Tagged PTBP from the HeLa Nuclear Extract for Mass Spectrometry Analysis.
Ni2+ affinity-purified His6−tagged PTBP1 and PTBP2 (12 μg) were incubated in 50 μL splicing reaction mixtures (30 μL of HeLa nuclear extract, 2.2 mM MgCl2, 0.4 mM ATP, and 20 mM creatine phosphate, and brought to 50 μL with HeLa nuclear extract) for 90 min in a 30 °C water bath. Nuclear extracts from HeLa cells were prepared as described previously.30 The splicing mixtures were added to 12 μL of Ni-NTA resin equilibrated with buffer DG [20 mM HEPES-KOH (pH 7.9), 80 mM KCl, 0.2 mM EDTA, 0.2 mM PMSF, 1 mM DTT, 20% glycerol, and 3× PhosSTOP phosphatase inhibitor]; 50 μL of buffer DG was added to the splicing mixtures, and they were incubated overnight on a rocker at 4 °C. The samples were centrifuged at 700g for 2 min, and the supernatant was removed. The beads were washed twice with 24 μL of wash buffer [50 mM sodium phosphate (pH 8.0), 150 mM NaCl, 30 mM imidazole, 1× PhosSTOP phosphatase inhibitor, and 1× SIGMAFAST protease inhibitor] and centrifuged at 700g for 2 min to remove nonspecifically bound proteins. The bound proteins were eluted overnight with 15 μL of elution buffer [50 mM sodium phosphate (pH 8.0), 150 mM NaCl, 250 mM imidazole, 1× PhosSTOP phosphatase inhibitor, and 1× SIGMAFAST inhibitor] at 4 °C on a vortexer. The eluate was centrifuged at 700g for 5 min, and the supernatant was saved as the elution fraction.
Sodium Dodecyl Sulfate−Polyacrylamide Gel Electrophoresis (SDS−PAGE).
Elution fractions were prepared for electrophoresis by adding Laemmli SDS gel loading dye and heating on a heat block at 95 °C for 2 min. Samples were loaded into a NuPAGE 4 to 12% Bis-Tris gel (Thermo Scientific) for gel electrophoresis at 60 V for 45 min followed by 120 V for 90 min. The gel was stained with GelCode Blue Safe Protein stain (Thermo Scientific), and the gel bands corresponding to the molecular weights of PTBP1 and PTBP2 were cut out using scalpels, diced into cubes, and transferred to 1.5 mL microcentrifuge tubes following sample preparation guidelines provided by the University of California at San Diego (UCSD) Biomolecular and Proteomics Mass Spectrometry Facility (BPMS). The gel pieces were washed and stored in Nanopure water and shipped to the UCSD BPMS facility.
Mass Spectrometry Protocol and Data Acquisition.31,32
In-Gel Digest. The gel slices were cut into 1 mm × 1 mm cubes and destained three times by first washing with 100 μL of 100 mM ammonium bicarbonate for 15 min, followed by addition of the same volume of acetonitrile (ACN) for 15 min. The supernatant was removed, and samples were dried in a speedvac. Samples were then reduced by being mixed with 200 μL of 100 mM ammonium bicarbonate and 10 mM DTT and incubated at 56 °C for 30 min. The liquid was removed, and 200 μL of 100 mM ammonium bicarbonate and 55 mM iodoacetamide was added to gel pieces and incubated at room temperature in the dark for 20 min. After the removal of the supernatant and one wash with 100 mM ammonium bicarbonate for 15 min, the same volume of ACN was added to dehydrate the gel pieces. The solution was then removed, and samples were dried in a speedvac. For digestion, enough of a solution of ice-cold trypsin (0.01 μg/μL) in 50 mM ammonium bicarbonate was added to cover the gel pieces and set on ice for 30 min. After complete rehydration, the excess trypsin solution was removed, replaced with fresh 50 mM ammonium bicarbonate, and left overnight at 37 °C. The peptides were extracted twice by the addition of 50 μL of 0.2% formic acid and 5% ACN and vortex mixing at room temperature for 30 min. The supernatant was removed and saved. A total of 50 μL of 50% ACN and 0.2% formic acid was added to the sample, which was vortexed again at room temperature for 30 min. The supernatant was removed and combined with the supernatant from the first extraction. The combined extractions are analyzed directly by liquid chromatography (LC) in combination with tandem mass spectroscopy (MS/MS) using electrospray ionization.
LC−MS/MS Analysis. For LC−MS/MS, trypsin-digested peptides were analyzed by ultra-high-pressure liquid chromatography (UPLC) coupled with tandem mass spectroscopy (LC−MS/MS) using nanospray ionization. The nanospray ionization experiments were performed using an Orbitrap fusion Lumos hybrid mass spectrometer (Thermo) interfaced with a nanoscale reversed-phase UPLC system (Thermo Dionex UltiMate 3000 RSLC nano System) using a 25 cm, 75 μm inside diameter glass capillary packed with 1.7 μm C18 (130) BEH beads (Waters Corp.). Peptides were eluted from the C18 column into the mass spectrometer using a linear gradient (5 to 80%) of ACN at a flow rate of 375 μL/min for 1h. The buffers used to create the ACN gradient were buffer A (98% H2O, 2% ACN, and 0.1% formic acid) and buffer B (100% ACN and 0.1% formic acid). The mass spectrometer parameters were as follows. An MS1 survey scan using the orbitrap detector [mass range (m/z) of 400−1500 (using quadrupole isolation), resolution of 120000, spray voltage of 2200 V, ion transfer tube temperature of 275 °C, AGC target of 400000, and maximum injection time of 50 ms] was followed by data-dependent scans (top speed for most intense ions, with the charge state set to include only +2 to +5 ions, and a 5 s exclusion time), while selecting ions with minimal intensities of 50000 in which the collision event was performed in the high-energy collision cell (HCD collision energy of 30%), and the fragment masses were analyzed in the ion trap mass analyzer (with an ion trap scan rate of turbo, first mass m/z was 100, AGC target of 5000, and maximum injection time of 35 ms). Protein identification and label free quantification were performed using Peaks Studio 8.5 (Bioinformatics Solutions Inc.).
Calculation of Modification Percentages.
Modification percentages were calculated by counting the total number of fragments containing a modified residue and then dividing by the total number of fragments that contain the residue, followed by multiplication by 100. The values in the tables are averages from two independent experiments.
■. RESULTS
Overexpression and Purification of Recombinant PTBP1 and PTBP2.
PTBP1 and PTBP2, recombinantly expressed and purified from bacteria, when incubated in HeLa nuclear extract under splicing reaction conditions demonstrated different splicing repression activities on the c-Src N1 exon; PTBP1 repressed splicing of N1, while PTBP2 did not.27 Here, we probed these nuclear extract-incubated recombinant proteins for post-translational acetate and phosphate modifications to elucidate differences in modifications between the paralogs.
His-tagged recombinant PTBP1 and PTBP2 were expressed in Escherichia coli and purified via Ni2+ affinity chromatography (panels A and B of Figure 1, respectively). Purified proteins were then incubated in the mammalian HeLa cell nuclear extract under splicing reaction conditions, isolated using Ni2+- NTA beads, and separated via SDS−PAGE (Figure 1C). Bands corresponding to PTBP1 and PTBP2 were excised from the gel and analyzed for modifications via mass spectrometry along with bacterially purified PTBP1 and PTBP2 as controls.
Figure 1.

(A and B) Purification of His6−tagged PTBP1 and PTBP2. Aliquots (10 μL) of the indicated fractions were analyzed by SDS− PAGE. The gel was stained with Coomassie blue dye. The positions and sizes (kilodaltons) of marker polypeptides are shown at the left. (C) Purification of His6−tagged PTBP from 50 μL splicing reaction mixtures containing HeLa nuclear extract, 2.2 mM MgCl2, 0.4 mM ATP, and 20 mM creatine phosphate. Aliquots (10 μL) of the indicated fractions were analyzed by SDS−PAGE. The gel was stained with Gel Code blue safe stain. The positions and sizes (kilodaltons) of marker polypeptides are shown at the left.
Post-Translational Modifications in PTBP1 and PTBP2.
Mass spectrometry results reveal acetate and phosphate modifications on the PTB proteins in both the control and nuclear extract-incubated conditions (Tables 1 and 2). Reversible acetylation−deacetylation is performed by lysine acetyltransferases (KATs) and lysine deacetylases (KDACs), respectively (Figure 2A). Acetyl modifications in bacterially expressed proteins are mediated by KATs and KDACs that have been identified in bacteria, including E. coli.33 Our results indicate that PTBP1 and PTBP2 have many overlapping and a few distinct acetylated residues in the RRM and N-terminal regions, respectively. This observation is consistent with previous reports that acetylation occurs preferentially in structured regions of proteins.29,34 Our data also reveal distinct phosphoryl modifications in the unstructured N-terminal, linker 1, and linker 2 regions of the PTBPs, including previously characterized sites, Ser16 and Ser21.35 These results are consistent with reports that phosphorylation occurs on unstructured regions of the proteins.36,37 Phosphate groups are added and removed reversibly by protein kinases and phosphatases, respectively (Figure 2B).
Table 1.
Post-Translational Acetate and Phosphate Modifications in Bacterially Overexpressed PTBP1 and PTBP2a
| Post-translational modifications in bacterial expressed and purified PTB proteins | ||||||
|---|---|---|---|---|---|---|
| PTBP1 | PTBP2 | |||||
| Residue No. | % Acetylation | % Phosphorylation | Residue No. | % Acetylation | % Phosphorylation | |
| N-terminal region | S44 | ┄ | 4.00 ±2.00 | S44 | ┄ | ┄ |
| K45 | ┄ | ┄ | K45 | 39.00 ± 11.00 | ┄ | |
| RRM1 | K65 | 7.50 ± 1.50 | ┄ | K65 | 8.50 ±4.50 | ┄ |
| K92 | 2.00 ± 1.00 | ┄ | K92 | 1.50 ±0.50 | ┄ | |
| S131 | ┄ | ┄ | S131 | ┄ | 5.00 ±2.50 | |
| RRM2 | Y247 | ┄ | ┄ | Y244 | ┄ | 100.00 ±50.00 |
| K266 | ┄ | ┄ | K263 | 4.50 ± 3.50 | ┄ | |
| RRM3 | K424 | 62.50 ± 29.50 | ┄ | K399 | 82.50 ± 5.50 | ┄ |
| H426 | ┄ | ┄ | Y401 | ┄ | 7.00 ± 3.50 | |
| K436 | 27.50 ± 8.50 | ┄ | K411 | ┄ | ┄ | |
| RRM4 | T481 | ┄ | ┄ | T456 | ┄ | 1.00 ±0.50 |
| K508 | 22.50 ±2.50 | ┄ | K483 | ┄ | ┄ | |
| K511 | 62.00 ± 38.00 | ┄ | K486 | ┄ | ┄ | |
| K518 | 28.50 ±16.50 | ┄ | K493 | ┄ | ┄ | |
| S526 | ┄ | 1.00 ±0.50 | T501 | ┄ | 1.00 ±0.50 | |
The data reported are the average of two independent experiments.
Table 2.
Post-Translational Acetate and Phosphate Modifications in PTBPs Incubated in Splicing Reaction Mixtures Containing HeLa Cell Nuclear Extracta
| Post-translational modifications in PTB proteins under splicing reaction conditions | ||||||
|---|---|---|---|---|---|---|
| PTBP1 | PTBP2 | |||||
| Residue No. | % Acetylation | % Phosphorylation | Residue No. | % Acetylation | % Phosphorylation | |
| N-terminal region | S16 | ┄ | 1.50 ±0.20 | S16 | ┄ | 1.40 ±0.40 |
| S21 | ┄ | 0.85 ±0.10 | S21 | ┄ | 3.80 ± 1.30 | |
| T22 | ┄ | 0.64 ± 0.22 | G22 | ┄ | ┄ | |
| N26 | ┄ | ┄ | S26 | ┄ | 2.10 ± 1.00 | |
| G27 | ┄ | ┄ | S27 | ┄ | 1.92 ±1.19 | |
| I30 | ┄ | ┄ | S30 | ┄ | 1.08 ±0.33 | |
| S33 | ┄ | 1.13 ±0.68 | S33 | ┄ | 0.74 ± 0.04 | |
| N34 | ┄ | ┄ | S34 | ┄ | 1.44 ±0.66 | |
| S35 | ┄ | 0.72 ± 0.24 | M35 | ┄ | ┄ | |
| A38 | ┄ | ┄ | T38 | ┄ | 1.10 ± 0.31 | |
| S44 | ┄ | ┄ | S44 | ┄ | 0.75 ± 0.35 | |
| K45 | ┄ | ┄ | K45 | 7.55 ±4.35 | ┄ | |
| K46 | ┄ | ┄ | K46 | 1.22 ±0.68 | ┄ | |
| RRM1 | K92 | 7.65 ±4.15 | ┄ | K92 | 8.10 ±5.20 | ┄ |
| K94 | 4.30 ± 1.60 | ┄ | K94 | 11.20 ±8.80 | ┄ | |
| Linker-1 | N155 | ┄ | ┄ | T154 | ┄ | 7.45 ± 2.05 |
| S156 | ┄ | 5.60 ± 1.20 | A155 | ┄ | ┄ | |
| S159 | ┄ | 1.75 ±0.35 | T158 | ┄ | 3.55 ± 0.95 | |
| L162 | ┄ | ┄ | T161 | ┄ | 2.25 ± 0.05 | |
| A165 | ┄ | ┄ | S164 | ┄ | 5.55 ± 1.25 | |
| S167 | ┄ | 4.35 ± 0.55 | ||||
| A169 | ┄ | ┄ | T166 | ┄ | 5.60 ± 0.80 | |
| A170 | ┄ | ┄ | T167 | ┄ | 4.35 ±2.05 | |
| G174 | ┄ | ┄ | S171 | ┄ | 3.15 ±0.95 | |
| RRM2 | K218 | 4.50 ± 3.20 | ┄ | K215 | ┄ | ┄ |
| K259 | 12.00 ±8.00 | ┄ | K256 | 11.50 ±8.50 | ┄ | |
| K266 | 9.65 ± 8.55 | ┄ | K263 | 4.15 ±2.55 | ┄ | |
| Linker-2 | L325 | ┄ | ┄ | T298 | ┄ | 26.50 ± 13.50 |
| A335 | ┄ | ┄ | S308 | ┄ | 15.00 ± 1.70 | |
| S341 | ┄ | 2.15 ±0.95 | A316 | ┄ | ┄ | |
| RRM3 | K394 | 28.55 ±21.54 | ┄ | K369 | ┄ | ┄ |
| K400 | 5.23 ± 4.27 | ┄ | K375 | 4.00 ± 0.40 | ┄ | |
| K424 | 11.70 ±6.20 | ┄ | K399 | 11.05 ±8.05 | ┄ | |
| K436 | 15.90 ±9.10 | ┄ | K411 | 15.45 ±8.55 | ┄ | |
| T453 | ┄ | ┄ | T428 | ┄ | 10.80 ±5.90 | |
| K454 | 15.45 ± 13.15 | ┄ | K429 | ┄ | ┄ | |
| RRM4 | K508 | 6.85 ±0.25 | ┄ | K483 | 8.50 ± 5.80 | ┄ |
The data reported are the average of two independent experiments.
Figure 2.

Mechanisms of reversible covalent modifications. (A) Lysine acetylation−deacetylation. Acetyl groups are added by lysine acetyltransferases (KATs) and removed by deacetylases (KDACs). (B) Phosphorylation. Phosphate groups are added by kinases to the side chain hydroxyl groups of serine, threonine, and tyrosine residues. Phosphate groups are removed by phosphatases via hydrolysis.
The NMR solution structures of PTBP1 RRM1, RRM2, RRM3, and RRM4 bound to a CUCUCU RNA hexamer38 are available from the Protein Data Bank (PDB). These structures provide detailed information about atomic contacts between each RRM and the bound RNA substrate. For those PTMs found on RRMs, we used these structures to locate the position of the modified residue to predict its role in RNA binding and/ or interdomain interactions.39
The PTBP1 gene on human chromosome 19 produces several spliced isoforms. PTBP1 isoform 4 produces a 557- amino acid protein and was used in the experiments described in this study.40–42
The N-Terminal Region of PTBP2 Has Distinct Phosphate and Acetate Modifications.
PTBP1 is a shuttling protein that moves between the nucleus and cytoplasm. In the nucleus, it performs functions related to alternative splicing and polyadenylation, while in the cytoplasm, PTBP1 is involved in mRNA localization, stability, and translation.8 The 60 N-terminal residues of PTBP1 and PTBP2 comprise both its nuclear localization sequence (NLS) and nuclear export sequence (NES) (Figure 3).
Figure 3.

Domain structure (top) of the PTB proteins indicating the segments defined in this study. The percent amino acid sequence identity between PTBP1 isoform 4 and PTBP2 is indicated below. Aligned amino acid sequences (bottom) of human PTBP1 isoform 4 and PTBP2. Gaps in the alignment are indicated as dashes. Residues identical to those of PTBP1 are shown as dots. RNA recognition motifs (RRMs) are highlighted in gray.38 Vertical lines above the sequence indicate PTBP1 residues that interact with RNA.38 Arrowheads below the sequence indicate RNA-interacting residues that are different in PTBP2. The bipartite nuclear localization sequence is indicated as NLS. PTBP1-Raver1-interacting motifs are marked with pink bars.
Phosphorylation is the major post-translational modification observed in the N-terminal region (Table 2). Consistent with previous findings, both Ser16 and Ser21 are phosphorylated in PTBP1 and PTBP2.35 Protein kinase A (PKA)-mediated phosphorylation of Ser16 is important for PTBP1 nuclear export, although some shuttling can occur without it. PTBP2 is phosphorylated by PKA; however, the role of Ser16 phosphorylation has not been examined.35
Ser44, a putative protein kinase C phosphorylation site, is phosphorylated in only PTBP2 under splicing conditions (Table 2). In the bacterially expressed proteins, Ser44 is phosphorylated in PTBP1 but not PTBP2 (Table 1). The amino acid sequence in the N-terminal region is 56% identical between PTBP1 and PTBP2, with many nonconservative substitutions between the paralogs at positions 26, 27, 30, 34, 35, and 38 (Figure 3). PTBP1 is phosphorylated at Ser16, Ser21, Thr22, Ser33, and Ser35. PTBP2 has overlapping modifications at counterpart residues at positions 16, 21, and 33 and distinct modifications at Ser26, Ser27, Ser30, Ser34, Thr38, and Ser44 (Table 2). Our recent chimera study revealed a difference in N1 exon splicing when the N-terminal region of PTBP2 was replaced by that of PTBP1; a chimera containing PTBP1 N-terminal and RRM1 regions in an otherwise PTBP2 protein repressed N1 exon splicing like wild-type PTBP1 did. However, a chimera containing only the RRM1 region of PTBP1 in an otherwise PTBP2 protein weakly repressed splicing of the N1 exon.27 Thus, it will be interesting to examine the functional significance of the distinct sites of phosphorylation in this region and whether they play a role in the divergent PTBP splicing activities.
Our data also reveal a difference in acetyl modifications between the paralogs in the N-terminal region. PTBP2 is acetylated at Lys45 and Lys46 (Table 2). For both PTBP1 and PTBP2, the NLS consists of a bipartite signal with two blocks of basic residues spanning Lys13, Arg14, and downstream residues Lys45, Lys46, and Lys48.43–47 Both blocks of basic residues are required for nuclear import.45 Notably, a PTBP1 K45A mutant blocked PTBP1 nuclear localization and accumulated strictly in the cytoplasm.45 Lysine acetylation− deacetylation has been shown to dictate nuclear−cytoplasmic localization of several proteins, including the sex-determining region of the Y chromosome protein and adenovirus-transforming protein E1A.48,49 Thus, whether acetylation at Lys45 and Lys46 is important for PTBP2 nuclear localization is an important question for the future.
Distinct Sites of Phosphorylation in the PTBP Linker 1 and Linker 2 Regions.
Under splicing reaction conditions, we note the linker 1 region of PTBP2 is phosphorylated at seven residues compared to three residues for PTBP1 (Table 2). Except for PTBP1 Ser159 and PTBP2 counterpart Thr158, phosphorylation sites do not overlap between the paralogs in this region. For PTBP2, phosphorylation at residues Thr154, Thr158, Thr161, Ser164, Thr166, Thr167, and Ser171 creates a cluster of negatively charged phosphate moieties in this region. A recent report by Harmon et al. highlights the impact of the physical properties of linker regions, primarily solvation volumes, in dictating interdomain interactions and distances in multivalent proteins.50 Using computer simulations and physics-based theories, the authors concluded that linker regions containing charged residues lead to larger solvation volumes, which in turn drive apart the two domains at either end and vice versa. Thus, it is plausible that phosphorylation at multiple residues in the PTBP2 linker 1 region increases its effective solvation volume causing it to expand and drive apart RRM1 and RRM2, which in turn may play a role in PTBP2 RNA binding and splicing activity.
In the linker 2 region, PTBP1 is phosphorylated at Ser341, while PTBP2 is phosphorylated at Thr298 and Ser308 with percent phosphorylated values of 26.5 and 15.0%, respectively, indicating an increased abundance of these modified residues compared to that of the residues detected in the N-terminal and linker 1 regions (Table 2). The corresponding residues in PTBP1 are substituted with nonconservative amino acids Leu325 and Ala335 (Table 2). A hybrid protein containing PTBP1 linker 2 in an otherwise PTBP2 protein repressed N1 exon splicing like PTBP1 did.27 Thus, it is plausible that phosphorylation of Thr298 and Ser308 plays a role in PTBP2 N1 exon splicing regulation. No modifications were observed in linker 2 for bacterially expressed PTBP1 and PTBP2 (Table 1).
The RRM Regions of PTBP1 and PTBP2 Are Modified by Acetate Groups.
PTBP1 and PTBP2 share 82% sequence identity over the RRM1 region and have identical RNA-interacting residues except for a single phenylalanine to tyrosine substitution (Figure 3). The region has the typical RNA binding domain βαβαβ topology with the two α−helices packed against the four-stranded antiparallel β−sheet that provides a surface for RNA binding (Figure 4A). The RRM1 region binds to CU elements within short pyrimidine tracts and the UUCG tetraloop of U1 snRNA stem loop 4, with dissociation constants of 24.7 and 0.85 μM, respectively.39,51
Figure 4.

(A−C) Cartoon representation of NMR solution structures of PTBP1 RRM1 (PDB entry 2AD9), RRM2 (PDB entry 2ADB), and RRM3 and −4 (PDB entry 2ADC) bound to a CUCUCU hexamer.38 The main chain cartoon traces are colored gray. Post-translationally modified residues identified by mass spectrometry and relevant cytosine and uracil bases of the hexamer are labeled. Side chains of modified residues and the CUCUCU RNA hexamer are shown as sticks and colored by element.
Our data highlight that both PTBP1 and PTBP2 are acetylated at residues Lys92 and Lys94, located at the end of β−strand 2 and the following turn, respectively (Figure 4A). The solution structure of PTBP1 RRM1 bound to a CUCUCU hexamer provides detailed atomic information about the contacts between RRM1 and the substrate. Lys92 does not interact with the bound RNA. We note that Lys94 makes a hydrogen bond interaction with the phosphate backbone between C5 and U6, via its ε−amino group. (The residue numbering is for human PTBP1 isoform 4. The PDB structure files are numbered according to PTBP1 isoform 1. Residues 1− 298 are the same for the two isoforms. For positions above residue 324 in isoform 4, the equivalent residues in isoform 1 or the PDB files are obtained by subtracting 26.) It is plausible that acetylation at this position may abolish this interaction and in turn affect the RNA binding affinity. PTBPs in control samples are additionally acetylated at Lys65; however, this result was not recapitulated under splicing reaction conditions. Given the overlap in modifications in this region, it is unlikely that acetylation in RRM1 contributes to the observed difference in PTBP splicing activity.
PTBP1 and PTBP2 share 87% amino acid sequence identity over the RRM2 region. Our data reveal that PTBP1 is acetylated at Lys218, Lys259, and Lys266. Similarly, two of the three counterpart residues, Lys256 and Lys263, are acetylated in PTBP2 (Table 2). PTBP2 Lys263 is also modified in bacterially expressed proteins (Table 1). Lys218 is located in the turn between β−strands 2 and 3 in the β−sheet (Figure 4B). The side chain ε−amino group makes two hydrogen bond interactions with the phosphate backbone between U2 and C3 and between C3 and U4 of the bound RNA (Figure 4B), highlighting an important role for Lys218 in RNA binding. Whether acetylation at this position is important for PTBP1 splicing activity is currently under investigation in our laboratory. Lys259 and Lys266 are acetylated in both PTBP1 and PTBP2; thus, it is unlikely they dictate their different splicing activities (Table 2). Lys259 and Lys266 interact with the C3 base and the sugar moiety of C5 via main chain and side chain interactions, respectively (Figure 4B). Thus, acetylation at Lys259 may have little effect on RNA binding compared to Lys266. Similar to RRM1, the RRM2 region also binds to structured CU rich regions within stem loops with an affinity higher than that of long single-stranded RNA substrates.51,52
The RRM2 and linker 2 regions of PTBP1 function as a minimal splicing repressor.53 This region is also necessary for PTBP1 nuclear export; deletion of the RRM2 domain completely abolishes PTBP1 nuclear export.54 However, the residues important for this activity are unknown. Whether lysine acetylation in RRM2 is important for PTBP1 nuclear export is currently under investigation in our laboratory. PTBP1 RRM2 also plays a role in interaction with other RNA binding proteins such as Raver 1 and Matrin 3 during splicing repression of certain regulated exons.55–58 Of these, the PTBP1−Raver 1 interaction is best characterized; the α−helical surface of RRM2 interacts with the corepressor Raver 1.57 PTBP1 and PTBP2 share 87% sequence identity over the Raver-interacting motifs (Figure 3); however, PTBP2 binds Raver with an affinity much weaker than that of PTBP1.27 In the control samples, PTBP2 Tyr244 is phosphorylated, but not its PTBP1 counterpart residue (Table 1). Tyr244 is within the Raver interaction motif (Figure 3). However, this difference in phosphorylation is not observed in the nuclear extract. A chimera that contained PTBP1 RRM2 in an otherwise PTBP2 protein repressed inclusion of the c-Src N1 exon to levels similar to those of wild-type PTBP1.27 Thus, acetylation of PTBP1 Lys218 may contribute to the observed differences in PTBP1 and PTBP2 splicing activities.
PTBP1 and PTBP2 share a high degree of primary and tertiary structure similarity over the C-terminal region of the proteins, including RRM3, linker 3, and RRM4 regions.59 RRM3 and RRM4 preferentially bind to pyrimidine (C/U) tracts containing long flexible regions of pre-mRNA substrates.52
The two domains have a fixed orientation with respect to each other where the α−helical sides of RRM3 and RRM4 along with linker 3 form a hydrophobic core between them, orienting the RNA binding β−sheet surfaces onto opposite sides (Figure 4C).38 This arrangement allows PTBP to bind two pyrimidine tracts separated by a linker sequence and induce RNA looping, which has been proposed to prevent binding of other spliceosome components required for splicing.38,60,61
Our data reveal that PTBP1 is acetylated at several lysine residues in the RRM3 region, including Lys394, Lys400, Lys424, Lys436, and Lys454 under splicing reaction conditions (Table 2). The side chain amino group of Lys394 makes hydrogen bond interactions with the phosphate oxygens of C5 and U6 (Figure 4C). Lys400 located in the turn between β−strands 2 and 3 does not interact with the bound RNA. The main chain of Lys436 makes base-specific contacts with C3. Lys424 makes a salt bridge with Glu528, a key interaction that stabilizes the RRM3 and RRM4 domain arrangement (Figure 4C).38 Acetylation at this residue will remove the positive charge and disrupt the salt bridge interaction. Lys454 is located on β-sheet 5 and is positioned away from the RNA-interacting surface (Figure 4C). PTBP2 is acetylated at counterpart residues Lys375, Lys399, and Lys411. Thus, PTBP1 Lys394 and Lys454 acetylation is unique in this region. PTBP1 and PTBP2 in control samples are also acetylated at a few residues; notably, Lys424 and PTBP2 counterpart Lys399 are acetylated to very high percentages (Table 1). PTBP2 is also phosphorylated at a single residue, Thr428 or Tyr401, under nuclear extract or bacterially expressed conditions, respectively (Tables 1 and 2).
In the RRM4 region, PTBP1 and PTBP2 are acetylated at a single lysine residue, Lys508 and Lys483, respectively (Table 2). The RRM4 region is phosphorylated at low percentages in the control samples at positions PTBP1 Ser526 and PTBP2 Thr456 and Thr501 (Table 1). However, this result was not observedin the nuclear extract.
■. DISCUSSION
Collectively, our study has revealed that the chemical composition of PTBP1 and PTBP2 under splicing reaction conditions is distinct; PTBP1 and PTBP2 are phosphorylated and acetylated at both overlapping and distinct sites. Analysis of the data has posed several interesting questions to be answered in future studies in the course of unraveling how the two paralogs direct different splicing outcomes.
A notable finding of our work is that PTBP2 is phosphorylated to a greater extent than PTBP1 is and that these additional sites of phosphorylation are localized to the less conserved, flexible N-terminal and linker regions. Moreover, PTBP1 counterparts of these distinct sites are nonconservative substitutions with side chains that are unable to undergo phosphorylation. These results suggest the two paralogs evolved divergent splicing activities by altering and/ or acquiring linker regions with specific amino acid compositions. This notion is supported by the hnRNPL family of RNA binding proteins in which the linker regions dictate the different splicing activities of paralogs hnRNP L and L-Like.62
Phosphorylation of the unstructured serine arginine (SR) rich region of the serine arginine rich splicing factors changes its conformation to an ordered structure that can then remodel ribonucleoprotein complexes involved in splicing by altering protein−protein or protein−RNA interactions or change the protein’s subcellular localization.63–67 We speculate that a similar scenario exists for PTBP2, where phosphorylation of the N-terminal and linker regions alters their structure and in turn regulates PTBP2 splicing activity via mechanisms similar to those of the SR proteins. It will also be interesting to identify cellular kinases and phosphatases involved in PTBP2 phosphorylation and dephosphorylation, respectively, to understand how cell signaling pathways regulate PTBP2 splicing activity during neuronal differentiation.
Our mass spectrometry data also highlighted the fact that PTBP1 and PTBP2 are acetylated in the RRMs and the PTBP2 N-terminal region under splicing conditions. For the histone proteins, acetylation of lysine residues removes the positive charge leading to weaker interactions between the histones and DNA, and an overall increase in the level of gene expression.68 A similar mechanism is possible for the PTB proteins where acetylation leads to looser binding to target pre-mRNA substrates and negates the splicing effects of the PTB proteins. The role of N-terminal acetylation in PTBP2 splicing activity and/or cellular localization is yet another interesting question that has emerged from the study.
Examining whether and how these modifications dictate the splicing activities of PTBP1 and PTBP2 will contribute to our understanding of how related RNA binding proteins with high degrees of primary and tertiary structure similarity exert different splicing outcomes.
Acknowledgments
Funding
This work was supported in part by a California State University, Fullerton (CSUF) Research Scholarly and Creative Activities Award to N.M.K. and a grant from the Maximizing Access to Research Careers (National Institutes of Health Grant 2T34GM008612–22) to California State University Fullerton, supporting J.M.R. J.M.P. was supported by the CSUF State University Grant (SUG).
Footnotes
Notes
The authors declare no competing financial interest
■ REFERENCES
- (1). Merkin J, Russell C, Chen P, and Burge CB (2012) Evolutionary Dynamics of Gene and Isoform Regulation in Mammalian Tissues. Science (Washington, DC, U. S.) 338 (6114), 1593–1599. [DOI] [PMC free article] [PubMed] [Google Scholar]
- (2). Barbosa-Morais NL, Irimia M, Pan Q, et al. (2012) The evolutionary landscape of alternative splicing in vertebrate species. Science (Washington, DC, U. S.) 338 (6114), 1587–1593. [DOI] [PubMed] [Google Scholar]
- (3). Braunschweig U, Gueroussov S, Plocik AM, Graveley BR, and Blencowe BJ (2013) Dynamic integration of splicing within gene regulatory pathways. Cell 152 (6), 1252–1269. [DOI] [PMC free article] [PubMed] [Google Scholar]
- (4). Fu X-D, and Ares M (2014) Context-dependent control of alternative splicing by RNA-binding proteins. Nat. Rev. Genet 15 (10), 689–701. [DOI] [PMC free article] [PubMed] [Google Scholar]
- (5). Lee Y, and Rio DC (2015) Mechanisms and Regulation of Alternative Pre-mRNA Splicing. Annu. Rev. Biochem 84, 291–323. [DOI] [PMC free article] [PubMed] [Google Scholar]
- (6). Staley JP, and Guthrie C (1998) Mechanical devices of the spliceosome: Motors, clocks, springs, and things. Cell 92 (3), 315– 326. [DOI] [PubMed] [Google Scholar]
- (7). Topp JD, Jackson J, Melton AA, and Lynch KW (2008) A cell-based screen for splicing regulators identifies hnRNP LL as a distinct signal-induced repressor of CD45 variable exon 4. RNA 14, 2038–2049. [DOI] [PMC free article] [PubMed] [Google Scholar]
- (8). Keppetipola N, Sharma S, Li Q, and Black DL (2012) Neuronal regulation of pre-mRNA splicing by polypyrimidine tract binding proteins, PTBP1 and PTBP2. Crit. Rev. Biochem. Mol. Biol 47 (4), 360–378. [DOI] [PMC free article] [PubMed] [Google Scholar]
- (9). Kafasla P, Mickleburgh I, Llorian M, et al. (2012) Defining the roles and interactions of PTB. Biochem. Soc. Trans 40 (4), 815–820. [DOI] [PubMed] [Google Scholar]
- (10). Yamamoto H, Tsukahara K, Kanaoka Y, Jinno S, and Okayama H (1999) Isolation of a mammalian homologue of a fission yeast differentiation regulator. Mol. Cell. Biol 19 (5), 3829–3841. [DOI] [PMC free article] [PubMed] [Google Scholar]
- (11). Spellman R, Llorian M, and Smith CWJ (2007) Crossregulation and functional redundancy between the splicing regulator PTB and its paralogs nPTB and ROD1. Mol. Cell 27 (3), 420–434. [DOI] [PMC free article] [PubMed] [Google Scholar]
- (12). Wollerton MC, Gooding C, Robinson F, Brown EC, Jackson RJ, and Smith CW (2001) Differential alternative splicing activity of isoforms of polypyrimidine tract binding protein (PTB). RNA 7 (6), 819–832. [DOI] [PMC free article] [PubMed] [Google Scholar]
- (13). Spellman R, Rideau A, Matlin A, Gooding C, Robinson F, McGlincy N, Grellscheid SN, Southby J, Wollerton M, and Smith CWJ (2005) Regulation of alternative splicing by PTB and associated factors. Biochem. Soc. Trans 33 (Part 3), 457–460. [DOI] [PubMed] [Google Scholar]
- (14). Boutz PL, Stoilov P, Li Q, et al. (2007) A post-transcriptional regulatory switch in polypyrimidine tract-binding proteins reprograms alternative splicing in developing neurons. Genes Dev. 21 (13), 1636–1652. [DOI] [PMC free article] [PubMed] [Google Scholar]
- (15). Xue Y, Zhou Y, Wu T, et al. (2009) Genome-wide analysis of PTB-RNA interactions reveals a strategy used by the general splicing repressor to modulate exon inclusion or skipping. Mol. Cell 36 (6), 996–1006. [DOI] [PMC free article] [PubMed] [Google Scholar]
- (16). Llorian M, Schwartz S, Clark TA, et al. (2010) Position-dependent alternative splicing activity revealed by global profiling of alternative splicing events regulated by PTB. Nat. Struct. Mol. Biol 17 (9), 1114–1123. [DOI] [PMC free article] [PubMed] [Google Scholar]
- (17). Licatalosi DD, Yano M, Fak JJ, et al. (2012) Ptbp2 represses adult-specific splicing to regulate the generation of neuronal precursors in the embryonic brain. Genes Dev. 26 (14), 1626–1642. [DOI] [PMC free article] [PubMed] [Google Scholar]
- (18). Li Q, Zheng S, Han A, et al. (2014) The splicing regulator PTBP2 controls a program of embryonic splicing required for neuronal maturation. eLife 3, No. e01201, DOI: 10.7554/eLife.01201. [DOI] [PMC free article] [PubMed] [Google Scholar]
- (19). Linares AJ, Lin C-H, Damianov A, Adams KL, Novitch BG, and Black DL (2015) The splicing regulator PTBP1 controls the activity of the transcription factor Pbx1 during neuronal differentiation. eLife 4, e09268 DOI: 10.7554/eLife.09268. [DOI] [PMC free article] [PubMed] [Google Scholar]
- (20). Vuong JK, Lin CH, Zhang M, Chen L, Black DL, and Zheng S (2016) PTBP1 and PTBP2 Serve Both Specific and Redundant Functions in Neuronal Pre-mRNA Splicing. Cell Rep. 17 (10), 2766–2775. [DOI] [PMC free article] [PubMed] [Google Scholar]
- (21). Chan RC, and Black DL (1997) The polypyrimidine tract binding protein binds upstream of neural cell-specific c-src exon N1 to repress the splicing of the intron downstream. Mol. Cell. Biol 17 (8), 4667–4676. [DOI] [PMC free article] [PubMed] [Google Scholar]
- (22). Tang ZZ, Sharma S, Zheng S, Chawla G, Nikolic J, and Black DL (2011) Regulation of the mutually exclusive exons 8a and 8 in the CaV1.2 calcium channel transcript by polypyrimidine tract-binding protein. J. Biol. Chem 286 (12), 10007–10016. [DOI] [PMC free article] [PubMed] [Google Scholar]
- (23). Polydorides AD, Okano HJ, Yang YY, Stefani G, and Darnell RB (2000) A brain-enriched polypyrimidine tract-binding protein antagonizes the ability of Nova to regulate neuron-specific alternative splicing. Proc. Natl. Acad. Sci. U. S. A 97 (12), 6350–6355. [DOI] [PMC free article] [PubMed] [Google Scholar]
- (24). Makeyev EV, Zhang J, Carrasco MA, and Maniatis T (2007) The MicroRNA miR-124 promotes neuronal differentiation by triggering brain-specific alternative pre-mRNA splicing. Mol. Cell 27 (3), 435–448. [DOI] [PMC free article] [PubMed] [Google Scholar]
- (25). Zheng S, Gray EE, Chawla G, Porse BT, O’Dell TJ, and Black DL (2012) PSD-95 is post-transcriptionally repressed during early neural development by PTBP1 and PTBP2. Nat. Neurosci 15 (3), 381–388. [DOI] [PMC free article] [PubMed] [Google Scholar]
- (26). Xue Y, Ouyang K, Huang J, et al. (2013) Direct conversion of fibroblasts to neurons by reprogramming PTB-regulated MicroRNA circuits. Cell 152 (1−2), 82–96. [DOI] [PMC free article] [PubMed] [Google Scholar]
- (27). Keppetipola NM, Yeom K-H, Hernandez AL, Bui T, Sharma S, and Black DL (2016) Multiple determinants of splicing repression activity in the polypyrimidine tract binding proteins, PTBP1 and PTBP2. RNA 22, 1172–1180. [DOI] [PMC free article] [PubMed] [Google Scholar]
- (28). Chou MY, Underwood JG, Nikolic J, Luu MH, and Black DL (2000) Multisite RNA binding and release of polypyrimidine tract binding protein during the regulation of c-src neural-specific splicing. Mol. Cell 5 (6), 949–957. [DOI] [PubMed] [Google Scholar]
- (29). Choudhary C, Kumar C, Gnad F, et al. (2009) Lysine acetylation targets protein complexes and co-regulates major cellular functions. Science (Washington, DC, U. S.) 325 (5942), 834–840. [DOI] [PubMed] [Google Scholar]
- (30). Chan RC, and Black DL (1995) Conserved intron elements repress splicing of a neuron-specific c-src exon in vitro. Mol. Cell. Biol 15 (11), 6377–6385. [DOI] [PMC free article] [PubMed] [Google Scholar]
- (31). Shevchenko A, Wilm M, Vorm O, and Mann M (1996) Mass spectrometric sequencing of proteins from silver-stained polyacrylamide gels. Anal. Chem 68 (5), 850–858. [DOI] [PubMed] [Google Scholar]
- (32). Larance M, and Lamond AI (2015) Multidimensional proteomics for cell biology. Nat. Rev. Mol. Cell Biol 16 (5), 269–280 [DOI] [PubMed] [Google Scholar]
- (33). Carabetta VJ, and Cristea IM (2017) Regulation, function, and detection of protein acetylation in bacteria. J. Bacteriol 199 (16), e00107–17. [DOI] [PMC free article] [PubMed] [Google Scholar]
- (34). Kim SC, Sprung R, Chen Y, et al. (2006) Substrate and Functional Diversity of Lysine Acetylation Revealed by a Proteomics Survey. Mol. Cell 23 (4), 607–618. [DOI] [PubMed] [Google Scholar]
- (35). Xie J, Lee J-A, Kress TL, Mowry KL, and Black DL (2003) Protein kinase A phosphorylation modulates transport of the polypyrimidine tract-binding protein. Proc. Natl. Acad. Sci. U. S. A 100 (15), 8776–8781. [DOI] [PMC free article] [PubMed] [Google Scholar]
- (36). Gnad F, Ren S, Cox J, Olsen JV, Macek B, Oroshi M, and Mann M (2007) PHOSIDA (phosphorylation site database): Management, structural and evolutionary investigation, and prediction of phosphosites. Genome Biol. 8 (11), R250. [DOI] [PMC free article] [PubMed] [Google Scholar]
- (37). Iakoucheva LM, Radivojac P, and Brown CJ (2004) The importance of intrinsic disorder for protein phosphorylation. Nucleic Acids Res. 32 (3), 1037–1049. [DOI] [PMC free article] [PubMed] [Google Scholar]
- (38). Oberstrass FC, Auweter SD, Erat M, et al. (2005) Structure of PTB bound to RNA: specific binding and implications for splicing regulation. Science 309 (5743), 2054–2057. [DOI] [PubMed] [Google Scholar]
- (39). Auweter SD, Oberstrass FC, and Allain FHT (2007) Solving the Structure of PTB in Complex with Pyrimidine Tracts: An NMR Study of Protein-RNA Complexes of Weak Affinities†. J. Mol. Biol 367 (1), 174–186. [DOI] [PubMed] [Google Scholar]
- (40). Gil A, Sharp PA, Jamison SF, and Garcia-Blanco MA (1991) Characterization of cDNAs encoding the polypyrimidine tract-binding protein. Genes Dev. 5 (7), 1224–1236. [DOI] [PubMed] [Google Scholar]
- (41). Ghetti A, Piñol-Roma S, Michael WM, Morandi C, and Dreyfuss G (1992) hnRNP I, the polypyrimidine tract-binding protein: distinct nuclear localization and association with hnRNAs. Nucleic Acids Res. 20 (14), 3671–3678. [DOI] [PMC free article] [PubMed] [Google Scholar]
- (42). Wagner EJ, Carstens RP, and Garcia-Blanco MA (1999) A novel isoform ratio switch of the polypyrimidine tract binding protein. Electrophoresis 20, 1082–1086. [DOI] [PubMed] [Google Scholar]
- (43). Perez I, McAfee JG, and Patton JG (1997) Multiple RRMs contribute to RNA binding specificity and affinity for polypyrimidine tract binding protein. Biochemistry 36 (39), 11881–11890. [DOI] [PubMed] [Google Scholar]
- (44). Romanelli MG, Weighardt F, Biamonti G, Riva S, and Morandi C (1997) Sequence determinants for hnRNP I protein nuclear localization. Exp. Cell Res 235 (1), 300–304. [DOI] [PubMed] [Google Scholar]
- (45). Romanelli MG, and Morandi C (2002) Importin ?? binds to an unusual bipartite nuclear localization signal in the heterogeneous ribonucleoprotein type I. Eur. J. Biochem 269 (11), 2727–2734. [DOI] [PubMed] [Google Scholar]
- (46). Li B, and Yen TS (2002) Characterization of the nuclear export signal of polypyrimidine tract-binding protein. J. Biol. Chem 277 (12), 10306–10314. [DOI] [PubMed] [Google Scholar]
- (47). Ichikawa M, Kikuchi T, Tateiwa H, et al. (2002) Role of PTB-like protein, a neuronal RNA-binding protein, during the differentiation of PC12 cells. J. Biochem 131 (6), 861–868. [DOI] [PubMed] [Google Scholar]
- (48). Thevenet L, Mejean C, Moniot B, et al. (2004) Regulation of human SRY subcellular distribution by its acetylation/deacetylation. EMBO J. 23 (16), 3336–3345. [DOI] [PMC free article] [PubMed] [Google Scholar]
- (49). Madison DL, Yaciuk P, Kwok RPS, and Lundblad JR (2002) Acetylation of the adenovirus-transforming protein E1A determines nuclear localization by disrupting association with importin-?? J. Biol. Chem 277 (41), 38755–38763. [DOI] [PubMed] [Google Scholar]
- (50). Harmon TS, Holehouse AS, Rosen MK, and Pappu RV (2017) Intrinsically disordered linkers determine the interplay between phase separation and gelation in multivalent proteins. eLife 6, e30294 DOI: 10.7554/eLife.30294. [DOI] [PMC free article] [PubMed] [Google Scholar]
- (51). Sharma S, Maris C, Allain FHT, and Black DL (2011) U1 snRNA Directly Interacts with Polypyrimidine Tract-Binding Protein during Splicing Repression. Mol. Cell 41 (5), 579–588. [DOI] [PMC free article] [PubMed] [Google Scholar]
- (52). Clerte C, and Hall KB (2009) The domains of polypyrimidine tract binding protein have distinct RNA structural preferences. Biochemistry 48 (10), 2063–2074. [DOI] [PMC free article] [PubMed] [Google Scholar]
- (53). Robinson F, and Smith CWJ (2006) A splicing repressor domain in polypyrimidine tract-binding protein. J. Biol. Chem 281 (2), 800–806. [DOI] [PubMed] [Google Scholar]
- (54). Kamath RV, Leary DJ, and Huang S (2001) Nucleocytoplasmic Shuttling of Polypyrimidine Tract-binding Protein Is Uncoupled from RNA Export. Mol. Biol. Cell 12, 3808–3820. [DOI] [PMC free article] [PubMed] [Google Scholar]
- (55). Coelho MB, Attig J, Bellora N, et al. (2015) Nuclear matrix protein Matrin3 regulates alternative splicing and forms overlapping regulatory networks with PTB. EMBO J. 34, 653. [DOI] [PMC free article] [PubMed] [Google Scholar]
- (56). Gromak N, Rideau A, Southby J, et al. (2003) The PTB interacting protein raver1 regulates alpha-tropomyosin alternative splicing. EMBO J. 22 (23), 6356–6364. [DOI] [PMC free article] [PubMed] [Google Scholar]
- (57). Joshi A, Coelho MB, Kotik-Kogan O, et al. (2011) Crystallographic analysis of polypyrimidine tract-binding protein-raver1 interactions involved in regulation of alternative splicing. Structure 19 (12), 1816–1825. [DOI] [PMC free article] [PubMed] [Google Scholar]
- (58). Henneberg B, Swiniarski S, Becke S, and Illenberger S (2010) A conserved peptide motif in Raver2 mediates its interaction with the polypyrimidine tract-binding protein. Exp. Cell Res. 316 (6), 966–979. [DOI] [PubMed] [Google Scholar]
- (59). Joshi A, Esteve V, Buckroyd A, Blatter M, Allain F, and Curry S (2014) Solution and crystal structures of a C-terminal fragment of the neuronal isoform of the polypyrimidine tract binding protein (nPTB). PeerJ 2, e305. [DOI] [PMC free article] [PubMed] [Google Scholar]
- (60). Wagner EJ, and Garcia-Blanco MA (2001) Polypyrimidine Tract Binding Protein Antagonizes Exon Definition. Mol. Cell. Biol 21 (10), 3281–3288.11313454 [Google Scholar]
- (61). Lamichhane R, Daubner GM, Thomas-Crusells J, et al. (2010) RNA looping by PTB: Evidence using FRET and NMR spectroscopy for a role in splicing repression. Proc. Natl. Acad. Sci. U. S. A 107 (9), 4105–4110. [DOI] [PMC free article] [PubMed] [Google Scholar]
- (62). Rahman MA, Masuda A, Ohe K, et al. (2013) HnRNP L and hnRNP LL antagonistically modulate PTB-mediated splicing suppression of CHRNA1 pre-mRNA. Sci. Rep 3, 3. [DOI] [PMC free article] [PubMed] [Google Scholar]
- (63). Shin C, Feng Y, and Manley JL (2004) Dephosphorylated SRp38 acts as a splicing repressor in response to heat shock. Nature 427 (6974), 553–558. [DOI] [PubMed] [Google Scholar]
- (64). Xiao SH, and Manley JL (1997) Phosphorylation of the ASF/SF2 RS domain affects both protein-protein and protein-RNA interactions and is necessary for splicing. Genes Dev. 11 (3), 334–344. [DOI] [PubMed] [Google Scholar]
- (65). Huang Y, Yario TA, and Steitz JA (2004) A molecular link between SR protein dephosphorylation and mRNA export. Proc. Natl. Acad. Sci. U. S. A 101 (26), 9666–9670. [DOI] [PMC free article] [PubMed] [Google Scholar]
- (66). Huang Y, and Steitz JA (2005) SRprises along a messenger’s journey. Mol. Cell 17 (5), 613–615. [DOI] [PubMed] [Google Scholar]
- (67). Thapar R (2015) Structural basis for regulation of rna-binding proteins by phosphorylation. ACS Chem. Biol 10 (3), 652–666. [DOI] [PMC free article] [PubMed] [Google Scholar]
- (68). Verdin E, and Ott M (2015) 50 years of protein acetylation: from gene regulation to epigenetics, metabolism and beyond. Nat. Rev. Mol. Cell Biol 16 (4), 258. [DOI] [PubMed] [Google Scholar]