

Abstract
The tumor necrosis factor (TNF) antagonist infliximab was previously found to reduce depressive symptoms in patients with treatment-resistant major depression (TRD) who exhibited high baseline inflammation, as reflected by plasma C-reactive protein (CRP) >5mg/L. Further predictors of antidepressant response to infliximab included differential expression of peripheral blood gene transcripts that were related not only to inflammation but also to glucose and lipid metabolism. To determine whether plasma biomarkers of glucose and lipid metabolism were similarly associated with antidepressant response to infliximab and with relevant gene transcripts, we measured concentrations of glucose, insulin, and protein hormones that regulate glucose homeostasis and metabolism (leptin, resistin, and adiponectin), as well as cholesterols, triglycerides, and non-esterified fatty acids (NEFA), in medically-stable TRD outpatients at baseline and 2 weeks after the first infusion of infliximab (n=26) or placebo (n=26). Treatment response was defined as 50% reduction in depressive symptoms at any point during the 12-week trial. We found that baseline cholesterol (total, low-density lipoprotein [LDL], and non-high-density lipoprotein [non-HDL]), triglycerides and NEFA were elevated in patients who exhibited an antidepressant response to infliximab (all p<0.05) but not placebo (all p>0.299). HDL and non-HDL cholesterol concentrations also correlated with two lipid-related gene transcripts that were predictive of antidepressant response (r=0.33 to 0.39, p<0.05). Although not associated with response to infliximab, resistin correlated with numerous glucose-related transcripts (r=−0.32 to 0.37, p<0.05) and was higher at 2 weeks post-infusion in patients treated with infliximab compared to placebo (p=0.028). Concentrations of cholesterol (total, LDL, HDL, non-HDL) were also lower at 2 weeks in patients treated with infliximab compared to placebo, but only in those patients with CRP >5mg/L at baseline (all p<0.05). These results are consistent with previous work showing that high inflammation in patients with depression is associated with metabolic alterations, which together predict response to both traditional and experimental antidepressant therapies. Additionally, our findings suggest a causal relationship between increased inflammation and high cholesterol in depression, as a single infusion of infliximab reduced cholesterol in TRD patients with high CRP compared to placebo.
Keywords: inflammation, depression, tumor necrosis factor, C-reactive protein, lipids, glucose, metabolism
Introduction
Depression is a heterogenous and widespread disorder with a lifetime prevalence >20% (Hasin et al., 2018) that confers increased risk for medical illnesses which are known to be associated with inflammation, obesity and/or metabolic dysregulation including cardiovascular disease, diabetes, and cancer (Currier and Nemeroff, 2014; Musselman et al., 2003; Musselman et al., 1998). In this regard, 30–50% of patients with depression are reported to have high levels of inflammatory markers, including the acute phase reactant C-reactive protein (CRP), as well as high body mass index (BMI), and/or markers of metabolic dysregulation, all of which may predispose patients to the development of co-morbid medical illnesses (Felger et al., 2016; Rapaport et al., 2016; Rethorst et al., 2014; Shelton et al., 2015). Standard antidepressant therapies fail in over 30% of depressed patients, and those with high inflammation and/or high BMI are particularly resistant (Cattaneo et al., 2013; Haroon et al., 2018; Rush, 2007; Uher et al., 2009). Accordingly, there has been recent interest in better understanding the role of inflammation and metabolic changes in depression and the potential for novel therapeutic strategies that may be targeted to patients with high CRP and/or BMI (Dutheil et al., 2016; Miller et al., 2017; Shelton and Miller, 2010).
Inflammatory cytokines that are produced in the periphery are known to access the central nervous system and to affect neurotransmitters and neural circuits that contribute to the behavioral symptoms of depression (Capuron et al., 2017; Felger, 2018; Felger and Treadway, 2017; Haroon et al., 2017). Activated macrophages that reside in adipose tissue are thought to be a major source of these cytokines in patients with depression and high BMI (Capuron et al., 2017; Park et al., 2005; Weisberg et al., 2003). Conversely, cytokine signaling in adipose tissue - and particularly tumor necrosis factor (TNF) activity - in turn promotes metabolic dysregulation (Borst, 2004; Hotamisligil et al., 1994; Nieto-Vazquez et al., 2008; Popa et al., 2007), and may exert feed-forward consequences on adiposity, depression and risk for inflammatory and metabolic diseases. Despite growing evidence of bidirectional relationships between inflammation and metabolic changes (Capuron et al., 2017; Kiecolt-Glaser et al., 2017), little research has been done to examine the contribution of inflammation as a potential driver of metabolic dysregulation in patients with MDD.
TNF is often regarded as a central regulator of inflammation, and is a target of several FDA-approved anti-inflammatory drugs including infliximab (Lis et al., 2014). We previously published that inhibition of TNF signaling with infliximab reduced depressive symptoms in patients with treatment resistant depression (TRD), but only in patients who had high baseline plasma CRP (>5 mg/L). TNF antagonism with infliximab also lowered concentrations of CRP and other inflammatory cytokines, which may be essential to its observed antidepressant effect in patients with high baseline CRP (Raison et al., 2013). Analysis of gene expression signatures in infliximab-responders showed that baseline transcripts predictive of antidepressant response to infliximab were not only related to inflammation and TNF-signaling but also to glucose and lipid metabolism, indicating that metabolic dysregulation may have been present in patients with high inflammation who were most responsive to infliximab (Mehta et al., 2013). Furthermore, a single dose of infliximab modified expression levels of both inflammatory and metabolic-related gene transcripts 2 weeks post-infusion in responders, suggesting that reducing inflammation may have also improved metabolic function in these patients (Mehta et al., 2013). With regard to the metabolic effects of TNF blockade in previous studies, infliximab has been shown to improve indices of glucose and lipid metabolism in patients with rheumatoid arthritis (Gonzalez-Gay et al., 2006; Kiortsis et al., 2005; Tam et al., 2007), while no changes were reported in patients receiving infliximab treatment for inflammatory bowel disease (Gentile et al., 2002; Steiner et al., 2008). However, the relationship between circulating markers of glucose and lipid metabolism and antidepressant response to infliximab in patients with TRD is not fully understood, and the extent to which baseline inflammation (CRP) moderates this relationship remains to be determined.
This exploratory study measured plasma biomarkers related to glucose and lipid metabolism to determine whether they were 1) associated with antidepressant response to infliximab, 2) related to gene transcripts previously identified to be predictive of infliximab response and/or 3) affected by infliximab compared to placebo 2 weeks after a single infusion in the group as whole or in patients with high baseline inflammation (CRP >5 mg/L). A panel comprised of glucose, insulin, and the adipokines leptin, resistin, and adiponectin, which are associated with glucose and insulin metabolism as well as depression (Bryson et al., 1999; Lehto et al., 2010; Li et al., 2016; Singh and Saxena, 2010), was selected and assessed as markers of glucose synthesis and metabolism. The panel related to lipid metabolism included total cholesterol, low and high-density lipoprotein (LDL, HDL) cholesterol, non-HDL cholesterol, triglycerides, and non-esterified fatty acids (NEFA).
Materials and Methods
Participants:
Peripheral blood plasma and RNA samples were collected during a randomized, double-blind trial of infliximab versus placebo in TRD patients, defined as patients with MDD or bipolar disorder who were depressed and non-responsive to antidepressant treatment as determined by a score ≥2 on the Massachusetts General Hospital Staging (MGH-S) method in the current episode (Raison et al., 2013). Participants were recruited via local television, radio, and newspaper advertisements and included males and females aged 25–60 years who were on a consistent antidepressant regimen or off antidepressant therapy for at least 4 weeks prior to baseline. To balance the number of male and female participants and to equalize levels of inflammation across groups, treatment assignment was stratified by sex and CRP (≥2mg/L versus <2mg/L). Groups were stratified by a CRP concentration of 2 mg/L, because it represents the median value in the “average” relative risk category of inflammation (1–3 mg/L) as delineated by the American Heart Association and the Centers for Disease Control and Prevention (Pearson, 2003). To be enrolled, subjects had to exhibit moderate severity of depression as determined at screening by a score ≥14 on the 16 item Quick Inventory of Depressive Symptomatology Self Report. Antidepressant regimens were required to remain stable throughout the study and could include conventional antidepressant medications, mood stabilizers, antipsychotic medication, stimulants, and benzodiazepines. Exclusion criteria included any autoimmune disorder (confirmed by laboratory testing); history of tuberculosis (confirmed by chest X-ray, skin, and/or blood testing) or high risk of tuberculosis exposure; hepatitis B or C or human immunodeficiency virus infection (confirmed by laboratory testing); evidence of active fungal infection; history of recurrent viral or bacterial infections; history of cancer excluding basal cell or squamous cell carcinoma of the skin (fully excised with no recurrence); unstable cardiovascular, endocrinologic, hematologic, hepatic, renal, or neurologic disease (determined by medical history, physical examination and laboratory testing); history of schizophrenia (determined by Structured Clinical Interview [SCID] for DSM-IV); active psychotic symptoms of any type; substance abuse/dependence within the past 6 months (determined by SCID); active suicidal ideation determined by a score ≥3 on item #3 on the17-item Hamilton Depression Rating Scale (HAM-D-17) and/or a score <28 on the Mini-Mental State Exam. All subjects provided written informed consent to the study, and all study procedures were approved by the Emory University Institutional Review Board. The study is registered in ClinicalTrials.gov, Identifier: NCT00463580. Demographic and clinical variables between the infliximab and placebo groups were well-matched with no significant differences (Mehta et al., 2013; Raison et al., 2013).
Clinical Assessments:
The diagnosis of depression was made using the Diagnostic and Statistical Manual of Mental Disorders, Fourth Edition (DSM-IV), as assessed by the SCID. Depression severity was measured by the HAM-D-17 at baseline and at Weeks 1, 2, 3, 4, 6, 8, 10, and 12. Treatment response was defined as a 50% reduction in the HAM-D-17 at any point during the 12-week study.
Infliximab and Placebo Infusion Procedures:
All subjects were administered either infliximab (5mg/kg, n=26) or placebo (n=26) through an indwelling catheter at the Emory Division of Digestive Diseases at 3 separate time points (baseline, 2 weeks, and 6 weeks). Infliximab infusion dosing protocol and scheduling were matched to the standard intravenous induction routine for the treatment of inflammatory bowel disease. Infliximab or placebo was dispensed by independent pharmacists in a 250ml saline bag according to a computer-generated randomization list, blocked in units of 4, and provided by a study statistician. The saline-dissolved placebo was matched to infliximab in color and consistency. Infliximab and placebo were provided free-of-charge by Centocor Ortho Biotech Services (Horsham, PA). For subjects exhibiting evidence of infection, infusions were delayed until symptoms resolved and/or appropriate treatment was initiated. Patients were not allowed to take non-steroidal or steroidal anti-inflammatory medications during the study except for aspirin 81mg per day if medically indicated. Medications for hypertension, diabetes, hypothyroidism, allergies, infections, and other medical conditions were allowed as dictated by the patients’ treating physicians. All study staff remained blinded to group assignment throughout the trial.
Blood collection:
Whole blood was collected through indwelling catheters after participants had at least 30 minutes of rest. For plasma isolation, blood was collected into EDTA-containing vacutainer tubes approximately three hours from the patient’s last food intake at baseline (3pm ± 1hour), and immediately prior to the second infusion at Week 2 (~10am-2pm). Plasma was obtained by centrifugation at 1000 x g for 10 minutes at 4°C, aliquoted into siliconized polypropylene tubes, and stored at −80°C until assay. Whole blood for gene expression analysis was collected in Tempus Blood RNA Tubes (Applied Biosystems, Carlsbad, CA) at baseline (9 am) and immediately prior to the second infusion on Week 2 and stored at - 80°C until RNA extraction.
Measurement of metabolic panels and CRP:
Plasma markers of glucose and lipid metabolism were measured in the Biomarker Core Lab of the Atlanta Research and Education Foundation. Plasma leptin, resistin, and adiponectin were measured by ELISA (Boster Biological, Pleasanton, CA). Assay detection limits were 10 pg/ml, 3 pg/ml and 0.06 ng/ml, respectively. Plasma glucose (colorimetric), insulin (immunoturbidometric), lipids (enzymatic) and high sensitivity (hs)-CRP (immunoturbidimetric) were assayed using reagents from Sekisui Diagnostics (Exton, PA) implemented on the AU480 chemistry analyzer (Beckman Coulter). Mean inter- and intra-assay coefficients of variation were reliably <10% (Felger et al., 2016; Le et al., 2000; Mehta et al., 2013; Raison et al., 2013).
Measurement of gene expression:
Peripheral whole blood gene expression at baseline was analyzed as described previously (Mehta et al., 2013), and 148 transcripts were identified to be significantly associated with antidepressant response to infliximab. Functional annotation of these transcripts within pathways as assessed by MetaCore (GeneGo Inc., St. Joseph, MI) or the Wikipathways tool via the Webgestalt interface (Pico et al., 2008) found 5 genes associated with glycolysis and gluconeogenesis and 3 genes associated with lipid metabolism (cholesterol and sphingolipid transport) to be the most predictive gene transcripts (Mehta et al., 2013). In the current study, we assessed whether plasma markers related to glucose and lipid metabolism correlated with these 8 genes that were previously associated with antidepressant response to infliximab.
Statistics:
Descriptive statistics (means, standard deviation, and standard error) were used to characterize demographic characteristics and continuous variables over time. Plasma markers were examined for normality and the presence of outliers. Non-normal markers were natural log (ln) transformed for parametric statistics, consistent with previous analyses (Haroon et al., 2014; Haroon et al., 2016; Raison et al., 2009; Torres et al., 2013). Multivariate linear regression models were used to identify baseline plasma markers related to glucose or lipid metabolism (separately) that differed between patients who did or did not exhibit an antidepressant response to either infliximab or placebo. Principal components analysis (PCA) was used as a data reduction strategy to identify clusters of like markers at baseline that were associated with response to infliximab (as a categorical variable). Varimax rotation with Kaiser Normalization was used to simplify the factor structure and obtain more meaningful and interpretable data. Factors were determined by Eigen values > 1, and only individual variable contributions of >0.3 qualified for loading a component (Felger et al., 2018; Grimsholm et al., 2005). The resulting Bartlett factor scores were subsequently entered into logistic regression and general linear models (Felger et al., 2018) with and without clinical covariates (age, sex, race, BMI, use of psychiatric and psychotropic medications and use of cholesterol-/diabetes-controlling medications) to determine whether clusters of markers significantly predicted response to infliximab, and whether they were significantly different in infliximab responders compared to non-responders. Relationships between baseline plasma markers of glucose and lipid metabolism and gene transcripts that were previously found to be predictive of response to infliximab and associated with glucose (n=3) and cholesterol (n=5) metabolism (Mehta et al., 2013) were assessed by correlation. The Benjamini–Hochberg step-up procedure was used to control for multiple comparisons, and relationships that remained significant were assessed in linear regression models with relevant covariates. Multivariate repeated measures general linear models (GLM), with and without clinical covariates (see above), were used to assess the effects of a single infusion of infliximab at 2 weeks compared to placebo, and whether potential treatment effects over time were different in patients with plasma CRP >5 mg/L. To determine which markers differed at 2 weeks between infliximab- and placebo-treated patients with and without CRP >5 mg/L while controlling for baseline concentrations of each marker, multivariate general estimating equation (GEE) models were employed. Individual markers were converted to Z scores for graphing to be able to visualize all markers on the same graphs. Tests of significance were two-tailed, α <0.05, and all statistical analyses were conducted in IBM SPSS Statistics 24.
Results
Demographics and Clinical Variables
Source data were drawn from a 12-week clinical trial including 60 individuals administered infliximab (n=30) or placebo (n=30). Biomarkers of glucose and cholesterol metabolism were available from 52 individuals, 26 patients treated with infliximab (n=13 responders and n=13 non-responders) and 26 treated with placebo (n=12 responders and n=14 non-responders). One patient did not have gene expression data available, and thus 51 patients were included in analyses involving genes. Demographic and clinical variables in the infliximab- and placebo-treated groups were well-matched with no significant differences in the sample as a whole (n=60) (Raison et al., 2013) and in the 52 patients included in this study (data not shown). Distributions and comparisons of the demographic and clinical variables between treatment responders and non-responders for both the infliximab- and placebo-treated groups are shown in Table 1. No differences in gender, age, ethnicity, BMI, CRP, baseline HAM-D-17 depression scores, or the number of individuals on current antidepressants, mood stabilizers, antipsychotic medicines, and psychotropic medicines were observed between the responders and non-responders in either treatment group (all p>0.05). Baseline concentrations of plasma glucose- and lipid-related biomarkers by CRP level are shown in Supplemental Table 1.
Table 1.
Demographic and clinical characteristics of responders versus non-responders to placebo or infliximab infusion.
| Placebo Non- responders |
Placebo Responders |
P-value | Infliximab Non- responders |
Infliximab Responders |
P-value | |
|---|---|---|---|---|---|---|
| (N = 14) | (N = 12) | (N = 13) | (N = 13) | |||
| Gender | ||||||
| Female | 10 [71.4%] | 8 [66.7%] | 0.79 | 8 [61.5%] | 8 [61.5%] | 1.00 |
| Male | 4 [28.6%] | 4 [33.3%] | 5 [38.5%] | 5 [38.5%] | ||
| Race | ||||||
| Caucasian | 10 [71.4%] | 10 [83.3%] | 0.59 | 10 [76.9%] | 11 [84.6%] | 0.36 |
| African American | 3 [21.4%] | 2 [16.7%] | 3 [23.1%] | 1 [7.7%] | ||
| Other | 1 [7.1%] | 1 [7.7%] | ||||
| Age | 41.9 [10.3] | 46.1 [9.3] | 0.29 | 39.4 [7.6] | 45.1 [8.2] | 0.08 |
| BMI | 31.3 [7.4] | 35.0 [8.0] | 0.24 | 30.1 [8.9] | 30.7 [4.4] | 0.83 |
| Baseline CRP (mg/L) | 7.8 [11.4] | 3.3 [2.8] | 0.17 | 6.3 [7.8] | 7.2 [11.3] | 0.82 |
| Baseline HAM-D-17 | 24.8 [3.6] | 23.9 [4.0] | 0.57 | 24.2 [3.8] | 24.6 [4.2] | 0.81 |
| Week 12 HAM-D-17 | 19.8 [6.1] | 7.7 [2.8] | 0.000 | 21.9 [7.6] | 12.8 [5.9] | 0.01 |
| Current antidepressant | ||||||
| Yes | 8 [57.1%] |
9 [75.0%] | 0.34 | 5 [38.5%] | 7 [53.8%] | 0.43 |
| No | 6 [42.9%] | 3 [25.0%] | 8 [61.5%] | 6 [46.2%] | ||
| Current antipsychotic | ||||||
| Yes | 2 [14.3%] | 1 [8.3%] | 0.64 | 2 [15.4%] | 2 [15.4%] | 1.00 |
| No | 12 [85.7%] | 11 [91.7%] | 11 [84.6%] | 11 [84.6%] | ||
| Current mood stabilizer | ||||||
| Yes | 1 [7.1%] | 1 [8.3%] | 0.91 | 2 [15.4%] | 0 [0.0%] | 0.14 |
| No | 13 [92.9%] | 11 [91.7%] | 11 [84.6%] | 13 [100.0%] | ||
| Current psychotropic | ||||||
| Yes | 8 [57.1%] | 10 [83.3%] | 0.15 | 6 [46.2%] | 8 [61.5%] | 0.43 |
| No | 6 [42.9%] | 2 [16.7%] | 7 [53.8%] | 5 [38.5%] | ||
| Current diabetes medication |
||||||
| Yes | 4 [28.6%] |
3 [25%] | 0.84 | 0 [0%] | 1 [7.7%] | 0.31 |
| No | 10 [71.4%] | 9 [75%] | 13 [100%] | 12 [92.3%] | ||
| Current cholesterol medication |
||||||
| Yes | 2 [14.3%] | 3 [25%] | 0.49 | 1 [7.7%] | 3 [23.1%] | 0.28 |
| No | 12 [85.7%] | 9 [75%] | 12 [92.3%] | 10 [76.9%] | ||
Results expressed as number [percent] or mean [SD]. BMI: body mass index; CRP: C-reactive protein; HAM-D-17: 17-item Hamilton Depression Rating Scale
Relationships between Baseline Biomarkers of Glucose and Lipid Metabolism and Infliximab Response
In multivariate analysis, baseline concentrations of plasma glucose, insulin, and peptide hormones related to glucose metabolism and homeostasis (leptin, resistin and adiponectin) were not significantly higher in patients who exhibited an antidepressant response to either infliximab (all p>0.197) or placebo (all p>0.246) (see Figure 1a,b for mean Z scores of plasma markers). However, a significant antidepressant response by CRP >5 mg/L interaction was observed for glucose in the infliximab-treated patients (F[1,23]=4.41, p=0.049), which did not remain significant when adjusting for clinical covariates (age, sex, race, BMI, use of psychiatric and psychotropic medications, and use of cholesterol controlling medications; p=0.088). PCA revealed two components (Component 1 comprised of glucose, insulin, leptin, and resistin with a negative loading for adiponectin, and Component 2 comprised of glucose and adiponectin) that significantly predicted antidepressant response to infliximab (Supplemental Table 2). Bartlett factor scores from these two components did not significantly predict antidepressant response in logistic regression (both p>0.538) and were not significantly greater in responders compared to non-responders in infliximab-treated patients (both p>0.413).
Figure 1. Baseline biomarkers of glucose and lipid metabolism and antidepressant response prediction in infliximab vs placebo groups.
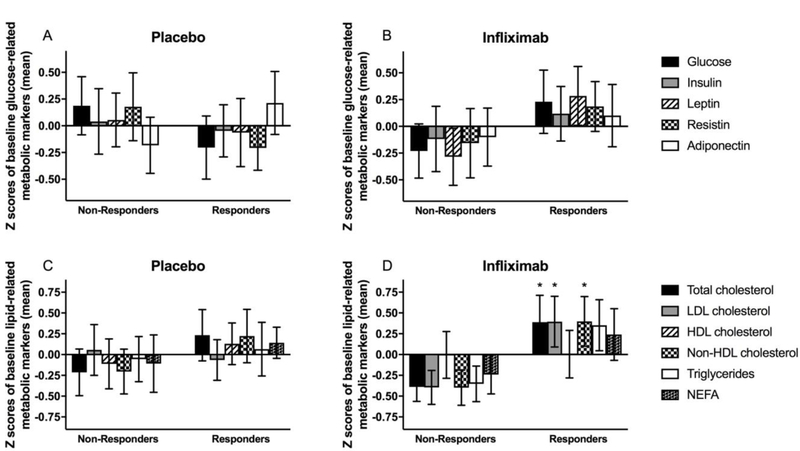
Z scores for concentrations of glucose, insulin, and peptide hormones related to glucose metabolism and homeostasis (leptin, resistin, and adiponectin) in placebo (A) and infliximab (B) responders versus non-responders. Z scores for concentrations of total, LDL, HDL and non-HDL cholesterol, triglycerides, and NEFA in placebo (C) and infliximab (D) responders versus non-responders. Data are presented as mean ± standard error. Z scores were employed to be able to visualize all markers on the same graph. p<0.05 responders compared to non-responders. HDL - high-density lipoprotein; LDL - low-density lipoprotein; NEFA - non-esterified fatty acids
Multivariate analysis of baseline plasma lipid concentrations (total, LDL, HDL, and non-HDL cholesterol, triglycerides, and NEFA) revealed that concentrations of total (F[1,25]=4.48, p=0.045), LDL (F[1,25]=4.65, p=0.041), and non-HDL (F[1,25]=4.73, p=0.040) cholesterol were significantly elevated in responders to infliximab but not placebo (all p>0.299) (Figure 1c,d). These findings remained significant when controlling for clinical covariates (age, sex, race, BMI, use of psychiatric and psychotropic medications, and use of cholesterol controlling medications; all p<0.05), and the adjusted model revealed that triglycerides (F[1,25]=4.72, p=0.043) and NEFA (F[1,25]=4.57, p=0.046) were also higher at baseline in infliximab responders (Figure 1c,d). PCA revealed two components of lipid-related markers at baseline (Component 1 comprised of positive loadings for baseline total, LDL and non-HDL cholesterol and triglycerides, and Component 2 comprised of positive loadings for total and HDL cholesterol and NEFA) that predicted antidepressant response to infliximab (Supplemental Table 2). Component 1 (but not Component 2, p=0.462) predicted antidepressant response in infliximab-treated patients as determined by logistic regression (OR=3.13, 95% CI: 1.01–9.74, p=0.049]), which remained significant when controlling for clinical covariates (p=0.042). Moreover, factor scores for Component 1 were significantly higher in infliximab responders compared to non-responders in models with (F[1,25]=7.52, p=0.013) and without clinical covariates (F[1,25]=4.73, p=0.040).
Correlations between Circulating Biomarkers and Gene Transcripts Related to Glucose and Lipid Metabolism
Baseline plasma biomarkers were correlated with peripheral blood gene transcripts from pathways related to glucose or lipid metabolism that were previously found to be predictive of the antidepressant response to infliximab. In a comparison of the 5 gene transcripts from a pathway related to glucose metabolism, ALDOA was positively correlated with leptin and resistin; ENO2 was negatively correlated with resistin; ENO3 was negatively correlated with resistin and adiponectin; PGAM4 was positively correlated with resistin; and TPI1 was not significantly correlated with any marker related to glucose metabolism or homeostasis (Table 2). Relationships between resistin and gene transcripts for ALDOA, ENO3, and PGAM4 remained significant after correction for multiple comparisons and remained significant after controlling for clinical covariates (age, sex, race, BMI, use of psychiatric and psychotropic medications and use of diabetes medication; all p<0.05). Comparison of 3 gene transcripts from a pathway related to lipid metabolism with circulating lipid markers found that STARD3NL was positively correlated with HDL cholesterol; TSPO2 was positively correlated with non-HDL cholesterol; and LIPA was not significantly correlated with any marker related to lipid metabolism or homeostasis (Table 2). The relationship between TSPO2 and non-HDL cholesterol remained significant after controlling for clinical covariates (p=0.024) but not after correction for multiple comparisons, and the relationship between STARD3NL and HDL cholesterol remained significant after correction for multiple comparisons and after controlling for clinical covariates (p=0.045).
Table 2.
Correlations (r, p) between peripheral blood gene expression and plasma biomarkers related to glucose and lipid metabolism.
| Glucose-related | ||||||
|---|---|---|---|---|---|---|
| Gene symbol/ Marker |
||||||
| Glucose | Insulin | Leptin | Resistin | Adiponectin | ||
| ALDOA | −0.144 (0.317) |
0.122 (0.392) |
0.317 (0.023) |
0.351 (0.013) |
0.048 (0.739) |
|
| ENO2 | −0.172 (0.233) |
−0.074 (0.604) |
−0.049 (0.730) |
−0.286 (0.047) |
−0.007 (0.958) |
|
| ENO3 | −0.076 (0.600) |
−0.125 (0.381) |
−0.148 (0.300) |
−0.318 (0.026) |
−0.298 (0.034) |
|
| PGAM4 | 0.154 (0.286) |
0.149 (0.296) |
0.243 (0.085) |
0.372 (0.008) |
0.019 (0.896) |
|
| TPI1 | −0.021 (0.884) |
0.13 (0.362) |
0.105 (0.464) |
0.280 (0.051) |
0.115 (0.422) |
|
| Lipid-related | ||||||
|
Gene symbol / Marker |
Total Cholesterol |
LDL |
HDL |
Non-HDL |
Triglycerides |
NEFA |
| LIPA | −0.189 (0.199) |
−0.112 (0.435) |
−0.226 (0.110) |
−0.141 (0.339) |
−0.083 (0.571) |
0.043 (0.770) |
| STARD3NL | 0.016 (0.916) |
0.05 (0.729) |
0.386 (0.005) |
−0.102 (0.491) |
−0.09 (0.539) |
0.282 (0.052) |
| TSPO2 | 0.264 (0.070) |
0.167 (0.241) |
−0.174 (0.223) |
0.330 (0.022) |
0.092 (0.531) |
0.029 (0.847) |
Data are presented as correlation coefficient (r) and p value. Relationships in bold were p<0.05 after adjustment for multiple comparisons. ALDOA - aldolase A; ENO2 - enolase 2; LDL - low-density lipoprotein cholesterol; HDL - high-density lipoprotein cholesterol; Non-HDL - non-high-density lipoprotein cholesterol; NEFA - non-esterified fatty acids
Effects of a Single Infusion of Infliximab versus Placebo on Plasma Biomarkers of Glucose and Lipid Metabolism in Relation to High CRP
To determine whether plasma concentrations of glucose, insulin, or peptide hormones related to glucose metabolism and homeostasis (leptin, resistin, and adiponectin) were differentially affected by a single dose of infliximab compared to placebo at 2 weeks post-infusion, and whether effects of infliximab were dependent on high baseline inflammation as defined by CRP >5 mg/L, multivariate repeated measures GLM was employed. No significant effects for time, treatment, or a time by treatment interaction were observed (all p>0.149). These findings were not affected by the addition of CRP >5 mg/L or clinical covariates to the model. However, multivariate GEE comparing concentrations of glucose and related markers in infliximab- compared to placebo-treated groups at 2 weeks, while controlling for baseline concentrations of each marker, revealed that resistin was significantly greater at 2 weeks in patients administered infliximab compared to placebo (F[1,48]=5.20, p=0.028), a finding that did not depend on an interaction with CRP level (Figure 2a,b) and that remained significant after controlling for clinical covariates (age, sex, race, BMI, use of psychiatric and psychotropic medications, and use of diabetes medications; p=0.035).
Figure 2. Effects of a single infusion of infliximab on plasma biomarkers of glucose and lipid metabolism over time and in relation to CRP.
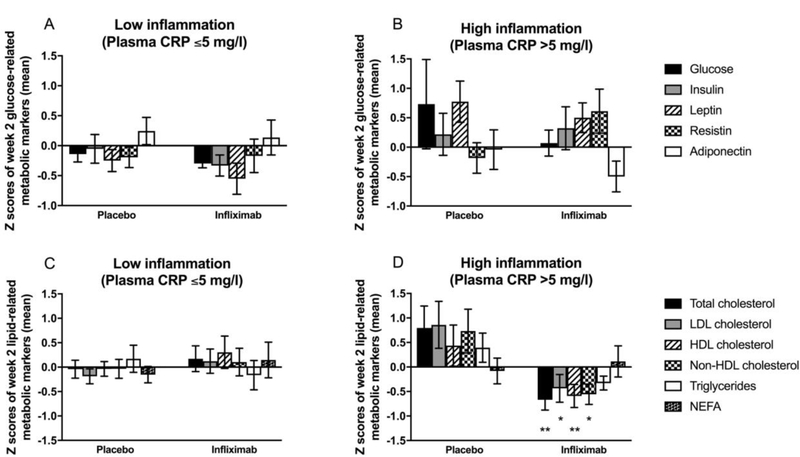
Z scores for concentrations of glucose, insulin, and peptide hormones related to glucose metabolism and homeostasis (leptin, resistin, and adiponectin) two weeks after infusion of infliximab compared to placebo in patents with low (CRP ≤5 mg/L) (A) or high (CRP >5 mg/L) (B) inflammation. Z scores for concentrations of total, LDL, HDL and non-HDL cholesterol, triglycerides, and NEFA after infusion of infliximab compared to placebo in patents with low (CRP ≤5 mg/L) (C) or high (CRP >5 mg/L) (D) inflammation. Data are presented as mean ± standard error. *p<0.05, **p<0.01 infliximab compared to placebo. CRP - C-reactive protein; HDL - high-density lipoprotein; LDL - low-density lipoprotein; NEFA - non-esterified fatty acids
To examine the effects at week 2 after a single injection of infliximab compared to placebo and potential interactions with CRP >5 mg/L on plasma concentrations of lipid markers, multivariate repeated measures GLM was employed. Significant effects of time (F[1,43]=20.36, p<0.001) and treatment (F[1,43]=4.71, p=0.036) but not time by treatment interaction were observed (F[1,43]=0.73, p=0.397). Interestingly, however, a significant time by treatment by CRP >5 mg/L interaction was uncovered (F[1,43]=4.29, p=0.044). Multivariate GEE controlling for baseline concentrations of each marker demonstrated that total (F[1,46]=7.37, p=0.010), LDL (F[1,46]=5.61, p=0.023), HDL (F[1,46]=10.66, p=0.002), and non-HDL (F[1,46]=5.14, p=0.029) cholesterol, but not triglycerides and NEFA (both p>0.320), were significantly lower at 2 weeks in patients administered a single dose of infliximab compared to placebo, but only in patients with CRP >5 mg/L (Figure 2c,d). These findings remained significant when controlling for clinical covariates (age, sex, race, BMI, use of psychiatric and psychotropic medications, use of cholesterol controlling medications; p<0.05).
Discussion
This exploratory study demonstrated that TRD patients who responded to infliximab compared to placebo had significantly higher plasma concentrations of lipid markers (including total, LDL and non-HDL cholesterol, triglycerides and NEFA) at baseline. Additionally, cholesterol (total, LDL, HDL and non-HDL cholesterol), but not triglycerides or NEFA, was significantly lower at 2 weeks post-infliximab compared to placebo, but only in patients who had high plasma CRP (>5 mg/L). Taken together, these findings suggest that TRD patients with high inflammation and elevated levels of lipids and cholesterols are more responsive to the antidepressant effects of infliximab. Moreover, a single infusion of infliximab was previously shown to decrease inflammatory markers like CRP and modify expression of gene transcripts related to TNF signaling (Mehta et al., 2013; Raison et al., 2013), and the current study provides novel evidence that blocking inflammation in TRD patients with high CRP may also decrease circulating cholesterols.
Of the five markers examined related to glucose and insulin regulation, only glucose showed an interaction between response to infliximab and level of CRP, but this finding did not persist when controlling for relevant clinical covariates. PCA revealed a component that was significantly associated with response to infliximab which contained all five markers including a negative loading for adiponectin. Plasma adiponectin has previously been found to negatively correlate with BMI and insulin resistance (Singh and Saxena, 2010; Tschritter et al., 2003), providing biological support for this finding. In addition, a trend was observed for higher concentrations of the other glucose and insulin-related markers at baseline in infliximab responders (Figure 2b) that may have been too variable in this small sample to be detected using general linear models.
Baseline plasma concentrations of resistin were positively correlated with several peripheral blood gene transcripts previously associated with the antidepressant response to infliximab. Furthermore, only resistin was affected 2 weeks after infusion, and was greater in infliximab compared to placebo-treated patients regardless of baseline plasma CRP concentrations. This increase in resistin in infliximab-treated patients is interesting considering that the role of resistin in metabolic disease is controversial and potentially two-sided (Kusminski et al., 2005). Accordingly, findings regarding the effects of infliximab on resistin levels in patients with inflammatory illnesses have been mixed (Frivolt et al., 2017; Miranda-Filloy et al., 2013), yet most studies have reported that infliximab improves other measures of insulin resistance (Bissell et al., 2016; Esser et al., 2015; Gonzalez-Gay et al., 2006; Tam et al., 2007). Considering that we did not find that infliximab affected other biomarkers relevant to glucose and lipid metabolism, such effects may be limited to patients with inflammatory disorders who have much higher levels of peripheral inflammation and potentially more severe impairments in insulin function.
The findings regarding lipids and cholesterols were highly supportive of the idea that, like high inflammation, dysregulation of cholesterol metabolism and high lipid concentrations are predictive of antidepressant response to infliximab. Although HDL cholesterol was the only lipid marker that was not associated with antidepressant response to infliximab, it did correlate with one of the lipid-related genes that predicted infliximab response, STARD3NL. All of the cholesterols, including HDL, were found to be decreased 2 weeks after infliximab compared to placebo, but only in patients with high inflammation. These findings persisted when clinical covariates including BMI were considered, suggesting that the relationship among lipids, inflammation and antidepressant response to infliximab were not dependent on obesity. Findings that plasma lipids were both higher at baseline in infliximab responders and lower after the initial infusion of infliximab in patients with high CRP further reinforces a potential causal role for inflammation in the metabolic dysregulation observed in patients with depression and high inflammation.
Important limitations of the current study include a small sample size (n=52) and the use of historic plasma samples that were collected at an inconsistent time of day between the baseline and week 2 visit. Specifically, baseline blood was collected in the afternoon ~3hr from the patient’s last food intake and drawn in an inpatient setting. In contrast, week 2 blood was drawn between ~10am and 2pm in an outpatient setting prior to the second infusion, and although time from last food intake was at least ~2–3hr, it was not standardized across patients. Given the rapid fluctuation in markers related to glucose and insulin metabolism, it is possible that the effects of the time of day and the duration of fasting may have been more potent on glucose measures and masked group differences, while also prohibiting calculation of insulin and glucose ratios that require fasting levels. To overcome these limitations, we used statistical approaches to compare biomarker concentrations at week 2 while controlling for baseline levels of each circulating marker (which were more standardized). If lack of predictive findings for plasma markers of glucose metabolism were not due to method constraints, our previous findings that peripheral blood gene transcripts related to glucose metabolism were predictive of infliximab response may reflect changes in energy demands in peripheral blood immune cells due to inflammation rather than the overall metabolic state of the patients. Another limitation was that sleep quality was not controlled for in the current study. Despite these limitations, our findings provide strong evidence that lipid markers are related to treatment response to infliximab and are decreased after a single infusion of infliximab in patients with CRP >5 mg/L.
Conclusions
This study indicates a causal role for inflammation in driving aspects of metabolic dysfunction in patients with depression, which can be reversed by blockade of inflammatory cytokines like TNF in association with the resolution of depressive symptoms. These findings also support the recent report from Delgado et al. (2018) concluding that inflammation contributed to depressive symptoms to a greater extent than markers of metabolic health in a sample of depressed individuals with obesity. These results further suggest that TNF antagonism may be an effective approach to improve both depressive symptoms and metabolic outcomes in patients with TRD and high inflammation. Moreover, this work provides a preliminary framework for future studies examining interactions between inflammation and metabolic dysregulation in patients with psychiatric disorders and the potential for anti-inflammatory therapies to improve both behavioral and medical health outcomes. While these results are potentially intriguing and novel, additional work is needed to solidify relationships between inflammation and lipid metabolism in depression.
Supplementary Material
Highlights.
High plasma CRP previously predicted antidepressant response to infliximab
Gene transcripts related to glucose and lipid metabolism also predicted this response
We assessed plasma markers of glucose and lipid metabolism pre and post infliximab
Cholesterols, triglycerides and NEFA were elevated in responders to infliximab
Infliximab lowered total, LDL, HDL and non-HDL cholesterol in high CRP patients
Acknowledgements
Funding sources: This work was supported by grants R21MH0771172, R01MH087604, and R25MH101079 (Dr. Miller), R01MH109637 (Dr. Felger) and R01MH H107033 (Dr. Haroon) from the National Institute of Mental Health; by Centocor Ortho Biotec Services LLC, and by grants BBRF22296 from the Brain and Behavioral Research Foundation and CADF49143 from the Dana Foundation (Dr. Felger). In addition, the study was supported in part by PHS Grants UL1TR000454 from the Clinical and Translational Science Award program, and by the NIH/NCI under award number P30CA138292.
Footnotes
Publisher's Disclaimer: This is a PDF file of an unedited manuscript that has been accepted for publication. As a service to our customers we are providing this early version of the manuscript. The manuscript will undergo copyediting, typesetting, and review of the resulting proof before it is published in its final citable form. Please note that during the production process errors may be discovered which could affect the content, and all legal disclaimers that apply to the journal pertain.
Financial Disclosure: All authors declare no conflicts of interest and have nothing to disclose.
References
- Bissell LA, Hensor EM, Kozera L, Mackie SL, Burska AN, Nam JL, Keen H, Villeneuve E, Donica H, Buch MH, Conaghan PG, Andrews J, Emery P, Morgan AW, 2016. Improvement in insulin resistance is greater when infliximab is added to methotrexate during intensive treatment of early rheumatoid arthritis-results from the IDEA study. Rheumatology (Oxford, England) 55, 2181–2190. [DOI] [PubMed] [Google Scholar]
- Borst SE, 2004. The role of TNF-alpha in insulin resistance. Endocrine 23, 177–182. [DOI] [PubMed] [Google Scholar]
- Bryson JM, Phuyal JL, Swan V, Caterson ID, 1999. Leptin has acute effects on glucose and lipid metabolism in both lean and gold thioglucose-obese mice. Am J Physiol 277, E417–422. [DOI] [PubMed] [Google Scholar]
- Capuron L, Lasselin J, Castanon N, 2017. Role of Adiposity-Driven Inflammation in Depressive Morbidity. Neuropsychopharmacology 42, 115–128. [DOI] [PMC free article] [PubMed] [Google Scholar]
- Cattaneo A, Gennarelli M, Uher R, Breen G, Farmer A, Aitchison KJ, Craig IW, Anacker C, Zunsztain PA, McGuffin P, Pariante CM, 2013. Candidate genes expression profile associated with antidepressants response in the GENDEP study: differentiating between baseline ‘predictors’ and longitudinal ‘targets’. Neuropsychopharmacology : official publication of the American College of Neuropsychopharmacology 38, 377–385. [DOI] [PMC free article] [PubMed] [Google Scholar]
- Currier MB, Nemeroff CB, 2014. Depression as a risk factor for cancer: from pathophysiological advances to treatment implications. Annu Rev Med 65, 203–221. [DOI] [PubMed] [Google Scholar]
- Delgado I, Huet L, Dexpert S, Beau C, Forestier D, Ledaguenel P, Aubert A, Sauvant J, Aouizerate B, Magne E, Capuron L, 2018. Depressive symptoms in obesity: Relative contribution of low-grade inflammation and metabolic health. Psychoneuroendocrinology 91, 55–61. [DOI] [PubMed] [Google Scholar]
- Dutheil S, Ota KT, Wohleb ES, Rasmussen K, Duman RS, 2016. High-Fat Diet Induced Anxiety and Anhedonia: Impact on Brain Homeostasis and Inflammation. Neuropsychopharmacology : official publication of the American College of Neuropsychopharmacology 41, 1874–1887. [DOI] [PMC free article] [PubMed] [Google Scholar]
- Esser N, Paquot N, Scheen AJ, 2015. Anti-inflammatory agents to treat or prevent type 2 diabetes, metabolic syndrome and cardiovascular disease. Expert Opin Investig Drugs 24, 283–307. [DOI] [PubMed] [Google Scholar]
- Felger JC, 2018. Imaging the Role of Inflammation in Mood and Anxiety-related Disorders. Curr Neuropharmacol 16, 533–558. [DOI] [PMC free article] [PubMed] [Google Scholar]
- Felger JC, Haroon E, Patel TA, Goldsmith DR, Wommack EC, Woolwine BJ, Le NA, Feinberg R, Tansey MG, Miller AH, 2018. What does plasma CRP tell us about peripheral and central inflammation in depression? Mol Psychiatry [DOI] [PMC free article] [PubMed]
- Felger JC, Li Z, Haroon E, Woolwine BJ, Jung MY, Hu X, Miller AH, 2016. Inflammation is associated with decreased functional connectivity within corticostriatal reward circuitry in depression. Mol Psychiatry 21, 1358–1365. [DOI] [PMC free article] [PubMed] [Google Scholar]
- Felger JC, Treadway MT, 2017. Inflammation Effects on Motivation and Motor Activity: Role of Dopamine. Neuropsychopharmacology 42, 216–241. [DOI] [PMC free article] [PubMed] [Google Scholar]
- Frivolt K, Schwerd T, Schatz SB, Freudenberg F, Prell C, Werkstetter KJ, Bufler P, Koletzko S, 2017. Hyperadiponectinemia During Infliximab Induction Therapy in Pediatric Crohn’s Disease. J Pediatr Gastroenterol Nutr [DOI] [PubMed]
- Gentile S, Guarino G, Bizzarro A, De Bellis A, Torella R, 2002. Infliximab does not interfere with insulin secretion, insulin resistance and production of GAD and islet cell antibodies in patients with Crohn’s disease. Diabetes Obes Metab 4, 276–277. [DOI] [PubMed] [Google Scholar]
- Gonzalez-Gay MA, De Matias JM, Gonzalez-Juanatey C, Garcia-Porrua C, Sanchez-Andrade A, Martin J, Llorca J, 2006. Anti-tumor necrosis factor-alpha blockade improves insulin resistance in patients with rheumatoid arthritis. Clin Exp Rheumatol 24, 83–86. [PubMed] [Google Scholar]
- Grimsholm O, Rantapaa-Dahlqvist S, Forsgren S, 2005. Levels of gastrin-releasing peptide and substance P in synovial fluid and serum correlate with levels of cytokines in rheumatoid arthritis. Arthritis Res Ther 7, R416–426. [DOI] [PMC free article] [PubMed] [Google Scholar]
- Haroon E, Daguanno AW, Woolwine BJ, Goldsmith DR, Baer WM, Wommack EC, Felger JC, Miller AH, 2018. Antidepressant treatment resistance is associated with increased inflammatory markers in patients with major depressive disorder. Psychoneuroendocrinology 95, 43–49. [DOI] [PMC free article] [PubMed] [Google Scholar]
- Haroon E, Felger JC, Woolwine BJ, Chen X, Parekh S, Spivey JR, Hu XP, Miller AH, 2014. Age-related increases in basal ganglia glutamate are associated with TNF, reduced motivation and decreased psychomotor speed during IFN-alpha treatment: Preliminary findings. Brain, behavior, and immunity [DOI] [PMC free article] [PubMed]
- Haroon E, Fleischer CC, Felger JC, Chen X, Woolwine BJ, Patel T, Hu XP, Miller AH, 2016. Conceptual convergence: increased inflammation is associated with increased basal ganglia glutamate in patients with major depression. Mol Psychiatry [DOI] [PMC free article] [PubMed]
- Haroon E, Miller AH, Sanacora G, 2017. Inflammation, Glutamate, and Glia: A Trio of Trouble in Mood Disorders. Neuropsychopharmacology : official publication of the American College of Neuropsychopharmacology 42, 193–215. [DOI] [PMC free article] [PubMed] [Google Scholar]
- Hasin DS, Sarvet AL, Meyers JL, Saha TD, Ruan WJ, Stohl M, Grant BF, 2018. Epidemiology of Adult DSM-5 Major Depressive Disorder and Its Specifiers in the United States. JAMA Psychiatry 75, 336–346. [DOI] [PMC free article] [PubMed] [Google Scholar]
- Hotamisligil GS, Murray DL, Choy LN, Spiegelman BM, 1994. Tumor necrosis factor alpha inhibits signaling from the insulin receptor. Proc Natl Acad Sci U S A 91, 4854–4858. [DOI] [PMC free article] [PubMed] [Google Scholar]
- Kiecolt-Glaser JK, Fagundes CP, Andridge R, Peng J, Malarkey WB, Habash D, Belury MA, 2017. Depression, daily stressors and inflammatory responses to high-fat meals: when stress overrides healthier food choices. Mol Psychiatry 22, 476–482. [DOI] [PMC free article] [PubMed] [Google Scholar]
- Kiortsis DN, Mavridis AK, Vasakos S, Nikas SN, Drosos AA, 2005. Effects of infliximab treatment on insulin resistance in patients with rheumatoid arthritis and ankylosing spondylitis. Ann Rheum Dis 64, 765–766. [DOI] [PMC free article] [PubMed] [Google Scholar]
- Kusminski CM, McTernan PG, Kumar S, 2005. Role of resistin in obesity, insulin resistance and Type II diabetes. Clin Sci (Lond) 109, 243–256. [DOI] [PubMed] [Google Scholar]
- Le NA, Innis-Whitehouse W, Li X, Bakker-Arkema R, Black D, Brown WV, 2000. Lipid and apolipoprotein levels and distribution in patients with hypertriglyceridemia: effect of triglyceride reductions with atorvastatin. Metabolism 49, 167–177. [DOI] [PubMed] [Google Scholar]
- Lehto SM, Huotari A, Niskanen L, Tolmunen T, Koivumaa-Honkanen H, Honkalampi K, Ruotsalainen H, Herzig KH, Viinamaki H, Hintikka J, 2010. Serum adiponectin and resistin levels in major depressive disorder. Acta Psychiatr Scand 121, 209–215. [DOI] [PubMed] [Google Scholar]
- Li L, Shelton RC, Chassan RA, Hammond JC, Gower BA, Garvey TW, 2016. Impact of Major Depressive Disorder on Prediabetes by Impairing Insulin Sensitivity. J Diabetes Metab 7. [DOI] [PMC free article] [PubMed] [Google Scholar]
- Lis K, Kuzawinska O, Balkowiec-Iskra E, 2014. Tumor necrosis factor inhibitors - state of knowledge. Arch Med Sci 10, 1175–1185. [DOI] [PMC free article] [PubMed] [Google Scholar]
- Mehta D, Raison CL, Woolwine BJ, Haroon E, Binder EB, Miller AH, Felger JC, 2013. Transcriptional signatures related to glucose and lipid metabolism predict treatment response to the tumor necrosis factor antagonist infliximab in patients with treatment-resistant depression. Brain Behav Immun 31, 205–215. [DOI] [PMC free article] [PubMed] [Google Scholar]
- Miller AH, Haroon E, Felger JC, 2017. Therapeutic Implications of Brain-Immune Interactions: Treatment in Translation. Neuropsychopharmacology : official publication of the American College of Neuropsychopharmacology 42, 334–359. [DOI] [PMC free article] [PubMed] [Google Scholar]
- Miranda-Filloy JA, Lopez-Mejias R, Genre F, Carnero-Lopez B, Ochoa R, Diaz de Teran T, Gonzalez-Juanatey C, Blanco R, Llorca J, Gonzalez-Gay MA, 2013. Adiponectin and resistin serum levels in non-diabetic ankylosing spondylitis patients undergoing TNF-alpha antagonist therapy. Clin Exp Rheumatol 31, 365–371. [PubMed] [Google Scholar]
- Musselman DL, Betan E, Larsen H, Phillips LS, 2003. Relationship of depression to diabetes types 1 and 2: epidemiology, biology, and treatment. Biol Psychiatry 54, 317–329. [DOI] [PubMed] [Google Scholar]
- Musselman DL, Evans DL, Nemeroff CB, 1998. The relationship of depression to cardiovascular disease: epidemiology, biology, and treatment. Arch Gen Psychiatry 55, 580–592. [DOI] [PubMed] [Google Scholar]
- Nieto-Vazquez I, Fernandez-Veledo S, Kramer DK, Vila-Bedmar R, Garcia-Guerra L, Lorenzo M, 2008. Insulin resistance associated to obesity: the link TNF-alpha. Arch Physiol Biochem 114, 183– 194. [DOI] [PubMed] [Google Scholar]
- Park HS, Park JY, Yu R, 2005. Relationship of obesity and visceral adiposity with serum concentrations of CRP, TNF-alpha and IL-6. Diabetes Res Clin Pract 69, 29–35. [DOI] [PubMed] [Google Scholar]
- Pearson TA, 2003. Markers of Inflammation and Cardiovascular Disease: Application to Clinical and Public Health Practice: A Statement for Healthcare Professionals From the Centers for Disease Control and Prevention and the American Heart Association. Circulation 107, 499–511. [DOI] [PubMed] [Google Scholar]
- Pico AR, Kelder T, van Iersel MP, Hanspers K, Conklin BR, Evelo C, 2008. WikiPathways: pathway editing for the people. PLoS Biol 6, e184. [DOI] [PMC free article] [PubMed] [Google Scholar]
- Popa C, Netea MG, van Riel PL, van der Meer JW, Stalenhoef AF, 2007. The role of TNF-alpha in chronic inflammatory conditions, intermediary metabolism, and cardiovascular risk. J Lipid Res 48, 751–762. [DOI] [PubMed] [Google Scholar]
- Raison CL, Borisov AS, Majer M, Drake DF, Pagnoni G, Woolwine BJ, Vogt GJ, Massung B, Miller AH, 2009. Activation of central nervous system inflammatory pathways by interferon-alpha: relationship to monoamines and depression. Biol Psychiatry 65, 296–303. [DOI] [PMC free article] [PubMed] [Google Scholar]
- Raison CL, Rutherford RE, Woolwine BJ, Shuo C, Schettler P, Drake DF, Haroon E, Miller AH, 2013. A randomized controlled trial of the tumor necrosis factor antagonist infliximab for treatment-resistant depression: the role of baseline inflammatory biomarkers. JAMA Psychiatry 70, 31– 41. [DOI] [PMC free article] [PubMed] [Google Scholar]
- Rapaport MH, Nierenberg AA, Schettler PJ, Kinkead B, Cardoos A, Walker R, Mischoulon D, 2016. Inflammation as a predictive biomarker for response to omega-3 fatty acids in major depressive disorder: a proof-of-concept study. Mol Psychiatry 21, 71–79. [DOI] [PMC free article] [PubMed] [Google Scholar]
- Rethorst CD, Bernstein I, Trivedi MH, 2014. Inflammation, obesity, and metabolic syndrome in depression: analysis of the 2009–2010 National Health and Nutrition Examination Survey (NHANES). J Clin Psychiatry 75, e1428–1432. [DOI] [PMC free article] [PubMed] [Google Scholar]
- Rush AJ, 2007. STAR*D: what have we learned? Am J Psychiatry 164, 201–204. [DOI] [PubMed] [Google Scholar]
- Shelton RC, Falola M, Li L, Zajecka J, Fava M, Papakostas GI, 2015. The pro-inflammatory profile of depressed patients is (partly) related to obesity. J Psychiatr Res 70, 91–97. [DOI] [PMC free article] [PubMed] [Google Scholar]
- Shelton RC, Miller AH, 2010. Eating ourselves to death (and despair): the contribution of adiposity and inflammation to depression. Prog Neurobiol 91, 275–299. [DOI] [PMC free article] [PubMed] [Google Scholar]
- Singh B, Saxena A, 2010. Surrogate markers of insulin resistance: A review. World J Diabetes 1, 36– 47. [DOI] [PMC free article] [PubMed] [Google Scholar]
- Steiner SJ, Pfefferkorn MD, Fitzgerald JF, Denne SC, 2008. Carbohydrate and lipid metabolism following infliximab therapy in pediatric Crohn’s disease. Pediatr Res 64, 673–676. [DOI] [PubMed] [Google Scholar]
- Tam LS, Tomlinson B, Chu TT, Li TK, Li EK, 2007. Impact of TNF inhibition on insulin resistance and lipids levels in patients with rheumatoid arthritis. Clin Rheumatol 26, 1495–1498. [DOI] [PubMed] [Google Scholar]
- Torres MA, Pace TW, Liu T, Felger JC, Mister D, Doho GH, Kohn JN, Barsevick AM, Long Q, Miller AH, 2013. Predictors of depression in breast cancer patients treated with radiation: role of prior chemotherapy and nuclear factor kappa B. Cancer 119, 1951–1959. [DOI] [PMC free article] [PubMed] [Google Scholar]
- Tschritter O, Fritsche A, Thamer C, Haap M, Shirkavand F, Rahe S, Staiger H, Maerker E, Haring H, Stumvoll M, 2003. Plasma adiponectin concentrations predict insulin sensitivity of both glucose and lipid metabolism. Diabetes 52, 239–243. [DOI] [PubMed] [Google Scholar]
- Uher R, Mors O, Hauser J, Rietschel M, Maier W, Kozel D, Henigsberg N, Souery D, Placentino A, Perroud N, Dernovsek MZ, Strohmaier J, Larsen ER, Zobel A, Leszczynska-Rodziewicz A, Kalember P, Pedrini L, Linotte S, Gunasinghe C, Aitchison KJ, McGuffin P, Farmer A, 2009. Body weight as a predictor of antidepressant efficacy in the GENDEP project. Journal of affective disorders 118, 147–154. [DOI] [PubMed] [Google Scholar]
- Weisberg SP, McCann D, Desai M, Rosenbaum M, Leibel RL, Ferrante AW Jr., 2003. Obesity is associated with macrophage accumulation in adipose tissue. J Clin Invest 112, 1796–1808. [DOI] [PMC free article] [PubMed] [Google Scholar]
Associated Data
This section collects any data citations, data availability statements, or supplementary materials included in this article.