Abstract
Background
The use of the desirability function approach combined with the response surface methodology (RSM), also called Desirability Optimization Methodology (DOM), has been successfully applied to solve medical, chemical, and technological questions. It is particularly efficient for the determination of the optimal conditions in natural or industrial processes involving different factors leading to the antagonist responses.
Objectives
Surprisingly, DOM has never been applied to the research programs devoted to the study of plant responses to the complex environmental changes, and thus to biotechnological questions.
Materials and Methods
In this article, DOM is used to study the response of Datura stramonium hairy roots (HRs), obtained by genetic transformation with Agrobacterium rhizogenes A4 strain, subjected to the jasmonate treatments.
Results
Antagonist effects on the growth and tropane alkaloid biosynthesis are confirmed. With a limited number of experimental conditions, it is shown that 0.06 mM jasmonic acid (JA) applied for 24 h leads to an optimal compromise. Hyoscyamine levels increase by up to 290% after 24 h and this treatment does not significantly inhibit biomass growth.
Conclusions
It is thus demonstrated that the use of DOM can efficiently - with a minimized number of replicates - leads to the optimization of the biotechnological processes.
Keywords: Desirability Optimization Methodology (DOM), Hyoscyamine, Jasmonic Acid, Multiresponse Optimization, Response Surface Methodology (RSM)
1. Background
When using a complex system, several experimental factors have to be optimized so it is essential to evaluate alternative analytical procedures according to multiple criteria (1, 2). The determination of the optimum conditions for the input variables requires the simultaneous consideration of all responses. This is called a multiresponse problem (3, 4) based on Multicriteria Decision Making. To obtain a satisfactory compromise, the desirability approach is used as a powerful tool in multi-response systems (4). The desirability function, defined by Harrington (1965) (5) and by Derringer and Suich (1980) (3), is one of the approaches used for factor optimization in such systems (6-8). It is based on the transformation of all the obtained responses from different scales into a scale-free value. The values of desirability functions lie between 0 and 1. The value 0 is attributed when the factors give an undesirable response, while the value 1 corresponds to the optimal performance for the studied factors (3, 4). As an example in biological sciences, an optimization strategy based on the desirability function approach has been used for the microbial glutamine production (9). Furthermore, for studying the behavior of the complex systems, the use of the desirability function approach combined with the classic experimental designs enables the following matters (10-12):
A reduction in the number of modalities to be testedand a determination of the optimal compromise betweendifferent levels of environmental factors leading to theantagonist responses.
Among the classic experimental designs, Response Surface Methodology (RSM) is widely used because of its simplicity and effectiveness. The goal of RSM is to explore the relationship between the response (a dependent variable) and the studied factors (an independent variable) involved in an experiment. The mathematical model of RSM is a polynomial equation (Eq.) of the second degree which has the advantage of being easy to estimate and then to apply for the approximation of the response (13-15).
The combined application of RSM and the desirability approach gives rise to a more powerful method for finding an optimal balance between the responses, including antagonist responses (multicriteria optimization). This combination of the RSM and desirability function has resulted in a new method called “Desirability Optimization Methodology or DOM” (16). Although quite commonly used in industrial microbiology, biochemistry, and chemical analysis (7, 10, 17), to the best of our knowledge, such a method has never been applied to the plant biotechnological studies and, more specifically, to the study of the in vitro response of a plant secondary metabolism to the environmental factors.
Because of the interest in the biotechnological production of the plant secondary metabolites, we chose to evaluate the potential of DOM for studying the metabolic changes induced by elicitation in the hairy roots (HRs) of Datura stramonium. As widely described (18-20), hairy root cultures of Datura species produce tropane alkaloids. Their biosynthesis can be modulated by the culture medium composition or by elicitor treatments. Such treatments can lead to tropane alkaloid levels as high as, and even higher than those measured in the whole plants. Because of their rapid growth capacity, HRs are also a good experimental system.
Synthesized from linolenic acid, jasmonate is a signal molecule involved in the response to the different kinds of stress, and more specifically, to the elicitation; it thus leads to the plant defense reactions (21-24). It stimulates the accumulation of the secondary metabolites such as tropane alkaloids in solanaceous plants (25). The use of elicitors or phytohormones, such as jasmonate and its volatile derivative methyl jasmonate (26, 27), is a possible approach for increasing tropane alkaloid biosynthesis in Datura species (25, 28). However, plant growth is then inhibited (25, 29, 30). This kind of antagonist response is often observed during stress (31-35). In order to develop an efficient in vitro technology to produce secondary metabolites using elicitation, optimum conditions must be determined i.e. elicitor concentration and elicitation time and duration. In Datura hairy root cultures, because growth decreases when alkaloid levels increase, determining an optimal treatment condition thus becomes a difficult challenge (36-38).
2. Objectives
This study investigates how efficiently DOM can be used to study the antagonist response (growth vs. alkaloid synthesis) of Datura stramonium HRs subjected to jasmonate treatments. Subsequently, i) elicitation conditions are optimized for hyoscyamine production and ii) this mathematical modeling using DOM may serve as an example for other studies devoted to the plant biology and biotechnology.
3. Materials and Methods
3.1. Plant Material
The HRs of Datura stramonium, obtained by genetic transformation with Agrobacterium rhizogenes A4 strain on hypocotyls, were examined for their performance: growth (dry weight), alkaloid content, and reaction to elicitation (14, 20). Then, the best hairy root line was selected and subcultured every 20-25th day in fresh B5 Gamborg hormone-free culture medium containing 3% sucrose (35). All hairy root cultures were grown at 26 ± 1 °C in the dark. For experiments, root tips (0.3 g fresh weight) were cultured in Petri dishes containing 20 mL of hormone-free medium (Gamborg) (39) with 3% sucrose.
3.2. Elicitation
The solution of jasmonic acid (JA) [(−)jasmonic acid from Sigma-Aldrich] was prepared by dissolving jasmonic acid in an adequate volume of ethanol. It was then filtered through a membrane filter (pore size: 0.2 µm Nalgene) (14). Five concentrations of the jasmonic acid (JA): 0.0172, 0.0250, 0.0500, 0.0750, and 0.0830 mM and five exposure times (ET): 1.6, 8, 28, 48, and 54.4 hours were tested according to CCDO, (see section RSM: experimental design). The choice of concentrations and ETs was based on a literature study (25, 30) and on our previous works. The elicitation experiments were initiated after the transfer of roots to the fresh B5 medium (20 mL) on the 12th day of culture (logarithmic phase of growth according to Amdoun et al., 2009(20).
All cultures were grown in Petri dishes containing 20 mL of B5 medium and in darkness at 26 ± 1 °C. The control (ethanol-water solution without JA) was the same hairy root line in the same conditions of the culture. All culture experiments were carried out in the experimental setup design of triplicates.
3.3. Determination of Biomass and Hyoscyamine Content
Applying a precision balance, the biomass of the correspondent dry weight of HRs, obtained after oven drying for 48 h at 40 °C, was measured. The alkaloids were extracted using a method described by Amdoun et al. (2009) (20). Hyoscyamine was analyzed by the GC-MS method previously reported by Kartal et al. (2003) (40).
3.4. RSM: Experimental Design
The CCDO, described by Box and Wilson (1951) (13), was chosen for this work. It is composed of a factorial design 2k, with at least one experimental central point and a star designs whose axial points: - α and + α are placed on the axis of each factor. The ET and jasmonic JAC experiments which influence the biomass and hyoscyamine content were carried out according to the CCDO. Only fourteen experiments (R1 to R14) were necessary to model the JAC and ET influence on biomass and alkaloid production. The CCDO, the variables (JAC; ET) and their studied levels (5 concentrations and 5 elicitation times) are presented in Figure 1. Each point (R1…R14) corresponds to one experiment. The points R1 to R4 represent the factorial design. The points R5 to R8 are the star design. The points R9 to R14 represent the experiments carried out in the central experimental design. Six repetitions (R9 to R14) were performed and the optimal criterion was orthogonality. In this case, ±α = ±1.32 was chosen respect to the criterion.
Figure 1.
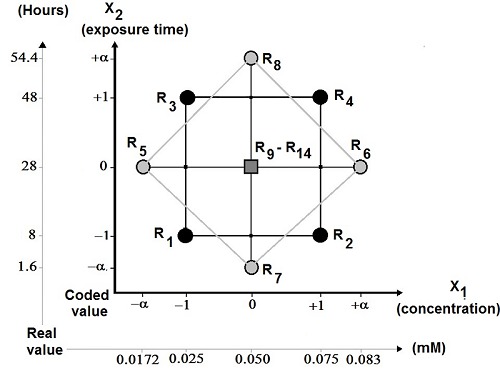
The central composite design orthogonal (CCDO): variables and their studied levels. Each point corresponds to one experiment. The points R1 to R4 are the factorial design, the points R5 to R8 are the star design, the points R9 to R14 are the experiments carried out in the central experimental design (with coded value ± α = ± 1.32 for the orthogonality criterion).
The levels of variable Xi were coded from the equation Xi = (Ai-A0 )/DAi, where Xi is the independent variable coded value, Ai is the independent variable real value, A0 is the independent variable real value on the central point, and DAi is the step change value.
3.5. Expression of Measured Responses and Results
The biomass growth was represented by a growth index (GI) calculated from equation 1. For a GI = 1, hairy root growth was not affected by JA. On the other hand, a GI #x003C; 1 has revealed an affected growth. At the same time, the increase in hyoscyamine content after elicitation was represented by the elicitation index (EI). It was calculated from equation 2. If the hyoscyamine content was increased, the EI was >1.
| (Eq.1) |
| (Eq. 2) |
3.6. Mathematical Modeling of Measured Responses: Growth Index (YGI) and Elicitation Index (YEI)
The results (i.e., the measured GI and EI) obtained from the experiments defined in Figure 1 (CCDO) were used for the mathematical model expression of the effects of JAC and elicitation time (ET) on GI and EI. The results of the CCDO were used for the computation of the coefficients of the two quadratic models Eq. 3 and Eq. 4 by the method of the least squares (41).
| (Eq. 3) |
| (Eq. 4) |
Where, YGI and YEI are the responses (biomass or hyoscyamine level), JAC is the jasmonic acid concentration, ET is the elicitation time, and α0, α1...α12 are the model’s coefficients. After the overall evaluation (R², ANOVA) followed by adjustment of the model, they were used for the simultaneous optimization of YGI and YEI with the desirability function approach.
3.7. Desirability Function
The desirability function approach transforms an estimated response into a scale-free value, called desirability (3, 4, 5). The objectives of optimization can be used to maximize, minimize, or obtain the target value of the response (42). Depending on the objective different desirability functions can be employed. Derringer and Suich (1980) (3) applied a special function for the transformation of the Yi responses to the desirability di(Yi). So, two transformations are proposed:
The one-sided transformation used to maximizeor minimize Yi; the two-sided transformation (equation 5) usedto obtain the target value ti for Yi where li and ui are thelower and upper bounds on the studied response (suchthat li #x003C;ti #x003C;ui).
The powers s and t correspond to the weighted factor. s and t are the parameters that determine the shape of di(Yi). For s = t = 1, the desirability function increases linearly to ti. If s #x003C;1 and t #x003C; 1, the function is concave and if s >1 and t > 1, the shape is convex (4, 42).
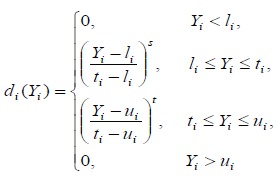 |
(Eq. 5) |
The overall desirability function D is defined as the geometric average of the individual desirability functions of each response di(Yi) (equation 6) where n is the number of responses. The optimal solutions are determined by maximizing D (4).
 |
(Eq. 6) |
3.8. Statistical Analyses
ANOVA (Fisher Test) was used for an overall evaluation of the models. Tests at 5% risk were considered significant. The coefficient of determination R² has to be taken into account. It represents the ratio of the variance suggested by the mathematical model with respect to the overall variance and varies from 0 to 1. It was calculated from equation 7 where SCE is the sum of the squares of the residuals and SCT is the total sum of the squares. It is also necessary to take into account the Absolute Average Deviation (AAD), whose value must be low. The R² analysis alone is not a measure of the model’s accuracy even if the value is large. The AAD is calculated by the equation 8 where Yi,mes and Yi,pre are the measured and predicted responses, respectively, and n is the number of the experimental run. The simultaneous evaluation of these two values (R² and AAD) shows the overall predictive capability of the mathematical model (43).
 |
(Eq. 7) |
 |
(Eq. 8) |
4. Results
4.1. Modeling the Growth Index (YGI) and Elicitation Index (YEI)
The results obtained after the experiments according to the CCDO were used to compute by the least squares method; the coefficients of the two quadratic models (equations 3 and 4) are expressing the effects of JAC-ET on GI and EI.
The obtained two quadratic models YGI and YEI show large coefficients of determination (R2 = 0.80 for YGI and R2 = 0.90 for YEI) with values #x003C;10% for AAD (6.5% for YGI and 6.0% for YEI). Thus, these two models explain 80% and 90%, respectively, of the YGI and YEI variability; they are predictive overall. Following the variance analysis (Table 1), evaluation and diagnostic of these two models, all the insignificant terms were removed (14, 44).
Table 1.
Analysis by ANOVA for the quadratic models of the growth and elicitation indexes. The results in bold are significant at 5% risk: * significant; ** highly significant; *** very highly significant.
| Source | Sum of Squares | df | Mean Square | F-value | p-value | Significance |
|---|---|---|---|---|---|---|
| Growth Index (GI) | ||||||
| Model | 0.304 | 5 | 0.060 | 8.753 | 0.004 | ** |
| JAC | 0.084 | 1 | 0.084 | 12.106 | 0.008 | ** |
| ET | 0.150 | 1 | 0.150 | 21.661 | 0.001 | ** |
| JAC x ET | 0.010 | 1 | 0.010 | 1.437 | 0.264 | |
| JAC2 | 0.001 | 1 | 0.001 | 0.261 | 0.623 | |
| ET2 | 0.057 | 1 | 0.057 | 8.297 | 0.020 | * |
| Residual | 0.055 | 8 | 0.006 | |||
| Cor Total | 0.360 | 13 | ||||
| Elicitation Index (EI) | ||||||
| Model | 4.014 | 5 | 0.802 | 15.560 | 0.000 | *** |
| JAC | 0.655 | 1 | 0.655 | 12.714 | 0.007 | ** |
| ET | 2.686 | 1 | 2.686 | 52.067 | 0.000 | *** |
| JAC x ET | 0.002 | 1 | 0.002 | 0.048 | 0.831 | |
| JAC2 | 0.375 | 1 | 0.375 | 7.278 | 0.027 | * |
| ET2 | 0.293 | 1 | 0.293 | 5.695 | 0.044 | * |
| Residual | 0.412 | 8 | 0.051 | |||
| Cor Total | 4.427 | 13 | ||||
Cor Total: Corrected Total sum of squares
In this way, the adjusted mathematical models became:
| (Eq.9) |
| (Eq. 10) |
4.2. Simultaneous Optimization by the Desirability Function Approach
Equation 5 was used for the two-sided transformation of the responses to an individual desirability scale where they increased linearly from 0 to 1. They were noted dGI for GI and dEI for elicitation index (EI). Equation 6 led to the overall desirability function D defined to find an optimal solution for both JAC-ET factors. Figures 2 and 3 show the response surface and the contour plot of the desirability function in the space of the factor JAC and ET for the two models.
Figure 2.
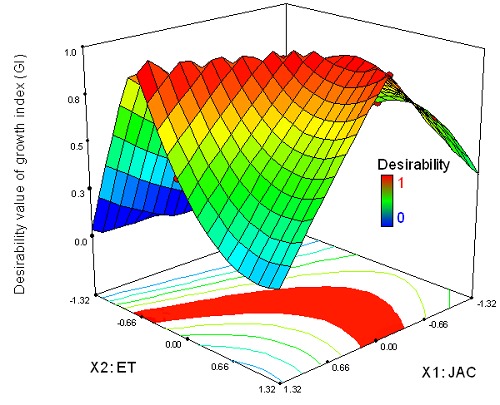
Response surfaces and estimated contours of the desirability value of the biomass as a function of JAC and elicitation time (ET).
Figure 3.
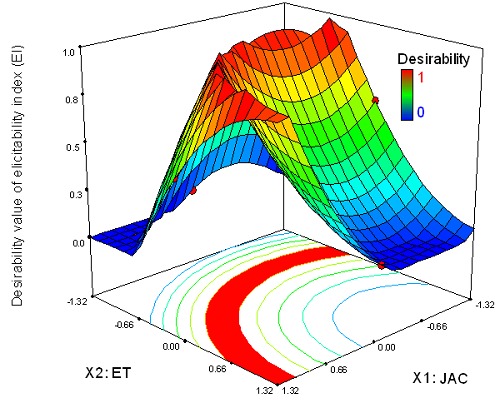
The response surfaces and estimated contours of the desirability value of hyoscyamine content as a function of JAC and elicitation time (ET).
For biomass, the maximum desirability values are: 0.7 for GI (target values for GI), between small values of ET and mean values of JAC. The desirability is high for EI = 2.15 (target values for EI) (dEI =1), even at low JAC (Fig. 3). The optimal solutions fit with all the intersection points between JAC and ET and correspond to the values of the maximized desirabilities for GI and EI, so dGI = 1 and dEI = 1, respectively (Figs. 2 and 3). These two responses, individually, show an area of optimal solutions for di = 1. The level of difficulty of multiresponse optimization increases when the optimal areas of responses are too distant and do not cross. It is therefore necessary to find an optimal compromise between all the responses taken into consideration. Thus, the overall desirability function D is the most used and significant approach (45).
Figure 4 shows the resulting overall desirability D with respect to JAC and ET. The area of optimal solutions decreases when the two responses GI and EI are taken simultaneously for the optimization.
Figure 4.
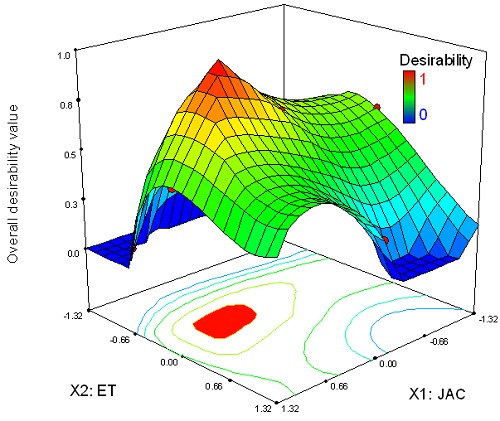
The response surfaces and estimated contours of the overall desirability as a function of JAC and ET.
This response surface analysis is due to the conflict of JAC and ET on the biomass and hyoscyamine level. So, the optimal combinations JAC and ET are presented by the intersection between X1 and X2 (red zone in Fig. 4) where D = 1. The projected area corresponds to the optimal solutions (compromise) between the two antagonist responses (Fig. 4). This area has been defined with a limited number of experiments, thanks to the use of DOM. Thus, these results confirm the usefulness of DOM for finding the compromises between antagonist responses and, more specifically here, between hyoscyamine levels and the growth preservation.
To obtain the target values GI = 0.7 and EI = 2.15, one of the solutions which maximizes D (=1) corresponds to 0.06 mM (coded 0.55) for JAC and 23.2 h for ET (coded -0.24).
4.3. Optimization Levels by the Application of DOM
To investigate the optimization level by DOM, a number of experiments were carried out with JAC = 0.06 mM and ET = 23.2 h (Table 2). For practical reasons, the ET was adjusted to 24 h; the value that was included in the optimal solutions. Before elicitation experiments on the 12th day of culture, the roots were transferred to a fresh B5 medium (20 mL). The responses on biomass and hyoscyamine level were studied at 24 h and 120 h after elicitation.
Table 2.
Optimization of the hyoscyamine content and biomass growth at 24 and 120 h after elicitation (results are rounded to one decimal point).
| Jasmonic acid (mM) | Hyoscyamine (mg.g-1 DW) | Biomass (g DW.L-1) | ||
|---|---|---|---|---|
| 24 h | 120 h | 24 h | 120 h | |
| 0 (control) | 0.3 ± 1.9 | 6.3 ± 0.2 | 5.0 ± 0.2 | 0.2 ± 6.3 |
| 0.06 | 0.5 ± 5.6 | 6.5 ± 0.2 | 0.2 ± 5.0 | 0.2 ± 5.6 |
| GI and EI | EI = 2.9 | EI = 1.0 | GI = 1.0 | GI = 0.9 |
The obtained results show that JA elicitation (0.06 M for 24 hours) led to a 2.9-folds improvement in the hyoscyamine content 24 h after elicitation. However, the same hyoscyamine content was obtained in the control and elicited hairy roots (EI = 1.0) 120 h after elicitation. Nevertheless, the biomass was slightly affected (GI = 0.9) 120 h after elicitation.
5. Discussion
5.1. Modelization of YGI and YEI
For the ŶGI model, it can be seen that JAC (- 0.11) and ET (- 0.14) show a negative effect on hairy root growth (equation 9). So, if JAC-ET factors are increased, hairy root growth is inhibited (Fig. 5). In contrast, if JAC-ET factors are low, hairy root growth is not inhibited.
Figure 5.
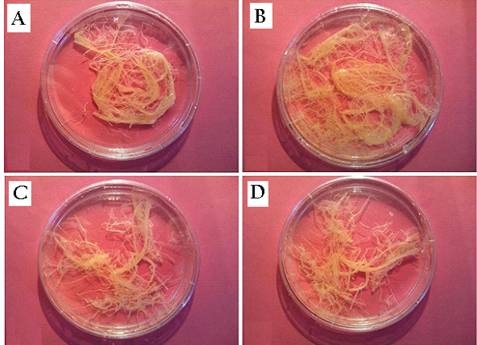
Elicited and control hairy root cultures. A: hairy root control on 13th day of culture. B: hairy root control on 17th day of culture. C: elicited hairy root culture on 13th day of culture (0.0830 mM jasmonic acid; 24 h after elicitation). D: elicited hairy root culture on 17th day of culture (0.0830 mM jasmonic acid; 120 h after elicitation).
These results are similar to those obtained by other authors. For example, Kang et al. (2004) (30) reported that 1 mM methyl jasmonate treatment did not have a negative effect on the growth of adventitious roots of Scopolia parviflora. However, when the adventitious root cultures were treated with 2.0 mM, the root GI decreased to 63% of the control culture. After 72 h of elicitation, the roots were severely damaged and died (Kang et al., 2004). Similar results have been reported by Deng (2005) (25) on the root growth inhibition of Datura stramonium using methyl jasmonate at a concentration of > 10-5 M.
An analysis of the ŶEI model (equation 10) shows a positive effect of JA (+ 0.30) and a negative effect of ET (- 0.60) on the hyoscyamine level. The effect of JA on the production of tropane alkaloids comes from the results which suggest that jasmonates regulate the expression of the key enzymes PMT (Putrescine N-Methyl Transferase) and H6H (Hyoscyamine 6 β-Hydroxylase) and the biosynthesis of the tropane alkaloids. The evaluation of jasmonate effects on the tropane alkaloid biosynthesis has been suggested by western blotting on adventitious root cultures of Scopolia parviflora (30). In Datura stramonium, methyl jasmonate was shown to increase phenylalanine levels, one of precursors of tropane alkaloids, at 10-8 M. Subsequently, tropinone, tropine and j-tropine levels were greatly increased by methyl jasmonate at 10-7 and 10-6 M (25).
Thus, the two models: (9) and (10) confirm that JA is a sensitive elicitor with two antagonist responses: it increases the hyoscyamine content with growth inhibition of the HRs. So, a compromise between JAC and ET is essential in order to improve the hyoscyamine level with no inhibition on the root growth by using the desirability approach.
To obtain a satisfactory compromise, the optimal solution (JAC-ET combination) is defined by the target values (ti) of the each response. The average values ti of both bounds li and ui are the target values for GI, ti = 0.7 (li = 0.4 and ui = 1), and for ET, ti = 2.15 (li = 1.3 and ui = 3), respectively. The values of the bounds li and ui of the GI and EI present the bounds of the experimental values obtained after application of the CCDO. To solve the conflict established between biomass and hyoscyamine content, the use of the average values as target values allows the solutions to be maximized and a satisfactory compromise to be established. The fitted models (9) and (10) were used for the simultaneous optimization of the YGI and YEI using the desirability function. In addition, the two-sided transformation was used in this work for multiresponse optimization and for both simultaneous responses.
5.2. Application of DOM
For various species like Scopolia parviflora (30) and Brugmansia suaveolens (46), the ET for the best production of hyoscyamine was 24 hours. The same authors have claimed the optimal JAC varies from 0.01 mM (30) to 2 mM (46). Zabetakis et al. (1999) (26) have reported that 0.1 µM of methyl jasmonate was the optimal concentration for the elicitation in the root culture of D. stramonium and increased the hyoscyamine production 1.8-fold compared to the control. In other species, Kang et al. (2004) (30) have reported the elicitation of the adventitious roots of Scopolia parviflora with 0.01 mM with an elicitation time of 24 h increased the hyoscyamine content 1.8-fold compared to the control over the same time without growth inhibition. In the same way, elicitation of the HRs of Brugmansia suaveolens by 2 mM JA for 24 h improved the yield of hyoscyamine 25 folds (46). However, these authors did not report the effect of JAC on the biomass.
Several studies on jasmonic acid effects on the tropane alkaloid content and biomass growth show conflicting responses. It is to be expected that the experimental conditions which lead to an optimum for one of these factors are not the same as for another. So, the optimization of these two parameters is rather difficult. However, in this paper we have shown that DOM (i.e., RSM combined with the desirability approach) is a satisfactory compromise for multiresponse optimization. DOM is useful and easy to adapt to the complex biological systems such as hairy root cultures. In our case, it led to an optimal solution for the parameters JAC-ET with a 2.9-fold improvement in hyoscyamine content and a slight growth inhibition; 10% less than the control. It seems that 90% of the hairy root biomass is retained after 5 days of elicitation (120 h). Thus, the maximum overall desirability function is reached for: JAC = 0.06 mM and ET = 24 hours. The present study was performed in a closed system, so the inhibitory effect of JA on biomass at low concentrations could be due to its prolonged presence in the culture medium. We can suppose that this effect will be absent in a system where the medium is changed regularly, such as a continuous or semi-continuous regime. In such a system, we anticipate that the high concentrations of JA (with a short ET) will not affect the biomass.
DOM has proved its efficiency for the development of the products in which different properties need to be associated (16). In this article we have shown that DOM is also extremely efficient for determining even antagonist responses in the plant biotechnological processes. These results thus show the way and opens up new opportunities for the other kinds of uses in the wide area of plant sciences and technologies.
Acknowledgements
The authors gratefully acknowledge funding support from ENSA of Algiers, the Algerian Ministry of High Education and Research (MESRS), and the University of Picardie Jules Verne, Amiens, France.
Abbreviations
- B5
Gamborg culture medium
- SCE
Sum of the squares of residuals
- SCT
Total sum of the squares
- YEI
Response of hyoscyamine content
- YGI
Response of growth level
References
- 1.Deming SN. Multiple-criteria optimization. J Chromatogr A. 1991;550:15-25. doi: 10.1016/s0021-9673(01)88527-7. [Google Scholar]
- 2.Hendriks MM, De Boer JH, Smilde AK, Doornbos DA. Multicriteria decision making. Chemometr. Intell Lab Syst. 1992;16(3):175-191. doi: 10.1016/0169-7439(92)80036-4. [Google Scholar]
- 3.Derringer G, Suich R. Simultaneous optimization of several response variables. J Quality Technol. 1980;12:214-219. [Google Scholar]
- 4.Jeong IJ, Kim KJ. An interactive desirability function method to multiresponse optimization. Eur J Oper Res. 2009;195(2):412-426. doi: 10.1016/j.ejor.2008.02.018. [Google Scholar]
- 5.Harrington ECJr. The desirability function. Ind Quality Control. 1965;21:494-498. [Google Scholar]
- 6.Bourguignon B, Massart DL. Simultaneous optimization of several chromatographic performance goals using Derringer’s desirability function. J Chromatogr A. 1991;586(1):11-20. doi: 10.1016/0021-9673(91)80019-d. [Google Scholar]
- 7.Safa F, Hadjmohammadi MR. Simultaneous optimization of the resolution and analysis time in micellar liquid chromatography of phenyl thiohydantoin amino acids using Derringer’s desirability function. J Chromatogr A. 2005;1078 (1-2):42-50. doi: 10.1016/j.chroma.2005.04.081 [DOI] [PubMed] [Google Scholar]
- 8.Candioti LV, De Zan MM, Cámara MS, Goicoechea HC. Experimental design and multiple response optimization. Using the desirability function in analytical methods development. Talanta. 2014;124:123-138. doi: 10.1016/j.talanta.2014.01.034. [DOI] [PubMed] [Google Scholar]
- 9.Li J, Ma C, Ma Y, Li Y, Zhou W, Xu P. Medium optimization by combination of response surface methodology and desirability function: an application in glutamine production. Appl Microbiol Biotechnol. 2007;74(3):563-571. doi:10.1007/s00253-006-0699-5. [DOI] [PubMed] [Google Scholar]
- 10.Outinen K, Haario H, Vuorela P, Nyman M, Ukkonen E, Vuorela H. Optimization of selectivity in high-performance liquid chromatography using desirability functions and mixture designs according to prisma. Eur J Pharmaceut Sci. 1998;6(3):197-205. doi:10.1016/s0928-0987(97)10016-1. [DOI] [PubMed] [Google Scholar]
- 11.Khodadoust S, Hadjmohammadi MR. Determination of N-methylcarbamate insecticides in water samples using dispersive liquid-liquid microextraction and HPLC with the aid of experimental design and desirability function. Anal. Chim Acta. 2011;699(1):113-119. doi:10.1016/j.aca.2011.04.011. [DOI] [PubMed] [Google Scholar]
- 12.Mourabet M, El Rhilassi A, El Boujaady H, Bennani-Ziatni M, El Hamri R, Taitai A. Removal of fluoride from aqueous solution by adsorption on Apatitic tricalcium phosphate using Box–Behnken design and desirability function. Appl Surf Sci. 2012;258(10):4402-4410. doi: 10.1016/j.apsusc.2011.12.125. [Google Scholar]
- 13.Box GEP, Wilson KB. On the experimental attainment of optimum conditions. J Roy Stat Soc B Stat Meth. 1951;13(1):1-45. [Google Scholar]
- 14.Amdoun R, Khelifi L, Khelifi-Slaoui M, Amroune S, Asch M, Assaf-Ducrocq C, Gontier E. Optimization of the culture medium composition to improve the production of hyoscyamine in elicited Datura stramonium L. hairy roots using the Response Surface Methodology (RSM). Int J Mol Sci. 2010;11(11):4726-4740. doi: 10.3390/ijms11114726. [DOI] [PMC free article] [PubMed] [Google Scholar]
- 15.Cui L, Wang ZY, Zhou XH. Optimization of elicitors and precursors to enhance valtrate production in adventitious roots of Valeriana amurensis Smir. ex Kom. Plant Cell Tiss Organ Cult. 2012;108(3):411-420. doi: 10.1007/s11240-011-0052-2. [Google Scholar]
- 16.Derringer GC. A Balancing Act: Optimizing a Product’s Properties. Quality Prog. 1994;51-58. [Google Scholar]
- 17.Hu Z, Cai M, Liang HH. Desirability function approach for the optimization of microwave-assisted extraction of saikosaponins from Radix Bupleuri. Separ Purif Tech. 2008;61(3):266-275. doi: 10.1016/j.seppur.2007.10.016. [Google Scholar]
- 18.Nussbaumer P, Kapétanidis I, Christen P. Hairy root of Datura candida x aurea: effect of culture medium composition on growth and biosynthesis. Plant Cell Rep. 1998;17(5):405-409. doi: 10.1007/s002990050415. [DOI] [PubMed] [Google Scholar]
- 19.Piñol MT, Palazón J, Cusidó RM, Ribó M. Influence of calcium ion-concentration in the medium on tropane alkaloid accumulation in Datura stramonium hairy roots. Plant Sci. 1999;141(1):41-49. doi: 10.1016/s0168-9452(98)00222-2. [Google Scholar]
- 20.Amdoun R, Khelifi L, Khelifi-Slaoui M, Amroune S, Benyoussef EH, Thi DV, Assaf-Ducrocq C, Gontier E. Influence of minerals and elicitation on Datura stramonium L. tropane alkaloid production: Modelization of the in vitro biochemical response. Plant Sci. 2009;177(2):81-87. doi: 10.1016/j.plantsci.2009.03.016. [Google Scholar]
- 21.Boitel-Conti M, Laberche JC, Lanoue A, Ducrocq C, Sangwan-Norreel B.S. Influence of feeding precursors on tropane alkaloid production during an abiotic stress in Datura innoxia transformed roots. Plant Cell Tissue Organ Cult. 2000;60(2):131-137. doi: 10.1023/a:1006426314274. [Google Scholar]
- 22.Yu LJ, Lan WZ, Qin WM, Xu HB. High stable production of taxol in elicited synchronous cultures of Taxus chinensis cells. Process Biochem. 2002;38(2):207-210. doi:10.1016/s0032-9592(02)00069-9. [Google Scholar]
- 23.Zhao J, Davis LC, Verpoorte R. Elicitor signal transduction leading to production of plant secondary metabolites. Biotechnol Adv. 2005;23(4):283-333. doi: 10.1016/j.biotechadv.2005.01.003. [DOI] [PubMed] [Google Scholar]
- 24.Vasconsuelo A, Boland R. Molecular aspects of the early stages of elicitation of secondary metabolites in plants. Plant Sci. 2007;172(5):861-875. doi: 10.1016/j.plantsci.2007.01.006 [Google Scholar]
- 25.Deng F. Effects of glyphosate, chlorsulfuron, and methyl jasmonate on growth and alkaloid biosynthesis of jimsonweed (Datura stramonium L.). Pestic Biochem. Physiol. 2005;82(1):16-26. doi: 10.1016/j.pestbp.2004.09.007. [Google Scholar]
- 26.Zabetakis L, Edwards R, O’Hagan D. Elicitation of tropane alkaloid biosynthesis in transformed root cultures of Datura stramonium. Phytochemistry. 1999;50(1):53-56. doi: 10.1016/s0031-9422(98)00490-7. [Google Scholar]
- 27.Herbert RB. The biosynthesis of plant alkaloids and nitrogenous microbial metabolites. Nat Prod Rep. 2001;18(1):50-65. doi: 10.1039/a809393h. [DOI] [PubMed] [Google Scholar]
- 28.Memelink J, Verpoorte R, Kijne JW. ORCAnization of jasmonate-responsive gene expression in alkaloid metabolism. Trends Plant Sci. 2001;6(5):212-219. doi: 10.1016/s1360-1385(01)01924-0. [DOI] [PubMed] [Google Scholar]
- 29.Nultsch W. Botanique générale. 10th ed De Boeck: Université-Theime Verlag, Bruxelles, Belgique; 1998. [Google Scholar]
- 30.Kang SM, Jung HY, Kang YM, Yun DJ, Bahk JD, Yang JK, Choi MS. Effects of methyl jasmonate and salicylic acid on the production of tropane alkaloids and the expression of PMT and H6H in adventitious root cultures of Scopolia parviflora. Plant Sci. 2004;166(3):745-751. doi: 10.1016/j.plantsci.2003.11.022. [Google Scholar]
- 31.Gundlach H, Müller MJ, Kutchan TM, Zenk MH. Jasmonic acid is a signal transducer in elicitor-induced plant cell cultures. Proc Natl Acad Sci Unit States Am. 1992;89(6):2389-2393. doi: 10.1073/pnas.89.6.2389. [DOI] [PMC free article] [PubMed] [Google Scholar]
- 32.Blechert S, Brodschelm W, Hölder S, Kammerer L, Kutchan TM, Mueller MJ, Xia ZQ, Zenk M.H. The octadecanoid pathway: signal molecules for the regulation of secondary pathways. Proc Natl Acad Sci Unit States Am. 1995;92(10):4099-4105. doi: 10.1073/pnas.92.10.4099. [DOI] [PMC free article] [PubMed] [Google Scholar]
- 33.Doares SH, Syrovets T, Weiler EW, Ryan CA. Oligogalacturonides and chitosan activate plant defensive genes through the octadecanoid pathway. Proc Natl Acad Sci Unit States Am. 1995;92(10):4095-4098. doi: 10.1073/pnas.92.10.4095 [DOI] [PMC free article] [PubMed] [Google Scholar]
- 34.Wasternack C, Parthier B. Jasmonate-signalled plant gene expression. Trends Plant Sci. 1997;2(8):302-307. doi: 1016/s1360-1385(97)89952.9 [Google Scholar]
- 35.Reymond P, Farmer EE. Jasmonate and salicylate as global signals for defense gene expression. Curr Opin Plant Biol. 1998;1(5):404-411. doi: 10.1016/s1369-5266(98)80264-1. [DOI] [PubMed] [Google Scholar]
- 36.Yu KW, Gao WY, Son SH, Paek KY. Improvement of ginsenoside production by jasmonic acid and some other elicitors in hairy root culture of ginseng (Panax ginseng C. A. Meyer). Vitro Cell Dev Biol Plant. 2000;36(5):424-428. doi: 10.1007/s11627-000-0077-4. [Google Scholar]
- 37.Yu KW, Hahn EJ, Paek KY. Ginsenoside Production by Hairy Root Cultures of Panax ginseng C.A. Meyer in Bioreactors. Proc Int Conf on MAP Eds. J. Bernáth et al. Acta Hortic. 2003;597:237-243. doi: 10.17660/actahortic.2003.597.34. [Google Scholar]
- 38.Ruiz-May E, De-la-Peña C, Galaz-Ávalos RM, Lei Z, Watson BS, Sumner LW, Loyola-Vargas VM. Methyl Jasmonate Induces ATP Biosynthesis Deficiency and Accumulation of Proteins Related to Secondary Metabolism in Catharanthus roseus (L.) G. Hairy Roots. Plant Cell Physiol. 2011;52(8):1401-1421. doi: 10.1093/pcp/pcr086. [DOI] [PubMed] [Google Scholar]
- 39.Gamborg OL, Miller RA, Ojima K. Nutrient requirements of suspension cultures of soybean root cells. Exp. Cell Res. 1968;50(1):151-158. doi: 10.1016/0014-4827(68)90403-5. [DOI] [PubMed] [Google Scholar]
- 40.Kartal M, Kurucu S, Altun L, Ceyhan T, Sayar E, Cevheroğlu S, Yetkin Y. Quantitative Analysis of l-Hyoscyamine in Hyoscyamus reticulatus L. by GC-MS. Turk J Chem. 2003;27:565-569. [Google Scholar]
- 41.Goupy J, Creighton L. Introduction aux plans d’expériences. 3rd ed DUNOD: Paris, France; 2006. [Google Scholar]
- 42.Pasandideh SHR, Niaki STA. Multi-response simulation optimization using genetic algorithm within desirability function framework. Appl Math Comput. 2006;175(1):366-382. doi: 10.1016/j.amc.2005.07.023. [Google Scholar]
- 43.Baş D, Boyaci IH. Modeling and optimization I: Usability of response surface methodology. J Food Eng. 2007;78(3):836–845. doi: 10.1016/j.jfoodeng.2005.11.024. [Google Scholar]
- 44.Mason RL, Gunst RF, Hess JL. Statistical Design and Analysis of Experiments with Applications to Engineering and Science. 2nd ed A John Wiley & Sons publication: NY, USA: 2003. doi: 10.1002/0471458503. [Google Scholar]
- 45.Bezerra MA, Santelli RE, Oliveira EP, Villar LS, Escaleira LA. Response surface methodology (RSM) as a tool for optimization in analytical chemistry. Talanta. 2008;76(5):965-977. doi: 10.1016/j.talanta.2008.05.019. [DOI] [PubMed] [Google Scholar]
- 46.Zayed R, Wink M. Induction of tropane alkaloid formation in transformed root cultures of Brugmansia suaveolens (Solanaceae). Z Naturforsch C. 2004;59(11-12):863-867. doi: 10.1515/znc-2004-11-1216. [DOI] [PubMed] [Google Scholar]


