

SUMMARY
The nuclear RNA exosome is an essential multi-subunit complex that controls RNA homeostasis. Congenital mutations in RNA exosome genes are associated with neurodegenerative diseases. Little is known about the role of the RNA exosome in the cellular response to pathogens. Here, using NGS and human and mouse genetics, we show that influenza A virus (IAV) ribogenesis and growth is suppressed by impaired RNA exosome activity. Mechanistically, the nuclear RNA exosome coordinates the initial steps of viral transcription with RNAPII at host promoters. The viral polymerase complex co-opts the nuclear RNA exosome complex and cellular RNAs en route to 3’ end degradation. Exosome deficiency uncouples chromatin targeting of the viral polymerase complex and the formation of cellular:viral RNA hybrids, which are essential RNA intermediates that license transcription of antisense genomic viral RNAs. Our results suggest that evolutionary arms races have shaped the cellular RNA quality control machinery.
Keywords: epigenetics, RNA surveillance, RNA exosome, EXOSC3 mutation, Influenza virus, viral polymerase, host-pathogen interactions, PROMPT RNA, eRNA, ncRNA, lincRNA, proteomics, NGS, RBM7, NEXT complex, transcription, pause-release, elongation, termination, premature termination, early termination, RNAPII, RNA hybrids, RNA chimeras
Graphical Abstract

eTOC:
The RNA exosome is critical for influenza virus ribogenesis and infectivity, working as a physical platform that coordinates the activity of viral and cellular RNA polymerases
INTRODUCTION
An elaborate quality control system maintains the balance of coding and ncRNA expression in the cell (Tollervey 2015). The RNA exosome plays a key role in regulating essential cellular functions by catabolizing many RNA species in different subcellular compartments via its nucleolytic activity (Lykke-Andersen et al., 2009; Pefanis et al., 2015). RNA exosome co-factors dictate substrate selection (Thoms et al., 2015), a feature likely regulated via multiple mechanisms that depend on cellular identity and environmental cues. In the nucleus, the RNA exosome exerts a quality control mechanism on some mRNAs and many non-coding RNAs by degrading aberrant RNA with unprotected 3’ end termini (Andersen et al., 2013; Lubas et al., 2015). This regulatory mechanism is imparted by the cap-binding proteins (CBC20 and CBC80), which coordinate the recruitment of ARS2 and the NEXT complex-exosome to target genes (Hallais et al., 2013). The interaction between these complexes is dictated by the deposition of RBM7 on nascent transcripts (Lubas et al., 2015) and by spatial proximities around targeted loci. This results in the exosome functioning as a molecular ruler that drives cap-dependent 3’-end maturation mainly at short regulatory RNAs (Hallais et al., 2013). This quality control system occurs co-transcriptionally and provides immediate clearance of many regulatory RNAs (.i.e. enhancer RNAs (eRNAs) and promoter upstream transcripts (PROMPTS)). These targets are mainly detectable in exosome loss-of-functions settings, which allow for monitoring of such an otherwise ‘hidden’ transcriptome (Hilleren et al., 2001; Pefanis et al., 2015). RNA polymerase II (RNAPII) is usually not an essential co-factor for RNA virus transcription; however, in the case of IAV, its activity is essential for viral transcription (Amorim et al., 2007; Ortin and Martin-Benito 2015). IAV transcribes its genome in the nucleus of infected cells (Herz et al., 1981) - a unique feature for some RNA viruses whose ‘evolutionary rationale’ is mysterious. The essentiality of RNAPII activity for viral transcription is due to the fact that the viral polymerase complex cannot transcribe viral genomic RNA by itself. Instead, it requires RNA leaders (primers) that are generated by PA-mediated endonucleolytic cleavage of the 5’ end of capped cellular transcripts in a process called ‘cap-snatching’ (Plotch et al., 1979; Dias et al., 2009; Reich et al., 2014).
As host and viral transcription are essential functions for IAV, the interaction between viral polymerase and RNAPII is not antagonistic but reflects a balance between cellular activity and its usage by the virus (Woolhouse et al., 2002; Marazzi and Garcia-Sastre 2015). These coevolving dynamics between pathogens and hosts can shape cellular functions (Madhani 2013). We report that IAV’s polymerase exploits the quality control mechanisms that lead to the degradation of 3’-end unprotected regulatory RNAs. A physical proximity to the exosome provides a temporal window, in sync with the kinetics of RNAPII, in which the viral polymerase steals the 5’-end caps of otherwise fully degraded RNAs - thus recycling ‘cellular junk RNAs’ into chimeric RNAs that propel the viral life cycle.
Human congenital mutations in many exosome subunits cause impaired exosome activity and are associated with cognitive impairment and neurodegeneration (Wan et al., 2012; Rudnik-Schoneborn et al., 2013; Boczonadi et al., 2014; Giunta et al., 2016). We analyzed the relationship between exosome mutations and the viral life cycle, and show that suppression of viral replication occurs in patient-derived cells, suggesting that exosome hypomorphs might display altered susceptibility to IAV infection. Systems biology approaches support the argument that cellular proteins whose mutation leads to biased susceptibility to disease are often targeted by pathogen-derived proteins (Gulbahce et al., 2012). We provide a theoretical framework for why RNA viruses target genes whose mutations lead to neurodegeneration (Laguette et al., 2011; Paulson et al., 2002; Sakuma et al., 2014; de Chassey et al., 2013; Rice et al., 2009; Dunah et al., 2002; Richards et al., 2007; Rice et al., 2012).
RESULTS
Quantitative Interaction Network of the Influenza Virus Polymerase Subunits
Protein interaction networks have been informative in identifying cellular proteins targeted by viruses that play a key role in virulence and pathogenic life cycles (Shah et al., 2015). Global maps of host-virus protein-protein interactions have been instrumental for identifying binary and complex interactions for validation in more physiological systems (Heaton et al., 2016; Pichlmair et al., 2012; Rozenblatt-Rosen et al., 2012; Shapira et al., 2009). To discover key regulators of IAV biogenesis we mapped the global interaction network of each viral polymerase subunit in A549 cells (Figure S1 and Table S1). We analyzed the PA, PB1 and PB2 subunits of 2 different viral strains (H1N1 and H3N2) that infect humans. We performed this study in the presence and absence of stimulation with exogenous interferon beta, IFNβ. Three biological replicates were completed for each condition to control for reproducibility and specificity of the scored interactions. Epitope-tagged IAV polymerase subunits were expressed alongside FLAG-tagged green fluorescent protein (GFP) or the FLAG-tag alone as negative controls. FLAG-purified bait, along with co-immunoprecipitated host and viral factors, were submitted for protein identification via mass spectrometry. Interaction scores and statistical analyses were optimized to identify unique virus-host interactions (Jager et al., 2011).
This approach identified uniquely engaged host proteins by the polymerase subunits of both strains - in a resting state, as well as in an induced antiviral state (networks summarized in Figure S1 and Table S1). For both viruses, and in both resting and induced conditions, several members of the nuclear RNA exosome, a multisubunit complex with nucleolytic activity towards RNA (Januszyk and Lima 2014;Tollervey 2015), were significantly enriched with the viral polymerase PA subunit (Figure 1A-B), and scored among the most highly engaged cellular protein complexes for both viral strains used (Figure 1C). The interaction between PA and EXOSC10 (Figure 1A-C and Table S1) was further confirmed by immunoprecipitation and immunoblotting (Figure 1D). Overall, these data suggest that the RNA exosome might play a role in the IAV life cycle. As the interaction with the exosome is strain-independent, we decided to focus our attention and perform functional analyses during infection with H1N1 influenza virus.
Figure 1. Proteomics of Influenza Polymerase Subunit PA Reveal Interactions with RNA Exosome.
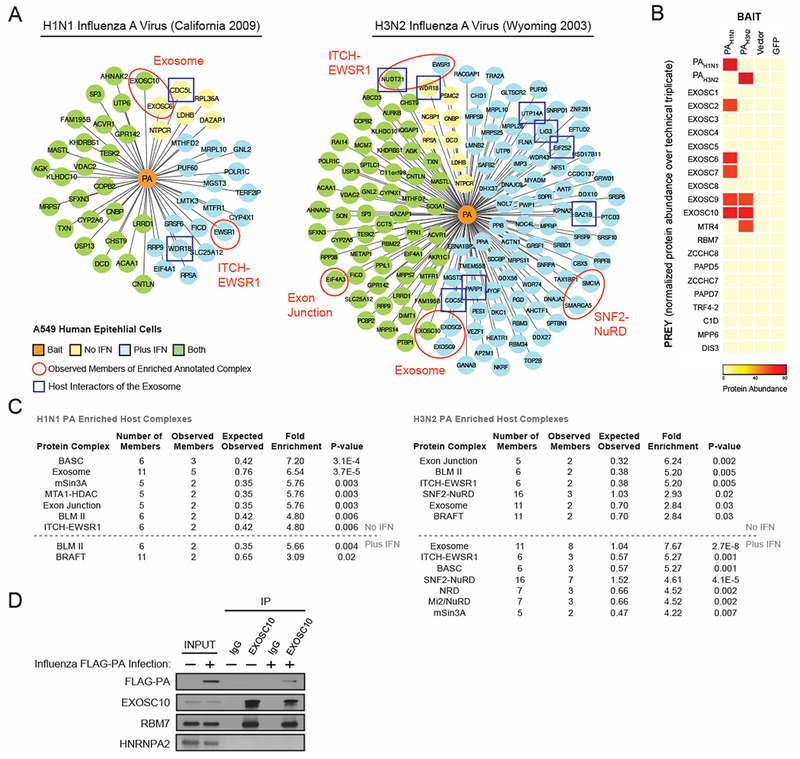
(A) IAV polymerase acidic protein (PA) from (left) H1N1 (California 2009) or (right) H3N2 (Wyoming 2003) with C-terminal 2xStrep tags were expressed in A549 cells and subjected to affinity purification and mass spectrometry (AP-MS) in biological triplicate with and without interferon pre-treatment. Human proteins (prey) significantly enriched after PA purification (orange - bait) relative to vector and GFP-2xStrep control samples are depicted (yellow - without interferon, blue – with interferon, green – both with and without interferon). Known exosome interacting partners are boxed in blue. (B) Heatmap depicting the relative protein abundance of bait proteins and exosome subunits across biological triplicates (without interferon) in the AP-MS samples. (C) Significantly enriched protein complexes from the CORUM database are annotated with pertinent complex members circled and labeled in red in the above networks. (D) A549 cells were infected with a PA-FLAG-tagged IAV for 10 hours. Endogenous EXOSC10 was immunoprecipitated from cell lysate. Co-immunoprecipitated proteins were detected by immunoblot. See also Figure S1 and Table S1
Knockdown of RNA Exosome Core Subunits Reduces Influenza Virus Ribogenesis and Growth.
To identify whether the RNA exosome affects IAV’s life cycle, we transiently knocked down (via small interfering RNA – siRNA) the complex’s two catalytic subunits EXOSC10 and DIS3, along with the essential core subunit EXOSC3, in A549 cells. We then infected knockdown cells, along with control cells (siCTRL), with a H1N1 virus (strain A/Puerto Rico/8/1934), and measured the products of viral transcription (viral mRNA) and replication (genomic RNA). The contribution of the copy RNA (cRNA) was not assessed, as it is a minor constituent of the viral transcript population (Honda et al., 2001). The knockdown of all three subunits resulted in lowered amounts of viral polymerase RNA products at two time points post-infection (Figures 2A-2B,D and S2A-B,D,F) without altering expression of prototypical antiviral genes (Figures 2C and S2C). Overall, these results suggest that the nuclear RNA exosome is, directly or indirectly, responsible for controlling IAV ribogenesis - possibly by promoting viral polymerase activity. To support this, we used an lAV-specific mini-genome assay, which confirmed that disruption of the RNA exosome alters viral transcriptional activity (Figure 2E). To determine if the observed reductions in viral polymerase activity impact viral growth, we utilized an IAV reporter that expresses renilla luciferase. Reduced DIS3 and EXOSC3 expression suppressed reporter virus amplification in both single-cycle (high p.f.u.) and multi-cycle (low p.f.u.) infection settings (Figure 2F). This result was also confirmed by plaque assay (Figure 2G). Notably, EXOSC3- and DIS3-depleted cells supported Herpes Simplex Virus infection (Figure S2E). In summation, these data indicate that the RNA exosome could control viral replication in a cell intrinsic manner and prompted us to use human and mouse genetics to validate our findings.
Figure 2. The RNA Exosome Enhances Influenza Polymerase Activity and Viral Biogenesis.
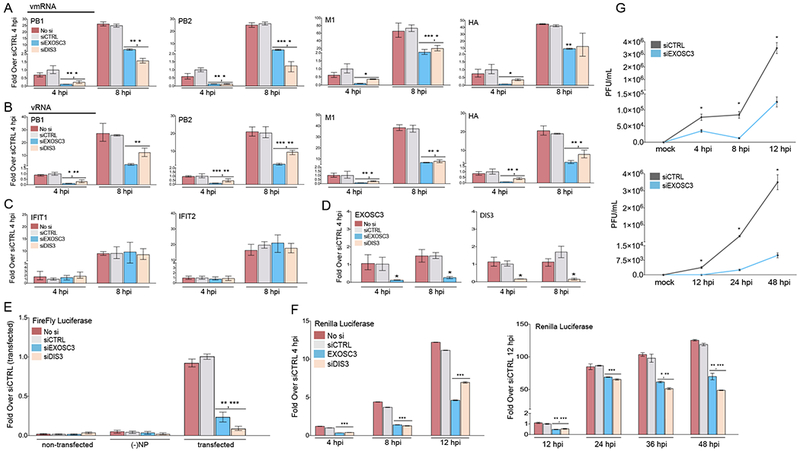
(A-C) qPCR of Influenza viral mRNA (A), RNA (B), and host infection-induced gene mRNA levels (C) in human A549 cells infected with the A/Puerto Rico/8/1934 (PR8) H1N1 strain at the indicated time points. Cells were transfected with siRNAs targeting EXOSC3 or DIS3, a non-targeting siRNA (siCTRL), or left un-transfected (No si).
(D) mRNA expression levels for the targets of the siRNAs used above.
(E) IAV minigenome replicon assay in A549 cells transfected with siRNAs as used above. The viral polymerase transcribed firefly luciferase levels were normalized to co-transfected renilla luciferase levels.
(F) Renilla luciferase expression in A549 cells infected with the IAV PR8-luc at the indicated time points post-infection (single cycle growth – left; multi cycle growth – right). Cells were transfected with siRNAs as used above.
(G) Viral replication growth curves (single cycle – top; multi cycle – bottom) assayed from supernatants harvested from A549 cells infected with PR8 at the indicated time points post-infection. A549 cells were first transfected with siRNAs as used above.
Statistical analyses between datasets were performed with a two-tailed Student’s t-test, adjusted with a Holm-Bonferroni test for sequential comparisons. For all panels, *p<.05, **p<.005, and ***p<.0005. Error bars indicate SD from triplicate experiments.
See also Figure S2
Human Loss-of-Function Mutation in EXOSC3 Impairs Influenza Ribogenesis and Growth
Recently, congenital hypomorphic or loss-of-function missense mutations in the human EXOSC3 allele have been linked to neurodegeneration and cognitive impairment (Wan et al., 2012; Halevy et al., 2014; Eggens et al., 2014; Zanni et al., 2013; Biancheri, et al., 2013; Rudnik-Schoneborn et al., 2013). To detect whether the viral polymerase-RNA exosome axis was functional in human biology, we made use of patient-derived dermal fibroblasts that bear a point mutation in EXOSC3. This mutation partially compromises the exosome’s enzymatic activity (Wan et al., 2012). We verified that mutant EXOSC3 cells express increased levels of prototypical RNA exosome substrates (Figure S3A). We thus infected control cells (heterozygous familial carriers) and EXOSC3-mutant cells with IAV and analyzed cellular and viral RNAs, along with viral polymerase activity and viral growth, in an analogous fashion as done with transient depletion of exosome subunits (see Figure 2). These results (Figure 3A-D) indicate that, upon IAV infection, i) patient-derived cells with a disease-linked EXOSC3 mutation have a lower accumulation of viral RNA (Figure 3A-B), ii) levels of prototypical antiviral genes were unaffected (Figure 3C), and iii) in line with published results, mRNA expression of the wild type and mutated alleles were equal (Figure 3D). As a result of impaired viral ribogenesis (Figure 3A-B) and polymerase activity (Figure 3E), viral growth was suppressed in patient-derived cells (Figure 3F-G). These data correlate the functionality of the RNA exosome to increased viral amplification. Overall, these results provide genetic support for the involvement of the RNA exosome in IAV ribogenesis in humans.
Figure 3. Patient-Derived Cells with EXOSC3 Mutation (Asp132Ala) Suppress Viral Ribogenesis and Growth.
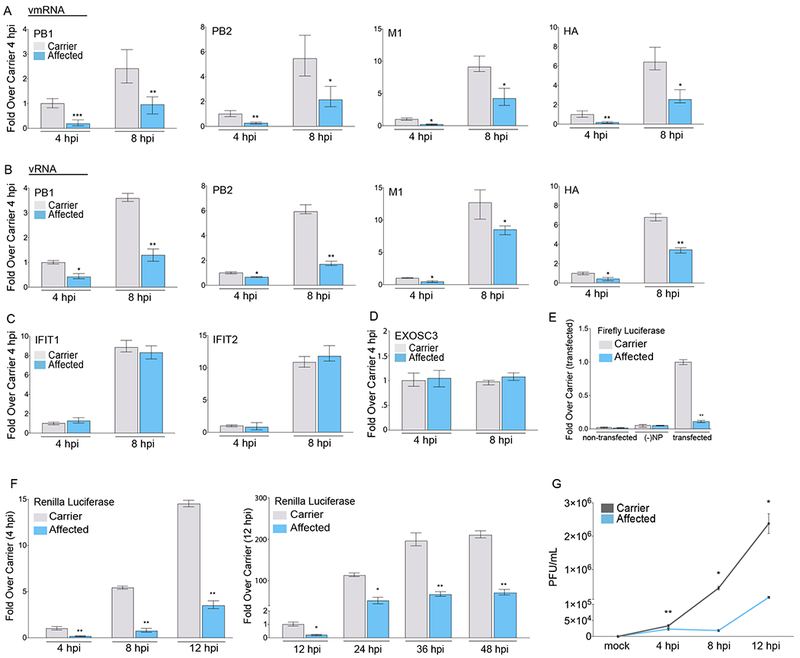
(A-C) qPCR of IAV viral mRNA (A), RNA (B), and host infection-induced gene mRNA levels (C) in primary dermal fibroblasts isolated from patients with pontocerebellar hypoplasia type I (affected; homozygous mutation – Asp132Ala) or family members (carrier; heterozygous mutation). Cells were infected with the PR8 strain at the indicated time points.
(D) mRNA expression levels for EXOSC3.
(E) IAV minigenome replicon assay in patient primary dermal fibroblasts. Viral polymerase transcribed firefly luciferase levels were normalized to co-transfected renilla luciferase levels.
(F) Renilla luciferase expression in patient primary dermal fibroblasts infected with the IAV PR8-luc at the indicated time points post-infection (single cycle growth – left; multi cycle growth – right).
(G) Viral replication growth curve assayed from supernatants harvested from patient primary dermal infected with IAV PR8 at the indicated time points post-infection.
Statistical analyses between datasets were performed with a two-tailed Student’s t-test, adjusted with a Holm-Bonferroni test for sequential comparisons. For all panels, *p<.05, **p<.005, and ***p<.0005. Error bars indicate SD from triplicate experiments.
See also Figure S3
Genetic Ablation of Exosc3 Impairs Influenza Virus Ribogenesis and Growth
Germline genetic deletion of exosome subunits is not achievable in animals. To provide further genetic evidence to our findings, we then performed ex vivo experiments using cells originating from a mouse model that allows for the conditional ablation of Exosc3 (Pefanis et al., 2014). In brief, this mouse strain undergoes inversion of an essential exon upon tamoxifen-induced Cre expression from an engineered Rosa-Ert2Cre locus. We isolated macrophages, B and T cells from these mice to be infected with IAV. Deletion in these cells was optimal, as demonstrated by the expression of GFP, which occurs with Exosc3 exon inversion (Figure 4A and Figure S4A,C). In all cell types, and only in a setting of homozygous ablation of Exosc3, infection with IAV resulted in reduced amounts of viral mRNA (Figure 4B, and Figure S4B,D). These data provide genetic confirmation for the role of the exosome in supporting IAV ribogenesis and growth, as evidenced by suppression of viral replication in cells with impaired exosome activity (Figure S4E). To provide a genome-wide view of our analysis, we performed strand-specific RNA-sequencing in infected Exosc3 heterozygous and homozygous knockout B cells. These cells get infected by IAV but do not allow virus budding. This feature avoids putative confounding effects from multicycle replication kinetics and streamlines the analysis concerning a cell intrinsic role for the exosome. Reduced levels of Exosc3 resulted in less viral polymerase products (Figure 4C and Table S2) and protein expression despite increased levels of prototypical exosome targets (Figure S4F-G). These results phenocopy our findings in human cells with reduced activity of the exosome (Figures 2 and 3). Moreover, as a result of reduced levels of viral replication and of immunostimulatory RNAs generated in Exosc3 ablated cells, a suppression of host genes implicated in the antiviral response was detected (Figure 4D-F). From these results we conclude that a complete deletion of Exosc3 leads to a severe impairment on viral growth. The suppression of the host response is largely the result of impaired viral growth, albeit a role for the RNA exosome in gene-specific activation of virus-induced genes is possible.
Figure 4. Conditional ablation of Exosc3 attenuates Viral Polymerase Activity.
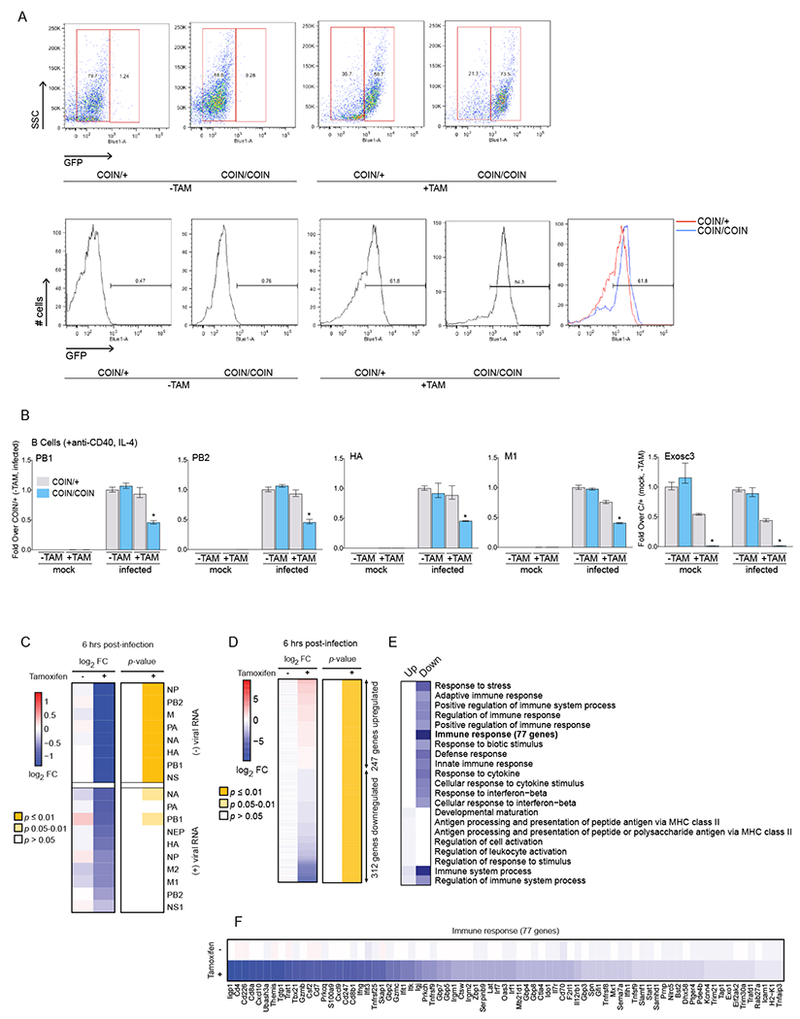
(A) Splenic B cells were isolated and expanded from two mouse types: COIN/+ (conditional heterozygous for Exosc3 depletion), and COIN/COIN (conditional homozygous for Exosc3 depletion). Cells were treated with tamoxifen (+TAM) or DMSO (−TAM) for 3 days to induce the deletion of Exosc3 and inversion of GFP. Top: Fluorescence-activated cell sorting (FACS) displaying GFP conversion with and without tamoxifen treatment at 6 hours post-infection. Bottom: FACS displaying GFP conversion against population scatter.
(B) qPCR of IAV viral mRNA levels in B cells infected with PR8 before (mock) or 6 hours post-infection (infected), along with the control of mRNA expression level for the efficiency of tamoxifen-induced depletion of Exosc3.
Statistical analyses (B) between datasets were performed with a two-tailed Student’s t-test, adjusted with a Holm-Bonferroni test for sequential comparisons. For panel B, *p<.05, **p<.005, and ***p<.0005. Error bars indicate SD from duplicate experiments.
(C) Heat map of average expression changes of positive and negative-stranded viral RNAs in murine splenic B cells in the presence or absence of tamoxifen, and at 6 hours post-infection. Expression changes (left) reflect the log2 fold-change in expression between homozygous (COIN/COIN) and heterozygous (COIN/+) Exosc3 depletion conditions. Corresponding eBayes adjusted and FDR-corrected P-values are shown on the right. Levels of positive-sense viral mRNA are overall an order of magnitude lower than negative-sense viral RNA in this directional RNA-Seq experiment (regardless of the TAM status). It is conceivable that this moderated the extent of the changes we see in vmRNA compared to vRNA levels.
(D) Heat map of average expression changes of differentially expressed cellular genes (FDR q<0.05) between COIN/+ and COIN/COIN in the presence or absence of tamoxifen, and at 6 hours post-infection.
(E) Top-enriched GO biological process categories among the differentially regulated genes from D - key to right.
(F) Heat map of average expression changes for differentially expressed genes in E annotated with the “Immune response” GO biological process term.
The NEXT-Exosome Complex Is a Platform for the Regulation of Influenza Transcription
We then aimed to explore whether, as a result of an infection, the RNA exosome and IAV polymerase are engaged in physical interactions, as suggested by our scored interaction of viral subunits expressed in isolation. To do so, we analyzed the interaction network of FLAG-PA, FLAG-PB2, and FLAG-PB1 H1N1 viruses in infected A549 cells (Heaton et al., 2016). These viruses bear genomic insertions in the 5’ proximal region of their respective segments that encode for a FLAG epitope. These configurations allow the expression of viral proteins to be regulated by the viral life cycle and permit formation of functional viral polymerase complexes (Heaton, et al. 2016). This approach yielded two lines of evidence that support a direct, physical interaction between the viral polymerase complex and the nuclear RNA exosome. First, despite the interaction network being noisier as a result of an active infection, all three polymerase subunits show interactions with exosome core components (Figure S5A). Second, the formation of a functional polymerase complex leads to the isolation of the NEXT accessory complex, which is formed by MTR4, ZCCHC8 and RBM7 and targets the 11-subunit RNA exosome to chromatin (Lubas et al., 2011; Januszyk and Lima 2014; Lubas et al., 2015). This result indicates a physical proximity between the nuclear RNA exosome and the viral polymerase complex and prompted the functional analysis for the role of exosome accessory proteins during infection.
We then analyzed viral RNA levels in A549 cells depleted for RBM7, SKIV2L, or PAPD5 (Januszyk and Lima 2014), the later two being components of the exosome’s other subcellular accessory complexes (Figure S5B-F). Loss of RBM7 was the only condition that phenocopied the loss of the exosome-integral subunits EXOSC3, EXOSC10, and DIS3 (Figure S5E-F). The IAV mini-genome assay confirmed that RBM7 depletion compromised viral transcriptional activity (Figure S5G) but with reduced magnitude compared to EXOSC3 and DIS3 knockdowns (Figure 2E), possibly because of incomplete depletion of chromatin bound RBM7. Depletion of RBM7 also caused impaired viral growth (Figure S5H) and the expected upregulation of exosome ncRNA substrates (Figure S5I). This data, along with the interaction studies of the viral polymerase subunits, indicates that the NEXT-assisted RNA exosome is co-opted by the viral polymerase in the nucleus of infected cells and invited further investigation of the mechanism by which viral polymerase activity could be enhanced by the RNA exosome.
Cap Snatching from RNA Exosome targets
Despite biochemical insight into lAV’s need for RNAPII, very little is known about the mechanisms and host factors that control viral polymerase activity during infection, and how transcription and replication are coordinated. Following viral entry into the target cell, a step-wise process needs to be synched with cellular activities to ensure maximal viral biogenesis: the incoming ribonucleoprotein (RNP) needs to disassemble, allowing the negative sense genomic RNA to be transcribed in the nucleus and then be exported into the cytosol to be translated into viral proteins. At the same time, viral genomic RNA needs to be copied into positive sense copy RNA (cRNA) that needs to be replicated in order to amplify genomes destined for integration into new virions.
Transcription of the viral genome occurs first, and viral replication follows. Replication is strictly dependent on protein synthesis, while viral transcription is not. To understand whether dysfunctional exosome activity affects early transcriptional events, we infected EXOSC3-depleted cells in the presence or absence of cycloheximide (CHX, a protein synthesis blocker). Our analysis shows that a functional RNA exosome is required for productive viral mRNA synthesis, as indicated by the reduction of viral mRNA in CHX-treated cells (Figure 5A-B).
Figure 5. Synthesis of host:viral chimeric RNAs is dependent on the Nuclear RNA Exosome.
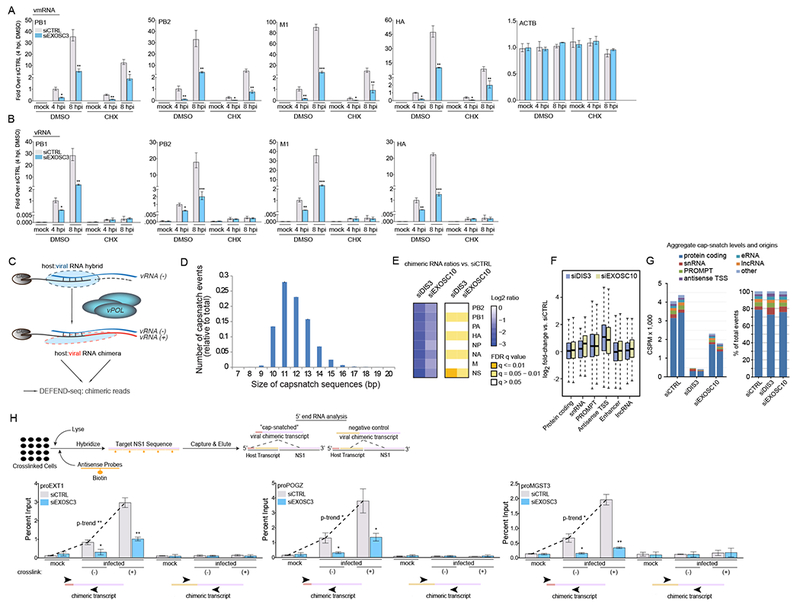
(A-B) qPCR of host mRNA and IAV mRNA (A), and RNA levels (B) in A549 cells infected with PR8 at the indicated time points. Cells were transfected with a siRNA targeting EXOSC3 or a non-targeting siRNA (siCTRL) and treated, at the time of infection, with cycloheximide (CHX) or DMSO.
(C) Schematic of how the synthesis of each IAV mRNA requires the formation of a host:viral RNA hybrid followed by polymerization to generate the (+) strand from the viral (−) strand template. The plus strand (viral mRNA) is then a chimeric RNA formed by a 9-16mer of cellular RNA (see panel D for size distribution).
(D) Length distribution of cellular transcript fragments (snatched RNA) found at the 5’ ends of viral mRNA in PR8 infected A549 cells at 4 hours post-infection.
(E) Heat map of average expression changes of positive-stranded host:viral chimeric mRNAs in A549 cells transfected with siRNAs targeting DIS3 or EXOSC10, or a non-targeting siRNA (siCTRL). Cells were infected with PR8 for 4 hours and expression changes reflect the fold-change ratio between either siDIS3 or siEXOSC10 and siCTRL conditions.
(F) Box plots of the log2 fold-change in expression for different transcript biotypes in uninfected A549 cells transfected with siRNAs as used in E, compared to siCTRL. PROMPTs were defined as transcripts identified between 1 and 2.5 kb upstream of annotated transcription start sites (TSS). Antisense TSS transcripts were identified in a 500 bp region upstream of annotated TSS features.
(G) Left: Cap-snatch per-million events across cellular gene categories in A549 cells (from panel E). Duplicates are shown. Right: Proportional distribution of cap-snatch origins according to cellular transcript biotype.
(H) Top: RNA antisense purification (RAP) experimental strategy for IAV NS1 segment purification. Bottom: RAP-qPCR of host:influenza virus chimeric mRNA levels in A549 cells infected with PR8 before (mock) or 6 hours post-infection (infected). Cells were transfected with a siRNA targeting EXOSC3 or a non-targeting siRNA (siCTRL). At time of collection, cells were cross-linked (+) or left native (−). Primers spanning the internal region of the viral segment and the 5’ or internal portion of the indicated PROMPTs were used to amplify chimeric RNAs.
Statistical analyses between datasets were performed with a two-tailed Student’s t-test, adjusted with a Holm-Bonferroni test for sequential comparisons. For panels A-B, H, *p<.05, **p<.005, and ***p<.0005. Error bars indicate SD from triplicate (A-B) and duplicate experiments (D-H).
See also Figure S5
To gather information about viral mRNA dynamics, how they integrate genome-wide into the cellular transcriptome, and how exosome deficiency affects this process, we designed a NGS-based method called Decap and 5’-end seq (DEFEND-seq). This technique maps all the viral RNA species and cellular biotypes during infection, and can provide a comparative analysis between viral RNA synthesis and the cellular transcriptome. This protocol allows for the identification of the first step in viral mRNA synthesis by mapping which cellular RNAs become part of the chimeric host-virus positive sense RNA transcribed from the negative sense genomic template (Figure 5C). Bioinformatic analysis indicates that, in A549 cells, the host portion of these chimeric RNAs is composed of 9-16nt (Figure 5D) originating from the 5’ RNA end of cellular genes. We then performed DEFEND-seq during infection of A549 cells depleted for EXOSC10 or DIS3. Our result indicates that exosome deficiency leads to a genome-wide suppression of host:virus chimeric transcripts (Figure 5E). Statistical testing indicates that this effect is more pronounced in certain segments. This could be biased because of uneven read coverage due to segment-specific expression kinetics at the time of analysis. Regardless, each segment is essential for infectivity and the viral life cycle and our results indicate that suppression of RNA chimeras leads to reduced viral ribogenesis (Figure S6A). This impairment occured despite the fact that exosome ncRNA substrates are upregulated genome-wide (Figure 5F). Notably, reduction of chimeric transcripts occurred invariantly among the genomic positions (ratio 3:1 coding vs ncRNAs) where capped-RNA are snatched (Figure 5G). The observed cap-snatch reduction at protein coding genes may be a consequence of altering transcription kinetics at ncRNAs, especially antisense and PROMPTS, which could regulate nearby protein coding genes (Kapranov et al., 2007; Xu et al., 2011). Alternatively, a direct effect by the RNA exosome at controlling transcriptional start site RNA (TSS-RNA) and elongation at protein coding genes could be envisaged, similarly to what has been reported for heat shock genes (Andrulius et al., 2002). Overexpression of DIS3, which could be acting alone to generate cap-proximal fragments to be utilized by the virus, did not have a significant impact on chimeric RNA formation or viral ribogenesis, as measured by DEFEND-seq (Figure S6B-C). This result supports the argument that depletion of exosome subunits results in dysregulated activity of the exosome complex, and that the exosome complex regulates chimeric RNA biogenesis.
To independently validate these results, we focused on previously characterized exosome substrate PROMPTS (Andersen et al., 2013) and performed RNA Antisense Purification (RAP) in infected A549 cells depleted for EXOSC3. RAP allows the purification of single stranded, long RNAs by using short complementary biotinylated oligomers. We selected the shortest IAV segment (NS1) which requires less modified oligomers to permit its isolation. We performed RAP in crosslinked and uncrosslinked samples followed by Q-PCR to quantify host:viral chimeric RNAs. From leveraging DEFEND-seq data, the amplification of chimeric transcripts was achieved by using primers that anneal to the 5’-end of validated exosome target PROMPTs (Figure S3B) and to an internal (3’ proximal) region of IAV segment 8 (see schematic in Figure 5H). This analysis indicates that less 5’ ncRNA ends are used to prime viral mRNA synthesis in EXOSC3 depleted cells (Figure 5H). Similar results were achieved by directly measuring chimeric transcripts (without purification via RAP; Figure S6D). Overall, these data indicate that the physical proximity of viral polymerase to the exosome helps increase cap-snatching at noncoding regulatory RNA loci. These data also suggest that absence of the exosome could impair chromatin targeting of the viral polymerase on promoters.
To gain insights on this hypothesis, we performed a comprehensive set of chromatin immunoprecipitation (ChIP) experiments for selected exosome and all viral polymerase subunits during infection with FLAG-PA, FLAG-PB2 and FLAG-PB1 influenza viruses. We analyzed PROMPT genes, as they are well characterized and are distant enough from the transcriptional start site of genes to be mapped without confounding effects from TSS-RNA. To control for specificity of the observed enrichment, we performed this analysis in cells depleted for the same exosome subunit that we immunoprecipitated for. As shown in Figure S6E, at two early time points post-infection, all viral polymerase subunits occupy the promoter region of three PROMPTs. This occupancy is shifted to 3’ end regions in the absence of EXOSC3, DIS3 or EXOSC10; likely as a result of known and conserved defects in RNAPII termination at ncRNAs in the absence of the exosome (Hallais et al., 2013; Lemay et al., 2014). Overall, this analysis supports a model (Figure 6 and see discussion) in which viral polymerase cap-snatching and transcription are integrated into the dynamic regulation of RNAPII and the quality control system that catabolizes regulatory RNAs. The absence of this regulation impairs RNAPII kinetics and affects the timely events that coordinate viral polymerase binding to RNAPII to gain access to promoter-proximal genomic regions. Exosome depletion provides a unique genetic system to selectively change the host transcriptome, and our data indicate that altering ncRNA homeostasis compromises viral transcription/replication kinetics. This supports the idea that the virus may have evolved to co-opt the transcriptome of target cells by adapting into the physiological regulation of gene classes.
Figure 6. Models for the co-transcriptional interference of influenza virus with RNAPII and the RNA Exosome.
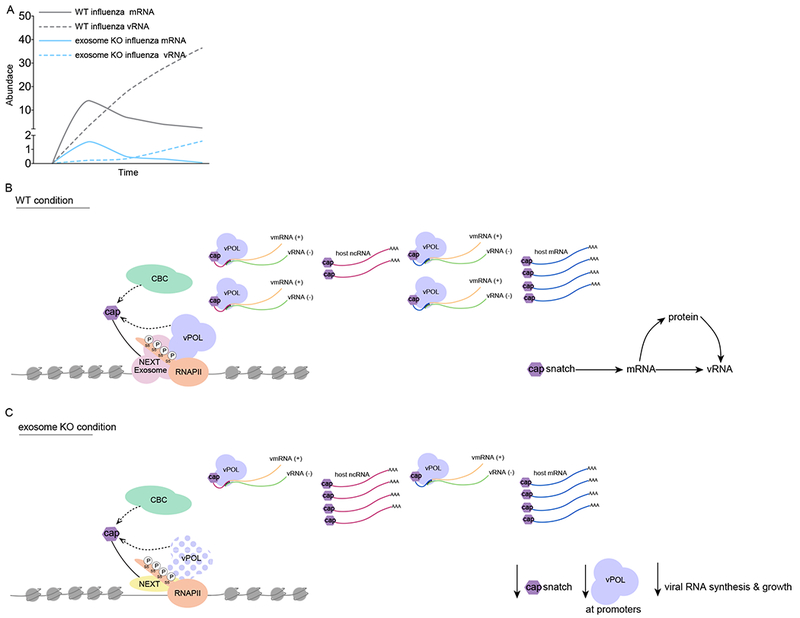
(A) Model displaying IAV RNA and mRNA kinetics over the time of an infection in exosome proficient (gray) and deficient (blue) cells.
(B) IAV cap-snatching model in exosome proficient cells. IAV polymerase (vPOL) accesses host ncRNA and mRNA in kinetic competition with RNAPII- and RNA exosome-dependent capbinding complex (CBC) dynamics, which control productive elongation of mRNA and co-transcriptional maturation at ncRNA loci.
(C) IAV cap-snatching model in exosome deficient cells. IAV polymerase (vPOL) access to host ncRNA and mRNA is impaired because of reduced targeting of the viral polymerase to promoters and by defects in promoter-proximal RNAPII activity. This results in stabilization of ncRNA and TSS-RNA and a concomitant reduction of chimeric transcripts.
See also Figure S6
DISCUSSION
IAV transcription takes place in the nucleus, as the virus must steal 5’ capped RNA from endogenously transcribed mRNAs to be used as primers for viral genome transcription (Plotch et al., 1979). Here, by investigating the transcriptional and replicative activity of IAV we reveal that the viral polymerase complex localizes on chromatin at promoter regions of host genes where an interaction with RNAPII and co-transcriptional regulators provides temporal access to coding and ncRNA loci. This process is temporally and spatially regulated in sync with RNAPII kinetics, and coordinates viral polymerase cap-snatching activity to different host nascent RNAs. Overall, our data inspire a model (see figure 6) supporting novel insights about viral polymerase activity on the host genome: namely, i) the co-transcriptional nature of cap-snatching, ii) the targeting of host ncRNAs and mRNAs, and iii) the importance of nuclear RNA exosome activity in coordinating viral polymerase and RNAPII.
Cap-snatch is co-transcriptional
Our data indicate that ncRNAs that are otherwise rapidly cleared by the exosome are co-transcriptionally accessed by the viral polymerase, in coordination with transcriptional initiation and pause-release, but not after formation of mRNPs. Although one cannot formally exclude that nucleoplasmic cap-snatching could occur (perhaps facilitated by active inhibition of the CBC complex by viral proteins or cellular decapping enzymes), chromatin targeting of viral polymerase via ChIP and the loss of signal in our RAP experiments in uncrosslinked cells favors the fact that the majority of cap snatching occurs on chromatin. In agreement with our results, a recent analysis indicates that the interaction of viral polymerase and RNAPII’s CTD is increased by phosphorylation of the CTD at its serine 5 position - a chemical mark mainly present at transcriptionally engaged RNAPII at promoters (Lukarska, et al. 2017). Moreover, if cap-snatching could occur in the nucleoplasm, it’s hard to imagine why less cap-snatching occurs when more ncRNA caps are available upon exosome deficiency. Overall, we propose that timely and regulated interference with co-transcriptional mechanisms controlling RNAPII transitions occur in a temporal window where viral polymerase acts on its substrates at the same time as they are made, thus on nascent transcripts.
Coding versus ncRNA.
Viral polymerase-host factor interactions and their functional outcomes are shaped by the different regulatory networks that coordinate cellular RNAPII at different gene classes. At protein-coding genes, the temporal window between initiation and RNAPII pause-release maximizes viral polymerase physical proximities and access to capped RNAs. Promoter proximal cap-snatching also ensures the exploitation of RNAPII’s high initiation rate and biogenesis of RNAs (like TSS-RNA) generated as a result of pausing and/or premature termination. Our results hint at the possibility that the RNA exosome controls TSS-RNA at protein coding genes. Despite no global upregulation (as measured by RNA-seq) of protein coding genes in exosome deficient cells, we postulate that transcription of TSS-RNA (and possibly early termination products) could be affected by the exosome. Though further characterization is needed, this mechanism would parallel what happens at ncRNA, where viral polymerase activity needs to be coordinated with exosome activity, deletion of which alters RNAPII kinetics and co-transcriptional maturation of ncRNAs.
Importance of nuclear RNA exosome activity for the influenza virus life cycle.
Our data in human and murine cells indicate that altering ncRNA homeostasis compromises both viral transcription/replication kinetics and growth. Based on these results, we propose that functional interference with the quality control (QC) system at ncRNA promoters allows the viral polymerase to recycle regulatory RNAs, which become substrates to propel viral transcriptional activity and regulate viral growth. Impairment of the exosome differentially impacts RNA biogenesis in a cell type-specific manner based on identity and gene expression programs. Thus our observed effect on viral biogenesis can largely be attributed to the exosome’s QC role rather than the physical identity of its substrates. However, we cannot formally exclude a per-chance scenario where the viral polymerase is directly inhibited by partial complementarity of short ncRNAs to viral segments during replication. Our data provide an initial glimpse of how the transcription and replication machinery of IAV are integrated with the cellular epigenome and transcriptome. Despite our contribution, many unknowns exist, such as: whether there is a physical proximity between IAV transcription and replication machineries, whether cellular factors are required to coordinate their activity, and whether a role exists for viral-derived RNAs (Perez et al., 2010; Umbach et al., 2010) or proteins in coordinating chromatin interactions with RNAPII. Following the explosion of discoveries within the past decade in the field of cellular epigenetics, future work on pathogen-epigenetic interactions is likely to reveal insights to many unanswered questions and instruct novel therapeutic remedies to fight infections.
The broken symmetry hypothesis
Two features of viruses, antagonism and co-option of cellular functions, are key for viral life cycles. Viral antagonism: viruses need to inhibit cellular antiviral defenses. Many host antiviral factors are non-essential and are under selective pressure from antagonizing viral proteins (Daugherty and Malik 2012). When congenital loss-of-function mutations arise in such host genes, individuals become more susceptible to infections (hosts lose - pathogens win). As a result, tissue-specific disease manifests due to either exquisite sensitivity to viral replication or the long-term effect of byproduct inflammation. This could explain the experimental evidence linking congenital mutations of antiviral factors to neurodegeneration (Laguette et al., 2011; Paulson et al., 2002; Sakuma et al., 2014; de Chassey et al., 2013; Rice et al., 2009; Dunah et al., 2002; Richards et al., 2007; Rice et al., 2012). Viral cooption: viruses need to integrate their life cycle with the cell’s, as viruses are obligate parasites. They do so by co-opting, and not inhibiting, essential cellular activities. This is exemplified by the IAV polymerase interacting with host RNAPII and the exosome, as described here. We expect this kind of host-pathogen interaction to be more invariant: the cost to avoid pathogen co-option is too detrimental to the host because escaping mutations result in compromised host fitness. This scenario occurs when congenital hypomorphic mutations arise and both pathogens and hosts lose. The host loss can manifest in developmental or neurodegenerative phenotypes, as more damaging mutations would result in embryonic lethality (survivorship bias).
In support of this, we observed that neurodegeneration-associated genes are preferentially targeted by IAV polymerase (Table S3). Moreover, recent reports have identified novel neurodegeneration-causing mutations in other components of the RNA exosome (EXOSC8) and its nuclear cofactor (RBM7) (Boczonadi et al., 2014; Giunta et al., 2016).
Overall, we hypothesize that viruses target genes mutated in disease, and that disease can be caused by, borrowing a term from physics, host-pathogen ‘symmetry breaking.’
STAR ★METHODS
Contact for Reagent and Resource Sharing
Further information and requests for reagents may be directed to, and will be fulfilled by the Lead Contact Ivan Marazzi (ivan.marazzi@mssm.edu).
Experimental Model and Subject Details
Cell Culture
The following cell lines were originally obtained from the American Type Culture Collection (ATCC): A549 cells (adenocarcinomic human alveolar basal epithelial cells), MDCK cells (Madin-Darby canine epithelial cells), and HEK293T cells (human embryonic kidney 293T). Human primary dermal fibroblasts were obtained from patients harboring mutations in EXOSC3 (carriers – related family members, heterozygous mutations; affected individuals – homozygous mutations manifesting in pontocerebellar hypoplasia type I) (Wan et al., 2012).
Cells were maintained in culture at 37°C with 5% CO2 in Dulbecco’s minimal essential medium (DMEM, Gibco, Life Technologies) supplemented with 2 mM glutamine (Life Technologies), 10% fetal bovine serum (FBS; Hyclone), penicillin (100 U/ml; Life Technologies), and streptomycin (100 μg/ml; Gibco, Life Technologies).
The influenza virus A/PR/8/34 (H1N1 subtype), FLAG-tagged A/PR/8/34 viruses, and luciferase-expressing A/PR8/8/34 virus were propagated in 10-day old specific pathogen-free chicken eggs (Heaton et al., 2013; Heaton et al., 2016) For the later virus, luciferase expression was monitored using Promega’s renilla assay system (E2810). This assay was also used to monitor luciferase expression for HSV-1-Luc (Summers and Leib 2002). Viral infections using the strains described above were performed at a multiplicity of infection (MOI) of 3 and cells were analyzed at different time points as indicated in the figures. For experiments using cycloheximide (ACROS), the chemical was added to cells at 100 ug/mL at the time of the infection.
For viral growth curves, A549 or primary dermal fibroblast cells were infected with influenza virus A/PR/8/34 at a MOI of 5 pfu/cell (single cycle) or a MOI of .05 pfu/cell (multi cycle) and supernatants were collected at the indicated time points. Viral titers were determined by plaque assay on MDCK cells.
Mice
We utilized the conditional system developed by (Pefanis et al., 2014). In short, this mouse model contains a conditional inversion (COIN) allele of Exosc3, allowing conditional ablation of RNA exosome function using tissue-specific or inducible Cre recombinase. Cre-mediated ablation of Exosc3 leads to concomitant green fluorescent protein (GFP) reporter induction from the Exosc3 locus. As such, there are two mouse types: COIN/+ (heterozygous for the conditional ablation), and COIN/COIN (homozygous for the conditional ablation). Spleens were obtained from each mouse type, and single cell suspensions were prepared by pressing the tissues through a 70 μm cell strainer, followed by homogenization using a 20g syringe. B cells were purified by negative selection using a MACS column (Miltenyi Biotec) according to the manufacturer’s instructions, and then resuspended in DMEM at 500,000 cells/mL in 6-well plates. Cells were growth-stimulated with 20 ng/mL IL-4 (404-ML-010, R&D Systems) and 5 ug/mL purified anti-CD40 (Clone HM40-3, BD Biosciences). The B cell-depleted fraction, enriched in T cells, was cultured in DMEM at 500,000 cells/mL in 6-well plates, which were pre-coated for 3 hours with 16 ug of anti-CD3 (Clone 145-2C11, Affymetrix eBioscience) and washed twice with PBS. Both cells types were treated with 100 nM tamoxifen for 3 days in order to induce the conversion event. Bone marrow-derived macrophages (BMDM) were harvested as described (Zhang et al., 2008). 1 million BMDMs were seeded onto 10 cm dishes, and grown in complete RPMI (10 mM L-glutamine, 100 U/mL penicillin, 100 ug/mL streptomycin, 15% fetal bovine serum (10082147, Gibco), 100 U/mL M-CSF (CYT-439, Prospec)) for 7 days. During the last 3 days of culture, cells were treated with 100 nM tamoxifen. BMDMs were then used for concurrent experiments. Inversion efficiency was monitored by both qPCR and fluorescence-activated cell sorting (FACS; using a BD LSRII flow cytometer). Data was analyzed with FlowJo software (Treestar).
Method Details
Transfection with siRNA and DNA constructs
Transfection experiments were performed using the Lipofectamine RNAiMAX transfection reagents according to the manufacturer’s instructions (Invitrogen). Cells were transfected with siRNA pools (all from Dharmacon) targeting the genes encoding human EXOSC3, EXOSC10, DIS3, RBM7, SKIV2L, PAPD5, or with a control non-targeting pool, at a final concentration of 50 nM. Cells were used 48 hours after transfection, and the efficiency of gene knockdown was determined by qPCR or immunoblotting. Transfection of plasmid DNA (non minigenome replicon assay) was achieved using Lipofectamine 3000 (ThermoFisher Scientific).
RT-qPCR
For RNA extraction, cells were homogenized with QIAshredder columns; RNA was extracted using the RNeasy Mini Kit and then treated with the RNase-free DNase kit (all Qiagen). Proteins were also simultaneously recovered from cell lysates by acetone precipitation of the flow-through from RNeasy spin columns, according to manufacturer’s instructions.
cDNA was in vitro transcribed using a High-Capacity cDNA RT Kit (Thermo Fisher Scientific) or a Superscript III First-Strand Synthesis SuperMix (Life Technologies). qPCR was performed using the iTaq Universal SYBR Green One-Step Kit (Bio-Rad) according to manufacturer’s instructions. For amplification of viral RNA (vRNA), cDNA was transcribed with an influenza segment-specific vRNA primer.
Influenza Minigenome Replicon Assay
Human A549 cells (plated in a 6-well format) were co-transfected using Lipofectamine 3000 (ThermoFisher Scientific) with a combination of plasmids expressing the Influenza A/WSN/33 polymerase subunits (PA, PB1, and PB2) and NP (500 ng each plasmid), a viral polymerase reporter plasmid (encoding the firefly luciferase in the negative-sense orientation flanked by the noncoding regions of the segment 8 of A/WSN/33; 500 ng), and a vector constitutively expressing renilla luciferase (500 ng pRL-SV40-Rluc). 36 hours after transfection, luciferase activities were determined using the Dual-Glo luciferase assay system (Promega). As a negative control, cells were transfected with the same reaction mixture but without the plasmid expressing NP. Before analysis, firefly luciferase expression levels were normalized to renilla levels.
Antibodies and Immunoblotting
Antibodies used are as follows: anti–β-actin (Cell Signaling, 3700); anti-EXOSC3 (ab156683; Abcam), anti-EXOSC10 (ab50558; Abcam), anti-DIS3 (PA5-34549; ThermoFisher Scientific), anti-RBM7 (HPA013993, Sigma) anti-HNRNPA2 (Cell Signaling, 9304), anti-FLAG-HRP (A8592; Sigma), anti-influenza A M1 (P. Palese laboratory), and anti-influenza A H1N1 HA (ThermoFisher Scientific, PA5-20713). Gradient gels (4-12%) were used according to the molecular weight of the proteins to be evaluated, followed by wet transfer on polyvinylidene fluoride membranes.
Immunoprecipitation
For the endogenous EXOSC10 IP, 4×10⁷ cells were infected with PA-FLAG-tagged influenza virus for 10 hours at a MOI of 3 (with a parallel mock condition). Cells were collected and lysed in cold lysis buffer (0.2% NP40, 50 mM Tris–HCl pH 7.5; 150 mM NaCI, 1 mM EDTA, protease and phosphatase inhibitors). Douncing and mild sonication (5 cycle 30’ON/OFF with Diagenode Bioruptor) were followed by centrifugation for 30’ at 13K. The supernatant was pre-cleared with dynabeads (No Ab) for 2h at 4C. The pre-cleared extract was split into two IPs (EXOSC10 & IgG) and incubated with antibody-conjugated dynabeads overnight at 4°C. After 6 washes in Wash Buffer (0.2% NP40, 50 mM Tris–HCl pH 7.5, 200 mM NaCl, 1 mM EDTA), 2 extra washes were conducted in no-detergent wash buffer. Immunocomplexes were then eluted in 2× Laemmli sample buffer.
Chromatin Immunoprecipitation (ChIP)
The following antibodies were used: anti-EXOSC3 (ab156683; Abcam), anti-EXOSC10 (ab50558; Abcam), anti-DIS3 (PA5-34549; ThermoFisher Scientific), and anti-IgG (ab171870). ChIP experiments were conducted as described (Lee et al., 2006). For experiments with ChIP followed by qPCR, crosslinking was performed for 10 min. For sonication, we used a refrigerated Bioruptor (Diagenode), which we optimized to generate DNA fragments of approximately 200–1,000 base pair (bp). Lysates were pre-cleared for 2 hours using the appropriate isotype-matched control antibody (rabbit IgG; Abcam). The specific antibodies were coupled with magnetic beads (Dynabeads® M-280 Sheep Anti-Rabbit IgG; ThermoFisher Scientific) overnight at 4°C. Antibody-bound beads and chromatin were then i mmunoprecipitated overnight at 4°C with rotation. For FLAG-ChIP, chromatin was immunoprecipitated using anti-FLAG M2 magnetic beads (Sigma). After washing, reverse crosslinking was carried out overnight at 65°C. After digestion with RNase and proteinase K (Roche), DNA was isolated with a MinElute kit (Qiagen) and used for downstream applications.
RNA Antisense Purification (RAP)
RAP experiments were conducted as described (Engreitz et al., 2015). In short, A549 cells were first crosslinked with disuccinimidyl glutarate (DSG, Pierce) for 45 minutes at room temperature, washed with PBS, and crosslinked again with formaldehyde at 37°C for 10 minutes. Cells were lysed and sonicated to generate a model size distribution (100-4,000 bp). Lysates were precleared with MyONE streptavidin C1 magnetic beads (Invitrogen) before addition of biotynlated ssDNA probes against the influenza NS1 segment. After a 3-hour incubation, MyONE streptavidin C1 magnetic beads were added for an additional 30 minutes to capture the probe-annealed target RNA. After washing, RNA was eluted and subjected to proteinase K treatment and reverse crosslinking for 1 hour at 65°C. RNA was puri fied using the RNA Clean & Concentrator −5 kit (Zymo Research).
Cap-Snatch Sequencing
5 μg of DNase treated RNA was treated with 10U of Tobacco Acid Phosphotase (Epicentre) for 1.5 hrs at 37°C to remove 5’-cap structures. Immedi ately after, 5 μl of freshly prepared Sodium Periodate was added to a final concentration of 500mM to block free 3’-OH ends of RNA. After incubating for 1.5 hrs at 4°C, the reaction was stopped by adding 1/10 volume of 1M L-lysine and incubating at room temperature for an additional 10 minutes. Next, RNA was purified with 1.8× volume of AMPure XP beads (Beckman Coulter), and 10 μM barcoded RNA adapters (5’-GUU CAG AGU UCU ACA GUC CGA CGA UCN NNX XXX XXN NN −3’, Bioo Scientific; N=randomized bases; X=barcode adapter) were ligated to the 5’ ends of RNAs in an overnight (~16-18hrs) reaction at 16°C. Adapter-ligated RNA was purified with 1.8× volume of AMPure XP beads, and up to six 1 μg samples with distinct 5’ adapter barcodes were pooled together. Ribosomal RNAs were removed from pooled samples using the Ribo-Zero Gold rRNA Removal Kit (Human/Mouse/Rat) (Illumina) according to the manufacturer’s protocol prior to cDNA synthesis with 10 μM of a custom 3’ primer (5’-AGA CGT GTG CTC TTC CGA TCT N*N*N*N*N*N*-3’, Bioo Scientific, N*=randomized bases) for 2 minutes at 65°C. Illumina adapters were added by PCR and PCR products were size-selected to a 200-400bp range using BluePippin 2% M1 gels (Sage Scientific). Following library validation on the Agilent Bioanalyzer, samples were sequenced on the Illumina HiSeq 2500 platform in a 100 bp single-end read run format.
Directional RNA-Sequencing
1 μg of DNase-treated RNA was depleted of rRNAs using the Ribo-Zero Gold rRNA Removal Kit (Human/Mouse/Rat) (Illumina) according to the manufacturer’s instructions, and purified post-depletion with 1.6× volume AMPureXP beads. Barcoded directional RNA-Seq libraries were then prepared using the TruSeq Directional Library Prep kit (Illumina), per kit instructions. PCR products were purified with 1.8× volume AMPure XP beads and fragments of 300-500bp were size-selected using BluePippin 2% M1 gels (Sage Scientific). Afterwards, libraries were sequenced on the Illumina HiSeq 2500 platform in a 100 bp single-end read run format.
Influenza Expression Constructs & Global Proteome Map:
The complete coding sequence for each influenza polymerase subunit from H1N1 influenza virus A/California/07/2009 and H3N2 influenza virus A/Wyoming/03/2003 was cloned with a C-terminal 2xStrep tag into the multiple cloning site of pLVX-TetOne-Puro (Clontech) using Gibson assembly. Constructs were sequenced and confirmed to match the following reference sequences for H1N1 and H3N2, respectively: Polymerase acidic protein (PA), NC_026437.1 and EU097812.1; Polymerase basic protein 1 (PB1), NC_026435.1 and CY034114.1; Polymerase basic protein 2 (PB2), NC_026438.1 and EU268224.1. A 2x-strep tag alone or eGFP (coding sequence from GQ404376.1) were cloned analogously.
Lentiviral Transduction and Polyclonal Cell Line Generation
Lentiviruses were generated by co-transfection of 50% confluent HEK293T cells with 5μg of each of the pLVX-TetOne-Puro lentiviral plasmids described above, 3.34μg Gag-Pol packaging construct, and 1.66μg VSV-G envelope (pMD2.G, Addgene) in a 15cm dish using polyJet (SignaGen, according to the manufacturer’s protocol). 48 hours after transfection, the supernatant was collected and replaced. 24 hours after the first harvest, the supernatant was collected again and combined with the first for a total volume of 50mL. Lentiviruses were subsequently precipitated at 4°C by incubation in a final concentration of 8.5% Poly(ethylene glycol) average Mn 6000 (PEG-6000) and 0.3M sodium chloride (NaCl) for 4 hours. Viruses were pelleted at 3500 RPM for 20 minutes in a spinning bucket rotor, suspended in 1mL 1×PBS, and aliquoted for storage at −80°C.
To generate A549 polyclonal cells expressing each polymerase protein, 1 million A549 cells were seeded into T75 flasks and transduced with 250μL lentiviral concentrate. After 48 hours, the media was replaced and supplemented with 1 μg/mL puromycin. Cells were allowed to expand for 72 hours to select for successfully transduced cells. 200,000 cells were subsequently seeded into 6-well plates. One well was treated for 24 hours with 1 μg/mL doxycycline (Dox) to induce transgene expression prior to sample harvest. Cells were lysed in 2.5× Laemmeli sample buffer for immunoblot confirmation of inducible polymerase subunit expression (see Immunoblot protocol). Validated stocks were frozen in FBS +10% dimethyl sulfoxide (DMSO) and stored in liquid nitrogen for later use.
Immunoprecipitation of Viral Proteins
The eight polyclonal A549 cell lines generated above (six influenza virus baits, a vector control and an eGFP-expressing control) were thawed and each plated into six 15cm dishes. At 85% confluency, roughly 24 hours before harvest, the cells were treated with 1μg/mL Dox. 12 hours before harvest, 3 plates of each bait were treated with 1000U/mL interferon (Universal Type I IFN, PBL Assay Science). Prior to lysis, each plate of cells was rinsed with cold 1× phosphate buffered saline (PBS) and the cells removed from the plate surface by physical scraping in cold PBS. Cells were pelleted at 300×g for 5 minutes in a spinning bucket rotor and the supernatant removed. Each pellet was suspended in 1mL cold lysis buffer [50mM Tris-HCl, pH7.4, 150mM NaCI, 1mM EDTA, 0.5% nonyl phenoxypolyethoxylethanol (NP-40), 1× protease inhibitor cocktail (EDTA-free, Roche), 1× phosphatase inhibitor cocktail (PhosStop, Roche)] and rotated at 4°C for 30 minutes. To assist with lysis of the nuc lear compartment, the lysates were frozen at −80°C and thawed prior to immunoprecipitation.
Lysates were cleared of cellular debris by centrifugation at 3500×g for 20 minutes. 50μL of cleared supernatant was added to 50μL 2.5× Laemmeli Reducing Sample Buffer as an ‘Input’ sample and heated at 95°C for 20 minutes. The remai ning 950μL cleared supernatant was added to 550μL IP buffer (50mM Tris-HCl, pH7.4, 150mM NaCl, and 1mM EDTA) containing 20μL equivalent bead volume of Strep-Tactin Sepharose beads (IBA Lifesciences). Affinity tag binding proceeded with rotation at 4°C for 2 hours. Bea ds were pelleted by gentle centrifugation at 300×g for 3 minutes. 50μL of cleared supernatant was again removed to 50μL 2.5× Laemmeli Reducing Sample Buffer as an ‘Unbound Flow Through’ sample and heated at 95°C for 20 minutes. The remaining supernatant was discarded. The beads were washed twice in IP buffer containing 0.05% NP-40 and twice in IP buffer with no detergent. A 1mL syringe with 27-gauge needle was used to remove the last wash entirely.
Preparation of Peptides for Mass Spectrometry
Streptactin purified proteins were reduced and alkylated on beads with 20 uL reduction-alkylation buffer [50mM Tris-HCl, pH8.0, 2M Urea, 1mM Dithiothreitol (DTT), 3mM iodoacetamide] and incubated in the dark for 45 minutes with gentle shaking. An additional 3mM DTT was added to quench the reaction, and proteins were digested with 0.75μg trypsin (Invitrogen). Digests were allowed to proceed overnight at 37C.
The next day, the beads were pelleted by centrifugation at 300×g for 3 minutes. The peptide containing supernatant was removed using a gel-loading tip and transferred to a new tube. Formic acid was added to a final concentration of 1% to acidify the peptides. Peptides were desalted using Agilent OMIX C18 10μL tips according to the manufacturer’s protocol with the following modifications. Briefly, tips were conditioned with 50% acetonitrile, 0.1% formic acid and then equilibrated by two rinses with 0.1% formic acid. Peptides were bound by repeated pipetting, rinsed twice in 0.1% formic acid, and eluted in 50% acetonitrile. A second elution in 90% acetonitrile was used to ensure complete recovery. Peptides were dried under vacuum centrifugation and suspended in 12μL of 3.0% acetonitrile, 0.1% formic acid.
Protein Identification by Liquid Chromatography Tandem Mass Spectrometry (LC MS/MS)
Digested peptides were subjected to LC-MS/MS analysis using an Easy-nLC 1000 coupled to a dual-pressure linear ion trap (Velos Pro) Orbitrap Elite mass spectrometer (Thermo Fisher Scientific, San Jose, CA). Online LC separation was performed using a 75pm × 25cm fused silica IntegraFrit capillary packed with 1.9pm Reprosil-Pur C18 AQ reversed-phase resin (Dr. Maisch-GmbH). Peptides were eluted by a gradient of 5% to 30% acetonitrile in 0.1% formic acid in 110 minutes delivered at a flow rate of 300 nL/minute. For each cycle, one full MS scan (150-1500 m/z, resolution of 120,000) in the Orbitrap was followed by 20 data-dependent MS/MS scans fragmented by normalized collision energy (setting of 35%) and acquired in the linear ion trap. Target ions already acquired in MS/MS scans were dynamically excluded for 20 seconds.
Raw MS files were analyzed by MaxQuant (Cox and Mann 2008) version 1.3.0.3 and MS/MS spectra searched by the Andromeda search engine (Cox et al., 2011) against a database containing reviewed SwissProt human and influenza protein sequences (20,226 total) (UniProt Consortium 2015). All runs for a given bait were analyzed simultaneously to maximize the “match between runs” algorithm available on Maxquant. Multiplicity was set to 1 (as recommended for label free experiments) and a false discovery rate imposed to 0.01 for peptide and protein identification. Normalization of raw peptide intensities and protein level abundance inference were calculated using the linear mixed-effects model built into the MSstats R package version 3.3.10 (Choi et al., 2014). SAINTq (Teo et al., 2016) was used to assign scores to bait–prey interactions against the negative controls (GFP and empty vector) using peptide intensities as the input.
Proteins that appeared in only a single biological replicate were excluded from further analysis, as were proteins that appeared in more than 7 samples (i.e. appeared reproducibly with more than one bait with one). Proteins were then ranked by SAINTq score. All proteins with a SAINTq score > 0.3 are depicted in network format with each node representing a significantly enriched prey (visualized with Cytoscape (Shannon et al., 2003)).
Quantification and Statistical Analysis
Quantitative PCR assays:
The statistical significance of all pairwise comparisons in qPCR assays’ change in cycling threshold (ΔCT values was determined with a two-tailed Student’s t test under the assumption of equal variances between groups. We did not find significant differences (false discovery rate, q < 0.05) between contrast groups in Levene’s tests of equality of variances, or departures from normality as assessed by Shapiro-Wilk tests. A Holm-Bonferroni test was used for multi-comparison sequential corrections. Data are shown +-SD.
Complex enrichment scoring.
The Fold Complex Enrichment (FCE) was calculated to determine whether specific complexes were enriched among prey for a given bait. The FCE is the number of prey proteins detected for a particular complex over the number expected by random sampling of the A549 proteome. To assess whether the FCE was statistically significant, p-values were computed using a hypergeometric test. Only complexes with at least five 5 members (Num) were considered for which we had to have identified at least 2 members (Obs). The fold enrichment observed relative to expected (Exp) was calculated alongside the fold enrichment observed in the mock samples (eGFP and vector). Complexes found to be enriched in the mock samples were removed from further analysis and the top seven complexes with FCE scores greater than 2.5 were reported alongside the p-values. Complex members that score singly as significant interactors were circled in red alongside the name of the associated complex. As complex enrichment takes into account the complete prey universe for a bait, not all complexes have a corresponding subunit found significant when considered singly.
Disease-intersection analysis:
Enrichment analysis of disease-associated genes was performed using gProfileR (Reimand et al., 2016) against the OMIM database. We used the set of proteins uniquely identified for each virus protein in the AP-MS experiment (not found in the negative controls, GFP and empty vector). The searched lists consisted of 380, 107, and 56 genes for PA, PB1, and PB2 respectively. Only diseases significantly enriched (p-value < 0.05) are shown. Disease-genes annotated as “neurodegenerative” are highlighted.
Identification of cellular transcript origins for capsnatch events:
To uniformly identify host- and virus-derived 5’ RNA sequences, full-length adapter-trimmed reads were mapped to the human (hg19) and viral (IAV) reference genomes using TopHat 2.0.12 (Trapnell et al., 2009) and Bowtie 1.0.1 (Langmead et al., 2009) with the corresponding gene annotations (Gencode GRCh37/V19-Ensembl74 for the human genome). To identify hybrid viral mRNA sequences, the first 20 nucleotides of each read were first masked prior to mapping to viral reference genomes using the same strategy. Hybrid reads were then identified as those masked reads mapping to the positive strand of a viral genome segment, with a start coordinate less than 20bp from the segment start. For comparison of capsnatched sequences to human 5’ RNA sequences and attribution of capsnatch origin, a dictionary of unique human RNA 5’ ends (9-16bp) and their genes of origin was first built based on full-length reads mapped to the human genome. Each mapped read was associated to the closest gene transcription start site (TSS) up to a maximum distance of 500bp. Host-derived capsnatch sequences were then matched to the host 5’ end sequence dictionary and assigned a gene and TSS of origin.
Differential gene expression analysis of RNA-Seq data:
After adapter removal with cutadapt (Martin 2011) and base quality trimming to remove 3’ read sequences if more than 20 bases with Q < 20 were present, paired-end reads were mapped to the mouse (mm10) reference genome using STAR (Dobin et al., 2013) and strand-specific cellular and viral gene count summaries were generated using featureCounts (Liao et al., 2014). Raw read counts were combined into a numeric matrix, with genes in rows and experiments in columns, and used as input for differential gene expression analysis with the Bioconductor Limma package (Ritchie et al., 2015) after removing genes with less than 50 total reads across all samples or of less than 200 nucleotides in length. Normalization factors were computed on the filtered data matrix using the weighted trimmed mean of M-values (TMM) method, followed by voom (Law et al., 2014) mean-variance transformation in preparation for Limma linear modeling. Pairwise comparisons were performed between treatment groups and eBayes adjusted P-values were corrected for multiple testing using the Benjamin-Hochberg (BH) method and used to select genes with significant expression differences (q<0.05).
Data and Software Availability
Data Resources: GEO:GSE96677
Supplementary Material
Figure S1. Global interactome of influenza virus polymerase subunits PB1 and PB2. Related to Figure 1
Influenza virus polymerase basic protein 1 (PB1) and polymerase basic protein 2 (PB2) from (A) H1N1 (California 2009) or (B) H3N2 (Wyoming 2003) were cloned with C-terminal 2xStrep tags, expressed in A549 cells with and without interferon pre-treatment (12 hours), and subjected to affinity purification and mass spectrometry (AP-MS) in biological triplicate alongside vector and GFP-2xStrep controls. Human proteins (prey) significantly enriched after Strep purification (orange - bait) relative to vector and GFP-2xStrep control samples are depicted (yellow - without interferon, blue – with interferon, green – both with and without interferon). Known exosome interacting partners are boxed in blue.
Table S3. Disease intersection analyses
Table S4. Related to STAR methods.
Figure S2. Loss of function of RNA exosome subunits suppresses influenza virus ribogenesis and growth. Related to Figure 2
(A-C) Influenza viral mRNA levels (A), viral RNA levels (B), and host infection-induced target gene mRNA levels (C) (measured by qPCR) in human A549 cells infected with the A/Puerto Rico/8/1934 H1N1 strain at the indicated time points. Cells were transfected with silencing RNAs (siRNA) targeting EXOSC10, a non-targeting siRNA (siCTRL), or left un-transfected (No si).
(D) mRNA expression (measured by qPCR) and protein levels for the targets of the siRNAs used above.
(E) Renilla luciferase expression in A549 cells infected with a luciferase expressing HSV-1 virus at the indicated time points post-infection. Cells were transfected with silencing RNAs (siRNA) targeting EXOSC3 or DIS3, a non-targeting siRNA (siCTRL), or left un-transfected (No si).
(F) Protein levels for the targets of the siRNAs used in Figure 2 – DIS3 and EXOSC3, along with ACTB control.
Statistical analyses between datasets were performed with a two-tailed Student’s t-test, adjusted with a Holm-Bonferroni test for sequential comparisons. For all panels, *p<.05, **p<.005, and ***p<.0005. Error bars indicate SD from triplicate experiments.
Figure S3. EXOSC3 loss of function increases PROMPT RNA levels in different cell types. Related to Figure 3
(A-B) PROMPT RNA levels (measured by qPCR) in primary dermal fibroblasts isolated from patients with pontocerebellar hypoplasia type I (A: carrier and affected) and human A549 cells (B) infected with the A/Puerto Rico/8/1934 H1N1 strain at the indicated time points. For B, cells were transfected with silencing RNAs (siRNA) targeting EXOSC3, a non-targeting siRNA (siCTRL), or left un-transfected (No si).
Statistical analyses between datasets were performed with a two-tailed Student’s t-test, adjusted with a Holm-Bonferroni test for sequential comparisons. For all panels, *p<.05, **p<.005, and ***p<.0005. Error bars indicate SD from triplicate experiments.
Figure S4. Conditional ablation of Exosc3 in both T cells and Bone Marrow Macrophages suppresses influenza polymerase activity. Related to Figure 4.
(A) Splenic T cells were isolated from two mouse types: COIN/+ (conditional heterozygous for Exosc3 depletion), and COIN/COIN (conditional homozygous for Exosc3 depletion). T cells were stimulated with anti-CD3, and treated with tamoxifen (+TAM) or DMSO (−TAM) for 3 days to induce the conditional depletion of Exosc3 and inversion of GFP. Left: Fluorescence-activated cell sorting (FACS) displaying GFP conversion (per # of cells) with and without tamoxifen treatment at 6 hours post-infection. Right: Fluorescence-activated cell sorting (FACS) displaying GFP conversion against population scatter with and without tamoxifen treatment at 6 hours post-infection.
(B) Influenza viral mRNA levels (measured by qPCR) in T cells infected with the A/Puerto Rico/8/1934 H1N1 strain before (mock) and 6 hours post-infection (infected), and control of mRNA expression level for the efficiency of tamoxifen-induced depletion of Exosc3.
(C) Bone marrow macrophages (BMDM) were isolated from the two mouse types listed above. BMDMs were stimulated with M-CSF for 7 days, and treated with tamoxifen (+TAM) or DMSO (−TAM) for the last 3 days to induce the conditional depletion of Exosc3 and inversion of GFP. Left: Fluorescence-activated cell sorting (FACS) displaying GFP conversion (per # of cells) with and without tamoxifen treatment at 6 hours post-infection. Right: Fluorescence-activated cell sorting (FACS) displaying GFP conversion against population scatter with and without tamoxifen treatment at 6 hours post-infection.
(D) Influenza viral mRNA levels (measured by qPCR) in BMDMs infected with the A/Puerto Rico/8/1934 H1N1 strain before (mock) and 6 hours post-infection (infected), and control of mRNA expression level for the efficiency of tamoxifen-induced depletion of Exosc3.
(E) Viral replication growth curves (single cycle – left; multi cycle – right) assayed from supernatants harvested from Exosc3 conditionally-ablated BMDMs infected with the influenza strain A/Puerto Rico/8/1934 H1N1 at the indicated time points post-infection.
(F) PROMPT RNA levels (measured by qPCR) in Exosc3 conditionally-ablated B cells infected with the A/Puerto Rico/8/1934 H1N1 strain at the indicated time points.
(G) Protein levels of influenza (HA, M1) and host proteins (Exosc3, Actb) in Exosc3 conditionally-ablated B cells infected with the A/Puerto Rico/8/1934 H1N1 strain at 6 hpi.
Statistical analyses between datasets were performed with a two-tailed Student’s t-test, adjusted with a Holm-Bonferroni test for sequential comparisons. For panels B, D, E-F, *p<.05, **p<.005, and ***p<.0005. Error bars indicate SD from duplicate experiments.
Figure S5. RBM7 suppression impairs viral polymerase activity. Related to Figure 5
(A) A549 cells were infected with H1N1 PA/PB1/PB2-FLAG-tagged influenza viruses for 10 hours. In Virio heatmap depicts the relative protein abundance of bait proteins and exosome subunits across technical duplicates in the AP-MS samples reported in (Heaton et al., 2016).
(B-C) Influenza viral mRNA levels (B), and host infection-induced target gene mRNA levels (C) (measured by qPCR) in human A549 cells infected with the A/Puerto Rico/8/1934 H1N1 strain at the indicated time points. Cells were transfected with silencing RNAs (siRNA) targeting SKIV2L (a RNA helicase, and member of the cytoplasmic superkiller-exosome targeting complex) or PAPD5 (a non-canonical poly(A) RNA polymerase, and member of the nucleolar TRAMP-exosome targeting complex), a non-targeting siRNA (siCTRL), or left un-transfected (No si).
(D) mRNA expression levels (measured by qPCR) for the targets of the siRNAs used above.
(E) Influenza viral mRNA levels (measured by qPCR) in human A549 cells infected with the A/Puerto Rico/8/1934 H1N1 strain at the indicated time points. Cells were transfected with a silencing RNA (siRNA) targeting RBM7, a non-targeting siRNA (siCTRL), or left un-transfected (No si).
(F) mRNA expression (measured by qPCR) and protein levels for the targets of the siRNAs used above.
(G) Influenza minigenome replicon assay in A549 cells transfected with a siRNA targeting RBM7, a non-targeting siRNA (siCTRL), or left un-transfected (No si). The viral polymerase transcribed firefly luciferase levels were normalized to co-transfected renilla luciferase levels.
(H) Viral replication growth curves (single cycle – top; multi cycle – bottom) assayed from supernatants harvested from human A549 cells infected with the influenza strain A/Puerto Rico/8/1934 H1N1 at the indicated time points post-infection. A549 cells were first transfected with a silencing RNA (siRNA) targeting RBM7 or a non-targeting siRNA (siCTRL).
(I) Exosome-target mRNA levels (measured by qPCR) in human A549 cells infected with the A/Puerto Rico/8/1934 H1N1 strain at the indicated time points. Cells were transfected with a silencing RNA (siRNA) targeting RBM7, a non-targeting siRNA (siCTRL), or left un-transfected (No si). Directionality of eRNAs: (−) negative sense, (+) positive sense. Promoter upstream transcripts – PROMPTs (top panel); enhancer RNAs – eRNAs (bottom panel).
Statistical analyses between datasets were performed with a two-tailed Student’s t-test, adjusted with a Holm-Bonferroni test for sequential comparisons. For panels B-I, *p<.05, **p<.005, and ***p<.0005. Error bars indicate SD from triplicate experiments (B-I).
Figure S6. Control experiments related to figure 6
(A) Heat map of average expression changes of negative (vRNA - bottom) and positive-stranded (cRNA - top) viral RNAS in A549 cells infected with the A/Puerto Rico/8/1934 H1N1 strain at 4 hours-post infection. Cells were transfected with silencing RNAs (siRNA) targeting DIS3 or EXOSC10, or a non-targeting siRNA (siCTRL). Expression changes reflect the fold-change ratio between either siDIS3 or siEXOSC10 and siCTRL conditions.
(B) Heat map of average expression changes of positive host:viral chimeric (mRNA – left), negative (vRNA - right), and positive-stranded (cRNA - middle) RNAs in A549 cells infected with the A/Puerto Rico/8/1934 H1N1 strain at 6 hours-post infection. Cells were transfected with an empty vector (EV) or a vector expressing human DIS3 (DIS3-OE). Expression changes reflect the fold-change ratio between DIS3-OE and EV conditions. Protein levels of overexpressed DIS3 and ACTB control to right.
(C) PROMPT copy-per-million (CPM) in uninfected A549 cells transfected with an empty vector (EV) or a vector expressing human DIS3 (DIS3-OE)
(D) Host:influenza chimeric mRNA levels in human A549 cells infected with the A/Puerto Rico/8/1934 H1N1 strain at the indicated time points. Cells were transfected with a silencing RNA (siRNA) targeting EXOSC3, DIS3, EXOSC10, a non-targeting siRNA (siCTRL), or left untransfected (No si).
(E) ChIP-qPCR analysis of the PB1, PB2, or PA subunit of influenza polymerase and endogenous EXOSC3, DIS3, or EXOSC10 at endogenous PROMPTs (top: EXT1, middle: POGZ, bottom: MGST3). Human A549 cells were infected with H1N1 PBl/PB2/PA-FLAG-tagged viruses at the indicated time points. Cells were transfected with silencing RNAs (siRNA) targeting EXOSC3, DIS3, EXOSC10, or a non-targeting siRNA (siCTRL). For each panel, protein occupancies are shown at the 5’-end (left side of dashed line), and the 3’-end (right side of dashed line) of the respective PROMPT loci.
Statistical analyses between datasets were performed with a two-tailed Student’s t-test, adjusted with a Holm-Bonferroni test for sequential comparisons. For all panels, *p<.05, **p<.005, and ***p<.0005. Error bars indicate SD from triplicate (D) and duplicate experiments (A-C,E).
Highlights:
The nuclear RNA exosome coordinates viral polymerase and RNAPII transcription
The nuclear RNA exosome enhances host-viral RNA hybrids, chimeras and viral ribogenesis
RNA exosome loss-of-function in epithelial and immune cells impairs viral growth
Viruses target genes whose mutations lead to disease
ACKNOWLEDGEMENTS
We thank G. Metreveli for help with virus propagations, D. Leib and S. Tripathi for sharing reagents, the Genomics and Mouse facility at Icahn School of Medicine at Mount Sinai, B. Greenbaum for discussion about virus-host interactions, the Global Health and Immerging Pathogens Institute (GHEPI) at Mount Sinai, and the entire Marazzi Lab team. I.M. thanks Dr. Charney for support. U.B. is supported by NIH grants 2RO1AI099195 and DP2 2OD008651. A.G.S, H.v.B., R.A., and I.M. are partially supported by HHSN272201400008C - Center for Research on Influenza Pathogenesis (CRIP) a NIAID-funded Center of Excellence for Influenza Research and Surveillance (CEIRS). I.M. is supported in part by The Department of Defense W911NF-14-1-0353 (to I.M.) and by NIH grant 1R56AI114770-01A1 (to I. M.). I.M. and H.v.B. are supported by NIH grant 1R01AN3663134. I.M., R.A., S.C., N.K., A.G.S. are all supported by the NIH grant U19AI106754 FLUOMICS.
Footnotes
Publisher's Disclaimer: This is a PDF file of an unedited manuscript that has been accepted for publication. As a service to our customers we are providing this early version of the manuscript. The manuscript will undergo copyediting, typesetting, and review of the resulting proof before it is published in its final citable form. Please note that during the production process errors may be discovered which could affect the content, and all legal disclaimers that apply to the journal pertain.
SUPPLEMENTAL INFORMATION
Supplemental Information includes six figures and four tables.
REFERENCES
- Amorim MJ, Read EK, Dalton RM, Medcalf L, Digard P (2007). Nuclear export of influenza A virus mRNAs requires ongoing RNA polymerase II activity. Traffic 8, 1–11. [DOI] [PubMed] [Google Scholar]
- Andersen PR, Domanski M, Kristiansen MS, Storvall H, Ntini E, Verheggen C, Schein A, Bunkenborg J, Poser I, Hallais M, Sandberg R, Hyman A, LaCava J, Rout MP, Andersen JS, Bertrand E, Jensen TH (2013). The human cap-binding complex is functionally connected to the nuclear RNA exosome. Nat. Struct. Mol. Biol 20, 1367–76. [DOI] [PMC free article] [PubMed] [Google Scholar]
- Andrulius ED, Werner J, Nazarian A, Erdjument-Bromage H, Tempst P, Lis JT (2002). The RNA processing exosome is linked to elongating RNA polymerase II in Drosophila. Nature 420, 837–41. [DOI] [PubMed] [Google Scholar]
- Biancheri R, Cassandrini D, Pinto F, Trovato R, Di Rocco M, Mirabelli-Badenier M, Pedemonte M, Panicucci C, Trucks H, Sander T, et al. (2013). EXOSC3 mutations in isolated cerebellar hypoplasia and spinal anterior horn involvement. J. Neurol. 260, 1866–70. [DOI] [PubMed] [Google Scholar]
- Boczonadi V, Muller JS, Pyle A, Munkley J, Dor T, Quartararo J, Ferrero I, Karcagi V, Giunta M, Polvikoski T, Birchall D, Princzinger A, Cinnamon Y, et al. (2014). EXOSC8 mutations alter mRNA metabolism and cause hypomyelination with spinal muscular atrophy and cerebellar hypoplasia. Nat. Commun 5, 4287. [DOI] [PMC free article] [PubMed] [Google Scholar]
- Choi M, Chang CY, Clough T, Broudy D, Killeen T, MacLean B, Vitek O (2014). MSstats: an R package for statistical analysis of quantitative mass spectrometry-based proteomic experiments. Bioinformatics 30, 2524–6. [DOI] [PubMed] [Google Scholar]
- Cox J, Mann M (2008). MaxQuant enables high peptide identification rates, individualized p.p.b.-range mass accuracies and proteome-wide protein quantification. Nat. Biotechnol 26, 1367–72. [DOI] [PubMed] [Google Scholar]
- Cox J, Neuhauser N, MIchalski A, Scheltema RA, Olsen JV, Mann M (2011) Andromeda: a peptide search engine integrated into the MaxQuant environment. J. Proteome Res 10, 1794–805. [DOI] [PubMed] [Google Scholar]
- Daugherty MD, Malik HS (2012). Rules of engagement: molecular insights from host-virus arms races. Annu. Rev. Genet 46, 677–700. [DOI] [PubMed] [Google Scholar]
- de Chassey B, Aublin-Gex A, Ruggieri A, Meyniel-Schicklin L, Pradezynski F, Davoust N, Chantier T, Tafforeau L, Mangeot PE, Ciancia C, et al. (2013). The interactomes of influenza virus NS1 and NS2 proteins identify new host factors and provide insights for ADAR1 playing a supporting role in virus replication. PLoS Pathog 9. [DOI] [PMC free article] [PubMed] [Google Scholar]
- Dias A, Bouvier D, Crepin T, McCarthy AA, Hart DJ, Baudin F, Cusack S, Ruigrok RW (2009). The cap-snatching endonuclease of influenza virus polymerase resides in the PA subunit. Nature 458, 914–8. [DOI] [PubMed] [Google Scholar]
- Dobin A, Davis CA, Schlesinger F, Drenkow J, Zaleski C, Jha S, Batut P, Chaisson M, Gingeras TR (2013). STAR: ultrafast universal RNA-seq aligner. Bioinformatics 29, 15–21. [DOI] [PMC free article] [PubMed] [Google Scholar]
- Dunah AW, Jeong H, Griffin A, Kim YM, Standaert DG, Hersch SM, Mouradian MM, Young AB, Tanese N, Krainc D (2002). Sp1 and TAFII130 transcriptional activity disrupted in early Huntington’s disease. Science 296, 2238–43. [DOI] [PubMed] [Google Scholar]
- Eggens VR, Barth PG, Niermeijer JM, Berg JN, Darin N, Dixit A, Fluss J, Foulds N, Fowler D, Hortobagyi T, Jacques T, King MD, et al. (2014). EXOSC3 mutations in pontocerebellar hypoplasia type 1: novel mutations and genotype-phenotype correlations. Orphanet. J. Rare Dis 9. [DOI] [PMC free article] [PubMed] [Google Scholar]
- Engreitz J, Lander ES, Guttman M (2015). RNA antisense purification (RAP) for mapping RNA interactions with chromatin. Methods Mol. Biol 1262, 183–197. [DOI] [PubMed] [Google Scholar]
- Giunta M, Edvardson S, Xu Y, Schuelke M, Gomez-Duran A, Boczonadi V, Elpeleg O, Muller JS, Horvath R (2016). Altered RNA metabolism due to a homozygous RBM7 mutation in a patient with spinal motor neuropathy. Hum. Mol. Genet [DOI] [PMC free article] [PubMed] [Google Scholar]
- Gulbahce N, Yan H, Dricot A, Padi M, Byrdsong D, Franchi R, Lee DS, Rozenblatt-Rosen O, Mar JC, Calderwood MA, Baldwin A, Zhao B et al. (2012). Viral perturbations of host networks reflect disease etiology. PLoS Comput. Biol 8. [DOI] [PMC free article] [PubMed] [Google Scholar]
- Halevy A, Lerer I, Cohen R, Kornreich L, Shuper A, Gamliel M, Zimerman BE, Korabi I, Meiner V, Straussberg R, Lossos A (2014). Novel EXOSC3 mutation causes complicated hereditary spastic paraplegia. J. Neurol. 261, 2165–9. [DOI] [PubMed] [Google Scholar]
- Hallais M, Pontvianne F, Andersen PR, Clerici M, Lener D, Benbahouche Nel H, Gostan T, Vandermoere F, Robert MC, Cusack S, et al. (2013). CBC-ARS2 stimulates 3’-end maturation of multiple RNA families and favors cap-proximal processing. Nat. Struct. Mol. Biol 20, 1358–66. [DOI] [PubMed] [Google Scholar]
- Heaton NS, Leyva-Grado VH, Tan GS, Eggink D, Hai R, Palese P (2013). In vivo bioluminescent imaging of influenza A virus infection and characterization of novel cross-protective monoclonal antibodies. J. Virol 87, 8272–81. [DOI] [PMC free article] [PubMed] [Google Scholar]
- Heaton NS, Moshkina N, Fenouil R, Gardner TJ, Aguirre S, Shah PS, Zhao N, Manganaro L, Hultquist JF, Noel J, Sachs D, et al. (2016). Targeting viral proteostasis limits influenza virus, HIV, and dengue virus infection. Immunity 44, 46–58. [DOI] [PMC free article] [PubMed] [Google Scholar]
- Herz C, Stavnezer E, Krug R (1981). Influenza virus, an RNA virus, synthesizes its messenger RNA in the nucleus of infected cells. Cell 26, 391–400. [DOI] [PubMed] [Google Scholar]
- Hilleren P, McCarthy T, Rosbash M, Parker R, Jensen TH (2001). Quality control of mRNA 3’-end processing linked to the nuclear exosome. Nature 413, 538–42. [DOI] [PubMed] [Google Scholar]
- Honda A, Endo A, Mizumoto K, Ishihama A (2001). Differential roles of viral RNA and cRNA in functional modulation of the influenza virus RNA polymerase. J. Biol. Chem 276, 31179–85. [DOI] [PubMed] [Google Scholar]
- Jager S, Cimermancic P, Gulbahce N, Johnson JR, McGovern KE, Clarke SC, Shales M, Mercenne G, Pache L, Li K, Hernandez H, Jang GM, et al. (2011). Global landscape of HIV-human protein complexes. Nature 481, 365–70. [DOI] [PMC free article] [PubMed] [Google Scholar]
- Januszyk K, Lima CD (2014). The eukaryotic RNA exosome. Curr. Opin. Struct. Biol 24, 132–40. [DOI] [PMC free article] [PubMed] [Google Scholar]
- Kapranov P, Cheng J, Dike S, Nix DA, Duttagupta R, Willingham AT, Stadler PF, Hertel J, Hackermuller J, Hofacker IL, et al. (2007). RNA maps reveal new RNA classes and a possible function for pervasive transcription. Science 316, 1484–8. [DOI] [PubMed] [Google Scholar]
- Laguette N Sobhian B, Casartelli N, Ringeard M, Chable-Bessia C, Segeral E, Yatim A, Emiliani S, Schwartz O, Benkirane M (2011). SAMHD1 is the dendritic- and myeloid-cell-specific HIV-1 restriction factor counteracted by Vpx. Nature 474, 654–7. [DOI] [PMC free article] [PubMed] [Google Scholar]
- Langmead B, Trapnell C, Pop M, Salzberg SL (2009). Ultrafast and memory-efficient alignment of short DNA sequences to the human genome. Genome Biol 10, R25. [DOI] [PMC free article] [PubMed] [Google Scholar]
- Law CW, Chen Y, Shi W, Smyth CW (2014). voom: Precision weights unlock linear model analysis tools for RNA-seq read counts. Genome Biol 15, R29. [DOI] [PMC free article] [PubMed] [Google Scholar]
- Lee TI, Johnstone SE, Young RA (2006). Chromatin immunoprecipitation and microarray-based analysis of protein localization. Nat. Protoc 1, 729–48. [DOI] [PMC free article] [PubMed] [Google Scholar]
- Lemay JF, Larochelle M, Marguerat S, Atkinson S, Bahler J, Bachand F (2014) The RNA exosome promotes transcription termination of backtracked RNA polymerase II. Nat. Struct. Mol. Biol 21, 919–26. [DOI] [PubMed] [Google Scholar]
- Liao Y, Smyth GK, Shi W (2014). featureCounts: an efficient general purpose program for assigning sequence reads to genomic features. Bioinformatics 30, 923–30. [DOI] [PubMed] [Google Scholar]
- Lubas M, Andersen PR, Schein A, Dziembowki A, Kudla G, Jensen TH (2015). The human nuclear exosome targeting complex is loaded onto newly synthesized RNA to direct early ribonucleolysis. Cell Rep 10, 178–92. [DOI] [PubMed] [Google Scholar]
- Lubas M, Christensen MS, Kristiansen MS, Domanski M, Falkenby LG, Lykke-Andersen S, Andersen JS, Dziembowski A, Jensen TH (2011). Interaction profiling identifies the human nuclear exosome targeting complex. Mol. Cell 43, 624–37. [DOI] [PubMed] [Google Scholar]
- Lukarska M, Fournier G, Pflug A, Resa-Infante P, Reich S, Naffakh N, Cusack S (2017). Structural basis of an essential interaction between influenza polymerase and Pol II CTD. Nature 541, 117–121. [DOI] [PubMed] [Google Scholar]
- Lykke-Andersen S, Brodersen DE, Jensen TH (2009). Origins and activities of the eukaryotic exosome. J. Cell Sci 122, 1487–94. [DOI] [PubMed] [Google Scholar]
- Madhani HD (2013). The frustrated gene: origins of eukaryotic gene expression. Cell 155, 744–9. [DOI] [PMC free article] [PubMed] [Google Scholar]
- Marazzi I and Garcia-Sastre A (2015) Interference of viral effector proteins with chromatin, transcription, and the epigenome. Curr. Opin. Microbiol 26, 123–9. [DOI] [PubMed] [Google Scholar]
- Martin M (2011). Cutadapt removes adapter sequences from high-throughput sequencing reads. EMBnet.journal 17, 10–12. [Google Scholar]
- Ortin J and Martin-Benito J (2015) The RNA synthesis machinery of negative-stranded RNA viruses. Virology 479-480, 532–44. [DOI] [PubMed] [Google Scholar]
- Paulson M, Press C, Smith E, Tanese N, Levy DE (2002). IFN-stimulated transcription through a TBP-free acetyltransferase complex escapes viral shutoff. Nat. Cell Biol 4, 140–7. [DOI] [PubMed] [Google Scholar]
- Pefanis E, Wang J, Rothschild G, Lim J, Chao J, Rabadan R, Economides AN, Basu U (2014). Noncoding RNA transcription targets AID to divergently transcribed loci in B cells. Nature 514, 389–93. [DOI] [PMC free article] [PubMed] [Google Scholar]
- Pefanis E, Wang J, Rothschild G, Lim J, Kazadi D, Sun J, Federation A, Chao J, Elliott O, Liu ZP, Economides AN, Bradner JE, Rabadan R, Basu U (2015). RNA exosome-regulated long non-coding RNA transcription controls super-enhancer activity. Cell 161, 774–89. [DOI] [PMC free article] [PubMed] [Google Scholar]
- Perez JT, Varble A, Sachidanandam R, Zlatev I, Manoharan M, Garcia-Sastre A, tenOever B (2010). Influenza A virus-generated small RNAs regulate the switch from transcription to replication. PNAS 107, 11525–11530. [DOI] [PMC free article] [PubMed] [Google Scholar]
- Pichlmair A, Kandasamy K, Alvisi G, Mulhern O, Sacco R, Habjan M, Binder M, Stefanovic A, Eberle CA, Goncalves A, Burckstummer T, Muller AC (2012). Viral immune modulators perturb the human molecular network by common and unique strategies. Nature 487, 486–90. [DOI] [PubMed] [Google Scholar]
- Plotch SJ, Bouloy M, Krug RM. (1979). Transfer of 5’-terminal cap of globin mRNA to influenza viral complementary RNA during transcription in vitro. Proc. Natl. Sci USA 76, 1618–22. [DOI] [PMC free article] [PubMed] [Google Scholar]
- Reich S, Guilligay D, Pflug A, Malet H, Berger I, Crepin T, Hart D, Lunardi T, Nanao M, Ruigrok RW, Cusack S (2014). Structural insight into cap-snatching and RNA synthesis by influenza polymerase. Nature 516, 361–6. [DOI] [PubMed] [Google Scholar]
- Reimand J, Arak T, Adler P, Kolberg L, Resisberg S, Peterson H, Vilo J (2016). g:Profiler-a web server for functional interpretation of gene lists (2016 update). Nucleic Acids Res 44, 83–9. [DOI] [PMC free article] [PubMed] [Google Scholar]
- Rice GL, Bond J, Asipu A, Brunette RL, Manfield IW, Carr IM, Fuller JC, Jackson RM, Lamb T, Briggs TA, Ali M, Gornall H, Couthard LR, et al. (2009). Mutations involved in Aicardi-Goutieres syndrome implicate SAMHD1 as regulator of the innate immune response. Nat. Genet 41, 829–32. [DOI] [PMC free article] [PubMed] [Google Scholar]
- Rice GL, Kasher PR, Forte GM, Mannion NM, Greenwood SM, Szynkiewicz M, Dickerson JE, Bhaskar SS, Zampini M, Briggs TA, Jenkinson EM et al. (2012). Mutations in ADAR1 cause Aicardi-Goutieres syndrome associated with a type I interferon signature. Nat. Genet 44, 1243–8. [DOI] [PMC free article] [PubMed] [Google Scholar]
- Richards A, van den Maagdenberg AM, Jen JC, Kavanagh D, Bertram P, Spitzer D, Liszewski MK, Barilla-Labarca ML, Terwindt GM, Kasai Y, et al. (2007). C-terminal truncations in human 3’-5’ DNA exonuclease TREX1 cause autosomal dominant retinal vasculopathy with cerebral leukodystrophy. Nat. Genet 39, 1068–70. [DOI] [PubMed] [Google Scholar]
- Ritchie ME, Phipson B, Wu D, Hu Y, Law CW, Shi W, Smyth GK (2015). limma powers differential expression analyses for RNA-sequencing and microarray studies. Nucleic Acids Res 43, e47. [DOI] [PMC free article] [PubMed] [Google Scholar]
- Rozenblatt-Rosen O, Deo RC, Padi M, Adelmant G, Calderwood MA, Rolland T, Grace M, Dricot A, Askenazi M, Tavares M, Pevzner SJ, et al. (2012). Interpreting cancer genomes using systematic host network perturbations by tumor virus proteins. Nature 487, 491–5. [DOI] [PMC free article] [PubMed] [Google Scholar]
- Rudnik-Schoneborn S, Senderek J, Jen JC, Houge G, Seeman P, Puchmajerova A, Graul-Neumann L, Seidel U, Korinthenberg R, Kirschner J, Seeger J, Ryan MM, et al. (2013). Pontocerebellar hypoplasia type I: clinical spectrum and relevance of EXOSC3 mutations. Neurology 80, 438–46. [DOI] [PMC free article] [PubMed] [Google Scholar]
- Sakuma T, Tonne JM, Ikeda Y (2014) Murine leukemia virus uses TREX components for efficient nuclear export of unspliced viral transcripts. Viruses 10, 1135–48. [DOI] [PMC free article] [PubMed] [Google Scholar]
- Shah PS Wojcechowskyj JA, Eckhardt M, Krogan NJ (2015). Comparative mapping of host-pathogen protein-protein interactions. Curr. Opin. Microbiol 27, 62–8. [DOI] [PMC free article] [PubMed] [Google Scholar]
- Shannon P, Markiel A, Ozier O, Baliga NS, Wang JT, Ramage D, Amin N, Schwikowski B, Ideker T (2003). Cytoscape: a software environment for integrated models of biomolecular interaction networks. Genome Res 13, 2498–504. [DOI] [PMC free article] [PubMed] [Google Scholar]
- Shapira SD, Gat-Viks I, Shum BO, Dricot A, de Grace MM, Wu L, Gupta PB, Hao T, Silver SJ, Root DE, Hill DE, Regev A, Hacohen N (2009). A physical and regulatory map of host-influenza interactions reveals pathways in H1N1 infection. Cell 139, 1255–67. [DOI] [PMC free article] [PubMed] [Google Scholar]
- Summers BC, Leib DA (2002). Herpes simplex virus type I origins of DNA replication play no role in the regulation of flanking promoters. J. Virol 76, 7020–9. [DOI] [PMC free article] [PubMed] [Google Scholar]
- Teo G, Koh H, Fermin D, Lambert JP, Knight JD, Gingras AC, Choi H (2016). SAINTq: Scoring protein-protein interactions in affinity purification – mass spectrometry experiments with fragment or peptide intensity data. Proteomics 16, 2238–45. [DOI] [PubMed] [Google Scholar]
- Thoms M, Thomson E, Babler J, Gnadig M, Griesel S, Hurt E (2015). The exosome is recruited to RNA substrates through specific adaptor proteins. Cell 162, 1029–38. [DOI] [PubMed] [Google Scholar]
- Tollervey D (2015). RNA surveillance and the exosome. RNA 21, 492–3. [DOI] [PMC free article] [PubMed] [Google Scholar]
- Trapnell C, Pachter L, Salzberg SL (2009). TopHat: discovering splice junctions with RNA-seq. Bioinformatics 25, 1105–1111. [DOI] [PMC free article] [PubMed] [Google Scholar]
- Umbach JL, Yen HL, Poon LL, Cullen BR (2010). Influenza A virus expresses high levels of an unusual class of small viral leader RNAs in infected cells. Mbio. 1, e00204–10. [DOI] [PMC free article] [PubMed] [Google Scholar]
- UniProt Consortium. (2015). UniProt: a hub for protein information. Nucleic Acids Res 43, 204–12. [DOI] [PMC free article] [PubMed] [Google Scholar]
- Wan J, Yourshaw M, Mamsa H, Rudnik-Schoneborn S, Menezes MP, Hong JE, Leong DW, Senderek J, Salman MS, Chitayat D, et al. (2012). Mutations in the RNA exosome component gene EXOSC3 cause pontocerebellar hypoplasia and spinal motor neuron degeneration. Nat. Genet 44, 704–8. [DOI] [PMC free article] [PubMed] [Google Scholar]
- Woolhouse ME, Webster JP, Domingo E, Charlesworth B, Levin BR (2002). Biological and biomedical implications of the co-evolution of pathogens and their hosts. Nat. Genet 32, 569–77. [DOI] [PubMed] [Google Scholar]
- Xu Z, Wei W, Gagneur J, Clauder-Munster S, Smolik M, Huber W, Steinmetz LM (2011). Antisense expression increases gene expression variability and locus interdependency. Mol. Syst. Biol 7, 468. [DOI] [PMC free article] [PubMed] [Google Scholar]
- Zanni G, Scotton C, Passarelli C, Fang M, Barresi S, Dallapiccola B, Wu B, Gualandi F, Ferlini A, Bertini E, Wei W (2013). Exome sequencing in a family with intellectual disability, early onset spasticity, and cerebellar atrophy detects a novel mutation in EXOSC3. Neurogenetics 14, 247–50. [DOI] [PubMed] [Google Scholar]
- Zhang X, Goncalves R, Mosser DM (2008). The isolation and characterization of murine macrophages. Curr. Protoc. Immunol 14, November. [DOI] [PMC free article] [PubMed] [Google Scholar]
Associated Data
This section collects any data citations, data availability statements, or supplementary materials included in this article.
Supplementary Materials
Figure S1. Global interactome of influenza virus polymerase subunits PB1 and PB2. Related to Figure 1
Influenza virus polymerase basic protein 1 (PB1) and polymerase basic protein 2 (PB2) from (A) H1N1 (California 2009) or (B) H3N2 (Wyoming 2003) were cloned with C-terminal 2xStrep tags, expressed in A549 cells with and without interferon pre-treatment (12 hours), and subjected to affinity purification and mass spectrometry (AP-MS) in biological triplicate alongside vector and GFP-2xStrep controls. Human proteins (prey) significantly enriched after Strep purification (orange - bait) relative to vector and GFP-2xStrep control samples are depicted (yellow - without interferon, blue – with interferon, green – both with and without interferon). Known exosome interacting partners are boxed in blue.
Table S3. Disease intersection analyses
Table S4. Related to STAR methods.
Figure S2. Loss of function of RNA exosome subunits suppresses influenza virus ribogenesis and growth. Related to Figure 2
(A-C) Influenza viral mRNA levels (A), viral RNA levels (B), and host infection-induced target gene mRNA levels (C) (measured by qPCR) in human A549 cells infected with the A/Puerto Rico/8/1934 H1N1 strain at the indicated time points. Cells were transfected with silencing RNAs (siRNA) targeting EXOSC10, a non-targeting siRNA (siCTRL), or left un-transfected (No si).
(D) mRNA expression (measured by qPCR) and protein levels for the targets of the siRNAs used above.
(E) Renilla luciferase expression in A549 cells infected with a luciferase expressing HSV-1 virus at the indicated time points post-infection. Cells were transfected with silencing RNAs (siRNA) targeting EXOSC3 or DIS3, a non-targeting siRNA (siCTRL), or left un-transfected (No si).
(F) Protein levels for the targets of the siRNAs used in Figure 2 – DIS3 and EXOSC3, along with ACTB control.
Statistical analyses between datasets were performed with a two-tailed Student’s t-test, adjusted with a Holm-Bonferroni test for sequential comparisons. For all panels, *p<.05, **p<.005, and ***p<.0005. Error bars indicate SD from triplicate experiments.
Figure S3. EXOSC3 loss of function increases PROMPT RNA levels in different cell types. Related to Figure 3
(A-B) PROMPT RNA levels (measured by qPCR) in primary dermal fibroblasts isolated from patients with pontocerebellar hypoplasia type I (A: carrier and affected) and human A549 cells (B) infected with the A/Puerto Rico/8/1934 H1N1 strain at the indicated time points. For B, cells were transfected with silencing RNAs (siRNA) targeting EXOSC3, a non-targeting siRNA (siCTRL), or left un-transfected (No si).
Statistical analyses between datasets were performed with a two-tailed Student’s t-test, adjusted with a Holm-Bonferroni test for sequential comparisons. For all panels, *p<.05, **p<.005, and ***p<.0005. Error bars indicate SD from triplicate experiments.
Figure S4. Conditional ablation of Exosc3 in both T cells and Bone Marrow Macrophages suppresses influenza polymerase activity. Related to Figure 4.
(A) Splenic T cells were isolated from two mouse types: COIN/+ (conditional heterozygous for Exosc3 depletion), and COIN/COIN (conditional homozygous for Exosc3 depletion). T cells were stimulated with anti-CD3, and treated with tamoxifen (+TAM) or DMSO (−TAM) for 3 days to induce the conditional depletion of Exosc3 and inversion of GFP. Left: Fluorescence-activated cell sorting (FACS) displaying GFP conversion (per # of cells) with and without tamoxifen treatment at 6 hours post-infection. Right: Fluorescence-activated cell sorting (FACS) displaying GFP conversion against population scatter with and without tamoxifen treatment at 6 hours post-infection.
(B) Influenza viral mRNA levels (measured by qPCR) in T cells infected with the A/Puerto Rico/8/1934 H1N1 strain before (mock) and 6 hours post-infection (infected), and control of mRNA expression level for the efficiency of tamoxifen-induced depletion of Exosc3.
(C) Bone marrow macrophages (BMDM) were isolated from the two mouse types listed above. BMDMs were stimulated with M-CSF for 7 days, and treated with tamoxifen (+TAM) or DMSO (−TAM) for the last 3 days to induce the conditional depletion of Exosc3 and inversion of GFP. Left: Fluorescence-activated cell sorting (FACS) displaying GFP conversion (per # of cells) with and without tamoxifen treatment at 6 hours post-infection. Right: Fluorescence-activated cell sorting (FACS) displaying GFP conversion against population scatter with and without tamoxifen treatment at 6 hours post-infection.
(D) Influenza viral mRNA levels (measured by qPCR) in BMDMs infected with the A/Puerto Rico/8/1934 H1N1 strain before (mock) and 6 hours post-infection (infected), and control of mRNA expression level for the efficiency of tamoxifen-induced depletion of Exosc3.
(E) Viral replication growth curves (single cycle – left; multi cycle – right) assayed from supernatants harvested from Exosc3 conditionally-ablated BMDMs infected with the influenza strain A/Puerto Rico/8/1934 H1N1 at the indicated time points post-infection.
(F) PROMPT RNA levels (measured by qPCR) in Exosc3 conditionally-ablated B cells infected with the A/Puerto Rico/8/1934 H1N1 strain at the indicated time points.
(G) Protein levels of influenza (HA, M1) and host proteins (Exosc3, Actb) in Exosc3 conditionally-ablated B cells infected with the A/Puerto Rico/8/1934 H1N1 strain at 6 hpi.
Statistical analyses between datasets were performed with a two-tailed Student’s t-test, adjusted with a Holm-Bonferroni test for sequential comparisons. For panels B, D, E-F, *p<.05, **p<.005, and ***p<.0005. Error bars indicate SD from duplicate experiments.
Figure S5. RBM7 suppression impairs viral polymerase activity. Related to Figure 5
(A) A549 cells were infected with H1N1 PA/PB1/PB2-FLAG-tagged influenza viruses for 10 hours. In Virio heatmap depicts the relative protein abundance of bait proteins and exosome subunits across technical duplicates in the AP-MS samples reported in (Heaton et al., 2016).
(B-C) Influenza viral mRNA levels (B), and host infection-induced target gene mRNA levels (C) (measured by qPCR) in human A549 cells infected with the A/Puerto Rico/8/1934 H1N1 strain at the indicated time points. Cells were transfected with silencing RNAs (siRNA) targeting SKIV2L (a RNA helicase, and member of the cytoplasmic superkiller-exosome targeting complex) or PAPD5 (a non-canonical poly(A) RNA polymerase, and member of the nucleolar TRAMP-exosome targeting complex), a non-targeting siRNA (siCTRL), or left un-transfected (No si).
(D) mRNA expression levels (measured by qPCR) for the targets of the siRNAs used above.
(E) Influenza viral mRNA levels (measured by qPCR) in human A549 cells infected with the A/Puerto Rico/8/1934 H1N1 strain at the indicated time points. Cells were transfected with a silencing RNA (siRNA) targeting RBM7, a non-targeting siRNA (siCTRL), or left un-transfected (No si).
(F) mRNA expression (measured by qPCR) and protein levels for the targets of the siRNAs used above.
(G) Influenza minigenome replicon assay in A549 cells transfected with a siRNA targeting RBM7, a non-targeting siRNA (siCTRL), or left un-transfected (No si). The viral polymerase transcribed firefly luciferase levels were normalized to co-transfected renilla luciferase levels.
(H) Viral replication growth curves (single cycle – top; multi cycle – bottom) assayed from supernatants harvested from human A549 cells infected with the influenza strain A/Puerto Rico/8/1934 H1N1 at the indicated time points post-infection. A549 cells were first transfected with a silencing RNA (siRNA) targeting RBM7 or a non-targeting siRNA (siCTRL).
(I) Exosome-target mRNA levels (measured by qPCR) in human A549 cells infected with the A/Puerto Rico/8/1934 H1N1 strain at the indicated time points. Cells were transfected with a silencing RNA (siRNA) targeting RBM7, a non-targeting siRNA (siCTRL), or left un-transfected (No si). Directionality of eRNAs: (−) negative sense, (+) positive sense. Promoter upstream transcripts – PROMPTs (top panel); enhancer RNAs – eRNAs (bottom panel).
Statistical analyses between datasets were performed with a two-tailed Student’s t-test, adjusted with a Holm-Bonferroni test for sequential comparisons. For panels B-I, *p<.05, **p<.005, and ***p<.0005. Error bars indicate SD from triplicate experiments (B-I).
Figure S6. Control experiments related to figure 6
(A) Heat map of average expression changes of negative (vRNA - bottom) and positive-stranded (cRNA - top) viral RNAS in A549 cells infected with the A/Puerto Rico/8/1934 H1N1 strain at 4 hours-post infection. Cells were transfected with silencing RNAs (siRNA) targeting DIS3 or EXOSC10, or a non-targeting siRNA (siCTRL). Expression changes reflect the fold-change ratio between either siDIS3 or siEXOSC10 and siCTRL conditions.
(B) Heat map of average expression changes of positive host:viral chimeric (mRNA – left), negative (vRNA - right), and positive-stranded (cRNA - middle) RNAs in A549 cells infected with the A/Puerto Rico/8/1934 H1N1 strain at 6 hours-post infection. Cells were transfected with an empty vector (EV) or a vector expressing human DIS3 (DIS3-OE). Expression changes reflect the fold-change ratio between DIS3-OE and EV conditions. Protein levels of overexpressed DIS3 and ACTB control to right.
(C) PROMPT copy-per-million (CPM) in uninfected A549 cells transfected with an empty vector (EV) or a vector expressing human DIS3 (DIS3-OE)
(D) Host:influenza chimeric mRNA levels in human A549 cells infected with the A/Puerto Rico/8/1934 H1N1 strain at the indicated time points. Cells were transfected with a silencing RNA (siRNA) targeting EXOSC3, DIS3, EXOSC10, a non-targeting siRNA (siCTRL), or left untransfected (No si).
(E) ChIP-qPCR analysis of the PB1, PB2, or PA subunit of influenza polymerase and endogenous EXOSC3, DIS3, or EXOSC10 at endogenous PROMPTs (top: EXT1, middle: POGZ, bottom: MGST3). Human A549 cells were infected with H1N1 PBl/PB2/PA-FLAG-tagged viruses at the indicated time points. Cells were transfected with silencing RNAs (siRNA) targeting EXOSC3, DIS3, EXOSC10, or a non-targeting siRNA (siCTRL). For each panel, protein occupancies are shown at the 5’-end (left side of dashed line), and the 3’-end (right side of dashed line) of the respective PROMPT loci.
Statistical analyses between datasets were performed with a two-tailed Student’s t-test, adjusted with a Holm-Bonferroni test for sequential comparisons. For all panels, *p<.05, **p<.005, and ***p<.0005. Error bars indicate SD from triplicate (D) and duplicate experiments (A-C,E).