

Abstract
Liver phenylalanine hydroxylase (PheH) is an allosteric enzyme that is activated by phenylalanine. The enzyme is also phosphorylated by protein kinase A, but the effects of phosphorylation are unclear. Recent structural studies (Meisburger et al. (2016) J. Amer. Chem. Soc. 138, 6506–6516) support a model in which activation of the enzyme involves dimerization of the regulatory domains, creating the allosteric site for phenylalanine at the dimer interface. This conformational change also results in a change in the fluorescence of the protein that can be used to monitor activation. The kinetics of activation of PheH are biphasic over a range of phenylala-nine concentrations. These data are well-described by a model involving an initial equilibrium between the resting form and the activated conformation, with a value of the equilibrium constant for formation of the activated conformation, L, equal to 0.007, followed by binding of two molecules of phenylalanine. Phosphorylation increases L 10-fold by increasing the rate constant for conversion of the resting form to the activated form. The results provide functional support for the previous structural model, identify the specific effect of phosphorylation on the enzyme, and rationalize the lack of change in the protein structure upon phosphorylationthe major conclusions.
Graphical Abstract
Phosphorylation, the most common post-translational modification in cells, plays a key part in regulation of enzymes. Structural analyses of the effects of phosphorylation have been key to understanding the molecular basis for the effects of this modification.1 Liver phenylalanine hydroxylase (PheH), an allosteric enzyme that converts phenylalanine to tyrosine in the initial step in phenylala-nine catabolism,2 is phosphorylated on Ser16 by protein kinase A. Multiple laboratories have reported that phosphorylation increases the activity of PheH, although the specific changes described have varied. Phosphorylation has been reported to have no effect on or to increase the k cat value by 1.5 to 3-fold,3–6 to have no effect on3 or decrease by ~2-fold the Km value for phenylalanine,6 and to decrease by ~2-fold the concentration of phenylalanine required for allosteric activation.4, 7 The structures of both the unphosphorylated and phosphorylated enzyme have been determined using a dimeric form of rat PheH.8 Surprisingly, these structures are identical, although they lack the N-terminal 19 residues, including the phosphorylation site. Thus, both the effect of phosphorylation on the activity and the structural basis for any change in the activity of PheH remain unclear.
Evaluation of the effect of phosphorylation on the activity of PheH is complicated by the allosteric properties of the enzyme. PheH is a homo-tetramer with each subunit containing an N-terminal regulatory domain and a larger catalytic domain. The former contains the allosteric site for phenylalanine9–11 and the phosphorylation site, while the latter contains all of the residues required for catalysis.12 The resting form of the enzyme has low activity; it is converted to the fully active form upon binding of phenylalanine in the allosteric site.2 In structures of the enzyme in the absence of phenylalanine,8, 13, 14 the N-terminus of the regulatory domain lies across the active site, providing a reasonable explanation for this low activity, and the individual regulatory domains interact with catalytic domains but not with one another. Recently, a series of biophysical studies have allowed us to propose a structural model for activation of PheH by phenylalanine (Figure 1).13, 15 In the activated form of the enzyme, the regulatory domains have moved to form dimers; this opens up the active site. Dimerization of the regulatory domains also forms the allosteric site for phenylalanine;10, 11 binding of the amino acid at this site stabilizes the activated form.16
Figure 1.

Model for activation of phenylalanine hydroxylase by phenylalanine. Adapted from Meisburger et al.13 Individual catalytic domains are colored in blue, magenta, yellow, and green, with the C-terminal helices responsible for tetramer formation depicted as circles. The regulatory domains corresponding to the blue and green catalytic domains are shown as trapezoids with beta sheets; the other two regulatory domains are on the opposite face of the tetramer. The allosteric sites for phenylalanine formed at the interface of the regulatory domain dimer in the activated form are shown as pentagons.
The goal of the work described here was to determine how phosphorylation affects the catalytic and regulatory properties of PheH. To do so we have determined the kinetic mechanism for activation by phenylalanine and identified the individual rate constant in that mechanism that is altered by phosphorylation. These results rationalize the lack of an effect of phosphorylation on the crystal structure of PheH and provide unique insight into the molecular basis for the effect of phosphorylation on an important metabolic enzyme.
We first determined whether phosphorylation alters the activity of the phenylalanine-activated enzyme. PheH was stoichiometrically phosphorylated using protein kinase A. The steady-state kinetics of the phosphor-ylated enzyme with phenylalanine as substrate were then determined after incubating the enzyme with phenylalanine (Figure S1). Fitting the data to the Hill equation yielded values of 4.1 ± 0.1 s−1 for kcat, 250 ± 9 μM for Kphe and 2.0 ± 0.1 for the Hill coefficient. These parameters are very similar those reported for the unphosphorylated protein, kcat = 3 s−1, KPhe = 300 μM and n = 2.5.2, 12
We next determined how phosphorylation affects activation. Activation of PheH by phenylalanine is accompanied by an increase in the intrinsic fluorescence of the enzyme and a shift in the emission maximum from 330 nm to 340 nm (Figure S2A).17 This allows the formation of the activated form to be monitored directly. For these analyses we used a mutant enzyme, R270K PheH, in which binding of phenylalanine in the active site has been eliminated. This avoids any effects due to binding of phenylalanine in the active site.18 Figure 2 shows the effect of phosphorylation on the phenylalanine dependence of the protein fluorescence. Fitting the data for the unphosphorylated enzyme to the Hill equation yielded a Kd value of 320 ± 20 μM and a Hill coefficient of 2.3 ± 0.3; the corresponding values for the phosphorylated enzyme were 84 ± 2 μM and 1.9 ± 0.1. Based on these data, at the physiological concentration of phenylala-nine in the blood, ~65 μM,19 2% of the unphosphorylated enzyme would be in the activated form, whereas 40% of the phosphorylated form would be.
Figure 2.

Effect of phosphorylation on the activation of PheH by phenylalanine. Phosphorylated (solid circles) or unphosphorylated (open circles)18 R270K PheH was mixed with phenylalanine and the fluorescence emission monitored. The lines are from fits to ΔF/ΔFtot = [phe]n/(Kdn + [phe]n).
These results are consistent with phosphorylation altering the kinetics of activation of PheH rather than directly affecting the enzyme activity. We used stopped-flow fluorescence spectroscopy to determine the kinetic mechanism for activation by phenylalanine of PheH. Figure 3A shows representative time courses for the change in fluorescence at different concentrations of phenylalanine. All of the traces are biphasic, with the values of both rate constants decreasing with increasing phenylalanine concentration (Figure S3).
Figure 3.

Kinetics of phenylalanine binding to R270K PheH. Unphosphorylated (A) or phosphorylated (B) R270K PheH was mixed with phenylalanine at 30 °C, pH 7.5. The lines are from scheme 1C and the kinetic parameters in Table 1.
We used KinTek Global Kinetic Explorer20 to determine the kinetic mechanism for phenylalanine binding and to extract the kinetic parameters from the data in Figure 3A. This program performs global dynamic simulation of multiple time courses to fit to a specified kinetic model. The quality of each fit is determined by the x2 value and error estimates of the individual parameters. The confidence intervals for the individual parameters were estimated using the FitSpace component of KinTek Explorer.21 This program determines confidence intervals by changing the value of an individual rate constant and then refitting the entire data set, allowing all of the other rate constants to vary. This process is continued until the x2 value surpasses the preset threshold value. The resulting variations can be visually represented by 2D plots where the relationships of different rate constants are shown (Figure S5A).
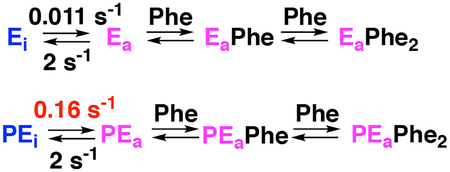
Biphasic binding reactions are generally attributed to one of two minimal mechanisms shown in Scheme 1. In A, binding is followed by a conformational change. In B, the enzyme exists in an equilibrium between two conformations, of which only the minor one binds the ligand. These mechanisms can be distinguished by the concentration dependence of the observed rate constants, in that both increase with increasing ligand concentration for A, but one rate constant decreases with increasing ligand in B.22, 23 However, neither of these models describe the behavior of PheH. Since two molecules of phenylalanine bind the PheH regulatory domain dimer,13, 16 we also considered mechanism C in Scheme 1, which involves a conformational change followed by binding of two molecules of phenylalanine. A fit with mechanism A gave a x2 value of 5.4×10⁶ while a fit with B gave a marginally better fit with a x2 value of 3.6×10⁶. Use of mechanism C resulted in a substantial improvement in the quality of the fit, reflected as a lower x2 value of 7.6×10³, the visual agreement of the data with the time courses (Figure 3A), and well-defined contour plots (Figure S4A). The individual kinetic parameters from this analysis are given in Table 1. Gratifyingly, the value of L, the equilibrium constant for formation of the activated conformation, is identical to the value of 6.5 × 10⁻³ previously determined using SAXS analysis.13 Moreover, the average (13 μM) of the two Kd values for phenylalanine agrees well with the average value of the two binding constants previously measured for the regulatory domain (6–15 μM).13, 16
Scheme 1.

Table 1.
Effect of phosphorylation on the rate constants for binding of phenylalanine to PheHa
| Parameter | R270K PheH | P-R270K PheH |
|---|---|---|
| k1, s−1 | 0.011 | 0.16 |
| (0.011–0.012) | (0.14–0.2) | |
| k−1, s−1 | 1.75 | 2.5 |
| (0.7–4.0) | (1.3–5.0) | |
| K2, μM | 6.7 | 18 |
| (2.5–18) | (7.5–48) | |
| K3, μM | 20 | 43 |
| (18–33) | (22–106) | |
| Lb | 6.6 × 10⁻³ | 6.7 × 10⁻² |
| (6.2–7.0 × 10⁻³) | (5.7–8.0 × 10⁻²) |
The values in parentheses are the confidence intervals calculated using FitSpace at a X2 threshold of 0.88.
The confidence interval for the equilibrium constant for activation, L, was obtained by fixing the value of k1.
Phosphorylated PheH also exhibits a change in fluorescence upon the allosteric binding of phenylalanine (Figure S2B). The emission maximum for the resting form of the phosphorylated enzyme is 335 nm, 5 nm shifted from the emission maximum of the unphosphorylated protein, 330 nm. This shifts in the presence of phenylalanine to 338 nm, similar to the maximum for the unphosphorylated protein, 340 nm. Addition of phenylalanine causes a significant increase in the emission of the phosphorylated protein, with the emission spectra of the unphosphorylated and phosphorylated proteins being essentially identical. Representative time courses for the change in protein fluorescence upon phenylala-nine binding to phosphorylated R270K PheH are shown in Figure 3B. Again, the individual traces are biphasic, with the values of both rate constants decreasing as the concentration of phenylalanine increased (Figure S4). The time-course data could be fit globally to mechanism C, the same mechanism used for the unphosphorylated enzyme (Figures 3B and S3B) to obtain the kinetics parameters in Table 1.
The largest effect of phosphorylation is on the equilibrium between the unactivated and activated conformations of the enzyme. The equilibrium constant for this conformational change, L, increases 10-fold in the phosphorylated protein due to a comparable change in the value of the forward rate constant for the conformational change (k1). In contrast, the affinity for phenylalanine is not significantly altered by phosphorylation.
The lack of an effect of phosphorylation of Ser16 on the crystal structure of PheH is readily rationalized by the present results. The phosphorylated form of the enzyme is still ~95% in the unactivated conformation; this would be unlikely to be detected at the 2.2 Å resolution of the available structure. Phosphorylation of Ser16 would be expected to cause a change in the local structure of the polypeptide chain, but this region is missing from the crystal structure. The change in the rate constant for formation of the active form can be attributed to this local change weakening the interaction of the N-terminus of the regulatory domain with the nearby surface of the catalytic domain and thereby lowering the energy barrier for the conformational change.
The fluorescence of PheH arises mainly from Trp120, a residue located at the interface of the catalytic and regulatory domains.24 The red shift in the emission spectrum of the enzyme upon phosphorylation suggests that there is some change in the environment of this residue, possibly due to the larger fraction of the phosphorylated enzyme that is in the activated conformation or the weakening of the domain-domain interface due to the loss of the stabilizing effect of the N-terminus. Previous hydrogen-deuterium exchange analyses showed that phosphorylation does alter the protein structure, but the effect is much less than that of phenylalanine activation.25 The significant increase in fluorescence emission of the phosphorylated enzyme in the presence of phenylalanine is consistent with the resting form of the phosphorylated enzyme being much closer in structure to the resting form of the unphosphorylated enzyme rather than a model in which phosphorylation results in a conversion to the activated conformation. The lack of an effect of phosphorylation on the emission spectrum in the presence of phenylalanine is consistent with the conformation of the phenylalanine-activated protein being unaffected by phosphorylation.
Physiologically, phosphorylation would allow PheH to be activated at lower concentrations of phenylalanine. Activation of protein kinase A by cAMP is a general signal to activate catabolism, and the hydroxylation of phenylalanine to tyrosine is the first step in its catabolism. Activation of protein kinase A also results in phosphor-ylation and activation of tyrosine hydroxylase, the rate-limiting enzyme for production of the catecholamine neurotransmitters.15, 26, 27
The present results provide significant support for a model for activation of PheH involving dimerization of the regulatory domains followed by binding of phenylalanine at the newly formed allosteric sites. In combination with the previous structural analyses,13 they provide an unusually comprehensive view of the molecular basis for regulation of this enzyme.
Supplementary Material
Acknowledgments
Funding Sources
No competing financial interests have been declared.
This work was supported in party by grants from the NIH (R01GM098140 and F31GM116452) and The Welch Foundation (AQ-1245).
ABBREVIATIONS
- PheH
phenylalanine hydroxylase
Footnotes
Supporting Information.
Experimental Procedures, effect of phenylalanine on the fluorescence of PheH, the concentration dependence of the observed rate constants for phenylalanine binding to R270K PheH and phosphorylated R270K PheH, and contour plots of the FitSpace analysis of the kinetic parameters. (pdf)
REFERENCES
- [1].Johnson LN, and Lewis RJ (2001) Chem. Rev 101, 2209–2242. [DOI] [PubMed] [Google Scholar]
- [2].Fitzpatrick PF (2012) Arch. Biochem. Biophys 519, 194–201. [DOI] [PMC free article] [PubMed] [Google Scholar]
- [3].Abita JP, Milstien S, Chang N, and Kaufman S (1976) J. Biol. Chem 251, 5310–5314. [PubMed] [Google Scholar]
- [4].Shiman R, Mortimore GE, Schworer CM, and Gray DW (1982) J. Biol. Chem 257, 11213–11216. [PubMed] [Google Scholar]
- [5].Kowlessur D, Yang X-J, and Kaufman S (1995) Proc. Natl. Acad. Sci. USA 92, 4743–4747. [DOI] [PMC free article] [PubMed] [Google Scholar]
- [6].Miranda FF, Teigen K, Thorolfsson M, Svebak RM, Knappskog PM, Flatmark T, and Martinez A (2002) J. Biol. Chem 277, 40937–40943. [DOI] [PubMed] [Google Scholar]
- [7].Doskeland AP, Martinez A, Knappskog PM, and Flatmark T (1996) Biochem. J 313, 409–414. [DOI] [PMC free article] [PubMed] [Google Scholar]
- [8].Kobe B, Jennings IG, House CM, Michell BJ, Goodwill KE, Santarsiero BD, Stevens RC, Cotton RGH, and Kemp BE (1999) Nat. Struct. Biol 6, 442–448. [DOI] [PubMed] [Google Scholar]
- [9].Li J, Ilangovan U, Daubner SC, Hinck AP, and Fitzpatrick PF (2011) Arch. Biochem. Biophys 505, 250–255. [DOI] [PMC free article] [PubMed] [Google Scholar]
- [10].Zhang S, and Fitzpatrick PF (2016) J. Biol. Chem 291, 7418–7425. [DOI] [PMC free article] [PubMed] [Google Scholar]
- [11].Patel D, Kopec J, Fitzpatrick F, McCorvie TJ, and Yue WW (2016) Sci. Rep 6, 23748. [DOI] [PMC free article] [PubMed] [Google Scholar]
- [12].Daubner SC, Hillas PJ, and Fitzpatrick PF (1997) Biochemistry 36, 11574–11582. [DOI] [PubMed] [Google Scholar]
- [13].Meisburger SP, Taylor AB, Khan CA, Zhang S, Fitzpatrick PF, and Ando N (2016) J. Am. Chem. Soc 138, 6506–6516. [DOI] [PMC free article] [PubMed] [Google Scholar]
- [14].Arturo EC, Gupta K, Heroux A, Stith L, Cross PJ, Parker EJ, Loll PJ, and Jaffe EK (2016) Proc. Natl. Acad. Sci. USA 113, 2394–2399. [DOI] [PMC free article] [PubMed] [Google Scholar]
- [15].Fitzpatrick PF (2015) Curr. Opin. Struct. Biol 35, 1–6. [DOI] [PMC free article] [PubMed] [Google Scholar]
- [16].Zhang S, Roberts KM, and Fitzpatrick PF (2014) Biochemistry 53, 6625–6627. [DOI] [PMC free article] [PubMed] [Google Scholar]
- [17].Phillips RS, Parniak MA, and Kaufman S (1984) Biochemistry 23, 3836–3842. [DOI] [PubMed] [Google Scholar]
- [18].Roberts KM, Khan CA, Hinck CS, and Fitzpatrick PF (2014) Biochemistry 53, 7846–7853. [DOI] [PMC free article] [PubMed] [Google Scholar]
- [19].Geisler S, Mayersbach P, Becker K, Schennach H, Fuchs D, and Gostner JM (2015) Pteridines 26, 31–36. [Google Scholar]
- [20].Johnson KA, Simpson ZB, and Blom T (2009) Anal. Biochem 387, 20–29. [DOI] [PubMed] [Google Scholar]
- [21].Johnson KA, Simpson ZB, and Blom T (2009) Anal. Biochem 387, 30–41. [DOI] [PubMed] [Google Scholar]
- [22].Fersht A (1999) Structure and mechanism in protein science: A guide to enzyme catalysis and protein folding, W. H. Freeman, New York. [Google Scholar]
- [23].Fierke CA, Hammes GG, and Daniel LP (1995) Methods Enzymol. 249, 3–37. [DOI] [PubMed] [Google Scholar]
- [24].Knappskog PM, and Haavik J (1995) Biochemistry 34, 11790–11799. [DOI] [PubMed] [Google Scholar]
- [25].Li J, and Fitzpatrick PF (2013) Arch. Biochem. Biophys 535, 115–119. [DOI] [PMC free article] [PubMed] [Google Scholar]
- [26].Ramsey AJ, and Fitzpatrick PF (1998) Biochemistry 37, 8980–8986. [DOI] [PubMed] [Google Scholar]
- [27].Daubner SC, Le T, and Wang S (2011) Arch. Biochem. Biophys 508, 1–12. [DOI] [PMC free article] [PubMed] [Google Scholar]
Associated Data
This section collects any data citations, data availability statements, or supplementary materials included in this article.