

Abstract
Na+, K+‐ATPase (NKA) activity, which establishes the sodium and potassium gradient across the cell membrane and is instrumental in the propagation of the nerve impulses, is altered in a number of neurological and neuropsychiatric disorders, including autism spectrum disorders (ASD). In the present work, we examined a wide range of biochemical and cellular parameters in the attempt to understand the reason(s) for the severe decrease in NKA activity in erythrocytes of ASD children that we reported previously. NKA activity in leukocytes was found to be decreased independently from alteration in plasma membrane fluidity. The different subunits were evaluated for gene expression in leukocytes and for protein expression in erythrocytes: small differences in gene expression between ASD and typically developing children were not apparently paralleled by differences in protein expression. Moreover, no gross difference in erythrocyte plasma membrane oxidative modifications was detectable, although oxidative stress in blood samples from ASD children was confirmed by increased expression of NRF2 mRNA. Interestingly, gene expression of some NKA subunits correlated with clinical features. Excess inhibitory metals or ouabain‐like activities, which might account for NKA activity decrease, were ruled out. Plasma membrane cholesterol, but not phosphatidylcholine and phosphatidlserine, was slighty decreased in erythrocytes from ASD children. Although no compelling results were obtained, our data suggest that alteration in the erytrocyte lipid moiety or subtle oxidative modifications in NKA structure are likely candidates for the observed decrease in NKA activity. These findings are discussed in the light of the relevance of NKA in ASD. Autism Res 2018, 11: 1388–1403. © 2018 International Society for Autism Research, Wiley Periodicals, Inc.
Lay Summary
The activity of the cell membrane enzyme NKA, which is instrumental in the propagation of the nerve impulses, is severely decreased in erythrocytes from ASD children and in other brain disorders, yet no explanation has been provided for this observation. We strived to find a biological/biochemical cause of such alteration, but most queries went unsolved because of the complexity of NKA regulation. As NKA activity is altered in many brain disorders, we stress the relevance of studies aimed at understanding its regulation in ASD.
Keywords: autism spectrum disorders; Na+, K+‐ATPase; erythrocyte membrane; oxidative stress; beta‐actin; NRF2; metals; endogenous ouabain; membrane lipids
Introduction
Na+, K + ‐ATPase (NKA) activity is reduced in a number of brain pathological disorders, including ischemia, injury, depression and mood disorders, mania, stress, neuronal hyperexcitability, and epilepsy [reviewed by de Lores Arnaiz & Ordieres, 2014] as well as in autism spectrum disorders (ASD) [Ghezzo et al., 2013]. These observations prompted us to follow up our previous study on ASD to investigate the origin and possibly the relevance of NKA activity decrease in ASD.
Na+, K+‐ATPase Structure and Function
NKA is a protein complex localized at the cell membrane, first described by Skou [1957], who identified it as the main factor responsible for the establishment of the sodium and potassium gradient across the cell membrane. For each ATP‐driven transport cycle, two K+ ions are imported into the cell while three Na+ ions are exported from it. NKA activity allows molecules to pass through the cell membrane via indirect active transport, contributes to establish the membrane electrical potential and is fundamental in the propagation of nerve impulses. NKA belongs to the P‐type ATPases, a family of enzymes comprising more than 50 members and characterized by having a phosphorylated (P) enzyme intermediate in common. NKA consists of α and β subunits, both required for enzyme function, whereas a third subunit, referred to as FXYD, appears to be involved in regulating enzyme activity in a tissue‐specific way. The α subunit is referred to as the catalytic subunit, as it includes the binding sites for ATP and for ion occlusion, as well as for the inhibitor ouabain. It has a relative molecular mass of 100–113 kDa, according to the different isoforms: α1, α2, α3, or α4, and crosses the membrane 10 times, forming transmembrane domains M1–M10, whereas both N‐ and C‐termini are localized on the cytosolic side. Mutations in the α subunits are involved in many (often neurological) diseases [Clausen, Hilbers, & Poulsen, 2017]. The β subunit is in direct contact with the α subunit, acting to facilitate the correct positioning and conformational stability of the α subunit within the plasma membrane. Moreover, the β subunit modulates ion affinity and transport, ATP hydrolysis, and the binding of inhibitors to NKA as a whole. The mass of the protein moiety of β subunit is 36–38 kDa, depending on the different isoforms – β1, β2, or β3; however, as it is heavily glycosylated, it has a relative molecular mass of about 60 kDa. The β subunit crosses the membrane only once, with the N‐terminus localized on the intracellular side of the membrane. The FXYD subunit is a type I membrane protein, crossing once the plasma membrane, with the N‐terminus localized on the extracellular side and characterized by the conserved FXYD motif (FXYD stands for the amino acids phenylalanine, tyrosine, and aspartate), one conserved serine and two conserved glycine residues. In mammals, the FXYD protein family contains seven members, named FXYD 1–7. As the FXYD subunit is not present in all cell types, it appears not to be essential for NKA activity, but rather, serves to modulate ion transport function through molecular interactions with specific enzyme domains [Scheiner‐Bobis, 2002]. The expression pattern of the different isoforms of α, β, and FXYD subunits depends on cell type, developmental stage, and specific signals [Sweadner & Rael, 2000; Hoffman, Wickrema, Potapova, Milanick, & Yingst, 2002; Blanco, 2005; Lubarski, Pihakaski‐Maunsbach, Karlish, Maunsbach, & Garty, 2005; de Lores Arnaiz & Ordieres, 2014].
NKA Regulatory Roles
Proteins may associate with the cytoplasmic domains of the enzyme, underlying the fact that NKA carries regulatory roles beyond ion transport. In fact, NKA activity is regulated by the so‐called cardiotonic steroids (CTS, mainly digoxin and ouabain); in turn, through its binding to a variety of cytoplasmic proteins, NKA is involved in the regulation of a number of signaling processes, which vary in different tissues and may modulate relevant activities such as intracellular Ca2+ concentration, changes in gene expression, cell proliferation, survival and apoptosis, cell–cell contacts and communication, synaptic and neural processes (Goldstein et al., 2006; Matchkov & Krivoi, 2016; Reinhard, Tidow, Clausen, & Nissen, 2013; Xie, 2003).
NKA Regulation
CTS are compounds found in a variety of plants and in few animal species that specifically bind to the extracellular domains of NKA, where binding serves to stabilize the enzyme in its E2 conformation, thus inhibiting its ion transport activity. Examples of plant CTS are ouabain, digoxin, digotoxin, whereas marinobufagenin is the most well‐known among the compounds isolated in toads. Ouabain‐like and digoxin‐like compounds have also been found to be endogenously synthesized in mammals at subnanomolar concentrations, but increase in some physiological and pathological conditions, suggesting a role in the modulation of different processes. The interaction of these compounds with NKA activates its binding to Src kinase and resulting signaling cascades [Pierre & Xie, 2006].
Pyridine, urea (Nikezić et al., 1998), some organophosphate compounds [Blasiak, 1995; Jovanović, Vasić, Nikolic, Ćetković, & Nikezić, 2000] and some metals, notably vanadium (North & Post, 1984; Ehrenspeck, 1980), cadmium and mercury [Vasić, Jovanović, Horvat, Momić, & Nikezić, 2002] have been reported to inhibit NKA activity.
The lipid moiety of the membrane where the enzyme is embedded provides an additional source of NKA regulation [Cornelius, Habeck, Kanai, Toyoshima, & Karlish, 2015; Habeck et al., 2015]. In particular, the thickness of the phospholipid bilayer (related to the acyl chain lengths), the presence of optimal cholesterol concentration [Chen et al., 2011], omega‐3 abundance, and the percentage of anionic or neutral phospholipids all affect enzyme stability and activity.
In particular tissues, regulation of NKA activity may depend on post‐translational modifications of the FXYD subunit [Fuller et al., 2013]. In addition, changes in the cell redox state and hypoxia/reoxygenation events affect NKA activity and may play an important role in pathological and adaptive responses by affecting a variety of redox‐sensitive modifications including S‐glutathionylation, S‐nitrosylation, and redox‐sensitive phosphorylation. Thiol modifications are not only protective towards the inactivating action of oxidants, but may also play regulatory roles [Bogdanova, Petrushanko, Hernansanz‐Agustín, & Martínez‐Ruiz, 2016]. Each NKA subunity type contains cysteine residues, which are potentially attacked by oxidants and protected by glutathionylation; however, α2, which is mostly expressed in the heart and in the brain astrocytes, is more susceptible than other isoforms to irreversible oxidation [Xie et al., 1995]. Because of the susceptibility of the enzyme to react with oxidants and glutathione, NKA activity was found to be decreased in a number of pathological and physiological circumstances [Bogdanova et al., 2016], including chronic inflammation, which is associated with oxidative stress [Staroń, Mąkosa, & Koter‐Michalak, 2012].
ASD and Oxidative Stress
Our research team contributed to the recognition of oxidative stress as a distinctive feature of ASD [Ghezzo et al., 2013; Abruzzo et al., 2015] and described a marked reduction (to about 35% of control values) of NKA activity in erythrocytes from ASD children; a similar decrease in NKA activity in ASD subjects was also reported by Kurup & Kurup, 2003. It should be pointed out that, according to many recent studies, many neuropsychiatric disorders are de facto inflammatory disorders, although the particular mechanisms underlying this association are still under debate [Réus et al., 2015; Young et al., 2016]. Undoubtedly, neuroinflammation finds a correlate in oxidative stress [Emiliani, Sedlak, & Sawa, 2014].
The aim of the present work is to elucidate the mechanisms underlying the reduction in NKA activity observed in ASD children, with reference to the role of NKA in neuropsychiatric and neurodegenerative diseases.
Materials and Methods
Ethics Statement
The present study was conducted according to the guidelines laid down in the Declaration of Helsinki and approved by the Local Ethical Committee (Azienda USL Bologna, Imola, Ferrara, CE 13062, 23/12/2013; Prot. N.1198/CE).
Subjects
Twenty‐two children diagnosed with non‐syndromic ASD (17 males and 5 females, aged (mean ± SD) 7.75 ± 1.87 years, age range 5.25–11.08 years) and 21 typically developing children (14 males and 7 females, aged (mean ± SD) 9.44 ± 1.96 years, age range 5.25–11.83 years) were recruited by the Child Neuropsychiatric Unit of the Bellaria Hospital (IRCCS, Bologna). The patients underwent a clinical diagnostic assessment and a comprehensive neurological work up. The diagnostic evaluation performed by two expert child neuropsychiatrists included a clinical observation following DSM‐5 criteria (American Psychiatric Association, 2013), a standardized autism assessment by autism diagnostic observation schedule (ADOS) (Lord et al., 1999) and childhood autism rating scale (CARS) (Short & Schopler, 1988), and finally a cognitive functioning through Leiter‐R scale (Tsatsanis et al, 2003) for brief non verbal intelligence quotient (IQ) considering our sample language impairment. Any medical and neurological comorbidity was excluded by electroencephalography (recorded both awake and sleeping), cerebral magnetic resonance imaging, standard clinical and neurological examination and neurometabolic and genetic investigations (including 550 band karyotype, and molecular assay for Fragile X and MECP2). For the ASD group, CARS total scores ranged from mild to severe autistic features; developmental scores varied from normal IQ to severe cognitive impairment (Table 1a). Control typically developing (TD) children were recruited in the same local community and did not display any sign of cognitive, learning, and psychiatric involvement, as assessed by two expert child neuropsychiatrists (Table 1b). All subjects were on the typical Mediterranean diet and did not take any medication or dietary supplements in the 4 months preceding the biochemical and clinical evaluations. Dietary habits were assessed by a food questionnaire, according to the guidelines issued by the Emilia‐Romagna Health Authority. No ASD child was on a diet free of gluten or casein.
Table 1.
a. Demographic and Clinical Features of the ASD Children. b. Demographic Features of the Typically Developing Children
| a. Demographic and clinical features of the ASD children | |||||||||||
|---|---|---|---|---|---|---|---|---|---|---|---|
| No. | Gender | Age (months) | Onset pattern: 1 (early); 2 (regressive); 3 (mixed) | Brief non verbal IQ1 | ADOS score2 | CARS total score | CARS activity level item score | CARS body use (stereotypies) item score | CARS verbal communication item score | CARS non verbal communication item score | CARS total number of items whose score was ≥3 |
| 1 | m | 68 | 1 | 48 | 20 | 41.5 | 2.5 | 3 | 3 | 3 | 11 |
| 2 | m | 94 | 1 | 52 | 21 | 46 | 3.5 | 4 | 4 | 4 | 11 |
| 3 | f | 68 | 3 | 71 | 20 | 43.5 | 2.5 | 3 | 3.5 | 3 | 10 |
| 4 | m | 93 | 2 | 45 | 20 | 48.5 | 3 | 4 | 3.5 | 3 | 12 |
| 5 | m | 82 | 2 | 55 | 19 | 42 | 3 | 3 | 3 | 3 | 9 |
| 6 | m | 115 | 1 | 52 | 19 | 39.5 | 3 | 3 | 3 | 3 | 7 |
| 7 | m | 74 | 3 | 68 | 19 | 41 | 2.5 | 3 | 3 | 3 | 9 |
| 8 | m | 99 | 1 | 56 | 16 | 35 | 2.5 | 2 | 3 | 3 | 3 |
| 9 | m | 85 | 1 | 62 | 22 | 41 | 2.5 | 2 | 3 | 3 | 7 |
| 10 | f | 74 | 1 | 47 | 17 | 38 | 2 | 2.5 | 3 | 3 | 7 |
| 11 | f | 124 | 3 | 87 | 21 | 33.5 | 2 | 2 | 2.5 | 2.5 | 4 |
| 12 | m | 129 | 1 | 68 | 19 | 39 | 2 | 2.5 | 3 | 3 | 7 |
| 13 | m | 78 | 3 | 82 | 17 | 39 | 3 | 2.5 | 3 | 3 | 6 |
| 14 | m | 96 | 1 | 67 | 22 | 44 | 2.5 | 3 | 3 | 3 | 11 |
| 15 | m | 84 | 1 | 95 | 18 | 39.5 | 2.5 | 3 | 3 | 3 | 8 |
| 16 | m | 114 | 1 | 45 | 21 | 47 | 3 | 3.5 | 3.5 | 3 | 13 |
| 17 | m | 103 | 3 | 47 | 16 | 41.5 | 4 | 2 | 3 | 3 | 10 |
| 18 | m | 131 | 1 | 96 | 18 | 35 | 2 | 3 | 2.5 | 2.5 | 3 |
| 19 | f | 64 | 1 | 75 | 17 | 39.5 | 2.5 | 2.5 | 3.0 | 3.0 | 6.0 |
| 20 | f | 64 | 1 | 74 | 17 | 41.0 | 2.5 | 2.5 | 3.0 | 3.0 | 7.0 |
| 21 | m | 98 | 1 | 49 | 20 | 41 | 2 | 3.5 | 2.5 | 2 | 9 |
| 22 | m | 133 | 3 | 80 | 13 | 34 | 2 | 1.5 | 3 | 2.5 | 2 |
| b. Demographic features of the typically developing children | ||
|---|---|---|
| No. progr. | Gender | Age (months) |
| 1 | f | 140 |
| 2 | f | 74 |
| 3 | f | 97 |
| 4 | f | 93 |
| 5 | m | 142 |
| 6 | m | 127 |
| 7 | m | 116 |
| 8 | m | 142 |
| 9 | m | 135 |
| 10 | m | 63 |
| 11 | f | 125 |
| 12 | m | 115 |
| 13 | m | 115 |
| 14 | m | 125 |
| 15 | f | 102 |
| 16 | f | 120 |
| 17 | m | 101 |
| 18 | m | 130 |
| 19 | m | 123 |
| 20 | m | 136 |
| 21 | m | 65 |
The study was conducted according to the declaration of Helsinki guidelines and approved by Local Ethical Committee. Written consent was obtained from parents as well as from children through pictures and simplified information.
Cognitive level: ≥70, normal; 55–69, mild cognitive impairment; 44–54, moderate cognitive impairment; ≤39, severe cognitive impairment.
ADOS modules 1 or 2 (Total score autism cut off = 12).
Materials
All chemicals were analytical grade and were purchased from Sigma‐Aldrich (St. Louis MO), unless otherwise specified.
Protein Concentration
Protein concentration was determined as described by Bradford [1976], using serum albumin as a standard.
Blood and Urine Samples
Blood samples (~14 mL), obtained from ASD and TD children, were collected in Na2‐EDTA vacutainers. Basal hematological parameters were examined by routine laboratory techniques using 5 mL whole blood. Erythrocyte plasma membrane preparation was carried out using 1.5 mL of whole blood, according to the method described by Matte et al. [2013]. The remaining blood was centrifuged to separate the plasma, which was stocked at −80 °C. The cell suspension was separated by Ficoll density gradient to obtain mononuclear white blood cells (peripheral blood mononuclear cells [PBMC]). Spot urine samples were collected in sterile containers (FORMESA, Italy). Proteinuria and creatinine determinations were evaluated using standard laboratory techniques. The remaining urine was stored at −80 °C before the analytical evaluation of metal concentration.
NKA Activity Assay in PBMC
Na+/K+‐activated Mg2+‐dependent ATPase activity was determined in PBMC cell membranes, as previously reported [Ghezzo et al., 2013]. The results are expressed in μmol Pi/mg prot/h.
PBMC Plasma Membrane Fluidity
PBMC plasma membrane fluidity was evaluated as previously reported [Ghezzo et al., 2013].
Gene Expression
About 4*106 PBMC from 16 ASD and 17 TD children were lysed in 1 mL Trizol® Reagent (Invitrogen, Milan, Italy). Trizol‐extracted RNA was quality controlled and quantified as described by Abruzzo et al. [2013]. Quantitative real‐time polymerase chain reaction (RT‐PCR) was performed in a BioRad CFX96 real‐time thermal cycler using the SsoFast™ EvaGreen® Supermix (Bio‐Rad Laboratories, Hercules, CA). Custom‐designed primer sequences are reported in Supporting Information of Table S1. Using CFX Manager ™ Software (Bio‐Rad Laboratories) and qBaseplus (http://www.biogazelle.com), data were analyzed with the 2−ΔΔCT method, taking into account the efficiency of the real‐time PCR reaction between 95% and 105%. The stability of housekeeping genes was validated according to the criteria suggested by Vandesompele et al., 2002. RT‐PCR data are expressed as means ± confidence interval, where a significance level of 0.05 corresponds to the 95% confidence level.
Western Blot (WB) of NKA Subunits in Erythrocyte Plasma Membranes
Twenty μL of ghost suspension (~55 μg protein) were assessed. Technical details are reported in the Supporting Information section. Specific protein band density was quantified by means of BioRad GelDoc 2000 with reference to the fluorescence of each sample lane, generated by exposing the trihalo compounds in the membrane to UV.
Glutathionylation of Erythrocyte Plasma Membrane Proteins
The protocol described by Hill, Ramana, Cai, Bhatnagar, and Srivastava [2010], was applied with minor modifications. Electrophoresis was performed on precast gradient Mini‐PROTEAN TGX gels with 10 μL (~30 μg protein) of ghost suspension, solubilized 1 hr in ice bath in LN buffer (200 mM Tris–HCl, pH 6.8, 5% SDS, 25% glycerol, 0.04% Bromophenol blue, 25 mM N‐ethylmaleimide. Membranes were probed overnight at 4 °C with the monoclonal primary mouse antibody Glutathione‐D8 (Thermo Scientific, Rockford, IL) diluted 1:100 in 0.1%TBS‐Tween, then exposed to secondary antibody and quantified as described for NKA subunits.
Carbonyl Groups in Erythrocyte Plasma Membrane Proteins
Carbonyl groups were assessed with the OxyBlot™ Protein Oxidation Detection Kit (Millipore, USA & Canada) by using 5 μL of ghost preparation for each sample following the manufacturer's instructions. Protein carbonylation was quantified using actin as the loading control.
Metal Concentrations in Plasma and Urine
Urine and plasma samples (3 mL) were thawed and throughly mixed, then 7.5 mL of nitric acid were added in a screw cap polypropylene 50 mL sample tube (Digi‐Tubes SCP Science); samples were then placed in a Digi‐Prep system (SCP Science) at 75 °C overnight. After cooling, samples were diluted with 7.5 mL of deionized water (Evoqua Water Technologies, Barbsbuttel, DE), followed by a further 5x dilution with 1 N HCl. Analysis was carried out according to the method described in Galimberti et al. [2016], by using an inductively coupled plasma mass spectrometer (ICP/MS 7700, Agilent Technologies USA) coupled with an ASX‐500 CETAC Autosampler (Cetac Technologies, Omaha NE, USA). Metal concentration in urine was normalized by creatinine concentration.
Endogenous Ouabain Evaluation
Endogenous ouabain evaluation was possible only for a subgroup of subjects (TD N = 11; ASD N = 10), whose blood sample was large enough to allow for the recovery of an additional 350–450 μL plasma. As the quantification of endogenous ouabain required a minimum volume of 1.3 mL, three or four samples were randomly pooled in order to be able to analyze three pooled plasma samples from TD children and three from ASD children. The method is fully discussed in Ferrandi et al. [1997] and relies on a radioimmunoassay developed with a custom‐made rabbit polyclonal antiouabain antisera. Details are reported in the legend of Table 2.
Table 2.
Inhibitors of NKA Activity
| a. Plasma and urine concentration of inhibitory metals | |||
|---|---|---|---|
| Inhibitory metals | TD | ASD | P (Mann–Whitney) |
| Plasma concentration (μg/L), mean ± SD | |||
| Vanadium | 0.38 ± 0.19 | 0.39 ± 0.31 | 0.885 |
| Cadmium | 0.54 ± 0.14 | 0.52 ± 0.10 | 0.559 |
| Mercury | 0.55 ± 0.13 | 0.53 ± 0.11 | 0.587 |
| Urine concentration (μg/mg creatinine), mean ±SD | |||
| Vanadium | 2.90*E−4 ± 3.89*E−4 | 4.63*E−4 ± 4.78*E−4 | 0.204 |
| Cadmium | 7.26*E−4 ± 4.47*E−4 | 1.00*E−3 ± 7.01*E−4 | 0.133 |
| Mercury | 6.13*E−4 ± 3.83*E−4 | 5.73*E−4 ± 3.01*E−4 | 0.706 |
| b. Plasma concentration of endogenous ouabain | |||||
|---|---|---|---|---|---|
| TD | ASD | ||||
| Pool | Endogenous ouabain (nM) | Mean ±CV | Pool | Endogenous ouabain (nM) | Mean ±CV |
| A (4 subjects) | 0.263 | 0.270 ± 18.668 | D (3 subjects) | 0.292 | 0.270 ± 17.545 |
| B (4 subjects) | 0.212 | E (3 subjects) | 0.313 | ||
| C (3 subjects) | 0.335 | F (4 subjects) | 0.204 | ||
The vanadium signal was quantified at m/z 51 in He mode; cadmium signal at 111 m/z in He and mercury signal at 202 m/z in He. The calibration range was from 0.0025 to 25 μg/kg and limit of quantification (LOQ) for V was 0.001 μg/kg and 0.001 mg/kg for Cd and Hg. High purity deionized water was obtained by Evoqua Water Technologies (Barbsbuttel, DE); nitric acid was from J.T. Baker (Center Valley PA, USA). Plasma Endogenous Ouabain was determined by radioimmuneassay. Plasma was mixed overnight with 1:1 methanol to obtain protein precipitation. Protein‐depleted plasma was dried out with a speed vacuum concentrator. Dried samples were diluted in PBS and applied to a C18 column (Agilent Bond Elut C18 sample prep, Variant Ca, USA), then eluted with a gradient 0‐25% PBS:acetonitrile. Eluted Endogenous Ouabain was dried with a speed vacuum concentrator, then reconstituted in radioimmuneassay buffer; quantification was made with polyclonal rabbit antibody (DBA, Italy). Intra‐ and inter‐assay variability was <10%.
Cholesterol in Erythrocyte Plasma Membrane
Cholesterol was quantified by means of the Fluorimetric Cholesterol Quantification Kit (Sigma‐Aldrich) following the manufacturer's instructions, except that the chloroform:isopropanol:IGEPAL CA‐630 extraction step was omitted because the starting material was the ghost preparation. For each sample, 2.5 μL of ghost preparation was used in duplicate. A Perkin‐Elmer Victor two plate reader was used (A570) to evaluate total membrane cholesterol concentration, expressed as μg/μg of sample protein.
Phosphatidylserine in Erythrocyte Plasma Membrane
Phosphatidylserine was evaluated according to the method described by Morita et al. [2012]. Lipids were extracted from 30 μL of ghost preparation using the Lipid Extraction Kit (chloroform free) (BioVision Milpitas, CA). Lipid extracts were resuspended in 50 μL of aqueous solution of 1% Triton X‐100 (non‐ionic, viscous liquid, Roche). A Perkin‐Elmer Victor two plate reader was used (λex = 544/λem = 590 nm). Phosphatidylserine concentration is expressed as μg/μg of sample protein.
Phosphatidylcholine in Erythrocyte Plasma Membrane
Phosphatidylcholine was evaluated fluorimetrically using the Phosphatidylcholine Assay kit (Sigma‐Aldrich) according to the manufacturer's instructions. The ghost sample was diluted 1:25 and 2.5 μL/well were used, in duplicate. A Perkin‐Elmer Victor two plate reader was used to assess samples (λex = 535/λem = 587 nm). Phosphatidylcholine concentration is expressed as μg/μg of sample protein.
Statistical Analysis
Data were tested for normality using the D'Agostino‐Pearson test, following which appropriate parametric tests (Student's t for independent data) or the nonparametric equivalent (Mann–Whitney) were used. Parametric correlation (Pearson) was used to correlate clinical features and NKA gene expression data in the ASD group. Differences were considered significant at P < 0.05. To account for multiple testing we used the Benjamini and Hochberg false discovery rate (FDR). FDR corrected P‐values (pFDR) were evaluated separately for (a) comparisons of biochemical parameters in ASD and TD, (b) correlations of clinical features and NKA gene expression data in ASD group, and (c) correlations of NKA gene expression and NRF2 expression in ASD group. RT‐PCR data are expressed as means ± confidence interval, where a significance level of 0.05 corresponds to the 95% confidence level.
Results
Subjects
The age range of the two groups studied, TD and ASD children, was the same, but the individual ages were not matched, due to difficulties in sampling control subjects. For this reason, all results were evaluated for possible age‐dependence. For both groups of subjects, none of the results obtained in the present study were correlated with age.
NKA Activity and Plasma Membrane Fluidity in PBMC
NKA activity in PBMC from ASD children was significantly decreased in comparison with that of TD children (Fig. 1a). Values (mean ±SD) were 1.204 ±0.314 μmol Pi/mg prot/h for TD and 0.661 ±0.273 for ASD children, P = 0.0002 by Mann–Whitney, pFDR = 0.0048. NKA activity was not correlated with clinical features.
Figure 1.
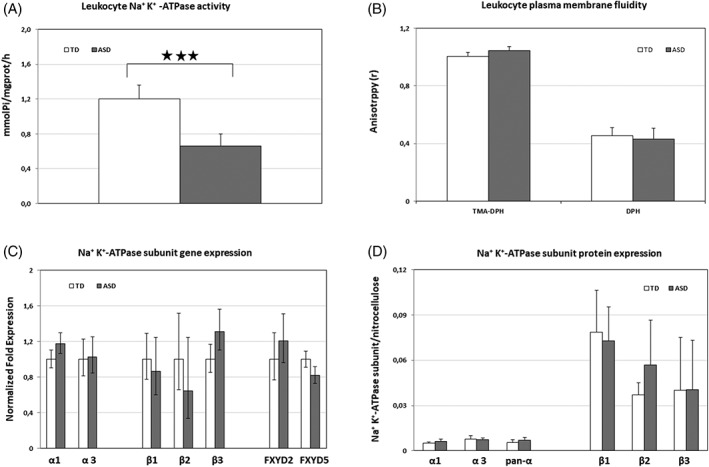
NKA activity, membrane fluidity, gene expression of NKA subunits in PBMC, and protein expression of NKA subunits in erythrocytes from TD and ASD children. A: NKA activity in PBMC from TD and ASD children. B: Plasma membrane fluidity of PBMC from TD and ASD children. The fluorescence anisotropy of the probes TMA‐DPH and DPH, which localize in the outer and the inner leaflet of cell membrane, respectively, is inversely related to the fluidity of the microenvironment in which the probes are located. C: Gene expression of NKA subunits in PBMC from TD and ASD children. For each subunit mRNA, expression level is set to 1 for TD mRNA. Histograms show the mean ± confidence. Primer details are reported in Supporting Information of Table S1. D: Protein expression of NKA subunits in plasma membrane erythrocytes from TD and ASD children. Histograms show the target protein/total lane fluorescence ratio in the nitrocellulose membrane (mean ± SD); 3 stars = P < 0.001.
The decrease of NKA activity in PBMC of ASD children was not associated with differences in PBMC plasma membrane fluidity (Fig. 1b), at variance with previous results found for erythrocytes, where a marked decrease in NKA activity was accompanied by a significant decrease in membrane fluidity [Ghezzo et al., 2013].
Gene Expression in PBMC
Gene expression of isoforms α1, α2, α3, β1, β2, β3, FXYD2, FYXD5, and of Nuclear factor (erythroid‐derived 2)‐like 2 (NRF2) was evaluated in PBMC from 16 ASD and 17 TD children. The expression of isoform α2 was below the detection level; among the detectable isoforms, β2 was the least expressed. PBMC from ASD children were found to express higher levels of mRNA for the isoforms α1 (+19%) and β3 (+31%) and lower levels for FXYD5 (−18%) than PBMC from TD children (Fig. 1c). NRF2 mRNA expression was found to be 1.56 times greater in ASD than TD children (95% CI 0.953–2.418, P < 0.05). Significance was lost after correction for multiple measurements.
Protein Expression of NKA Subunits and Actin in Erythrocyte Membranes
NKA subunit protein expression was evaluated by WB using UV‐exposed TGX gels fluorescence, proportional to the protein loaded in each lane, as the loading control. For all proteins examined, representative pictures of gels, nitrocellulose membranes, and target‐specific bands are shown in Figure. S1 a–f. Figure 1d shows the histograms representing target protein to total lane fluorescence ratio in the nitrocellulose membrane (mean ±SD).
Beta‐actin is the most widely used loading control for Western Blotting, however, we chose TGX gel fluorescence based on the observation reported by Cortelazzo et al. [2014], who found that erythrocytes from children affected by Rett syndrome (a monogenic disease where subjects display autistic features) had decreased β‐actin content, as compared to healthy children. However, our results showed no difference in β‐actin content between TD and ASD children (Fig. 2a–c). This result allowed us to use β‐actin as loading control when assessing protein carbonylation (see below).
Figure 2.
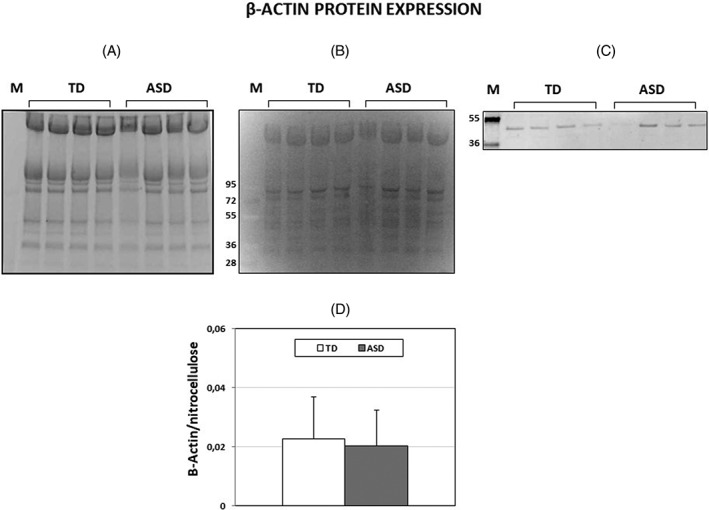
Beta‐actin protein expression in erythrocytes from TD and ASD children. A: A representative SDS‐Gel electrophoresis of ghost samples. Precast Mini‐PROTEAN TGX stain‐free protein gel, 4–15% polyacrylamide gels were used. B: Nitrocellulose membrane blotted from the gel of Figure 2A. The fluorescence produced under UV light by trihalo compounds is proportional to the total protein. Samples from TD erythrocytes were run in lanes 1–4, samples from ASD erythrocytes were run in lanes 5–8. Lane M: M.W. markers. C: Beta‐actin bands developed from the membrane by an anti‐actin antibody marked with Cy5 (see Supporting Information of Table S2). D: Histogram showing means ± SD. of β‐actin/total lane fluorescence ratio.
Both the α and β subunits of erythrocyte NKA were difficult to detect, as already stressed by Arystarkhova and Sweadner [1997]. In particular, α1 and α3 subunits, expected to appear as bands at MW 112 and 110 kDa, respectively, stained at approximately MW 95 kDa (Fig. S1a and b). For this reason, a pan‐alpha antibody was additionally used in the attempt to improve the detection of α subunits. As shown in Figure S1c, such antibody stained the same band at apparent MW 95 kDa, as expected according to the antibody manufacturer; however, the band was as faint as those detected by antibodies directed against the α1 and α3 subunits. Moreover, a number of aspecific bands were consistently stained at different MWs.
The datasheet for the β1 antibody shows a single band around 42 kDa for liver and a band around 55 kDa for kidney; the datasheet for the β2 antibody shows a single band at 37.84 kDa; the datasheet for the β3 antibody shows a smear between 40 and 60 kDa. However, in our assays, all β subunits displayed multiple bands in the MW range of 34–60 kDa, probably owing to different levels of glycosylation, and appeared as rather faint bands (Fig. S1d–f). The optical densities of these multiple bands were summed for the evaluation of protein expression. Noteworthy, although we used the same primary antibodies used by Hoffman et al. [2002], when commercially available, our WB patterns differed from theirs, probably owing to the fact that we did not extract bulk purified NKA proteins, but rather, compared the protein expression of single subunits in children erythrocytes.
An attempt to quantify FXYD2 was carried out, but the very low MW of the protein (7 kDa), together with its low amount, did not allow for a reliable quantification by WB; FXYD5 is expected to have a very low expression in erythrocytes (http://biogps.org/%23goto=genereport&id=53827).
With the above‐mentioned caveats, our data appear to suggest that the protein expression level of α3 subunits and of β1, β2, and β3 subunits of NKA did not differ between erythrocytes from TD and ASD children, whereas α1 appeared to be 1.2‐fold increase in ASD samples (the difference was not statistically significant after correction for multiple measurements) (Fig. 1d).
Oxidative Modifications of Plasma Membrane Proteins
The evaluation of glutathionylation and carbonylation of plasma proteins, two relevant protein modifications due to oxidative stress, was carried out on whole extracts of erythrocyte membrane proteins. Glutathione‐protein complexes were quantified relative to the lane fluorescence in nitrocellulose membranes (Fig. 3a). Protein carbonyl groups were quantified relative to the actin band density (Fig. 3b). No difference in the amount of glutathione‐protein complexes and in carbonylated protein residues was found in erythrocyte membranes of TD and ASD children. Representative gels are shown in Figure S2a and b.
Figure 3.
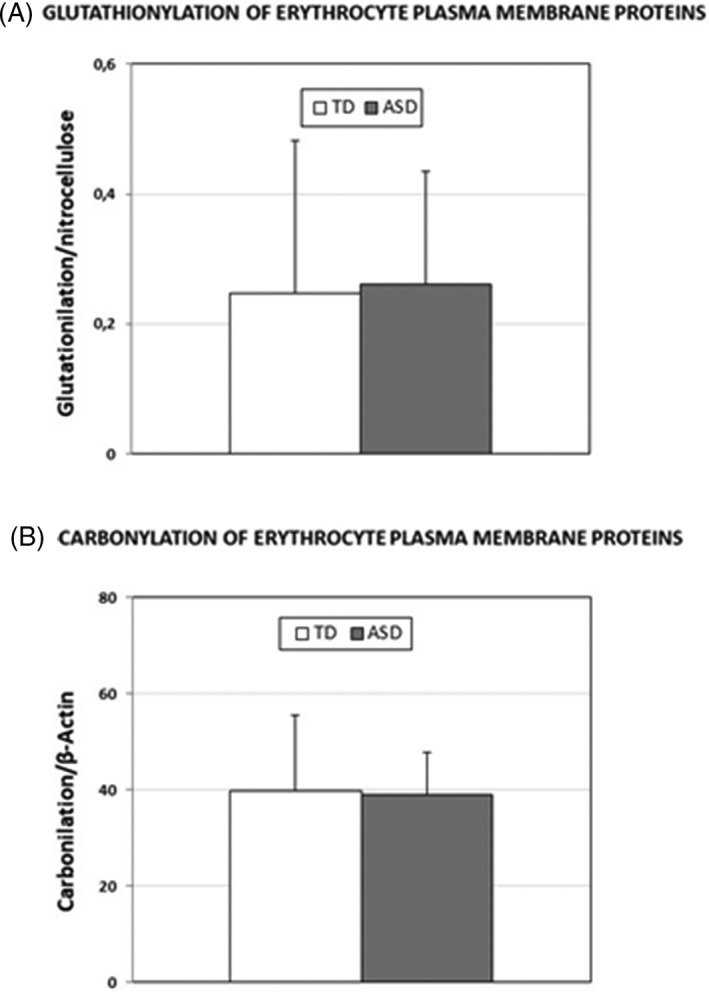
Glutathione‐protein complexes and carbonylated protein residues in erythrocyte membranes from TD and ASD children. A: Glutathione‐protein complexes in erythrocyte membranes from TD and ASD children were detected by immunoblotting on membranes transferred from TGX gels and quantified relative to the lane fluorescence in nitrocellulose membranes (Means ± SD). B: Carbonylated protein residues in erythrocyte membranes from TD and ASD children were immunodetected following their derivatization with DNPH and quantified relative to the actin band density (Means ± SD).
Metal Concentration in Plasma and Urine
We evaluated the plasma and urine concentration of vanadium, cadmium, and mercury, which are thought to inhibit NKA activity [North & Post, 1984; Ehrenspeck, 1980; Vasić et al., 2002]. No difference was found in their concentration between TD and ASD children (Table 2a).
Endogenous Ouabain Evaluation
The analysis of the three pooled plasma samples from ASD and from TD children yielded the same mean and coefficient of variation for the two groups. Data are reported in Table 2b.
Lipids in Erythrocyte Membranes
Although differences in the composition of erythrocyte membrane fatty acids between ASD and TD children was reported previously [Ghezzo et al., 2013], differences in cholesterol, phosphatidylserine, and phosphatidylcholine were assessed in the present work; the choice of lipids is related to their regulatory role on NKA activity [Cornelius et al., 2015]. Data, shown in Figure 4a–c, demonstrate that cholesterol is decreased in erythrocyte membranes from ASD children, whereas no difference was found for PS and PC. After correction for multiple measurements, the difference in cholesterol concentration lost statistical significance.
Figure 4.
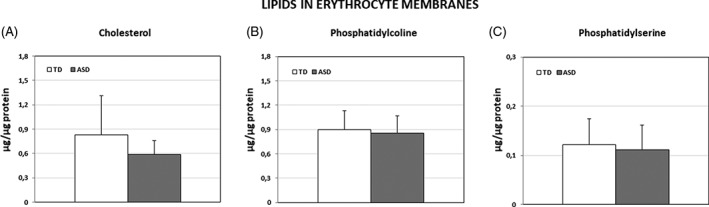
Concentration of selected lipids in erythrocyte membranes from TD and ASD children (μg /μg of sample protein). A: Cholesterol (mean ± SD). B: Phosphatidylcholine (mean ± SD). C: Phosphatidylserine (mean ± SD).
Statistics and Correlation with Clinical Data
Table 3 reports the correlations between NKA subunit or NRF2 gene expression and clinical features. Alpha and Beta NKA subunit gene expression correlated with CARS total scores and with some clinical features. Correlations of NRF2 gene expression and the expression of some NKA subunits are shown in Figure 5.
Table 3.
Gene Expression Fold Change and Correlations With Clinical Features
| Fold change (ratio ASD/TD) | CARS total score | CARS activity level item score | CARS body use (stereotypies) item score | Brief non‐verbal IQ | |
|---|---|---|---|---|---|
| NKA Alpha 1 subunit | 1.18 | P = 0.0004 | P = 0.0076 | P = 0.0038 | P = 0.031 |
| R = 0.78 | R = 0.63 | R = 0.68 | R = 0.54 | ||
| pFDR = 0.0042 | pFDR = 0.02 | pFDR = 0.02 | pFDR = 0.07 | ||
| NKA Alpha 3 subunit | 1.03 | P = 0.0013 | P = 0.011 | P = 0.045 | P = 0.0061 |
| R = 0.73 | R = 0.62 | R = 0.50 | R = 0.68 | ||
| pFDR = 0.010 | pFDR = 0.03 | pFDR = 0.08 | pFDR = 0.02 | ||
| NKA Beta 1 subunit | 0.86 | P < 0.0001 | P = 0.0003 | P = 0.0040 | P = 0.07 |
| R = 0.84 | R = 0.79 | R = 0.68 | R = 0.45 | ||
| pFDR = 0.0032 | pFDR = 0.0048 | pFDR = 0.018 | |||
| NKA Beta 2 subunit | 0.65 | P = 0.0063 | P = 0.0029 | P = 0.037 | P = 0.09 |
| R = 0.65 | R = 0.69 | R = 0.50 | R = 0.42 | ||
| pFDR = 0.02 | pFDR = 0.018 | pFDR = 0.07 | |||
| NKA Beta 3 subunit | 1.31 | P = 0.024 | P = 0.163 | P = 0.141 | P = 0.025 |
| R = 0.56 | R = 0.36 | R = 0.38 | R = 0.55 | ||
| pFDR = 0.06 | pFDR = 0.06 | ||||
| NKA FXYD2 subunit | 1.21 | P = 0.22 | P = 0.144 | P = 0.62 | P = 0.81 |
| R = 0.32 | R = 0.38 | R = 0.13 | R = 0.03 | ||
| NKA FXYD5 subunit | 0.82 | P = 0.079 | P = 0.131 | P = 0.31 | P = 0.11 |
| R = 0.45 | R = 0.39 | R = 0.26 | R = 0.41 | ||
| NRF2 | 1.56 | P = 0.022 | P = 0.044 | P = 0.72 | P = 0.38 |
| R = 0.56 | R = 0.51 | R = 0.09 | R = 0.23 | ||
| pFDR = 0.06 | pFDR = 0.09 |
Statistically significant values are shown in bold.
Figure 5.
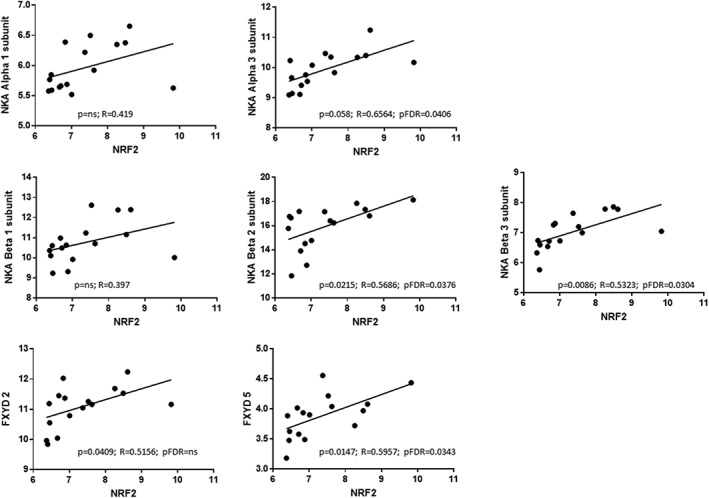
Correlation between gene expression of NRF2 and NKA subunits. pFDR = Benjamini–Hochberg FDR corrected P values.
Discussion
Non‐syndromic autism is a complex neurodevelopmental disorder resulting from a combination of genetic and environmental factors [Lai, Lombardo, & Baron‐Cohen, 2014]. No peripheral ASD biomarkers have thus far been validated [Abruzzo et al., 2015], however, erythrocyte NKA activity appears very promising in terms of specificity and sensitivity providing motivation for the present study seeking to elucidate mechanism(s) responsible for the marked reduction in NKA activity in erythrocytes of ASD children and to determine, ultimately, whether this plays a role in the etiopathology of non‐syndromic ASD.
Although our results extended to PBMC confirm the marked reduction in NKA activity previously reported for erythrocytes [Ghezzo et al., 2013], understanding the underlying mechanisms proved very demanding and elusive. Gene expression of NKA subunits expressed in PBMC was slightly unbalanced in favor of the α1 and the β3 isoforms in ASD and of the FXYD‐5 isoform in TD subjects. However, the assessment of protein expression of the NKA subunits, estimated in erythrocyte membranes, did not convincingly support the gene expression data, either because of differences between erythrocyte and PBMC isoform preferences [Clausen et al., 2017] or perhaps owing to the poor performance of commercial antibodies. On the other hand, gene expression values of NKA subunits were correlated with clinical data, thus suggesting that the unbalance in the ASD group was not incidental.
The choice of expressed NKA subunits may be important for tissue function [Matchkov & Krivoi, 2016]. In fact, the individual α, β, and FXYD isoforms are characterized not only by different tissue expression but also by different kinetic/functional properties and by the ability to interact with tissue‐specific proteins. For example, the α3 isoform is more expressed in neurons and the α2 isoform in glial cells; neurons mainly display β1 and β2 isoforms, whereas astrocytes, oligodendrocytes, and retinal photoreceptors preferentially express β3. Moreover, development‐dependent shifts in isoform expression have been reported: for instance, developing rat brain cells express more of the α2 isoform whereas adult rat brain cells express more of the α3 isoform [Blanco, 2005]. In addition, changes in isoform expression, as well as in ouabain sensitivity, have been reported to occur in the aging brain of the rat [reviewed in de Lores Arnaiz & Ordieres, 2014]. Likewise, the above‐described differences in isoform preferences found in PBMC may play a role in NKA activity but may or may not reflect similar differences in brain cells that would affect their function.
Next, we concentrated on the possibility that NKA activity was impaired by oxidative stress, which is now recognized as a distinctive trait of ASD [reviewed in Rossignol & Frye, 2014]. To support the evidence of oxidative stress, gene expression of NRF2, a transcription factor triggered by oxidative stress and inducing antioxidant proteins, was evaluated; although it increased 1.56‐fold in the PBMC of the ASD children examined here, the difference lost significance after FDR analysis. Whereas all NKA subunits are potentially subject to [inhibitory] oxidative modifications, the subunit more susceptible to irreversible oxidation [Xie et al., 1995] is the α2 isoform, which is richer in cysteine residues but is not expressed in blood cells. Although we did not observe an increase in oxidative modifications of ASD erythrocytes’ membrane proteins, subunit‐specific differences might have gone undetected due to the fact that we assessed whole extracts of the membrane. However, we decided against enriching our extracts by immunoprecipitation of NKA subunits, due to the low amount of each subunit and a lack of confidence in the specificity of the commercially available antibodies.
Many investigations of the environmental concauses of ASD have reported an increase of toxic metals in biological tissues and fluids of ASD patients [reviewed by Kalkbrenner, Schmidt, & Penlesky, 2014; Rossignol, Genuis, & Frye, 2014], and attention was drawn in particular to heavy metals such as mercury, lead and cadmium, whereas vanadium was not mentioned. As vanadium, mercury, and cadmium are known inhibitors of NKA activity [North & Post, 1984; Ehrenspeck, 1980; Vasić et al., 2002], we evaluated the concentration of these metals in plasma and urine samples. In particular, 3 mL of plasma were used to increase the reliability of the detection, but no differences were found between TD and ASD samples.
In humans, all NKA isozymes are sensitive to ouabain, whereas the sensitivity to digoxin is more isozyme‐selective. In addition, it has been shown that ouabain and digoxin or digitoxin can have opposite effects on blood pressure [Manunta, Hamilton, Rogowski, Hamilton, & Hamlyn, 2000; Zulian et al., 2013]. Endogenous ouabain levels in blood plasma had never been evaluated in ASD patients. Our results showed no difference in the plasma levels of this potent inhibitor of NKA activity between TD and ASD subjects.
We observed a decrease of plasma membrane cholesterol in the erythrocytes from ASD children, thus confirming a previous finding by Schengrund, Ali‐Rahmani, and Ramer [2012], who also observed a decrease in monosialotetrahexosylganglioside (GM1) content, and no difference in phosphatidylcholine and phosphatidylserine content. Petrov, Kasimov, and Zefirov [2017] recently pointed out that cholesterol dysfunctions have been detected in many neurodegenerative disorders, however neither Schengrund’ or Petrov’ groups related these findings to NKA activity. Membrane lipid moiety plays a very important regulatory role on NKA, as pointed out by Cornelius et al. [2015] and Habeck et al. [2015], who in particular draw attention to cholesterol and phosphatidylserine for their stabilization roles and to sphingomyelin and phosphatidylcholine for their inhibitory functions. In particular, cholesterol specifically binds to three different NKA lipid‐binding sites. Omega‐3 lipids, and notably DHA, tend to inhibit NKA activity, especially in cholesterol‐poor membranes. Noteworthy, Cornelius et al. stressed that, because cholesterol does not mix well with DHA, the effect of the two lipids on the conformation of NKA is the opposite; cholesterol increases the lateral pressure in the middle of the bilayer and decreases it near the interfaces, whereas DHA has the opposite effects. Because erythrocyte membranes from ASD patients show depleted DHA [Ghezzo et al., 2013; Giacometti et al., 2017], the effect of a relative depletion in both cholesterol and DHA could have on NKA activity may be worth examining in a future work. Likewise, contrary to what we have observed, in kidney cells a decrease in membrane cholesterol was reported to cause a reduction in α1 expression and viceversa [Chen et al., 2011]. NAK activity is impaired in both PBMC and erythrocytes, yet we showed that only erythrocytes display a decrease in membrane fluidity. In order to help to resolve these seemingly discrepant results, we suggest that future studies compare the lipid composition of TD and ASD PBMC membranes .
The observed reduction in NKA activity in erythrocytes from ASD patients apparently does not impact some important cellular functions; in particular, no impairment in immune functions or in oxygen transport or delivery has been reported. However, blood cells may be just the peripheral spyhole on events occurring in the central nervous system, where the relevance of NKA activity cannot be underestimated. NKA plays a crucial role in the maintenance and propagation of the action potential, controls glutamate release in spinal cord [Li & Stys, 2001], mediates glutamate transporter activity [Rose et al., 2009], affects dopamine receptor densities [Hazelwood, Free, Cabrera, Skinbjerg, & Sibley, 2008], regulates ionotropic glutamatergic AMPA receptor turnover [Zhang et al., 2009], interacts with δ‐opioid receptor [Deng et al., 2009] and with adenosine A2A receptors controlling glutamate uptake in astrocytes [Matos, Augusto, Agostinho, Cunha, & Chen, 2013]. Findings of decreased brain NKA activity in aging and in many pathological conditions have been reviewed by de Lores Arnaiz et al., (2014), who pointed out that there may be as many mechanisms leading to NKA activity impairment as there are pathological conditions where NKA activity is depressed. Taken as a whole, these findings underscore the relevance of the impairment of NKA activity in neuropsychiatric disorders.
Declaration
The authors declare the absence of conflicts of interest.
List of abbreviations
- ASD
autism spectrum disorders
- CTS
cardiotonic steroids
- MW
molecular weight
- NKA
Na+, K+‐ATPase
- PBMC
peripheral blood mononuclear cells
- NRF2
nuclear factor (erythroid‐derived 2)‐like 2
- RT‐PCR
real‐time polymerase chain reaction
- TD
typically developing
- WB
western blot
- DSM‐5
diagnostic and statistical manual of mental disorders‐fifth edition
- ADOS
autism diagnostic observation schedule
- CARS
childhood autism rating scale
- IQ
intelligence quotient
- MECP2
methyl‐CpG binding protein 2
Supporting information
Table S1: Primer sequences and amplicon length of the genes studied by qRT‐PCR
Table S2: Primary and secondary antibodies used in WBs
Figure S1. NKA subunit expression in erythrocyte membranes. Representative pictures of gels, nitrocellulose membranes and Western Blots. TD erythrocytes: lanes 1–4; ASD erythrocytes: lanes 5–8. M: MW markers. a: Anti‐alpha 1 subunit antibody; b: Anti‐alpha 3 subunit antibody; c: Anti‐pan alpha subunit antibody; d: Anti‐beta 1 subunit antibody; e: Anti‐beta 2 subunit antibody; f: Anti‐beta 3 subunit antibody. Details of antibodies are reported in Table S2 and histograms in Figure 1D. Ghost suspensions were solubilized 1 hr in ice bath in Laemmli buffer 4x. Precast gradient gels (Mini‐PROTEAN TGX Stain‐Free Protein Gel, 4–15% polyacrylamide, Bio‐Rad Laboratories, Hercules, CA) and Bio‐Rad nitrocellulose membranes were used. After blocking in Tris‐Buffered Saline containing 0.05% Tween‐20 (TBS‐T) and 1% BSA for 1 h at room temperature, membranes were probed overnight at 4 °C with primary antibodies, washed three times with TBS‐T and incubated with Cy5‐conjugated secondary antibodies, dissolved in TBS‐Tween and 0.2% BSA. TGX gels contain trihalo compounds, which, under UV‐light, react with tryptophan residues producing fluorescence, proportional to the total protein amount. Although the ratio gel‐to‐membrane fluorescence did not substantially differ from one lane to the next, the membrane fluorescence was considered to be more representative and used as loading control.
Figure S2. a: A representative gel and its nitrocellulose membrane of glutathione‐protein complexes in erythrocyte membranes from TD and ASD children. TGX gels were exposed to UV light and then electroblotted. Membranes were probed overnight at 4 °C with the monoclonal primary mouse antibody Glutathione‐D8 (Thermo Scientific, Rockford, IL) diluted 1:100 in 0.1%TBS‐Tween, then exposed to secondary antibody. The lane fluorescence was used for quantification of the glutathione‐protein complexes (Fig. 2a). Samples from TD erythrocytes were run in lanes 1–4, samples from ASD erythrocytes were run in lanes 5–8. Lane M: MW markers. b: A representative gel reacted with anti‐DPNH antibody to detect carbonylated protein residues in erythrocyte membranes from TD and ASD children. Each sample was DNPH‐derivatized (D) (lanes 1, 3, 5, and 7) or not derivatized (ND)(lanes 2,4, 6, and 8). Lanes 1–4: samples from TD erythrocytes; lanes 5–8: samples from ASD erythrocytes; lane DM: DPNH‐derivatized MW markers. On the right, a detail showing the β‐actin bands, where HPRT‐conjugated secondary antibody was used (See Table S2). Protein carbonyl groups in DNPH‐derivatized lanes were quantified relative to their actin band density (Fig. 2b).
Acknowledgments
The authors are deeply indebted to the families and the children who participated to this study, to the IRCCS nursing staff, and to ANGSA (Associazione Nazionale Genitori Soggetti Autistici), which made this study possible.
References
- Abruzzo, P. M. , Ghezzo, A. , Bolotta, A. , Ferreri, C. , Minguzzi, R. , Vignini, A. , … Marini, M. (2015). Perspective biological markers for autism spectrum disorders: Advantages of the use of receiver operating characteristic curves in evaluating marker sensitivity and specificity. Disease Markers, 2015, 329607–329615. 10.1155/2015/329607. [DOI] [PMC free article] [PubMed] [Google Scholar]
- Abruzzo, P. M. , Marini, M. , Bolotta, A. , Malisardi, G. , Manfredini, S. , Ghezzo, A. , … Casadio, R. (2013). Frataxin mRNA isoforms in FRDA patients and normal subjects: Effect of tocotrienol supplementation. BioMed Research International, 2013, 276808–276809. 10.1155/2013/276808. [DOI] [PMC free article] [PubMed] [Google Scholar]
- APA (American Psychiatric Association). (2013). Diagnostic and statistical manual of mental disorders 5th ed. Arlington, VA: American Psychiatric Association. [Google Scholar]
- Arystarkhova, E. , & Sweadner, K. J. (1997). Tissue‐specific expression of the Na,K‐ATPase beta3 subunit. The presence of beta3 in lung and liver addresses the problem of the missing subunit. The Journal of Biological Chemistry, 272(36), 22405–22408. [DOI] [PubMed] [Google Scholar]
- Blanco, G. (2005). Na,K‐ATPase subunit heterogeneity as a mechanism for tissue‐specific ion regulation. Seminars in Nephrology, 25(5), 292–303. [DOI] [PubMed] [Google Scholar]
- Blasiak, J. (1995). Cooperative binding of the organophosphate Paraoxon to the (Na+ K)‐ATPase. Zeitschrift für Naturforschung. Section C, 50(9–10), 660–663. [DOI] [PubMed] [Google Scholar]
- Bogdanova, A. , Petrushanko, I. Y. , Hernansanz‐Agustín, P. , & Martínez‐Ruiz, A. (2016). "Oxygen Sensing" by Na,K‐ATPase: These miraculous thiols. Frontiers in Physiology, 7, 314 10.3389/fphys.2016.00314. [DOI] [PMC free article] [PubMed] [Google Scholar]
- Bradford, M. (1976). A rapid and sensitive method for quantification of microgram quantities of protein utilizing the principle of protein‐dye binding. Analytical Biochemistry, 72, 248–254. [DOI] [PubMed] [Google Scholar]
- Chen, Y. , Li, X. , Ye, Q. , Tian, J. , Jing, R. , & Xie, Z. (2011). Regulation of alpha1 Na/K‐ATPase expression by cholesterol. The Journal of Biological Chemistry, 286(17), 15517–15524. 10.1074/jbc.M110.204396. [DOI] [PMC free article] [PubMed] [Google Scholar]
- Clausen, M. V. , Hilbers, F. , & Poulsen, H. (2017). The structure and function of the Na,K‐ATPase isoforms in health and disease. Frontiers in Physiology, 8, 371 10.3389/fphys.2017.00371. [DOI] [PMC free article] [PubMed] [Google Scholar]
- Cornelius, F. , Habeck, M. , Kanai, R. , Toyoshima, C. , & Karlish, S. J. D. (2015). General and specific lipid‐protein interactions in Na,K‐ATPse. Biochimica et Biophysica Acta, 1848(9), 1729–1743. 10.1016/j.bbamem.2015.03.012. [DOI] [PubMed] [Google Scholar]
- Cortelazzo, A. , De Felice, C. , Pecorelli, A. , Belmonte, G. , Signorini, C. , Leoncini, S. , … Hayek, J. (2014). Beta‐actin deficiency with oxidative posttranslational modifications in Rett syndrome erythrocytes: Insights into an altered cytoskeletal organization. PLoS One, 9(3), e93181 10.1371/journal.pone.0093181. [DOI] [PMC free article] [PubMed] [Google Scholar]
- de Lores Arnaiz, G. R. , & Ordieres, M. G. (2014). Brain Na(+), K(+)‐ATPase activity in aging and disease. International Journal of Biomedical Sciences, 10(2), 85–102. [PMC free article] [PubMed] [Google Scholar]
- Deng, H. , Yang, Z. , Li, Y. , Bao, G. , Friedrich, T. , Gu, Q. , … Schwarz, W. (2009). Interactions of Na+,K+‐ATPase and co‐expressed δ‐opioid receptor. Neuroscience Research, 65, 222–227. [DOI] [PubMed] [Google Scholar]
- Ehrenspeck, G. (1980). Vanadate‐induced inhibition of sodium transport and of sodium‐independent anion transport in turtle bladder. Biochimica et Biophysica Acta, 601(2), 427–432. [DOI] [PubMed] [Google Scholar]
- Emiliani, F. E. , Sedlak, T. W. , & Sawa, A. (2014). Oxidative stress and schizophrenia: Recent breakthroughs from an old story. Current Opinion in Psychiatry, 27(3), 185–190. 10.1097/YCO.0000000000000054. [DOI] [PMC free article] [PubMed] [Google Scholar]
- Ferrandi, M. , Manunta, P. , Balzan, S. , Hamlyn, J. M. , Bianchi, G. , & Ferrari, P. (1997). Ouabain‐like factor quantification in mammalian tissues and plasma: Comparison of two independent assays. Hypertension, 30(4), 886–896. [DOI] [PubMed] [Google Scholar]
- Fuller, W. , Tulloch, L. B. , Shattock, M. J. , Calaghan, S. C. , Howie, J. , & Wypijewski, K. J. (2013). Regulation of the cardiac sodium pump. Cellular and Molecular Life Sciences, 70(8), 1357–1380. 10.1007/s00018-012-1134-y. [DOI] [PMC free article] [PubMed] [Google Scholar]
- Galimberti, C. , Corti, I. , Cressoni, M. , Moretti, V. M. , Menotta, S. , Galli, U. , & Cambiaghi, D. (2016). Evaluation of mercury, cadmium and lead levels in fish and fishery products imported by air in North Italy from extra‐European Union countries. Food Control, 60, 329–337. [Google Scholar]
- Ghezzo, A. , Visconti, P. , Abruzzo, P. M. , Bolotta, A. , Ferreri, C. , Gobbi, G. , … Mazzanti, L. (2013). Oxidative stress and erythrocyte membrane alterations in children with autism: Correlation with clinical features. PLoS One, 8(6), e66418. 10.1371/journal.pone.0066418. [DOI] [PMC free article] [PubMed] [Google Scholar]
- Giacometti, G. , Ferreri, C. , Sansone, A. , Chatgilialoglu, C. , Marzetti, C. , Spyratou, E. , … Visconti, P. (2017). High predictive values of RBC membrane‐based diagnostics by biophotonics in an integrated approach for Autism Spectrum Disorders. Scientific Reports, 7(1), 9854 10.1038/s41598-017-10361-7. [DOI] [PMC free article] [PubMed] [Google Scholar]
- Goldstein, I. , Levy, T. , Galili, D. , Ovadia, H. , Yirmiya, R. , Rosen, H. , & Lichtstein, D. (2006). Involvement of Na+, K+‐ATPase and endogenous digitalis‐like compounds in depressive disorders. Biological Psychiatry, 60(5), 491–499. [DOI] [PubMed] [Google Scholar]
- Habeck, M. , Haviv, H. , Katz, A. , Kapri‐Pardes, E. , Ayciriex, S. , Shevchenko, A. , … Karlish, S. J. D. (2015). Stimulation, inhibition, or stabilization of Na,K‐ATPase caused by specific lipid interactions at distinct sites. The Journal of Biological Chemistry, 290(8), 4829–4842. 10.1074/jbc.M114.611384. [DOI] [PMC free article] [PubMed] [Google Scholar]
- Hazelwood, L. A. , Free, R. B. , Cabrera, D. M. , Skinbjerg, M. , & Sibley, D. R. (2008). Reciprocal modulation of function between the D1 and D2 dopamine receptors and the Na+,K+‐ATPase. The Journal of Biological Chemistry, 283, 36441–36453. [DOI] [PMC free article] [PubMed] [Google Scholar]
- Hill, B. G. , Ramana, K. V. , Cai, J. , Bhatnagar, A. , & Srivastava, S. K. (2010). Measurement and identification of S‐glutathiolated proteins. Methods in Enzymology, 473, 179–197. 10.1016/S0076-6879(10)73009-3. [DOI] [PMC free article] [PubMed] [Google Scholar]
- Hoffman, J. F. , Wickrema, A. , Potapova, O. , Milanick, M. , & Yingst, D. R. (2002). Na pump isoforms in human erythroid progenitor cells and mature erythrocytes. Proceedings of the National Academy of Sciences of the United States of America, 99(22), 14572–14577. [DOI] [PMC free article] [PubMed] [Google Scholar]
- Jovanović, D. , Vasić, V. , Nikolic, V. , Ćetković, S. , & Nikezić, G. (2000). Effect of the organophosphate chlorpyrifos on the SPMs Na+,K+‐ATPase and Mg2+‐ATPase. Arch. Toxicol. Kinet. Xenobiot. Metab., 8(3), 152–154. [Google Scholar]
- Kalkbrenner, A. E. , Schmidt, R. J. , & Penlesky, A. C. (2014). Environmental chemical exposures and autism spectrum disorders: A review of the epidemiological evidence. Current Problems in Pediatric and Adolescent Health Care, 44(10), 277–318. 10.1016/j.cppeds.2014.06.001. [DOI] [PMC free article] [PubMed] [Google Scholar]
- Kurup, R. K. , & Kurup, P. A. (2003). A hypothalamic digoxin‐mediated model for autism. The International Journal of Neuroscience, 113(11), 1537–1559. [DOI] [PubMed] [Google Scholar]
- Lai, M. C. , Lombardo, M. V. , & Baron‐Cohen, S. (2014). Autism. Lancet, 383(9920), 896–910. 10.1016/S0140-6736(13)61539-1. [DOI] [PubMed] [Google Scholar]
- Li, S. , & Stys, P. K. (2001). Na+‐K+‐ATPase inhibition and depolarization induce glutamate release via reverse Na+‐dependent transport in spinal cord white matter. Neuroscience, 107, 675–683. [DOI] [PubMed] [Google Scholar]
- Lubarski, I. , Pihakaski‐Maunsbach, K. , Karlish, S. J. , Maunsbach, A. B. , & Garty, H. (2005). Interaction with the Na,K‐ATPase and tissue distribution of FXYD5 (related to ion channel). The Journal of Biological Chemistry, 280(45), 37717–37724. [DOI] [PubMed] [Google Scholar]
- Lord, C. , Risi, S. , Lambrecht, L. , Cook, E. H. Jr , Leventhal, B. L. , DiLavore, P. C. , Pickles, A. , Rutter, M. (2000). The Autism Diagnostic Observation Schedule–Generic: A Standard Measure of Social and Communication Deficits Associated with the Spectrum of Autism. J Autism Dev Disord. 30(3). [PubMed] [Google Scholar]
- Manunta, P. , Hamilton, J. , Rogowski, A. C. , Hamilton, B. P. , & Hamlyn, J. M. (2000). Chronic hypertension induced by ouabain but not digoxin in the rat: Antihypertensive effect of digoxin and digitoxin. Hypertension Research, 23(Suppl), S77–S85. [DOI] [PubMed] [Google Scholar]
- Matchkov, V. V. , & Krivoi, I. (2016). Specialized functional diversity and interactions of the Na,K‐ATPase. Frontier in Physiology, 7, 179 10.3389/fphys.2016.00179. [DOI] [PMC free article] [PubMed] [Google Scholar]
- Matos, M. , Augusto, E. , Agostinho, P. , Cunha, R. A. , & Chen, J.‐F. (2013). Interaction between adenosine A2A receptors and α2 Na,K‐ATPase controlling glutamate uptake in astrocytes. The Journal of Neuroscience, 33, 18492–18502. [DOI] [PMC free article] [PubMed] [Google Scholar]
- Matte, A. , Bertoldi, M. , Mohandas, N. , An, X. , Bugatti, A. , Brunati, A. M. , … de Franceschi, L. (2013). Membrane association of peroxiredoxin‐2 in red cells is mediated by the N‐terminal cytoplasmic domain of band 3. Free Radical Biology & Medicine, 55, 27–35. 10.1016/j.freeradbiomed.2012.10.543. [DOI] [PubMed] [Google Scholar]
- Morita, S. , Shirakawa, S. , Kobayashi, Y. , Nakamura, K. , Teraoka, R. , Kitagawa, S. , & Terada, T. (2012). Enzymatic measurement of phosphatidylserine in cultured cells. Journal of Lipid Research, 53(2), 325–330. [DOI] [PMC free article] [PubMed] [Google Scholar]
- Nikezić, G. , Horvat, A. , Nedeljković, N. , Todorović, S. , Nikolić, V. , Kanazir, D. , … Kopecni, M. (1998). Influence of pyridine and urea on the rat brain ATPase activity. General Physiology and Biophysics, 17(1), 15–23. [PubMed] [Google Scholar]
- North, P. , & Post, R. L. (1984). Inhibition of (Na,K)‐ATPase by tetravalent vanadium. The Journal of Biological Chemistry, 259(8), 4971–4978. [PubMed] [Google Scholar]
- Petrov, A. M. , Kasimov, M. R. , & Zefirov, A. L. (2017). Cholesterol in the pathogenesis of alzheimer's, parkinson's diseases and autism: Link to synaptic dysfunction. Acta Naturae, 9(1), 26–37. [PMC free article] [PubMed] [Google Scholar]
- Pierre, S. V. , & Xie, Z. (2006). The Na,K‐ATPase receptor complex: Its organization and membership. Cell Biochemistry and Biophysics, 46(3), 303–316. 10.1385/CBB:46:3:303. [DOI] [PubMed] [Google Scholar]
- Reinhard, L. , Tidow, H. , Clausen, M. J. , & Nissen, P. (2013). Na(+),K (+)‐ATPase as a docking station: protein‐protein complexes of the Na(+),K (+)‐ATPase. Cellular and Molecular Life Sciences, 70(2), 205–222. 10.1007/s00018-012-1039-9. [DOI] [PMC free article] [PubMed] [Google Scholar]
- Réus, G. Z. , Fries, G. R. , Stertz, L. , Badawy, M. , Passos, I. C. , Barichello, T. , … Quevedo, J. (2015). The role of inflammation and microglial activation in the pathophysiology of psychiatric disorders. Neuroscience, 300, 141–154. 10.1016/j.neuroscience.2015.05.018. [DOI] [PubMed] [Google Scholar]
- Rose, E. M. , Koo, J. C. , Antflick, J. E. , Ahmed, S. M. , Angers, S. , & Hampson, D. R. (2009). Glutamate transporter coupling to Na, K‐ATPase. The Journal of Neuroscience, 29, 8143–8155. [DOI] [PMC free article] [PubMed] [Google Scholar]
- Rossignol, D. A. , & Frye, R. E. (2014). Evidence linking oxidative stress, mitochondrial dysfunction, and inflammation in the brain of individuals with autism. Frontiers in Physiology, 5, 150 10.3389/fphys.2014.00150. [DOI] [PMC free article] [PubMed] [Google Scholar]
- Rossignol, D. A. , Genuis, S. J. , & Frye, R. E. (2014). Environmental toxicants and autism spectrum disorders: A systematic review. Translational Psychiatry, 4, e360. 10.1038/tp.2014.4. [DOI] [PMC free article] [PubMed] [Google Scholar]
- Scheiner‐Bobis, G. (2002). The sodium pump. Its molecular properties and mechanics of ion transport. European Journal of Biochemistry, 269(10), 2424–2433. [DOI] [PubMed] [Google Scholar]
- Schengrund, C. L. , Ali‐Rahmani, F. , & Ramer, J. C. (2012). Cholesterol, GM1, and autism. Neurochemical Research, 37(6), 1201–1207. 10.1007/s11064-011-0697-6. [DOI] [PubMed] [Google Scholar]
- Short, A. B. , Schopler, E. , (1988). Factors relating to age of onset in autism. J Autism Dev Disord. 18(2): 207–16. [DOI] [PubMed] [Google Scholar]
- Skou, J. C. (1957). The influence of some cations on an adenosine triphosphatase from peripheral nerves. Biochimica et Biophysica Acta, 23(2), 394–401. [DOI] [PubMed] [Google Scholar]
- Staroń, A. , Mąkosa, G. , & Koter‐Michalak, M. (2012). Oxidative stress in erythrocytes from patients with rheumatoid arthritis. Rheumatology International, 32(2), 331–334. 10.1007/s00296-010-1611-2. [DOI] [PMC free article] [PubMed] [Google Scholar]
- Sweadner, K. J. , & Rael, E. (2000). The FXYD gene family of small ion transport regulators or channels: cDNA sequence, protein signature sequence, and expression. Genomics, 68(1), 41–56. [DOI] [PubMed] [Google Scholar]
- Tsatsanis, K. D. , Dartnall, N. , Cicchetti, D. , Sparrow, S. S. , Klin, A. , Volkmar, F. R. (2003). Concurrent validity and classification accuracy of the Leiter and Leiter‐R in low‐functioning children with autism. J Autism Dev Disord. 33(1): 23–30. [DOI] [PubMed] [Google Scholar]
- Vandesompele J, De Preter K, Pattyn F, Poppe B, Van Roy N, De Paepe N, Speleman F (2002) Accurate normalization of real‐time quantitative RT‐PCR data by geometric averaging of multiple internal control genes. Genome Biology 3(7) RESEARCH0034. [DOI] [PMC free article] [PubMed] [Google Scholar]
- Vasić, V. , Jovanović, D. , Horvat, A. , Momić, T. , & Nikezić, G. (2002). Effect of Cd(2+) and Hg(2+) on the activity of Na(+)/K(+)‐ATPase and Mg(2+)‐ATPase adsorbed on polystyrene microtiter plates. Analytical Biochemistry, 300(2), 113–120. [DOI] [PubMed] [Google Scholar]
- Xie, Z. (2003). Molecular mechanisms of Na/K‐ATPase‐mediated signal transduction. Annals of the New York Academy of Sciences, 986, 497–503. [DOI] [PubMed] [Google Scholar]
- Xie, Z. , Jack‐Hays, M. , Wang, Y. , Periyasamy, S. M. , Blanco, G. , Huang, W. H. , & Askari, A. (1995). Different oxidant sensitivities of the alpha 1 and alpha 2 isoforms of Na+/K(+)‐ATPase expressed in baculovirus‐infected insect cells. Biochemical and Biophysical Research Communications, 207(1), 155–159. [DOI] [PubMed] [Google Scholar]
- Young, A. M. , Chakrabarti, B. , Roberts, D. , Lai, M. C. , Suckling, J. , & Baron‐Cohen, S. (2016). From molecules to neural morphology: Understanding neuroinflammation in autism spectrum condition. Molecular Autism, 7, 9 10.1186/s13229-016-0068-x. [DOI] [PMC free article] [PubMed] [Google Scholar]
- Zhang, D. , Hou, Q. , Wang, M. , Lin, A. , Jarzylo, L. , Navis, A. , … Man, H. Y. (2009). Na, K‐ATPase activity regulates AMPA receptor turnover through proteasome‐mediated proteolysis. The Journal of Neuroscience, 29, 4498–4511. [DOI] [PMC free article] [PubMed] [Google Scholar]
- Zulian, A. , Linde, C. I. , Pulina, M. V. , Baryshnikov, S. G. , Papparella, I. , Hamlyn, J. M. , & Golovina, V. A. (2013). Activation of c‐SRC underlies the differential effects of ouabain and digoxin on Ca(2+) signaling in arterial smooth muscle cells. American Journal of Physiology Cell Physiology, 304(4), C324–C333. [DOI] [PMC free article] [PubMed] [Google Scholar]
Associated Data
This section collects any data citations, data availability statements, or supplementary materials included in this article.
Supplementary Materials
Table S1: Primer sequences and amplicon length of the genes studied by qRT‐PCR
Table S2: Primary and secondary antibodies used in WBs
Figure S1. NKA subunit expression in erythrocyte membranes. Representative pictures of gels, nitrocellulose membranes and Western Blots. TD erythrocytes: lanes 1–4; ASD erythrocytes: lanes 5–8. M: MW markers. a: Anti‐alpha 1 subunit antibody; b: Anti‐alpha 3 subunit antibody; c: Anti‐pan alpha subunit antibody; d: Anti‐beta 1 subunit antibody; e: Anti‐beta 2 subunit antibody; f: Anti‐beta 3 subunit antibody. Details of antibodies are reported in Table S2 and histograms in Figure 1D. Ghost suspensions were solubilized 1 hr in ice bath in Laemmli buffer 4x. Precast gradient gels (Mini‐PROTEAN TGX Stain‐Free Protein Gel, 4–15% polyacrylamide, Bio‐Rad Laboratories, Hercules, CA) and Bio‐Rad nitrocellulose membranes were used. After blocking in Tris‐Buffered Saline containing 0.05% Tween‐20 (TBS‐T) and 1% BSA for 1 h at room temperature, membranes were probed overnight at 4 °C with primary antibodies, washed three times with TBS‐T and incubated with Cy5‐conjugated secondary antibodies, dissolved in TBS‐Tween and 0.2% BSA. TGX gels contain trihalo compounds, which, under UV‐light, react with tryptophan residues producing fluorescence, proportional to the total protein amount. Although the ratio gel‐to‐membrane fluorescence did not substantially differ from one lane to the next, the membrane fluorescence was considered to be more representative and used as loading control.
Figure S2. a: A representative gel and its nitrocellulose membrane of glutathione‐protein complexes in erythrocyte membranes from TD and ASD children. TGX gels were exposed to UV light and then electroblotted. Membranes were probed overnight at 4 °C with the monoclonal primary mouse antibody Glutathione‐D8 (Thermo Scientific, Rockford, IL) diluted 1:100 in 0.1%TBS‐Tween, then exposed to secondary antibody. The lane fluorescence was used for quantification of the glutathione‐protein complexes (Fig. 2a). Samples from TD erythrocytes were run in lanes 1–4, samples from ASD erythrocytes were run in lanes 5–8. Lane M: MW markers. b: A representative gel reacted with anti‐DPNH antibody to detect carbonylated protein residues in erythrocyte membranes from TD and ASD children. Each sample was DNPH‐derivatized (D) (lanes 1, 3, 5, and 7) or not derivatized (ND)(lanes 2,4, 6, and 8). Lanes 1–4: samples from TD erythrocytes; lanes 5–8: samples from ASD erythrocytes; lane DM: DPNH‐derivatized MW markers. On the right, a detail showing the β‐actin bands, where HPRT‐conjugated secondary antibody was used (See Table S2). Protein carbonyl groups in DNPH‐derivatized lanes were quantified relative to their actin band density (Fig. 2b).