Abstract
Previous studies have shown that tea polyphenols are metabolized by gut microbiota. The present study investigated the effect of gut microbiota on the bioavailability, tissue levels and degradation of tea polyphenols. Mice were treated with antibiotics (ampicillin/sulfamethoxazole/trimethoprim) in drinking water and the control mice received water for 11 days, and they were given an AIN93M diet enriched with 0.32% Polyphenon E. Levels of catechins and their metabolites (if present) in the serum, liver, urine and fecal samples were determined by HPLC. Results showed that treatment with antibiotics significantly increased the levels of the major polyphenol, (−)-epigallocatechin-3-gallate (EGCG), in serum and liver samples. Antibiotics also raised the levels of some catechins in urine and fecal samples but decreased the levels of their metabolites. These results suggest that antibiotics eliminated gut microbes and increased the bioavailabilities of these tea catechins. In a second study, mice were given different concentrations of green tea infusions as the drinking fluid. The plasma levels of EGCG and (−)-epicatechin-3-gallate (ECG) at day 112 were significantly lower than those at day 5. The urine levels of EGCG and ECG increased in the first 4 or 5 days, and then decreased to much lower levels at day 23 and beyond. In contrast, the levels of (−)-epigallocatechin and (−)-epicatechin showed a trend of increase during the 112-day experiment, likely due to microbial hydrolysis of EGCG and ECG. Both sets of experiments support the idea that the degradation of EGCG and ECG by gut microbiota decreases their bioavailabilities.
Keywords: Tea catechins, bioavailability, gut microbiota, antibiotics
INTRODUCTION
Tea, made from the leaves of the plant Camellia sinensis, is a popular beverage worldwide. For the past three decades, tea has been studied for its beneficial health effects, including the reduction of body weight, alleviation of metabolic syndrome and the prevention of diabetes, cardiovascular diseases, cancer and neurodegeneration (reviewed in (1–3)). Most of the observed beneficial effects are believed to be due to the polyphenols in tea, although caffeine and theanines may also contribute to some of these effects (1). The detailed molecular mechanisms, however, are not completely understood. In order to understand the biological activities of tea polyphenols, it is important to have a good understanding of the bioavailabilities of these compounds.
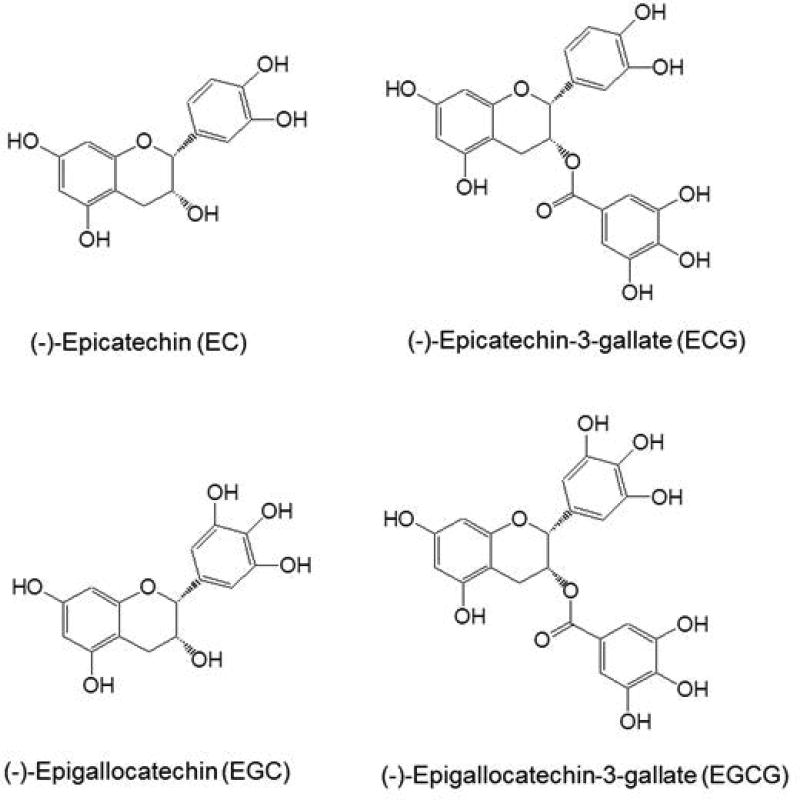
The major polyphenols in green tea are catechins, which include: (−)-epigallocatechin-3-gallate (EGCG), (−)-epicatechin-3-gallate (ECG), (−)-epigallocatechin (EGC), and (−)-epicatechin (EC). After oral administration, the bioavailabilities of tea catechins appear to follow the Lipiniski Rule of 5 (4–7). EGCG, with a larger molecular weight of 458 and 8 phenolic groups, has much lower bioavailability than EGC, with molecular weight of 306 and 6 phenolic groups. The catechins are thought to enter cells mainly through passive diffusion, although the involvement of transporters, such as organic anion-transporting peptides 1A2 and 1B3, has also been suggested (8, 9). Multidrug resistant protein 2 has been suggested to limit the bioavailability of EGCG by actively exporting EGCG from the enterocytes back into the intestinal lumen, either before or after conjugation (6). The remaining fraction of EGCG is absorbed into the portal circulation, enters the liver and is methylated and conjugated. EGCG is methylated by catechol-O-methyltransferase and conjugated by UDP-glucuronosyl transferases and sulfotransferases to form glucuronide and sulfate conjugates, respectively. EGCG and its conjugates are subsequently effluxed by multidrug resistant protein 2 from the liver cells to the bile and into the intestine (6). A large portion of EGCG in the intestine is reabsorbed through enterohepatic circulation and the remaining portion is excreted in the feces. Therefore, depending on the animal species, only a small portion of or no EGCG is excreted in urine (5, 6, 10). Some dietary chemicals have been shown to affect the bioavailability of catechins through inhibiting their conjugations or effluxes. For example, piperine, a compound found in black pepper, can inhibit gluconidation of EGCG and increase its bioavailability, when both compounds were co-administered orally to mice (11).
In a previous study, the recovery of catechins after ingestion of tea catechins was investigated in 10 healthy humans (12). After consumption of a bottle of green tea (500 mL containing 648 mmol catechins, mainly 257 mmol EGC and 230 mmol of EGCG), the recovery in 24-h urine of gallocatechin conjugates was 11% of intake and that of non-gallocatechin conjugates was 28% (12). A similar tea preparation administered to ileostomists showed that the urinary excretion of gallocatechin conjugates was 8% of intake and that of non-gallocatechin conjugates was 27% (13). Because catechins need to be absorbed before urinary excretion, these results suggest that tea catechins are mostly absorbed in the upper part (before ileum) of the gastrointestinal tract, and the ileum may play a role in the absorption of gallocatechins. It was estimated that 69% of catechin intake was recovered in the 0- to 24-h ileal fluid, as mixtures of catechins and their metabolites.
Catechins are known to be degraded by microbes in the oral cavity and intestines (14, 6). The hydrolysis of the ester bonds of EGCG and ECG and the fission of the C-ring of catechins are carried out by microbial enzymes, but not mammalian enzymes, to produce gallic acid and ring-fission metabolites (6). Three metabolites, 5-(3', 4', 5'-trihydroxyphenyl)-γ-valerolactone (M4), 5-(3', 4'-dihydroxyphenyl)-γ-valerolactone (M6) and 5-(3', 5'-dihydroxyphenyl)-γ-valerolactone (M6`), have been identified in human and mouse plasma and urine samples (15, 16). The results strongly suggest that these microbial metabolites, together with intact catechins, are absorbed in the small intestine. The ring fission metabolites are further degraded to phenylvaleric acid, phenolic acid and smaller molecules, mostly in the colon. As a consequence, in addition to intact catechins and their conjugates, microbial metabolites of catechins are also excreted in feces and urine. A recent review article also indicated that a large portion of the ingested catechins passes through the intestine and undergoes ring fission degradation (10).
Our previous studies showed that upon administration of green tea polyphenols in drinking water to mice, the plasma EGCG levels peaked in 4 days and then decreased (17). In rats, time dependent changes were also observed in plasma EGC levels (17). These results suggest that prolonged ingestion of catechins could enhance the microbial degradation of catechins and decrease their blood levels. Microbial degradation could be an important factor in affecting the blood and tissue levels of EGCG and other catechins. In human studies, there have been observations that treatment with tea catechins increased energy expenditure in short term studies (7–10 days), but not in long term studies (18).
Even though the importance of intestinal microbiota on health has been extensively studied (19–26), the possible role of microbial degradation of catechins in affecting their bioavailabilities is unclear. The present study addresses this issue by studying the effects of antibiotics on the catechin levels in blood, liver, urine and fecal samples, and by analyzing the blood and urine levels of catechins in a long-term experiment.
EXPERIMENTAL PROCEDURES
1. Chemicals and diets
Polyphenon E (PPE), EGCG, EGC, ECG and EC were generous gifts from Dr. Yukihiko Hara of Tea Solutions, Hara Office Inc. (Tokyo, Japan). The PPE preparation contained (per g) 643 mg EGCG, 29 mg EGC, 74 mg ECG, 90 mg EC, 45 mg gallocatechin gallate and 6 mg caffeine. The green tea solids (code 0111-01) were kindly provided by the T.J. Lipton (now Unilever-Bestfoods) Company (Englewood Cliffs, NJ). The green tea solids were prepared by spray drying the water extract of green tea and contained 14.1% EGCG, 11.7% EGC, 3.3% ECG, 3.4% EC and 5.4% caffeine. AIN76A and AIN93M rodent diets and the AIN93M supplemented with 0.32% PPE were prepared by Research Diets, Inc. (New Brunswick, NJ). Sulfatase (S-9626, containing glucuronidase activity) was purchased from Sigma-Aldrich (St. Louis, MO). All other chemicals, solvents and reagents were the highest grades of commercially available materials.
2. Animals and dietary treatments
In the study with antibiotics, male C57BL/6J mice with an average body weight of 22g (7-wk old) were obtained from Jackson Laboratory (Bar Harbor, ME). All animal experiments were performed under protocol No. 91-024 approved by Rutgers University Institutional Animal Care and Use Committee (Piscataway, NJ). The mice were maintained under a 12-hour light-dark cycle and housed three per cage with free access to food and water. After an 8-day acclimation to AIN93M diet, the mice were divided into two groups. Group 1 (G1, n=30) was given sterilized water as the control group and Group 2 (G2, n=30) was given drinking water containing (per mL) ampicillin (1 mg), sulfamethoxazole (1.6 mg) and trimethoprim (0.32 mg) throughout the experiment. Drinking water for both groups was changed twice a week. After treatment with antibiotics for 11 days, both groups were switched to the 0.32% PPE diet. The body weight of each mouse and the consumption of food and water of the three mice in each cage were measured daily.
For the long-term study, female A/J mice (6 weeks old) from Jackson Laboratory (Bar Harbor, ME) were fed AIN76A diet and given water ad libitum. The primary purpose of this experiment was to study lung cancer preventive activities of green tea. The mice were treated with a dose of 4-methyl-N-nitrosamino-1-(3-pyridyl)-1-butanone (NNK, 100 mg/kg body weight, i.p.) and then divided into five groups with 10 mice per group. Mice were given 0.1, 0.2, 0.4 or 0.6% green tea preparations (1, 2, 4 or 6 mg green tea solids dissolved in 1 mL warm water) or water as the sole source of drinking fluid. The results on cancer prevention have been published (27). The present study focuses on the blood and urine levels of catechins in these mice.
3. Sample collection
In the study with antibiotics, urine and fecal samples were collected on days 1, 2, 3, 4, 7 and 15. Fresh urine was collected from each mouse by holding the mouse and gently massaging the transabdominal area to induce urination. These were spot urine samples collected from mice in G1 and G2 at the same time daily between 9:00 – 9:30 AM. The urine samples from the six or three mice in a group were pooled as one sample and stored at −80°C. We feel this is the most convenient procedure to collect fresh urine from the mouse in this experimental setting. A mixture of bedding and feces from each cage was collected into brown paper bags at the time of cage change. Fecal pellets were picked up and put into a container, weighed and stored at −80°C. Six mice from each group were euthanized by asphyxiation with carbon dioxide on days 1, 2, 4, 7 and 15. Blood samples were collected through cardiac puncture; serum was prepared and stored at −80°C. Liver and other samples were also collected and stored at −80°C.
In the long-term study, fresh urine samples were collected at 9:00 – 9:30 AM as described above. Urine samples from 10 mice in each group were pooled, preserved by adding one-tenth the volume of 0.4 M sodium phosphate buffer (pH 6.8, containing 20% ascorbic acid and 0.1% EDTA) and stored frozen at −80°C. On days 5 and 112, blood samples were collected by cardiac puncture into heparinized capillary tubes and centrifuged at 16,000 g for 10 min. The resulting plasma samples were mixed with one tenth the 0.4 M sodium phosphate buffer solution as above and stored at −80°C.
4. Analysis of tea polyphenols
The concentrations of EGCG, EGC, ECG and EC were determined by our previous methods (28) with modifications. For serum samples, 80 µL of serum and 400 µL of 0.2 M sodium phosphate buffer (pH 6.8, containing 0.1% ascorbic acid) were mixed in a tube. For urine samples, 20 µL of urine and 200 µL of 0.2 M sodium phosphate buffer as above were mixed in a tube. The sample was then incubated with 20 µL of sulfatase (containing glucuronidase) at 37°C in a water bath for 45 min. Afterwards, 1 mL of ethyl acetate was added, mixed (by shaking) for 5 min, and centrifuged at 14,000 rpm for 5 min. The supernatant (700 µL) was withdrawn and the residue was extracted for the second time with 1 mL of ethyl acetate. The combined extract (1.4 mL) was mixed with 10 µL of 0.1% ascorbic acid and dried in a vacuum centrifuge concentrator. The dried sample was dissolved in 100 µL of 10% acetonitrile aqueous solution and centrifuged at 14,000 rpm for 5 min. The sample (50 µL) was then injected onto HPLC. For liver samples, 100 mg of liver was homogenized in 400 µL of the above 0.2 M sodium phosphate buffer in an Omni ruptor homogenizer. After centrifugation, the supernatant was incubated with sulfatase and processed as described above. Because of enzyme digestion, the quantity of each catechin determined is the total amount of free and conjugated catechins.
For fecal sample preparation, the samples were ground in a Black & Decker CBG100S grinder (New Britain, CT) that had been cooled by dry ice, and dry ice was used to keep the temperature low while grinding. The ground sample (20 mg) was added to 800 µL of 50% methanol solution (prepared with equal volume of methanol and 0.1% ascorbic acid solution) and homogenized in an Omni bead ruptor (Omni Co., Kennesaw, GA). Then, 100 µL of the mixture was added to 900 µL of 0.1% ascorbic acid and vortexed for 5 min. After centrifugation, 50 µL of the sample was injected onto HPLC.
The HPLC system used a Supelcosil C18 reversed-phase column with a gradient elution at a flow rate of 1 mL/min. The mobile phase consisted of Solution A – 16.57 g sodium phosphate, 70 mL acetonitrile, 5 mL tetrahydrofuran and water in 4L at pH 3.35; and Solution B – 8.28 g of sodium phosphate, 2340 mL acetonitrile, 500 mL of tetrahydrofuran and water in 4L at pH 3.45. The gradient cycle started with an initial 8-min isocratic segment (98% Solution A and 2% Solution B), and linear gradient was applied by increasing Solution B to 4% at 16 min, to 12% at 22 min, to 20% at 34 min, and to 59% at 38 min. Then, Solution B was maintained at 98% from 46 min to 56.5 min and changed back to 2% at 57 min to 67 min in preparation for the next run. The analytes were detected with an ESA 5600 Coulochem electrode array system (Waters, Milford, MA) with potential settings at 100, 200, 300 and 400 mV.
Standard serum, urine and fecal samples with known quantities of catechins and metabolites (some samples were spiked) were run together with the experimental samples. The standard samples were subjected to the same incubation and extraction steps for quality control and for quantification. By comparison with the retention time and peak height in the standard sample, the identity and quantity of the analytes were determined.
5. Statistical Analysis
For comparison values between G2 and G1 at each time point, the two samples unequal variance t-test was used to obtain the p-value, and significance was set at p < 0.05. Bonferroni multiplicity adjustment was also applied to some results. For comparison of the mean values of the 5 or 6 time points of each catechin between G2 and G1, two-tailed t-test was used.
Results
1. General observations in studies with antibiotics
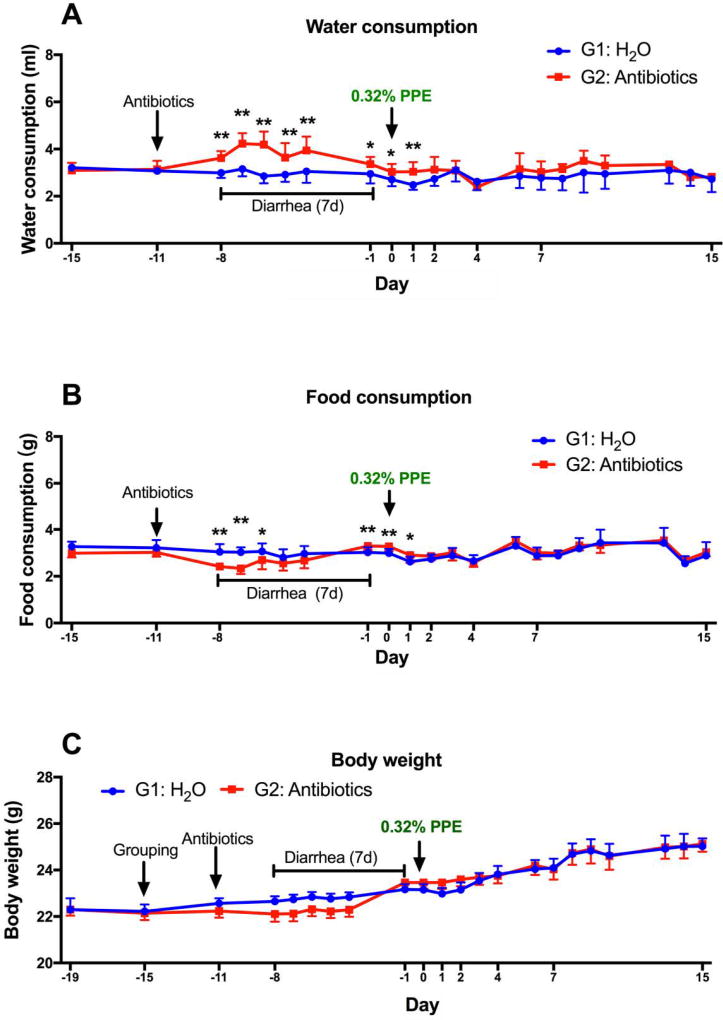
As expected, the mice in G2 developed antibiotic-induced diarrhea 3 days after initiating the antibiotic treatment and recovered from the diarrhea after 7 or 8 days. During this period, the water consumption was higher, and the food consumption was lower in G2 as compared to G1. The body weights of G2 were lower than G1 only when the mean body weight of the 5 days (days -4 to -8) was compared (Fig. 2). After recovery from diarrhea, both groups were switched from the AIN93M diet to the PPE-enriched diet on day 0. From this point on, no significant differences between G1 and G2 were observed in fluid and food intake (except for day 1) or growth rate. Both groups of mice looked healthy without any signs of toxicity.
2. Effects of antibiotics on blood and liver levels of tea catechins
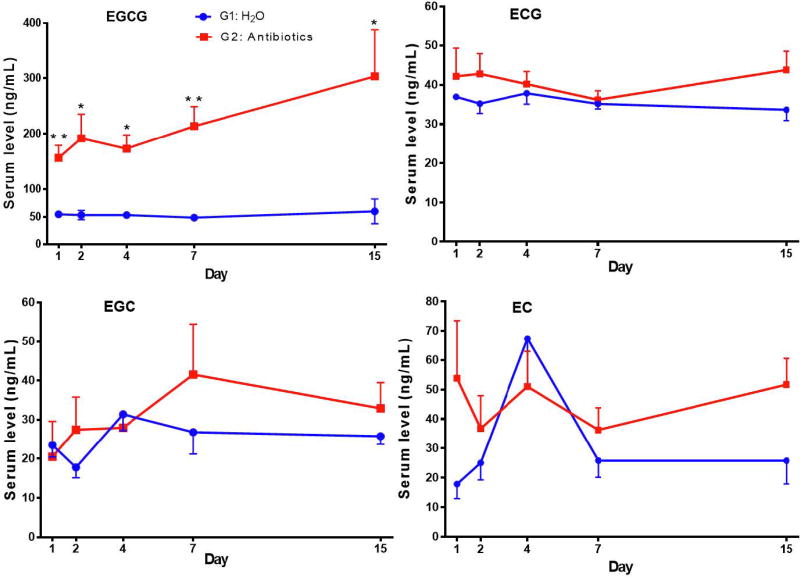
The blood catechin levels of the mice in G1 maintained at rather steady levels and no time dependent changes were observed in the 2-week experimental period (Fig. 3). The concentration ranges (in ng/mL) for EGCG, ECG, EGC and EC were 49–60, 34–38, 18–31 and 18–67, respectively. The serum levels of the major catechin, EGCG, in G2 were 3–5 fold higher than those in G1 and the differences were significant at all 5 time points. After Bonferroni adjustment, however, only the data at days 1 and 7 were significantly different. The mean values of the five time points of G2 were significantly higher than that of G1 (Fig. 3 legend). The levels of ECG, EGC and EC in G2 appeared to be higher than in G1; however, significant difference was only found in ECG when the mean values of the five time points were considered.
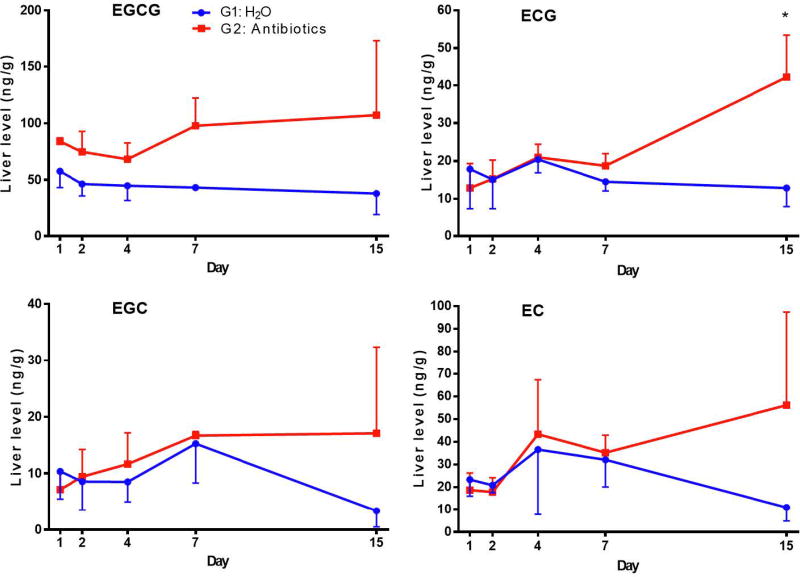
The liver EGCG levels in G2 were generally higher than those in G1 (Fig. 4). The mean level of the five time points (mean ± SEM, n=15) of EGCG, 86.4 ± 8.2 ng/g, in G2 was significantly higher than the 46.1 ± 3.3 ng/g in G1 (p < 0.0001). G2 and G1 appeared to diverge in hepatic ECG, EGC and EC levels, with high levels of all three catechins in G2 on day 15; however, significant differences were only found in ECG. Overall, these results of blood and liver EGCG levels suggest that antibiotic treatment significantly increased the bioavailability of EGCG.
3. Effects of antibiotics on urinary levels of catechins and their metabolites
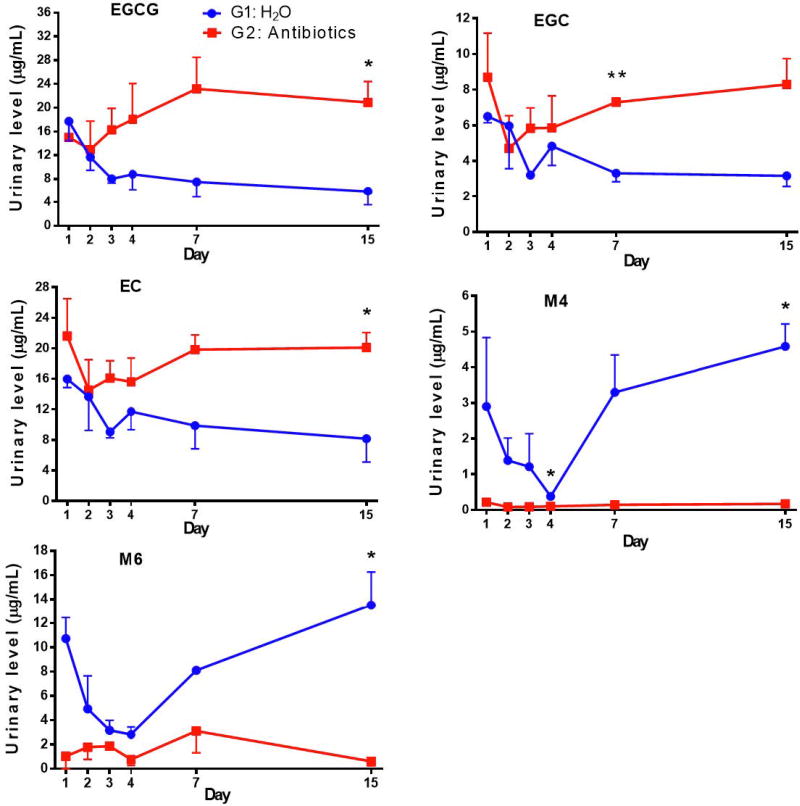
The urinary EGCG concentrations in G1 decreased in the first three days and then declined at a slower rate for the remainder of the experiment (Fig. 5). The reason for this decrease is not known. The urinary concentrations of EGCG in G2 were similar to G1 in the first two days. Afterwards, the levels in G2 increased substantially, and on days 7 and 15, the levels of urinary EGCG in G2 appeared 3 times higher than those in G1. The concentrations of EGC and EC followed a similar pattern of changes. Because of the rather large standard deviations, statistical significance was only observed in some of the time points, most at day 15. However, the mean values of the five time points from G2 and G1 were significantly different for all catechins and metabolites (Fig. 5 legend). Since urinary catechins were derived from catechins that were absorbed systemically, these results suggest that the systemic pools of catechins were increased by the elimination of intestinal microbes with antibiotics. Microbial degradation of catechins make them unavailable for reabsorption. This interpretation is supported by the decreased excretion of catechin metabolites M4 and M6 in the urine in G2, likely due to the lack of microbial degradation of catechins. On the other hand, the levels of M4 and M6 were rather high in G1 on day 1, but decreased to nearly the G2 levels on day 4 and then gradually increased to higher levels on day 15. The pattern of decrease and then increase in the urinary levels of these metabolites is quite intriguing. It is possible that in G1 (no antibiotics), the catechins initially suppressed the intestinal microbes that convert catechins to M4 and M6. Afterwards, some microbes that can degrade catechins were populated (or with enzyme activity enhanced) to convert catechins to M4 and M6.
4. Effects of antibiotics on fecal levels of tea catechins and their metabolites
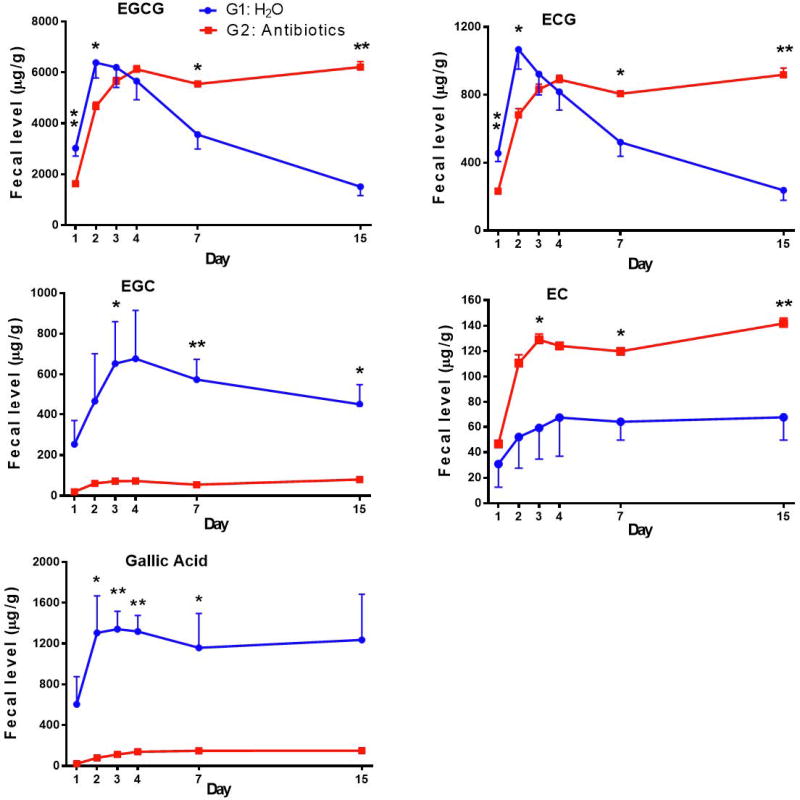
In G1, the EGCG levels increased from day 1 to a rather high level on day 2 and then decreased as the treatment prolonged (Fig. 6). In G2, however, the initial increase peaked at day 4 and then stayed at about the same level; the levels on days 7 and 15 were much higher than that of G1. The initial increase is likely due to the switching from the AIN93M diet to the PPE-enriched diet on day 0, and it took time for it to replace the AIN93M diet in the intestine. The subsequent lowering of fecal EGCG in G1 is likely due to microbial degradation. The antibiotic treatment in G2 prevented such degradation and thus fecal EGCG levels were not decreased. Fecal levels of ECG in G1 and G2 were lower and both followed the same pattern of changes as the EGCG levels. Interestingly, the fecal levels of EGC in G2 were very low due to the antibiotic treatment, and the mean level of the 5 data points of G2 was much lower than that of G1. The EGC levels in G1 increased in the first four days and then gradually decreased. These results suggest that most of the fecal EGC was derived from EGCG through the action of microbial esterases, even though the intestinal microbes could also degrade EGC at a slower rate. This interpretation is supported by the production of substantial amounts of gallic acid (a product of EGCG hydrolysis at the 3-position) in G1, in comparison to the lower levels in G2 (p = 0.001). The level of EC, however, was higher in G2 than G1, suggesting that the antibiotics prevented the microbial degradation of EC. Because of the low level of ECG in PPE, the amount of EC formed from ECG was apparently much lower than the amount of microbial degraded EC. M4 and M6 were not detected in fecal samples, possibly because they were further degraded to smaller metabolites.
5. Blood and urine levels of catechins in a long-term study
We took advantage of a long-term lung cancer prevention experiment (27) to study the bioavailability of tea catechins. Tea solutions, at concentrations of 0.1, 0.2, 0.4 and 0.6%, were given to mice as drinking fluid. Because of the bitterness, the fluid intake (especially with 0.6% and 0.4% of green tea) was lower than that of the other groups in the first few days. By day 5, as the mice got used to the taste, no significant inter-group differences were observed in fluid intake (average 2.5 mL/mouse/day) and food consumption (average 1.5 g food/mouse/day) throughout the experiment. All mice appeared to be healthy, even though all had received a dose of carcinogen. The mean body weight of the mice that received 0.4% and 0.6% green tea was 9.3% lower (p < 0.05) than those in the control group (21.08 ± 2.75 g) (27). The results on the cancer preventive effect of green tea have been published (27).
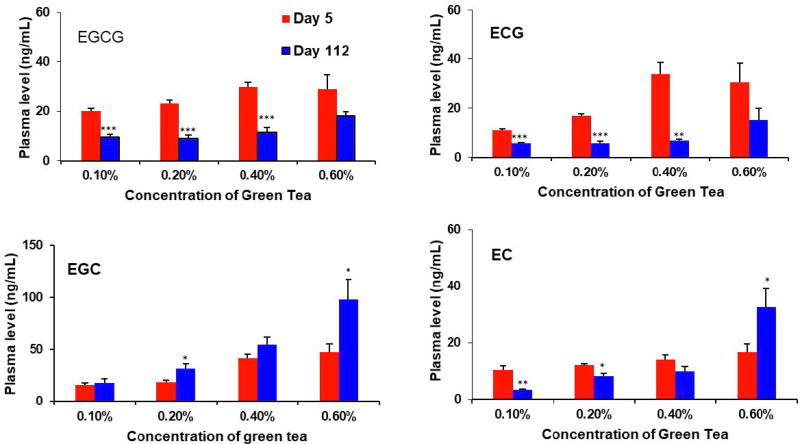
The blood samples were collected upon sacrifice of the mice on days 5 and 112. The four tea catechins were detected in the plasma of tea treated groups, but not in the control group. A linear dose-response relationship on the plasma levels of the four catechins was not observed (Fig. 7). For example, the EGCG and ECG levels on day 5 appeared to increase in the dose range of 0.1% to 0.4%, but no further increase at 0.6%. Of note is that at day 112, the plasma levels of EGCG and ECG in the 0.1%, 0.2% and 0.4% green tea groups were significantly lower than those of day 5 (p < 0.0001), possibly due to the intestinal microbial degradation of these catechins, and thus decreased their absorption or reabsorption. The plasma levels of EGC showed a trend of increase with dose; interestingly, the day 112 values were higher than the day 5 values (only the 0.2% and 0.4% groups were statistically significant), possibly due to the conversion of EGCG to EGC. An apparent dose-dependent increase in the plasma EC levels was also not observed. In comparison to the day 5 values, the day 112 plasma EC values were lower in the 0.1% and 0.2% green tea groups, possibly due to intestinal microbial degradation; but higher in the 0.6% green tea group, possibly due to the microbial conversion to EC from ECG at this high concentration.
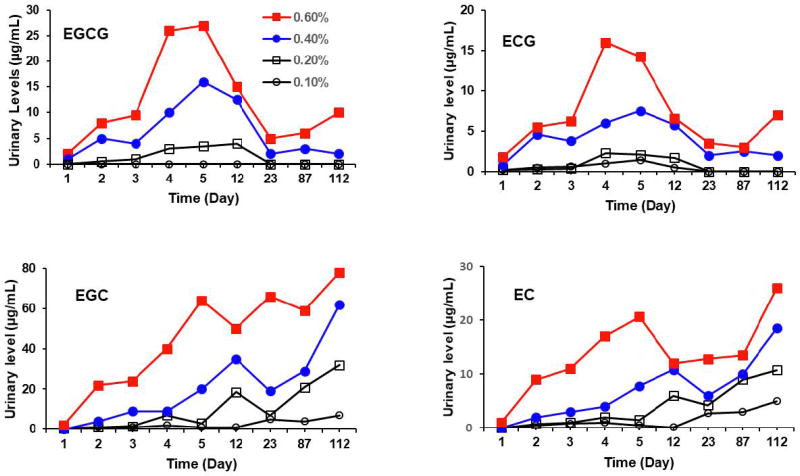
Fresh urine samples were collected on days 1, 2, 3, 4, 5, 12, 23, 87, and 112. Most of the urinary catechins were in the conjugated forms, and the samples were treated with sulfatase (and β-glucuronidase) to yield the catechin aglycons for the determination of the total amounts of each catechin (Figure 8). No catechins were detected in the control samples. Because of the large number of samples collected in this long-term experiment, the fresh urine samples of each group (10 mice) were pooled as one sample for each day. Therefore, the data shown in Figure 8 did not have a standard deviation. However, the trend shown by these data are still meaningful, especially in the same trend shown in the four groups with different tea concentrations. Since these samples were collected at the same time (9:00–9:30 am), the data are still informative even though the catechin levels were not normalized by creatinine levels. Dose-dependent excretion of catechins in the urine was observed. The urinary levels of catechins in the 0.4% and 0.6% groups increased during the first four or five days, possibly due to the gradual increase in the consumption of tea. The levels of gallated catechins (EGCG and ECG) showed a pattern of decrease after day 5. During the period of days 23 to 112, no or very low urinary levels of EGCG and ECG were detected in 0.1% and 0.2% green tea groups. Their levels in the 0.4% and 0.6% green tea groups were also much lower than their peak values on day 4 or 5. This dramatic decline could not be explained by the fluctuation in the fluid consumption or variability in urine sample collection, and is most likely due to their decreased systemic pools of EGCG and ECG. These results are consistent with the observed lower levels of plasma levels of EGCG and ECG at day 112 than day 5. Among the catechins, as expected, EGC showed the highest urinary level. EGCG, even though more abundant in the tea preparation, was mainly excreted, through the bile, in the feces. In addition, the levels of EGC and EC were increased with time during the entire experimental period, despite some fluctuations in levels. At day 112, urinary levels of EGC and EC reached the highest levels. The increase is probably due to elevated microbial hydrolysis of EGCG to EGC and ECG to EC.
Discussion
In this study, we demonstrated that the treatment of mice with antibiotics increased blood, liver and urinary levels of EGCG, and perhaps other catechins. These results suggest that antibiotic treatment eliminated catechin-degrading microbes in the gut and hence, increase the amounts of catechins available for absorption. This suggestion is supported by the increased EGCG, ECG and EC levels in fecal samples caused by antibiotic treatment as well as the decreased urinary levels of catechin ring fission metabolites, M4 and M6. In our long-term studies, the blood levels of EGCG and ECG were much lower on day 112 than day 5 of the experiment and the urinary levels of EGCG and ECG gradually decreased after day 5 for the remainder of the experiment. The observed decrease in bioavailability in these two sets of studies are most likely due to the microbial degradation of the catechins.
We used the combination of three antibiotics (ampicillin/sulfamethoxazole/trimethoprim) to eliminate intestinal microbes. Ampicillin is a broad-spectrum antibiotic against gram-positive and gram-negative aerobic and anaerobic bacteria through inhibition of cell wall synthesis. Sulfamethoxazole is a sulfonamide drug that inhibits the synthesis of dihydrofolic acid, and trimethoprim is a pyrimidine analogue that inhibits dihydrofolate reductase; together, these two drugs effectively block "one carbon metabolism" which is required for bacterial growth. The use of this three-antibiotic combination was an existing protocol at Rutgers University to effectively suppress or eliminate intestinal microbiota. Similar combinations have been shown to be effective in suppressing or eliminating intestinal microbiota (29, 30). The mice developed antibiotics-induced diarrhea 3 days after initiating the treatment and recovered from the diarrhea after 7 or 8 days, even when the antibiotic treatment continued. After initiating the PPE-enriched diet, the antibiotic treatment elevated the serum levels of EGCG by 3–5 fold above the levels of the control group, which was maintained at a steady level of 50–60 ng/mL for the 15 days of the experiment. The steady levels of blood EGCG in G1 are different from our previous results showing that blood EGCG levels peaked on days 4 and then decreased on days 9 and 14 (17). The increase of EGCG levels in the first 4 days in the previous experiment may be due to the administration of 0.6% green tea polyphenols in drinking fluid and it took a few days for the mice to adjust to the bitterness to reach the normal level of liquid consumption (17). Whereas in the present study, the dietary 0.32% PPE did not affect the food intake. The previous observed decrease in blood EGCG levels after day 4 is likely due to EGCG degradation by gut microbes, and the microbiota of A/J mice 18 years ago (17) may be quite different from the C57BL/6J mice used in the present study.
The higher bioavailability of EGCG due to antibiotic treatment was also reflected in the liver levels of EGCG. Due to the large standard deviations, the serum and liver levels of EGC and EC in G2 were not statistically higher than those in G1. The role of gut microbiota in lowering the bioavailability of catechins was also suggested by the elevated urine levels of catechins and the decreased levels of M4 and M6 due to antibiotic treatment. The involvement of microbiota in catechin metabolism was also clearly reflected in the fecal levels of catechins and their metabolites; after the first two days, EGCG and ECG levels decreased extensively due to microbial degradation in G1. The antibiotic treatment significantly increased the fecal levels of EGCG, ECG and EC. The fecal levels of EGC were much lower than that in G1, for lack of conversion of EGCG to EGC.
Alternative interpretations of the effects of antibiotics on catechin bioavailability should also be discussed. Antibiotic treatment has been shown to induce farnesoid X receptor, inhibit intestinal bile acid reabsorption, change glucose metabolism, affect bile acid metabolism and increase the blood concentration of α-tocopherol in animals (31–33). Gut microbiota has also been shown to affect drug-metabolizing enzymes (34, 35). Whereas the increase of EGCG absorption caused by antibiotic treatment may contribute to the presently observed higher bioavailability of EGCG, the decreased microbial degradation of EGCG is the most straightforward interpretation of our present results.
The concept that microbial metabolism of catechins change their bioavailabilities is also supported by the results from our long-term study without antibiotics, even though the study was conducted in a different strain of mice (A/J vs. C57BL) with a different design. In this experiment, the lowered EGCG and ECG levels were associated with increased levels of EGC and EC in the plasma and urine after long-term treatment with green tea. The results cannot be interpreted based on the concept of altered absorption or biotransformation of catechins by the mice, because the esterases involved in the hydrolysis of EGCG and EGC are bacterial enzymes. The changes in gut microbiota by tea consumption have been well documented (19–26), and the results are most likely due to such changes. To our knowledge, this is the first demonstration that prolonged treatment of animals with green tea decreases the bioavailability of tea polyphenols, EGCG and ECG.
The roles of gut microbiota in degrading polyphenols and decreasing their bioavailabilities may contribute to the large individual differences in blood catechin levels observed in human subjects following consumption of green tea preparations (5, 10, 7). The present results may have interesting implications in considering the effects of tea consumption on human health, in which tea catechins are known to play an important role (1–3). It would be interesting to determine whether blood and tissue levels of catechins are higher in short-term (7–10 days) than long-term studies in humans, and whether such differences are associated with the health effects of tea. Following the same rationale, it would also be interesting to determine whether the bioavailability of catechins is lower in tea drinkers in comparison to individuals who do not drink tea on a daily basis. The concept that microbial degradation decreases the bioavailability of a compound may also be applicable to other phenolics and nonphenolic dietary constituents.
Acknowledgments
This work was supported by grants from the U.S. National Institutes of Health CA133021 (to CSY) and shared facilities funded by CA72720 and ES05022, as well as the John L. Colaizzi Chair Endowment fund (to CSY). The authors thank the personnel of Laboratory Animal Service for taking care of our research mice and thank Ms. Vi P. Dan for her assistance in the preparation of this manuscript.
Abbreviations
- EC
(−)-epicatechin
- ECG
(−)-epicatechin-3-gallate
- EGC
(−)-epigallocatechin
- EGCG
(−)-epigallocatechin-3-gallate
- M4
5-(3', 4', 5'-trihydroxyphenyl)-γ-valerolactone
- M6
5-(3', 4'-dihydroxyphenyl)-γ-valerolactone
- M6`
5-(3', 5'-dihydroxyphenyl)-γ-valerolactone
- PPE
Polyphenon E
Footnotes
Conflict of interests: none.
References
- 1.Yang CS, Hong J. Prevention of chronic diseases by tea: possible mechanisms and human relevance. Annu Rev Nutr. 2013;33:161–181. doi: 10.1146/annurev-nutr-071811-150717. [DOI] [PubMed] [Google Scholar]
- 2.Yang CS, Wang H. Cancer preventive activities of tea catechins. Molecules. 2016;21:1679. doi: 10.3390/molecules21121679. [DOI] [PMC free article] [PubMed] [Google Scholar]
- 3.Yang CS, Zhang J, Zhang L, Huang J, Wang Y. Mechanisms of body weight reduction and metabolic syndrome alleviation by tea. Mol Nutr Food Res. 2016;60:160–174. doi: 10.1002/mnfr.201500428. [DOI] [PMC free article] [PubMed] [Google Scholar]
- 4.Lipinski CA, Lombardo F, Dominy BW, Feeney PJ. Experimental and computational approaches to estimate solubility and permeability in drug discovery and development settings. Adv Drug Deliv Rev. 2001;46:3–26. doi: 10.1016/s0169-409x(00)00129-0. [DOI] [PubMed] [Google Scholar]
- 5.Lee MJ, Maliakal P, Chen L, Meng X, Bondoc FY, Prabhu S, Lambert G, Mohr S, Yang CS. Pharmacokinetics of tea catechins after ingestion of green tea and (−)-epigallocatechin-3-gallate by humans: formation of different metabolites and individual variability. Cancer Epidemiol Biomarkers Prev. 2002;11:1025–1032. [PubMed] [Google Scholar]
- 6.Sang S, Lambert JD, Ho CT, Yang CS. The chemistry and biotransformation of tea constituents. Pharmacol Res. 2011;64:87–99. doi: 10.1016/j.phrs.2011.02.007. [DOI] [PubMed] [Google Scholar]
- 7.Hodgson AB, Randell RK, Mahabir-Jagessar TK, Lotito S, Mulder T, Mela DJ, Jeukendrup AE, Jacobs DM. Acute effects of green tea extract intake on exogenous and endogenous metabolites in human plasma. J Agric Food Chem. 2014;62:1198–1208. doi: 10.1021/jf404872y. [DOI] [PubMed] [Google Scholar]
- 8.Roth M, Timmermann BN, Hagenbuch B. Interactions of green tea catechins with organic anion-transporting polypeptides. Drug Metab Dispos. 2011;39:920–926. doi: 10.1124/dmd.110.036640. [DOI] [PMC free article] [PubMed] [Google Scholar]
- 9.Zhang Y, Hays A, Noblett A, Thapa M, Hua DH, Hagenbuch B. Transport by OATP1B1 and OATP1B3 enhances the cytotoxicity of epigallocatechin 3-O-gallate and several quercetin derivatives. J Nat Prod. 2013;76:368–373. doi: 10.1021/np3007292. [DOI] [PMC free article] [PubMed] [Google Scholar]
- 10.Clifford MN, van der Hooft JJ, Crozier A. Human studies on the absorption, distribution, metabolism, and excretion of tea polyphenols. Am J Clin Nutr. 2013;98:1619S–1630S. doi: 10.3945/ajcn.113.058958. [DOI] [PubMed] [Google Scholar]
- 11.Lambert JD, Hong J, Kim DH, Mishin VM, Yang CS. Piperine enhances the bioavailability of the tea polyphenol (−)-epigallocatechin-3-gallate in mice. J Nutr. 2004;134:1948–1952. doi: 10.1093/jn/134.8.1948. [DOI] [PubMed] [Google Scholar]
- 12.Stalmach A, Troufflard S, Serafini M, Crozier A. Absorption, metabolism and excretion of Choladi green tea flavan-3-ols by humans. Mol Nutr Food Res. 2009;53(Suppl 1):S44–53. doi: 10.1002/mnfr.200800169. [DOI] [PubMed] [Google Scholar]
- 13.Stalmach A, Mullen W, Steiling H, Williamson G, Lean ME, Crozier A. Absorption, metabolism, and excretion of green tea flavan-3-ols in humans with an ileostomy. Mol Nutr Food Res. 2010;54:323–334. doi: 10.1002/mnfr.200900194. [DOI] [PubMed] [Google Scholar]
- 14.Meselhy MR, Nakamura N, Hattori M. Biotransformation of (−)-epicatechin 3-O-gallate by human intestinal bacteria. Chem Pharm Bull (Tokyo) 1997;45:888–893. doi: 10.1248/cpb.45.888. [DOI] [PubMed] [Google Scholar]
- 15.Li C, Lee MJ, Sheng S, Meng X, Prabhu S, Winnik B, Huang B, Chung JY, Yan S, Ho CT, Yang CS. Structural identification of two metabolites of catechins and their kinetics in human urine and blood after tea ingestion. Chem Res Toxicol. 2000;13:177–184. doi: 10.1021/tx9901837. [DOI] [PubMed] [Google Scholar]
- 16.Sang S, Lee MJ, Yang I, Buckley B, Yang CS. Human urinary metabolite profile of tea polyphenols analyzed by liquid chromatography/electrospray ionization tandem mass spectrometry with data-dependent acquisition. Rapid Commun Mass Spectrom. 2008;22:1567–1578. doi: 10.1002/rcm.3546. [DOI] [PubMed] [Google Scholar]
- 17.Kim S, Lee MJ, Hong J, Li C, Smith TJ, Yang GY, Seril DN, Yang CS. Plasma and tissue levels of tea catechins in rats and mice during chronic consumption of green tea polyphenols. Nutr Cancer. 2000;37:41–48. doi: 10.1207/S15327914NC3701_5. [DOI] [PubMed] [Google Scholar]
- 18.Janssens PL, Hursel R, Westerterp-Plantenga MS. Long-term green tea extract supplementation does not affect fat absorption, resting energy expenditure, and body composition in adults. J Nutr. 2015;145:864–870. doi: 10.3945/jn.114.207829. [DOI] [PubMed] [Google Scholar]
- 19.Okubo T, Ishihara N, Oura A, Serit M, Kim M, Yamamoto T, Mitsuoka T. In Vivo Effects of Tea Polyphenol Intake on Human Intestinal Microflora and Metabolism. Biosci Biotechnol Biochem. 1992;56:588–591. doi: 10.1271/bbb.56.588. [DOI] [PubMed] [Google Scholar]
- 20.Lee HC, Jenner AM, Low CS, Lee YK. Effect of tea phenolics and their aromatic fecal bacterial metabolites on intestinal microbiota. Res Microbiol. 2006;157:876–884. doi: 10.1016/j.resmic.2006.07.004. [DOI] [PubMed] [Google Scholar]
- 21.van Duynhoven J, Vaughan EE, Jacobs DM, Kemperman RA, van Velzen EJ, Gross G, Roger LC, Possemiers S, Smilde AK, Dore J, Westerhuis JA, Van de Wiele T. Metabolic fate of polyphenols in the human superorganism. Proc Natl Acad Sci U S A. 2011;108(Suppl 1):4531–4538. doi: 10.1073/pnas.1000098107. [DOI] [PMC free article] [PubMed] [Google Scholar]
- 22.Jin JS, Touyama M, Hisada T, Benno Y. Effects of green tea consumption on human fecal microbiota with special reference to Bifidobacterium species. Microbiol Immunol. 2012;56:729–739. doi: 10.1111/j.1348-0421.2012.00502.x. [DOI] [PubMed] [Google Scholar]
- 23.Cardona F, Andres-Lacueva C, Tulipani S, Tinahones FJ, Queipo-Ortuno MI. Benefits of polyphenols on gut microbiota and implications in human health. J Nutr Biochem. 2013;24:1415–1422. doi: 10.1016/j.jnutbio.2013.05.001. [DOI] [PubMed] [Google Scholar]
- 24.van Duynhoven J, Vaughan EE, van Dorsten F, Gomez-Roldan V, de Vos R, Vervoort J, van der Hooft JJJ, Roger L, Draijer R, Jacobs DM. Interactions of black tea polyphenols with human gut microbiota: implications for gut and cardiovascular health. American Journal of Clinical Nutrition. 2013;98:1631s–1641s. doi: 10.3945/ajcn.113.058263. [DOI] [PubMed] [Google Scholar]
- 25.Janssens PL, Penders J, Hursel R, Budding AE, Savelkoul PH, Westerterp-Plantenga MS. Long-Term Green Tea Supplementation Does Not Change the Human Gut Microbiota. PLoS One. 2016;11:e0153134. doi: 10.1371/journal.pone.0153134. [DOI] [PMC free article] [PubMed] [Google Scholar]
- 26.Wang J, Tang L, Zhou H, Zhou J, Glenn TC, Shen CL, Wang JS. Long-term treatment with green tea polyphenols modifies the gut microbiome of female sprague-dawley rats. J Nutr Biochem. 2018;56:55–64. doi: 10.1016/j.jnutbio.2018.01.005. [DOI] [PMC free article] [PubMed] [Google Scholar]
- 27.Liao J, Yang GY, Park ES, Meng X, Sun Y, Jia D, Seril DN, Yang CS. Inhibition of lung carcinogenesis and effects on angiogenesis and apoptosis in A/J mice by oral administration of green tea. Nutr Cancer. 2004;48:44–53. doi: 10.1207/s15327914nc4801_7. [DOI] [PubMed] [Google Scholar]
- 28.Lee MJ, Prabhu S, Meng X, Li C, Yang CS. An improved method for the determination of green and black tea polyphenols in biomatrices by high-performance liquid chromatography with coulometric array detection. Anal Biochem. 2000;279:164–169. doi: 10.1006/abio.2000.4487. [DOI] [PubMed] [Google Scholar]
- 29.Turer EE, Tavares RM, Mortier E, Hitotsumatsu O, Advincula R, Lee B, Shifrin N, Malynn BA, Ma A. Homeostatic MyD88-dependent signals cause lethal inflamMation in the absence of A20. J Exp Med. 2008;205:451–464. doi: 10.1084/jem.20071108. [DOI] [PMC free article] [PubMed] [Google Scholar]
- 30.Reikvam DH, Erofeev A, Sandvik A, Grcic V, Jahnsen FL, Gaustad P, McCoy KD, Macpherson AJ, Meza-Zepeda LA, Johansen FE. Depletion of murine intestinal microbiota: effects on gut mucosa and epithelial gene expression. PLoS One. 2011;6:e17996. doi: 10.1371/journal.pone.0017996. [DOI] [PMC free article] [PubMed] [Google Scholar]
- 31.Knarreborg A, Lauridsen C, Engberg RM, Jensen SK. Dietary antibiotic growth promoters enhance the bioavailability of alpha-tocopheryl acetate in broilers by altering lipid absorption. J Nutr. 2004;134:1487–1492. doi: 10.1093/jn/134.6.1487. [DOI] [PubMed] [Google Scholar]
- 32.Out C, Patankar JV, Doktorova M, Boesjes M, Bos T, de Boer S, Havinga R, Wolters H, Boverhof R, van Dijk TH, Smoczek A, Bleich A, Sachdev V, Kratky D, Kuipers F, Verkade HJ, Groen AK. Gut microbiota inhibit Asbt-dependent intestinal bile acid reabsorption via Gata4. J Hepatol. 2015;63:697–704. doi: 10.1016/j.jhep.2015.04.030. [DOI] [PMC free article] [PubMed] [Google Scholar]
- 33.Rodrigues RR, Greer RL, Dong X, KN DS, Gurung M, Wu JY, Morgun A, Shulzhenko N. Antibiotic-Induced Alterations in Gut Microbiota Are Associated with Changes in Glucose Metabolism in Healthy Mice. Front Microbiol. 2017;8:2306. doi: 10.3389/fmicb.2017.02306. [DOI] [PMC free article] [PubMed] [Google Scholar]
- 34.Selwyn FP, Cui JY, Klaassen CD. RNA-Seq Quantification of Hepatic Drug Processing Genes in Germ-Free Mice. Drug Metab Dispos. 2015;43:1572–1580. doi: 10.1124/dmd.115.063545. [DOI] [PMC free article] [PubMed] [Google Scholar]
- 35.Selwyn FP, Cheng SL, Klaassen CD, Cui JY. Regulation of Hepatic Drug-Metabolizing Enzymes in Germ-Free Mice by Conventionalization and Probiotics. Drug Metab Dispos. 2016;44:262–274. doi: 10.1124/dmd.115.067504. [DOI] [PMC free article] [PubMed] [Google Scholar]


