Abstract
The cortical surface atlases constructed from a large representative population of neonates are highly needed in the neonatal neuroimaging studies. However, existing neonatal cortical surface atlases are typically constructed from small datasets, e.g., tens of subjects, which are inherently biased and thus are not representative to the neonatal population. In this paper, we construct neonatal cortical surface atlases based on a large-scale dataset with 764 subjects. To better characterize the dynamic cortical development during the first postnatal weeks, instead of constructing just a single atlas, we construct a set of spatiotemporal atlases at each week from 39 to 44 gestational weeks. The central idea is that, for all cortical surfaces, we first group-wisely register them into the common space to ensure the unbiasedness. Then, rather than simply averaging over the co-registered cortical surfaces, which generally leads to over-smoothed cortical folding patterns, we adopt a spherical patch-based sparse representation using an augmented dictionary to overcome the noises and potential registration errors. Through the group-wise sparsity constraint, we obtain consistent geometric cortical folding attributes on the atlases. Our atlases preserve the sharp cortical folding patterns, thus leading to better registration accuracy when aligning new subjects onto the atlases.
Index Terms: surface atlas, sparse representation
1. INTRODUCTION
The neonatal brain undergoes dynamic development at the early postnatal weeks, which is believed to be closely related to the later cognitive functions [1]. Therefore, high quality neonatal cortical surface atlases are in great demand for surface-based spatial normalization and analysis of the neonatal subjects, but still remain scarce. Currently, there are only two works on the construction of cortical surface atlases of term-born neonates. Moreover, these neonatal surface atlases were constructed from small datasets, typically, tens of subjects. For example, Hill et al. [2] constructed the first neonatal cortical surface atlas, PALS-term 12 atlas, by co-registration of 12 term-born neonatal cortical surfaces, based on manually delineated sulcalgyral landmark curves. Bozek et al. [3] created neonatal cortical surface atlases from 39 to 42 weeks of gestation, based on 44 subjects, by co-registering all spherical cortical surfaces in each week group. Given the small numbers of subjects and highly convoluted cortical folding with large inter-subject variations [4], these neonatal cortical surface atlases are inherently biased and thus are not representative to the neonatal population.
To address this issue, we unprecedentedly construct a set of neonatal cortical surface atlases from a large-scale dataset with 764 term-born neonates, which is the largest neonatal dataset to the best of our knowledge. To better characterize the dynamic cortical development during the first postnatal weeks, instead of constructing a single atlas, we construct a set of spatiotemporal atlases at each week from 39 to 44 gestational weeks. To preserve sharp cortical folding patterns on the surface atlases, rather than simply averaging of cortical folding attributes over the age-matched co-registered cortical surfaces as done in the conventional method, we develop a spherical patch-based sparse representation method using the augmented dictionary to overcome the potential registration errors. To ensure the consistency across different cortical folding attributes on the atlases, we adopt the group-wise sparsity constraint. The sharp cortical folding patterns on the spatiotemporal atlases lead to high registration accuracy when aligning new subjects onto the atlases.
2. DATASET AND IMAGE PROCESSING
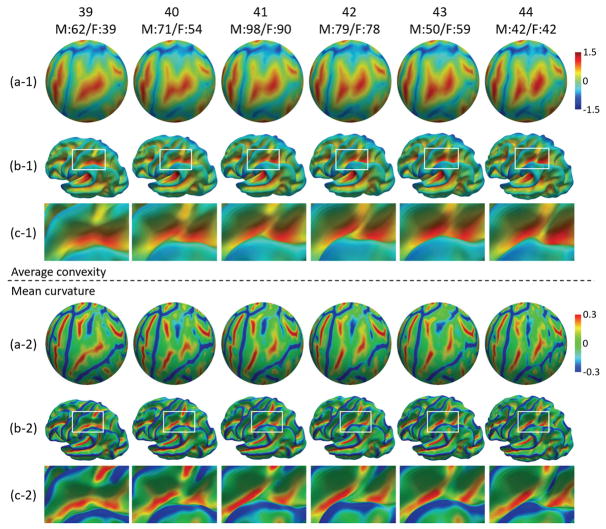
The T2-weighted brain MR images were acquired from 764 term-born neonates from 39 to 44 gestational weeks. The subject number and gender information at each age are reported on top of Fig. 1, with M indicating male subjects, and F indicating female subjects. All images were processed by the UNC Infant Cortical Surface Pipeline [5]. Briefly, it included the following major preprocessing steps: a) intensity inhomogeneity correction; b) skull stripping; c) cerebellum and brain stem removal; d) tissue segmentation using LINKS [6]; e) masking and filling the non-cortical structures, and separation of the left and right hemispheres.
Fig. 1.
The constructed spatiotemporal neonatal cortical surface atlases from 39 to 44 weeks. (a-1) and (a-2) show the color-coded average convexity and mean curvature on the spherical surfaces, respectively. (b-1) and (b-2) show the color coded average convexity and mean curvature on the averaged inner surfaces. (c-1) and (c-2) zoom a respective region for better inspection of the folding development.
Topologically correct and geometrically accurate inner (the white/gray matter interface) and outer (the gray matter/cerebrospinal fluid interface) cortical surfaces were reconstructed using a topology-preserving deformable surface method based on tissue segmentation results [7]. Specifically, to reconstruct the inner cortical surface, firstly, topological defects were corrected on the white matter volume to ensure a spherical topology of each hemisphere [8]. Then, the corrected white matter volume was tessellated as a triangular mesh. Next, the triangular surface mesh was deformed by preserving its initial topology to reconstruct the inner and outer cortical surfaces. The inner cortical surface was further smoothed, inflated, and mapped to a sphere by minimizing metric distortion between the original cortical surface and its spherical representation [9].
3. METHOD
Our main framework for the construction of neonatal cortical surface atlases includes three steps. First, we establish the unbiased cortical correspondences across all subjects by using the group-wise spherical surface registration. Second, for each local spherical surface patch in the atlas space at each week, we build a dictionary of cortical folding attributes for sparse representation. This dictionary includes not only the corresponding patches from age-matched co-registered cortical surfaces, but also the spatially neighboring patches to account for the possible registration errors. Finally, we jointly and sparsely represent the cortical folding attributes on the atlas patch by using the folding attributes of patches in the dictionary, via a group-wise sparsity constraint. Specifically, the joint representation is formulated as a multi-task sparse representation problem, i.e., the dirty model [10], with each task corresponding to the sparse representation of a certain folding attribute. Using the above-described steps, we can not only preserve sharp patterns of the folding attributes, but also maintain the consistency across different folding attributes on the constructed surface atlases.
Establishing Cortical Correspondences
To establish the unbiased inter-subject cortical correspondences across all subjects at all ages, we use the group-wise spherical surface registration method, i.e., spherical demons [11], based on the cortical folding geometric attributes. Then, all spherical surfaces are resampled using the same mesh tessellation. After registration and resampling, a straightforward method to construct the cortical surface atlas is to average cortical folding attributes over all co-registered cortical surfaces. However, due to potential registration errors and substantial inter-subject variation of cortical folding, the simple average generally leads to over-smoothed cortical folding patterns, which will degrade the registration accuracy when aligning new subjects onto the atlases. To preserve sharp cortical folding patterns on atlas, we develop a spherical patch-based sparse representation method, which uses the augmented dictionary to overcome the potential registration errors in the co-registered surfaces.
Building Dictionary
To build a representation dictionary, we need comparable patches for spatially neighboring vertices. Due to the local mesh structures differences at different vertices, the original mesh patches of neighboring vertices on the sphere are not directly comparable, since they may have different number of neighbors and inconsistent size [12]. To obtain comparable neighboring patches for building the dictionary at current location, we rotate the current local patch to its spatially neighboring vertices. The rotated patches on neighboring vertices will have the same patch size and structure. Then, these rotated patches with resampled folding attributes formulate the comparable patches for spatially neighboring vertices.
With the comparable neighboring patches, for each atlas patch, we can build a representation dictionary. For a local patch centered at vertex vi, we extract all corresponding patches from N co-registered cortical surfaces and then include them into the dictionary, denoted as , where n=1,…,N denotes the subject index; ℳj indicates a cortical folding attribute in the current patch. In this paper, ℳj,j ∈{A,C}, indicates the average convexity (ℳA) or mean curvature (ℳC), respectively. Both of them are frequently used to drive the cortical surface registration. To increase the robustness to registration errors, patches that are spatially neighboring to corresponding local patches are also extracted and included into the dictionary, denoted as , where is the k-th vertex that is neighboring to the vertex vi. Herein, we denote the dictionary for ℳj at vi as 𝓓ℳj(vi).
Constructing Atlases with Sparse Representation
With the built dictionaries, estimating the cortical folding attributes on the atlases becomes finding the best representation of the population folding attributes using the respective dictionary. For a cortical folding attribute (e.g., ℳA), given an atlas patch at vi, N corresponding local patches from N co-registered cortical surfaces can be obtained. However, some patches may have less agreement with population folding attributes. An effective way to filter out these untypical patches is to use the following 3 steps. 1) The group center patch is computed as the average over the N patches; 2) The correlation coefficient between each patch and the group center patch is then computed; 3) Finally, the top M (M ≤ N) patches corresponding to the top M correlation coefficients are selected, denoted as , with m=1,…,M. These M patches can be regarded as carrying the population folding attributes, and then we use the built dictionary to sparsely represent these top M patches.
Since each cortical folding attribute can be regarded as a specific view of the cerebral cortex, therefore, they should be consistent on atlases. To this end, instead of independently representing each attribute, we jointly represent them using a multi-task sparse representation with group-wise sparsity constraint, where each task corresponds to the representation of a specific cortical folding attribute. To further address the inevitable noises contained in the folding attributes, we use the dirty model for sparse representation, which can be formulated as the following minimization problem:
| (1) |
| (2) |
Where denotes the m-th extracted patch from the top M patches with the cortical folding attribute ℳj, j ∈{A,C}. 𝓓ℳj(vi) is the dictionary of ℳj for the local patch centered at vi, and ωj is the representation (column) vector for ℳj, W = [ωA(vi), ωC(vi)] is the matrix containing 2 sparse representation vectors for 2 folding attributes, and it is composed of two matrices: P and Q. The first term in (1) is the fitting error for multi-task representation. It encourages the constructed folding attribute 𝓓ℳj(vi)ωj to be similar to each respective . The second term is the group-wise sparsity regularization term. ||P||∞,1 is a combination of both 𝕃∞ and 𝕃1 norms, in which the 𝕃∞,1 norm is imposed to each row of the matrix P for making different cortical folding attributes on the same atlas patch share the similar sparsity structure. The third term is the element-wise sparsity component, to handle the potential noise included in the data that cannot be group-wisely represented. Equation (2) constrains the relationship of W with P and Q. With this modeling, we can impose group-wise sparsity through P to preserve the consistency across cortical folding attributes, and also handle the potential noises in cortical folding attributes through Q. ρ1 and ρ2 are the two non-negative parameters used to balance different terms.
Using the above method, the cortical folding attributes on the atlas patch centered at vertex vi is jointly represented via the estimated representation coefficient matrix W. Notably, due to the patch overlapping, each vertex on the atlases will be covered by multiple patches. Thus, we average over all covering patches to obtain the final cortical folding attribute for this vertex.
4. RESULTS
In the experiments, we used the following parameter setting for constructing the atlases. The top 60% highly-correlated patches are selected to define the top M patches. Each patch is defined by the 2-ring neighbors, while the neighboring vertices used to augment patches are set as the 3-ring neighbors on the surface mesh with 163,842 vertices. Herein, the 2-ring or 3-ring means the neighbor size on the surface mesh. The parameter ρ1 and ρ2 are set to 1 and 0.5, respectively, which are learned from cross-validation.
We assess the constructed spatiotemporal cortical surface atlases both visually and quantitatively. Fig. 1 shows the constructed cortical surface atlases with the color-coded average convexity and mean curvature at each week on both spherical surfaces (a) and average inner surfaces (b). From this figure, it can be seen that the cortex has considerable development from 39 to 44 weeks, especially for the parietal region (zoomed for better inspection in Fig. 1(c)).
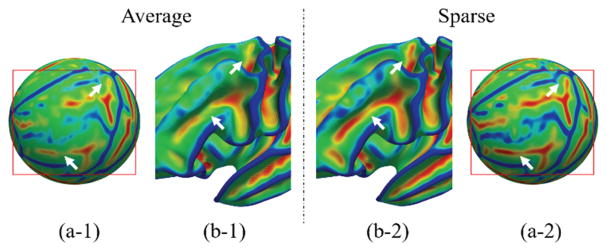
To better show the advantage of our method, we compared our atlases based on sparse representation (namely the sparse atlas) to the atlases constructed by simply averaging over the co-registered cortical surfaces (namely the average atlas). Fig. 2 shows the curvature patterns on these two atlases at 41 weeks. It can be seen that our atlas preserves much clearer folding patterns, compared to the average atlas.
Fig. 2.
Curvature pattern on the average-based atlas (left) and our sparse representation-based atlas (right) at 41 gestational weeks. (a-1) and (a-2) show the color coded mean curvature on the spherical surfaces. (b-1) and (b-2) show the color coded mean curvature on the averaged inner cortical surfaces.
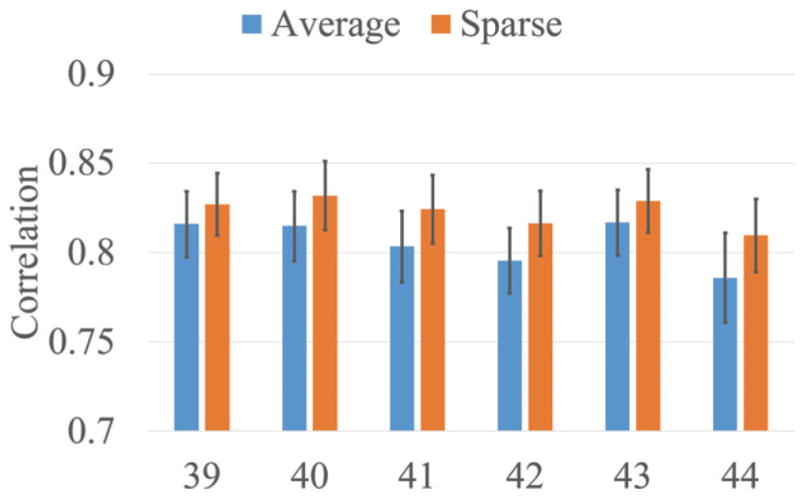
To quantitatively evaluate the constructed atlases, we randomly separate the subjects at each age into 2 groups. In particular, 1 group (with 2/3 subjects) is used for constructing atlases (average atlas and sparse atlas), and the other group (with 1/3 subjects) is used for testing. Then, we align the cortical surfaces in the testing group onto the constructed atlases. The atlases with the sharp folding patterns are expected to have better registration accuracy. Since there is no ground truth for the cortical surface registration, we follow the evaluation strategy in [13] to assess the registration accuracy. For any two subjects in the testing dataset, after registered them onto the atlases, we computed the correlation coefficient of their average convexity maps. Then, for all possible pairs of subjects, we obtained the average correlation coefficient. Clearly, higher average correlation coefficients indicate better alignment of the cortical folding patterns. Fig. 3 shows the average correlation coefficient and its standard deviation after aligning the testing subjects onto the average atlases and our atlases. Our atlases lead to statistically significantly (with p=0.0004) better registration accuracy than the average atlases, which indicates that our atlases have clearer cortical folding patterns compared to average atlases.
Fig. 3.

Average correlation coefficient and standard deviation after aligning individual subjects onto average atlases and our sparse atlases at each week.
5. CONCLUSION
To comprehensively characterize the dynamic cortical development during early postnatal weeks, we have constructed a set of spatiotemporal neonatal cortical surface atlases at each week from 39 to 44 gestational weeks using a large cohort of term-born neonates with 764 subjects. Moreover, by leveraging sparse representation, we preserved sharp cortical folding patterns on the atlases, leading to boosted registration accuracy when aligning new subjects onto the atlases. In the future, we will incorporate more cortical folding attributes into the atlases, do more validation, and publically release our spatiotemporal neonatal cortical surface atlases as a complementary for our UNC 4D infant surface atlas [15]. We will also explore the folding patterns and built multiple atlases [14] to capture these patterns for better studying early brain development.
Acknowledgments
This work is supported by NIH grants: MH100217, MH107815, MH108914, MH109773 and MH110274.
References
- 1.Dubois J, et al. Primary cortical folding in the human newborn: an early marker of later functional development. Brain. 2008;131(8):2028–2041. doi: 10.1093/brain/awn137. [DOI] [PMC free article] [PubMed] [Google Scholar]
- 2.Hill J, et al. A surface-based analysis of hemispheric asymmetries and folding of cerebral cortex in term-born human infants. J Neurosci. 2010;30(6):2268–2276. doi: 10.1523/JNEUROSCI.4682-09.2010. [DOI] [PMC free article] [PubMed] [Google Scholar]
- 3.Bozek J, et al. Construction of a neonatal cortical surface atlas using multimodal surface matching. IEEE-ISBI. 2016:775–778. doi: 10.1016/j.neuroimage.2018.06.018. [DOI] [PMC free article] [PubMed] [Google Scholar]
- 4.Meng Y, et al. Discovering cortical folding patterns in neonatal cortical surfaces using large-scale dataset. MICCAI. 2016:10–18. doi: 10.1007/978-3-319-46720-7_2. [DOI] [PMC free article] [PubMed] [Google Scholar]
- 5.Li G, et al. Construction of 4D high-definition cortical surface atlases of infants: Methods and applications. Medical image analysis. 2015;25(1):22–36. doi: 10.1016/j.media.2015.04.005. [DOI] [PMC free article] [PubMed] [Google Scholar]
- 6.Wang L, et al. LINKS: Learning-based multi-source IntegratioN frameworK for Segmentation of infant brain images. NeuroImage. 2015;108:160–172. doi: 10.1016/j.neuroimage.2014.12.042. [DOI] [PMC free article] [PubMed] [Google Scholar]
- 7.Li G, et al. Consistent reconstruction of cortical surfaces from longitudinal brain MR images. Neuroimage. 2012;59(4):3805–3820. doi: 10.1016/j.neuroimage.2011.11.012. [DOI] [PMC free article] [PubMed] [Google Scholar]
- 8.Hao S, et al. Learning-based topological correction for infant cortical surfaces. MICCAI. 2016:219–227. doi: 10.1007/978-3-319-46720-7_26. [DOI] [PMC free article] [PubMed] [Google Scholar]
- 9.Fischl B, et al. Cortical surface-based analysis: II: inflation, flattening, and a surface-based coordinate system. Neuroimage. 1999;9(2):195–207. doi: 10.1006/nimg.1998.0396. [DOI] [PubMed] [Google Scholar]
- 10.Jalali A, et al. A dirty model for multi-task learning. Adv Neural Inf Process Syst. 2010:964–972. [Google Scholar]
- 11.Yeo BT, et al. Spherical demons: fast diffeomorphic landmark-free surface registration. IEEE Trans Med Imaging. 2010;29(3):650–668. doi: 10.1109/TMI.2009.2030797. [DOI] [PMC free article] [PubMed] [Google Scholar]
- 12.Wu Z, et al. 4D Infant Cortical Surface Atlas Construction Using Spherical Patch-Based Sparse Representation. MICCAI. 2017:57–65. doi: 10.1007/978-3-319-66182-7_7. [DOI] [PMC free article] [PubMed] [Google Scholar]
- 13.Lyttelton O, et al. An unbiased iterative group registration template for cortical surface analysis. Neuroimage. 2007;34(4):1535–1544. doi: 10.1016/j.neuroimage.2006.10.041. [DOI] [PubMed] [Google Scholar]
- 14.Evans AC, et al. Brain templates and atlases. Neuroimage. 2012;62(2):911–922. doi: 10.1016/j.neuroimage.2012.01.024. [DOI] [PubMed] [Google Scholar]
- 15.https://www.nitrc.org/projects/infantsurfatlas


