

Abstract
Despite the plethora of studies discussing the benefits of vitamin D on physiological functioning, there are few mathematical models of vitamin D that predict the response of the body on low-concentration supplementation of vitamin D in a sunlight-restricted diet. This study developed a physiologically based pharmacokinetic (PBPK) model utilizing published human data on the metabolic cascade of orally-derived, low-concentration (placebo, 5 μg, and 10 μg) supplementation of vitamin D over the course of 28 days in the absence of sunlight. Vitamin D and its metabolites are highly lipophilic and binding assays of these compounds in serum may not account for binding by lipids and additional proteins. To compensate for the additional bound amounts, this study allowed the effective adipose:plasma partition coefficient to vary dynamically with the concentration of each compound in serum utilizing the well-known Hill equation for binding. Through incorporating the optimized parameters with the adipose partition coefficient adaptation to the PBPK model, this study was able to fit serum concentration data for circulating vitamin D at all three supplementation concentrations within confidence intervals of the data.
Keywords: Vitamin D, PBPK
Short Abstract
This study developed a PBPK model utilizing published human data on the metabolic cascade of orally-derived, low-concentration supplementation of vitamin D in the absence of sunlight. In addition, this study allowed the effective adipose:plasma partition coefficient to vary with serum concentration, allowing for a fit to serum concentration data at all supplementation levels.
Introduction
Optimal vitamin D status has been linked to everything from cardiovascular and musculoskeletal health to protection against several types of cancer and autoimmune diseases [Pludowski et al., 2013]; yet, roughly 33% of the population of the United States is either deficient or at risk for vitamin D deficiency [Looker et al., 2011] and similar results can be seen worldwide [Holick, 2007; Lips, 2010]. Current recommendations suggest a minimum threshold level of 30 ng/mL for Vitamin D for sufficiency [Ross et al., 2011]. Changes in lifestyle and increased time indoors are believed to be responsible for the observed increase in vitamin D deficiency. As vitamin D production occurs in the skin in response to sunlight, coupled with the average American spending an estimated 93% of every 24-hour period indoors [Wagner et al., 2008], individuals are increasingly turning to oral supplements as an alternative way of obtaining vitamin D.
The primary source of vitamin D for the human body is through synthesis in the skin in response to ultraviolet (UV) exposure. However, as the strength of UV exposure is highly dependent on latitude and season, reduced sunlight exposure is correlated with lower vitamin D concentrations in the body [Krzyścin et al., 2011]. Furthermore, production of vitamin D is self-limiting [Schuster, 2011], and individual response to UV exposure varies with ethnicity as well as duration of exposure [Webb, 2006]. These factors increase the difficulty of quantifying vitamin D concentration via sunlight exposure. Confounding this variation in vitamin D concentration is the oral supplementation of vitamin D. Beginning in the early 20th century, a majority of milk and cereal products in the United States have been fortified with vitamin D to stave off the effects of vitamin D deficiency [Holick, 2010]. In addition, an increasing number of adults are consuming multivitamins containing vitamin D [Gahche et al., 2011]. Diet-derived vitamin D becomes a major consideration with populations in low UV-exposure environments, such as dark winters or submarines. Here, lack of exposure makes synthesis of vitamin D virtually negligible [Gilman et al., 1982; Webb, 2006]. Data gathered from studies completed in these environments indicate that variation in vitamin D concentration is directly correlated to diet supplementation [Gasier et al., 2014; Zwart et al., 2011]. Despite the rising interest in vitamin D and its influence on biological functions in the human body, current mathematical models that describe the absorption, distribution, metabolism, and excretion, much less the biological effects of vitamin D, are limited [Ramakrishnan et al., 2016]. The three main types of available mathematical models for humans describe: the interplay between vitamin D and other compounds [Chun et al., 2012; Dunn, 1988]; seasonal variation of vitamin D concentrations based only on sunlight exposure [Diffey, 2010; Krzyścin et al., 2011] or the combination of diet and sunlight [Brown et al., 2013; Diffey, 2013]; and lastly, kinetics of solar absorption and its implication on overall vitamin D concentration [Olds et al., 2008]. A notable gap is a mathematical model that can describe variations of the vitamin D metabolic cascade at the individual level for humans. Physiologically based pharmacokinetic (PBPK) models are an established mathematical tool used to quantify absorption, distribution, metabolism and excretion (ADME) for compounds absorbed via different routes of exposure. The authors selected PBPK modeling to describe human pharmacokinetic data for vitamin D obtained in healthy individuals.
This study constructed a coupled human PBPK model of vitamin D and its primary metabolite 25(OH)D. Our PBPK model focused on low concentration daily oral supplementation used during minimal sunlight exposure during winter in the United Kingdom. Under these conditions, dermal production of vitamin D is assumed to be at a minimum. Both PBPK submodels were initialized to steady-state conditions matching literature serum values for each compound. An additional challenge presented by this compounds is due to its extremely high lipophilicity (log Kow = 10.2) and related impact on the adipose solubility or partition coefficient. A novel component of this model consists of the inclusion of a dynamic change in solubility reflected during quasi-steady state conditions as represented by an equivalent adipose partition coefficient. The authors also discuss potential physiological mechanisms associated with this change in adipose solubility observed in humans during winter months.
Materials and methods
Data sets used for model development and verification
This study utilized published data from [Fry, 2014] to investigate the effects of oral supplementation on vitamin D3 (notated in this study as D) over the course of 28 days without sunlight as a confounding factor. Participants (n = 24) were randomly and equally allocated into three categories according to dosage concentration: a placebo dose, 5 μg (200 IU) vitamin D, and 10 μg (400 IU) vitamin D. Note while Fry [2014] tested an additional hypothesis regarding supplementation of vitamin D2 (a plant-derived analog of vitamin D), this study focused exclusively on vitamin D to limit the potentially confounding effects of vitamin D2 on serum metabolite concentrations [Holick et al., 2008; Tripkovic et al., 2012]. Data were segregated by dose and the outer 15% of the data were trimmed to reduce the effects of outliers on error calcuations. Model simulations used the trimmed mean and 95% confidence intervals for calibration.
PBPK model for Vitamin D
A seven-compartment PBPK model (adipose tissue, kidney, liver, rapidly perfused tissue, slowly perfused tissue, and venous and arterial blood) was developed for vitamin D and 25(OH)D. A schematic of the PBPK model for each compound is shown in Fig. 1. A recent study suggests protein-mediated uptake of vitamin D from the intestines is possible, but concentration-dependent passive diffusion may also occur [Reboul et al., 2011]. Several other confounding factors, including circulating vitamin D status, may also affect the intestinal absorption of vitamin D [Borel et al., 2015]. As little is known about the protein-mediated routes, this study assumed diffusive, non-saturable, and continuous absorption of vitamin D into the liver [Hollander et al., 1978; Hollis and Wagner, 2013]. Vitamin D was consumed by participants on a daily basis through normal diet (mean consumption 2.4 μg per day) and supplementation; this was incorporated into the PBPK model by pulsing the initial condition for Ad, the amount of vitamin D effectively in the GI lumen en route to the liver, using (Eq. 1):
| (1) |
where Day(t) is the input of vitamin D to the liver, Sup is one of the three supplementation amounts (0 μg, 5 μg, or 10 μg) and t is in hours. The overall rate of absorption into the liver is given by
| (2) |
where Kabs is the absorption constant (hr−1). Estimates of vitamin D absorption are highly variable and depend on a myriad of factors, including genetic mutations in enzymes [Borel et al., 2015]. This study estimated the absorption constant by utilizing the half-life of vitamin D (T1/2 = 24 hours, [Zerwekh, 2008]) to estimate the elimination constant, Ke, and the time to max concentration (Tmax = 4 hours, [Heaney and Armas, 2015]) to solve Eq. (3) for Kabs:
| (3) |
Figure 1:
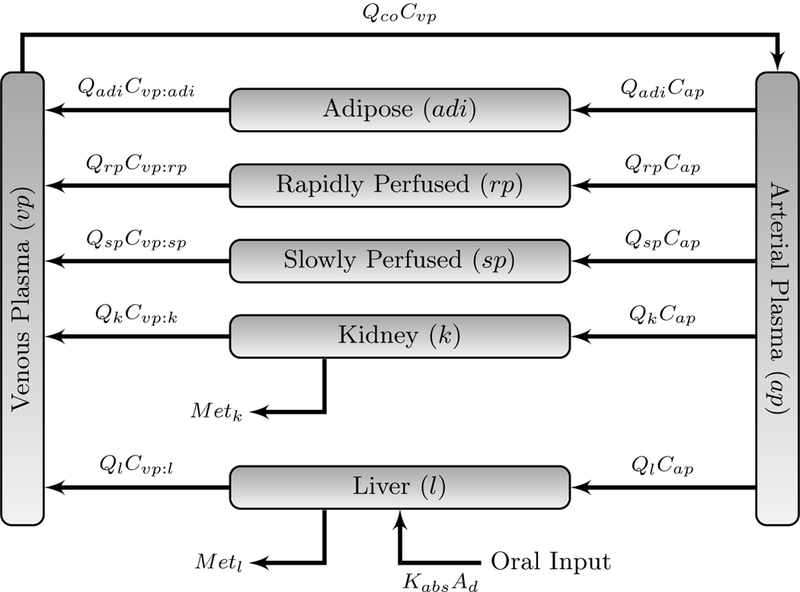
Initial PBPK model for vitamin D. Refer to Table 1 for definition of symbols. Ml and Mk are as defined in (Eq. 5)
Physiological parameters for humans were obtained from Brown et al. [1997]. The slowly perfused compartment was composed of skin, muscle and bone. The rapidly perfused compartment served as a mass-balance compartment and comprised all tissue not previously accounted. Fractional blood flow rates for the slowly perfused compartment was equal to the sum of the rates of its components. The fractional blood flow rate of the rapidly perfused compartment was equal to the remaining fractional blood flow rates. Physiological values used in this study are found in Table 1.
Table 1:
Physiological Parameters
| Parameter | Description | Value | Units | Source |
|---|---|---|---|---|
| Volumes | ||||
| BW | Body Weighta | 70 | kg | [Brown et al., 1997] |
| Vadi | Fraction of body weight as adipose | 21.4 | Unitless | [Brown et al., 1997] |
| Vk | Fraction of body weight as kidney | 0.4 | Unitless | [Brown et al., 1997] |
| Vl | Fraction of body weight as liver | 2.6 | Unitless | [Brown et al., 1997] |
| Vrp | Fraction of body weight as rapidly perfusedb | 9.6 | Unitless | [Brown et al., 1997] |
| Vsp | Fraction of body weight as slowly perfused c | 58.0 | Unitless | [Brown et al., 1997] |
| Vap | Fraction of body weight as arterial blood |
2.0 | Unitless | [Brown et al., 1997] |
| Vvp | Fraction of body weight as venous blood | 6.0 | Unitless | [Brown et al., 1997] |
| Flow Rates | ||||
| Qco | Cardiac output | 312 | L/hr | [Brown et al., 1997] |
| BP | Blood:plasma ratio | 0.55d | Unitless | [Ramakrishnan et al., 2016] |
| Qadi | Fraction cardiac output to adipose | 5.2 | Unitless | [Brown et al., 1997] |
| Qk | Fraction cardiac output to kidney | 17.5 | Unitless | [Brown et al., 1997] |
| Ql | Fraction cardiac output to liver | 22.7 | Unitless | [Brown et al., 1997] |
| Qrp | Fraction cardiac output to rapidly perfused | 25.5 | Unitless | [Brown et al., 1997] |
| Qsp | Fraction cardiac output to slowly perfused | 29.1 | Unitless | [Brown et al., 1997] |
| Qap | Fraction cardiac output to arterial blood | 1.5 | Unitless | [Brown et al., 1997] |
| Qvp | Fraction cardiac output to venous blood | 4.4 | Unitless | [Brown et al.,1997] |
| Partition coefficients | ||||
| D adipose/plasma partition coeffi-cient | 2.4 | Unitless | [Heaney et al., 2009] | |
| D kidney/plasma partition coefficiente | 1.02 | Unitless | [Heaney et al., 2009] | |
| D liver/plasma partition coefficient | 1.02 | Unitless | [Heaney et al., 2009] | |
| D rapidly perfused/plasma partition coefficientf | 0.44 | Unitless | [Heaney et al., 2009] | |
| D slowly perfused/plasma partition coefficient | 0.42 | Unitless | [Heaney et al., 2009] | |
| 25(OH)D adipose/plasma partition coefficient | 0.11 | Unitless | [Heaney et al., 2009] | |
| 25(OH)D kidney/plasma partition coefficient | 0.23 | Unitless | [Heaney et al., 2009] | |
| 25(OH)D liver/plasma partition coefficient | 0.23 | Unitless | [Heaney et al., 2009] | |
| 25(OH)D rapidly perfused/plasma partition coefficient | 0.08 | Unitless | [Heaney et al., 2009] | |
| 25(OH)D slowly perfused/plasma partition coefficient | 0.05 | Unitless | [Heaney et al., 2009] | |
| Kinetic Parameters | ||||
| Michelis-Menten constant for CYP27A1 | 3.2 | μmol/L | [Sakaki et al., 2005] | |
| In vitro maximum velocity for CYP27A1 | 0.269 | mol/min/mol p450 |
[Sakaki et al., 2005] | |
| Michelis-Menten constant for CYP2R1 | 0.45 | μmol/L | [Shinkyo et al., 2004] | |
| In vitro maximum velocity for CYP2R1 | 1.2 | mol/min/mol p450 |
[Shinkyo et al., 2004] | |
| Michelis-Menten constant for CYP27B1 | 0.9 | μmol/L | [Tang et al., 2012] | |
| In vitro maximum velocity for CYP27B1 | 1.3 | nmol/min/mg p450 |
[Tang et al., 2012] | |
| Michelis-Menten constant for CYP24A1 | 0.16 | μmol/L | [Sakaki et al., 2005] | |
| In vitro maximum velocity for CYP24A1 | 0.088 | mol/min/mol p450 |
[Sakaki et al., 2005] | |
| P450liv | Conversion factor for CYP enzymes in liver | 11 | nmol p450/g liver | [Wilson et al., 2003] |
| P450kid | Conversion factor for CYP enzymes in kidney | 12.8 | mg p450/g kidney | [Al-Jahdari et al., 2006] |
| CYP27A1 | Enzyme fraction for CYP27A1 | 0.010 | Unitless | optimized |
| CYP2R1 | Enzyme fraction for CYP2R1 | 0.075 | Unitless | optimized |
| CYP27B1 | Enzyme fraction for CYP27B1 | 0.016 | Unitless | optimized |
| CYP24A1 | Enzyme scalar for CYP24A1 | 0.012 | Unitless | optimized |
| Additional Parameters | ||||
| Kabs | Absorption constantg | 0.88 | hr−1 | estimated |
| UnbD | Unbound percentage of vitamin D | 0.083 | Unitless | optimized |
| Unb25 | Unbound percentage of 25(OH)D | 0.03 | Unitless | [Bikle et al., 1986] |
| h | Hill coefficient | 4.0 | Unitless | optimized |
| Effect level for vitamin Dh | 4.08 | nmol/L | optimized | |
| Effect level for 25(OH)D | 4.45 | nmol/L | optimized | |
D, Vitamin D; 25, 25(OH)D
Reference body weight. Organ density is assumed to be 1 kg = 1 L
Richly perfused tissues included adrenal, blood , brain, gastrointestinal tissues, heart, lungs and thyroid. This compartment served as a mass balance compartment, namely 100 — ∑c VC for other compartments c
Poorly perfused tissues included muscle, skin, and bone
Plasma flow rates assumed a hematocrit value of 0.45 as vitamin D and its metabolites are primarily bound to plasma compounds
Kidney measurements were not taken in Heaney et al. [2009]; this partition coefficient was set equal to the rapidly perfused tissue
Measurements were set to the “remainder” compartment as given in [Heaney et al., 2009]
Estimated using the half-life of vitamin D [Zerwekh, 2008] and the time to maximum concentration [Heaney and Armas, 2015]
Partition Coefficients.
Human distribution data for vitamin D and 25(OH)D are limited [Blum et al., 2008; Didriksen et al., 2015; Mawer et al., 1972]. Total amounts of vitamin D and 25(OH)D in each compartment obtained by Heaney et al. [2009] were divided by a referent human tissue volume to find concentration. This study followed the assumption in [Heaney et al., 2009] that pigs are sufficiently similar to humans to allow for comparison. Tissue:plasma partition coefficients, PT:p, were taken to be the ratio between tissue and serum concentrations. As compound amounts in the kidney were not given, this study assumed the kidney and liver partition coefficients were identical. Calculated tissue:plasma partition coefficients are given in Table 1.
Heaney et al. [2009] establishes typical daily intake of vitamin D is not sufficient to allow for accumulation in tissues; rather, additional vitamin D inputs are metabolized into 25(OH)D almost immediately. As this is indicative of a non-steady state situation, traditional methods of comparing serum and tissue amounts to define a tissue:plasma partition coefficient, particularly in the adipose tissue, may not be appropriate for such a highly lipophilic compound.
The high lipophilicity of vitamin D may allow an increased binding to lipids and the vitamin D binding protein (DBP) in the plasma [Poulin, 2015], with the DBP- bound and lipid-bound fraction of vitamin D and 25(OH)D more important than previously thought [Speeckaert et al., 2010]. This binding may be concentration- dependent and can influence the effective partition coefficient [Poulin and Haddad,2012], especially in the adipose tissue compartment. To account for binding to DBP, lipids, and other plasma proteins, this study used the following equation to adjust the effective adipose:plasma partition coefficient as a function of the serum concentration of vitamin D or 25(OH)D. The effective adipose:plasma partition coefficient for each compound at time t, Padi(t), is given by Eq. (4):
| (4) |
Padi:p is the calculated partition coefficient using data from [Heaney et al., 2009], Cv (t) is the calculated venous concentration of the compound at time t, EC50 is the venous concentration of the compound associated with an effect level of 50%, and h controls the steepness of the venous concentration versus partition coefficient curve.
Metabolic Cascade.
There are four main cytochrome p450 (CYP) enzymes involved in the vitamin D cascade: CYPs 2R1, 27A1, 27B1, and 24A1. A schematic of the cascade can be found in Fig. 2, where each system block is representative of the whole-body PBPK submodel for the associated compound and enzymatic pathways are indicated between organs where appropriate. Enzymes are assumed to follow Michaelis-Menten kinetics. As in vitro literature values for the Michaelis Menten constant for each enzyme are significantly higher than the circulating concentration of vitamin D or 25(OH)D [Chun et al., 2012], each enzyme is operating in the linear portion of the Michaelis-Menten curve and the velocity of the hydroxylation reaction is proportional to the concentration of the substrate in tissue [ST]. (Equation 5) yields the following form for each enzyme:
Figure 2:

Each box is representative of a whole-body PBPK model for a compound, where pathways between boxes indicate metabolic routes with relevant enzymes as labels
| (5) |
where is the metabolic rate (ng/hr) for enzyme E in tissue T, is the intrinsic clearance rate for enzyme E, and Us is the unbound fraction of the substrate. As saturation of each enzyme at low supplementation concentrations is highly unlikely, this study utilizes (Eq. 5) to model the metabolism of each enzyme. In vitro estimates of Vmax are given per unit of enzyme; the conversion factor for the concentration of enzymes in the liver (P450liv) and kidneys (P450kid) is typically given as the total sum of all enzymes per gram of tissue [Al-Jahdari et al., 2006; Wilson et al., 2003]. This study estimated the fraction of relevantCYPs by multiplying (Eq. 5) by a scalar CYPE for enzyme E. This scalar was optimized for each enzyme. Total metabolism in tissue, MetT, is given by thesum of the metabolic rates for enzymes in that tissue. Values for constant parameters relating to each enzyme are given in Table 1.
Model Equations.
Initial estimates for vitamin D and 25(OH)D in each compartment were generated assuming individuals had achieved a steady-state plasma concentration corresponding to initial trimmed mean 25(OH)D serum measurements using data from [Fry, 2014]. The steady-state serum concentration of vitamin D was 6.7% of the serum concentration of 25(OH)D [Heaney et al., 2003].
As vitamin D and its metabolites are highly lipophilic molecules with low aqueous solubility, binding to plasma proteins, including DBP, is necessary for circulation transport. Greater than 99% of vitamin D and its metabolites are bound to these carrier proteins and have limited access to target cells [Dusso et al., 2005]. Only the remaining unbound (free) portion of each compound is available for metabolism. This study used the following percent estimates for the free amount of each compound: 0.07% vitamin D [Fraser, 1980] and 0.03% 25(OH)D [Bikle et al., 1986]. Total serum amounts of each compound were converted to free amounts using these percentages.
The PBPK model was comprised of conventional mass balance equations assuming well-stirred distribution into each model compartment. As vitamin D and 25(OH)D are primarily bound to DBP which circulates at concentrations 20-fold higher than that of the metabolites [White and Cooke, 2000], this study assumed no binding to red blood cells occurred. The parameters in the equations refer to the arterial blood flow to tissue T, (QT), compound amount (A), concentration (C), volume (V), total metabolism in tissue (MetT), and tissue:plasma partition coefficients (PT:p). For notational convenience, Z is the set of non-metabolizing compartments, e.g., not the liver or the kidney, and M is the set of metabolizing compartments (specifically the liver and the kidney). Following the methods of [Ramakrishnan et al., 2016], this study scaled the blood flow to tissues by multiplying the blood flow by BP, the blood:plasma ratio, to model the rate of flow of plasma. Mass balance differential equations are based on Fig. 1 with definitions given in Table 1:
Concentration in each tissue T:
| (6) |
Non-eliminating tissue in the set Z:
| (7) |
Eliminating tissue in the set M:
| (8) |
Arterial plasma:
| (9) |
Venous plasma:
| (10) |
In the case of the liver compartment in the vitamin D submodel, (Eq. 2) is added to account for the movement of orally-obtained vitamin D into the liver. The complete PBPK model diagram, coupled through metabolism, is shown in Fig. 2.
Model simulations and parameter estimation
The model was coded in MATLAB© (version 8.5.0.197613 R2015a). Initial sensitivity analysis indicated the importance of CYP2R1,CYP27B1,CYP24A1, %free vitamin D, the hill coefficient h and estimates for EC50 for both vitamin D and 25(OH)D. All other parameters were held at available literature values. After every iteration of the optimization, model initial conditions were adjusted to account for any difference in the adipose:tissue partition coefficient.
Model evaluation and comparison
As orally-obtained vitamin D appears more rapidly in the body than sunlight- obtained vitamin D [Hollis and Wagner, 2013], the resultant serum concentration shows extreme spikes as vitamin D and its metabolites are processed in the body. The accuracy of measurements of serum 25(OH)D may be dependent of the time difference between participants taking the supplement and the serum draw. To compensate, this study utilized the first moment of the data for each 24-hour period as the model prediction for serum concentration of 25(OH)D for that period. The first moment is calculated as the arithmetic mean of the serum concentrations for each 24-hour period. This results in a smoother curve and more accurately represents the average concentration over the period of a day. Parameters were optimized using the Nelder-Mead search algorithm where the cost of fit was calculated using a weighted linear least squares comparison between the trimmed mean of the data and model predictions utilizing the 95% confidence interval for weighting.
Results
Final model predictions are shown in comparison in Fig. 3. Model predictions have been smoothed using the arithmetic mean of the 25(OH)D serum concentrations for each 24-hour period to generate a curve reflecting the overall average absorption of vitamin D each day. This eliminates daily spikes from absorption of vitamin D in the liver. Model simulations indicated that changing the absorption rate increases the amplitude of the spikes but not the overall model predictions (results not shown). All relevant parameter values are given in Table 1. Boldface and shaded entries in this table indicate optimized parameters.
Figure 3:
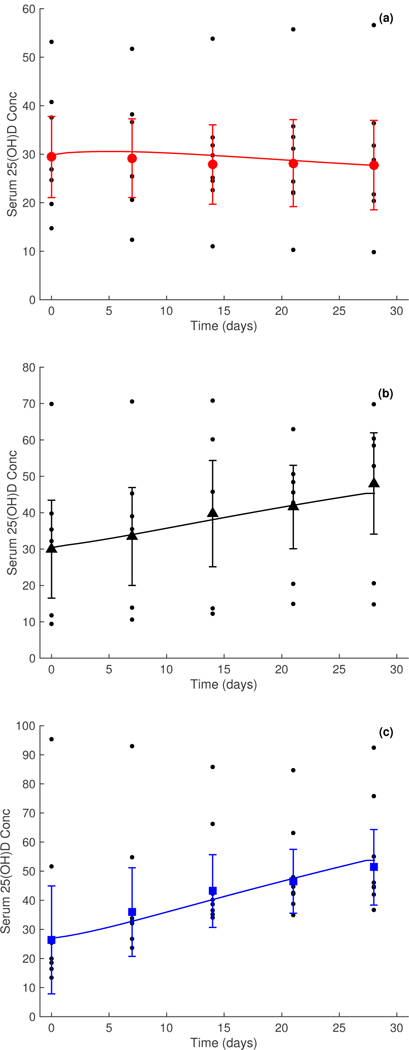
Serum 25(OH)D concentrations for three study doses over a period of 28 days, smoothed using the first moment of the data over each day. Measured geometric mean serum concentration relating to dosage concentrations of 0 μg (placebo) is given by • in panel (a), 5 μg by ▲ in panel (b), and 10 μg by ■ in panel (c). Error bars on the weekly data points signify 95% confidence intervals. Data taken from [Fry, 2014]
Study data contained several outliers; this is especially apparent in Fig. 3, panel (c) where an individual has an initial 25(OH)D serum value of 95.35 nmol/L. This is in severe contrast to six of the other individuals in this dataset with serum 25(OH)D values of less than 27 nmol/L. As a result, data for each dose were trimmed to eliminate the outer 15% of values to reduce the effects of such outliers.
Discussion
PBPK models are useful tools derived from mass balance principles, and used to integrate kinetic, metabolic, and biochemistry data for a series of related chemicals. One of their major advantages is their use to predict compounds that are difficult to measure clinically, in this case the physiologically active metabolite 1,25(OH)2D, due to its reactive chemistry. A recent trend in PBPK modeling is to assess the ability of a model to describe a particular situation, rather than all possible modifications of that situation [Caldwell et al., 2012]. This vitamin D model is designed to predict the effects of over-the-counter supplementation in winter months, in an attempt to avoid vitamin D deficiency. Although kinetic studies have been designed using single dosing schemes at pharmacological concentrations of vitamin D [Vieth, 1999]; questions still exist about the efficiency of using a single high dose to increase vitamin D to normal values [Chen et al., 2016]. However, at high concentrations, the metabolic pathway may shift from the linear portion of the associated Michaelis-Menten curve to the nonlinear portion of the curve. This shift has implications on the impact substrate concentration has on the velocity of the enzymatic reaction. In addition, the overall health of the patient must be considered when using a high oral dose. In order to avoid potential confounding factors, this study selected a kinetic study that made use of healthy individuals with vitamin D deficiency during winter months.
There are three unique approaches taken in the development of this PBPK model. The first novel contribution consists on the quantification of the metabolic conversion between vitamin D and 25(OH)D. The enzymes capable of this conversion have been identified as members of the CYP450 superfamily. The authors were unable to find any in vivo parameters for the metabolic conversion across the two related chemicals. To reduce uncertainty and the number of parameters needed for optimization in the model, this study utilized the metabolic ratios for each pathway. In this case, three metabolic pathway ratios, CYPE, were optimized for: CYP2R1, CYP27B1, and CYP24A1. The sensitivity of these parameters at physiological concentrations (results not shown) further supports the claim that CYP2R1 may be the key enzyme required for 25-hydroxylation of vitamin D versus CYP27A1, which may be more important at pharmaceutical concentrations [Adams and Hewison, 2010; Cheng et al., 2004]. Future research concentrating on different dose levels can further elucidate the role of different metabolic pathways needed.
A second contribution of this PBPK model consists on its emphasis on the plasma compartment having a central role in distribution due to the importance of plasma binding. Although plasma binding has been considered for other PBPK models, a PBPK model describing a series of metabolically related compounds has unique mathematical constraints [Nestorov et al., 1997] due to the structural link between compounds. The Nestorov et al. [1997] approach also included the impact of plasma binding due to the class of drugs selected for their study. Estimates on the amount of plasma unbound 25(OH)D have been known for 30 years [Bikle et al., 1986]. However, estimates for unbound portion of vitamin D (parent compound) are less certain, with an initial estimate of 0.07% [Fraser, 1980]. This parameter was highly sensitive to changes; however, the optimized value (0.083%) for unbound vitamin D was fairly close to the value of [Fraser 1980]. Obtaining a prediction with a value close to a known measurement from the literature increases our confidence in our results.
The third contribution of this PBPK model relates to our novel description of the adipose tissue. Previous PBPK models for highly lipophilic compounds have made use of a membrane-limited description for the adipose tissue, by adding a capillary membrane and a related permeability parameter [Evans and Andersen, 2000]. Although this approach worked well for a quasi steady-state model for dioxin, our assessment for the time course suggested that a different approach was needed. In essence, the time course data indicates that steady-state values may not be achieved within 24 hours. A dynamic adipose partition coefficient using the Hill equation was adopted to reflect the empirically-observed decreased time to steady state. When the Hill coefficient is higher than one, the time course observation shifts to the left, taking less time to achieve a constant value. Our optimized value for the Hill coefficient was was 4, making a shorter effective partition coefficient as suggested by the time course data. The application of a dynamic adipose partition coefficient allowed us to preserve the blood flow limited structure for both compounds related to Vitamin D.
In addition, the tissue:plasma partition coefficients for both vitamin D and 25(OH)D were calculated from experimental measurements in pigs [Heaney et al., 2009]. When data for partition coefficients in humans is lacking, it is acceptable to use solubility data from an analog species that is assumed to be similar enough to humans. The use of pig data allowed us to fix the partition coefficient value for all organs, including a base value for adipose partition coefficient. The base adipose value used in our model is 2, and this value is consistent with the estimated adipose value used by [Ramakrishnan et al., 2016]. Partition coefficient values for other organs were comparable to [Ramakrishnan et al., 2016]. This is of importance, due to the sparse number of vitamin D PBPK models available for comparison. Thus, having a base adipose coefficient that is consistent with the other available PBPK model increases our confidence in the approach taken here.
The authors have speculated on the reason for the need for a dynamic adipose partition coefficient and its relation to the studies being performed during the winter months. The existence of brown adipose tissue has been known for some time, but recent research suggesting a possible anti-obesogenic role has contributed to increased understanding of its function in adult humans [Schulz and Tseng, 2013]. Human brown adipose tissue is a combination of white and brown adipose tissue, having distinct properties from white adipose tissue. There is clinical evidence that brown adipose tissue becomes activated during the winter months, engaging in glucose metabolism needed to generate energy to maintain a constant internal body temperature [Au-Yong et al., 2009]. This metabolism from the brown adipose depot will be constantly drawing vitamin D into the adipose compartment, slightly perturbing steady state. During summer, the brown adipose tissue has been shown to be inactive, making the adipose compartment more homogeneous in nature. Therefore, a separate but similar experiment conducted in the summer should predict a Hill coefficient close to one, where a steady state value for the adipose partitioning would be expected. Data measuring the impact of seasonal variability on the adipose kinetics of very lipophilic compounds is needed for future model refinements, including those of vitamin D like chemicals.
Although the model predictions using the dynamic partition coefficients fit within the confidence intervals of the data (Fig. 3), there is a very large degree of variability in the confidence intervals for the data. This is indicative of the variance in the ability of a human to process and sequester vitamin D. Variability in the data affects the model predictions at latter time points; the optimization process takes the variability into account through the weighted cost function. This flexibility in the optimization procedure allows the model to fit the overall trends of the data rather than just the mean data points which may be skewed by outliers. Since individual clinical data were available from [Fry, 2014], we were able to estimate our own statistics in relation to time course data after oral supplementation.
In summary, this study developed a PBPK model for vitamin D and its metabolites focusing on daily supplementation of vitamin D at physiological levels in the absence of sunlight. A modified form of the Hill equation was utilized to adjust the adipose:plasma partition coefficient dynamically with the concentrations of each metabolite in the venous compartment; this allows the model to compensate for binding of each compound to lipids and different kinds of lipids activated during the winter months. The resulting model was able to predict serum concentration data for circulating vitamin D at all three supplementation concentrations within confidence intervals of the data.
Acknowledgements
MES was supported in part by a 2014 Southern New Hampshire University Summer Grant and in part by North Carolina State University. The authors would like to thank Drs. Kristen Isaacs, Woody Setzer, and Jane Ellen Simmons, as well as the anonymous reviewers for their helpful comments on the preparation of this manuscript.
Footnotes
Disclaimer
The information in this document has been funded wholly (or in part) by the U.S. Environmental Protection Agency. It has been subjected to review by the National Health and Environmental Effects Research Laboratory and approved for publication. Approval does not signify that the contents reflect the views of the Agency, nor does mention of trade names or commercial products constitute endorsement or recommendation for use.
Contributor Information
Megan E. Sawyer, Department of Mathematics, North Carolina State University, Raleigh, NC 27695, USA
Hien T. Tran, Department of Mathematics, North Carolina State University, Raleigh, NC 27695, USA
Marina V. Evans, National Health and Environmental Effects Research Laboratory, US Environmental Protection Agency, Office of Research and Development, Research Triangle Park, NC 27709, USA
References
- Adams JS and Hewison M (2010) Update in vitamin D. J. Clin. Endocrinol. Metab, 95, 471–478, doi: 10.1210/jc.2009-1773. [DOI] [PMC free article] [PubMed] [Google Scholar]
- Al-Jahdari WS, Yamamoto K, Hiraoka H, Nakamura K, Goto F, and Hori- uchi R (2006) Prediction of total propofol clearance based on enzyme activities in microsomes from human kidney and liver. Eur. J. Clin. Pharmacol, 62 (7), 527–533, doi: 10.1007/s00228-006-0130-2. [DOI] [PubMed] [Google Scholar]
- Au-Yong IT, Thorn N, Ganatra R, Perkins AC, and Symonds ME (2009) Brown adipose tissue and seasonal variation in humans. Diabetes, 58 (11), 2583–2587. [DOI] [PMC free article] [PubMed] [Google Scholar]
- Bikle D, Halloran B, Gee E, Ryzen E, and Haddad J (1986) Free 25- hydroxyvitamin D levels are normal in subjects with liver disease and reduced total 25-hydroxyvitamin D levels. J. Clin. Invest, 78 (3), 748, doi: 10.1172/JCI112636. [DOI] [PMC free article] [PubMed] [Google Scholar]
- Blum M, Dolnikowski G, Seyoum E, Harris SS, Booth SL, Peterson J, Saltzman E, and Dawson-Hughes B (2008) Vitamin d3 in fat tissue. Endocrine, 33 (1), 90–94. [DOI] [PMC free article] [PubMed] [Google Scholar]
- Borel P, Caillaud D, and Cano N (2015) Vitamin d bioavailability: State of the art. Crit. Rev. Food Sci. Nutr, 55 (9), 1193–1205, doi: 10.1080/10408398.2012.688897. [DOI] [PubMed] [Google Scholar]
- Brown J, Ignatius A, Amling M, and Barvencik F (2013) New perspectives on vitamin D sources in Germany based on a novel mathematical bottom-up model of 25(OH)D serum concentrations. Eur. J. Nutr, 52 (7), 1733–1742, doi: 10.1007/s00394-012-0477-3. [DOI] [PubMed] [Google Scholar]
- Brown RP, Delp MD, Lindstedt SL, Rhomberg LR, and Beliles RP (1997) Physiological parameter values for physiologically based pharmacokinetic models. Toxicol. Ind. Health, 13 (4), 407–484. [DOI] [PubMed] [Google Scholar]
- Caldwell JC, Evans MV, and Krishnan K (2012) Cutting edge PBPK models and analyses: Providing the basis for future modeling efforts and bridges to emerging toxicology paradigms. J. Toxicol, 2012, 852 384, doi: 10.1155/2012/852384. [DOI] [PMC free article] [PubMed] [Google Scholar]
- Chen P.z., Li M, Duan X.h., Jia J.y., Li J.q., Chu R.a., Yu C, Han J.h., and Wang H (2016) Pharmacokinetics and effects of demographic factors on blood 25 (oh) d3 levels after a single orally administered high dose of vitamin d3. Acta Pharmacol. Sin, 37 (11), 1509–1515. [DOI] [PMC free article] [PubMed] [Google Scholar]
- Cheng J, Levine M, Bell N, Mangelsdorf D, and Russell D (2004) Genetic evidence that the human CYP2R1 enzyme is a key vitamin D 25-hydroxylase. Proc. Natl. Acad. Sci. U. S. A, 101 (20), 7711–7715, doi: 10.1073/pnas.0402490101. [DOI] [PMC free article] [PubMed] [Google Scholar]
- Chun R, Peercy B, Adams J, and Hewison M (2012) Vitamin D binding protein and monocyte response to 25-hydroxyvitamin D and 1,25-dihydroxyvitamin D: Analysis by mathematical modeling. PLoS One, 7 (1), e30 773, doi: 10.1371/journal.pone.0030773. [DOI] [PMC free article] [PubMed] [Google Scholar]
- Didriksen A, Burild A, Jakobsen J, Fuskevåg OM, and Jorde R (2015) Vitamin d3 increases in abdominal subcutaneous fat tissue after supplementation with vitamin d3. Eur. J. Endocrinol, 172 (3), 235–241. [DOI] [PubMed] [Google Scholar]
- Diffey BL (2010) Modelling the seasonal variation of vitamin D due to sun exposure. Br. J. Dermatol, 162, 1342–1348, doi: 10.1111/j.1365-2133.2010.09697.x. [DOI] [PubMed] [Google Scholar]
- Diffey BL (2013) Modelling vitamin D status due to oral intake and sun exposure in an adult british population. Br. J. Nutr, 110 (03), 569–577, doi: 10.1017/S0007114512005466. [DOI] [PubMed] [Google Scholar]
- Dunn J (1988) Computer simulation of vitamin D transport. Ann. N. Y. Acad. Sci, 538 (1), 69–76, doi: 10.1111/j.1749-6632.1988.tb48851.x. [DOI] [PubMed] [Google Scholar]
- Dusso AS, Brown AJ, and Slatopolsky E (2005) Vitamin D. American Journal of Physiology - Renal Physiology, 289 (1), F8–F28, doi: 10.1152/ajprenal.00336.2004. [DOI] [PubMed] [Google Scholar]
- Evans MV and Andersen ME (2000) Sensitivity analysis of a physiological model for 2,3,7,8-tetrachlorodibenzo-p-dioxin (TCDD): Assessing the impact of specific model parameters on sequestration in liver and fat in the rat. Toxicol. Sci, 54 (1), 71–80, doi: 10.1093/toxsci/54.1.71. [DOI] [PubMed] [Google Scholar]
- Fraser DR (1980) Regulation of the metabolism of vitamin D. Physiol. Rev, 60 (2), 551–613. [DOI] [PubMed] [Google Scholar]
- Fry C (2014) Vitamin D and Cardiovascular Disease, Ph.D. thesis, King’s College London: URL https://kclpure.kcl.ac.uk/portal/files/61288715/2014_Fry_Catherine_1055698_ethesis.pdf. [Google Scholar]
- Gahche J, Bailey R, Burt V, Hughes J, Yetley E, Dwyer J, Picciano MF, McDowell M, and Sempos C (2011) Dietary supplement use among U.S. adults has increased since NHANES III (1988–1994). NCHS, Data Brief (61). URL http://www.cdc.gov/nchs/data/databriefs/db61.htm. [PubMed] [Google Scholar]
- Gasier H, Gaffney-Stomberg E, Young C, McAdams D, Lutz L, and Mc- Clung J (2014) The efficacy of vitamin D supplementation during a prolonged submarine patrol. Calcif. Tissue Int, 95 (3), 229–239, doi: 10.1007/s00223-014-9886-z. [DOI] [PubMed] [Google Scholar]
- Gilman S, Biersner R, and Bondi K (1982) Effect of a 68-day submarine patrol on serum 25-hydroxyvitamin D levels in healthy men. Int. J. Vitam. Nutr. Res, 52 (1), 63–67. URL http://europepmc.org/abstract/MED/7085202. [PubMed] [Google Scholar]
- Heaney RP and Armas LA (2015) Quantifying the vitamin d economy. Nutr. Rev, 73 (1), 51–67. [DOI] [PubMed] [Google Scholar]
- Heaney RP, Davies KM, Chen TC, Holick MF, and Barger-Lux MJ (2003) Human serum 25-hydroxycholecalciferol response to extended oral doing with cholecalciferol. Am. J. Clin. Nutr, 77, 204–210. URL http://ajcn.nutrition.org/content/77/1/204.short. [DOI] [PubMed] [Google Scholar]
- Heaney RP, Horst RL, Cullen DM, and Armas LA (2009) Vitamin D3 distribution and status in the body. J. Am. Coll. Nutr, 28, 252–256. [DOI] [PubMed] [Google Scholar]
- Holick M (2010) The vitamin D deficiency pandemic: a forgotten hormone important for health. Public Health Rev, 32 (267–283). URL http://www.publichealthreviews.eu/show/f/35. [Google Scholar]
- Holick MF (2007) Vitamin D deficiency. N. Engl. J. Med, 357 (3), 266–281, doi: 10.1056/NEJMra070553. [DOI] [PubMed] [Google Scholar]
- Holick MF, Biancuzzo RM, Chen TC, Klein EK, Young A, Bibuld D, Reitz R, Salameh W, Ameri A, and Tannenbaum AD (2008) Vitamin D2 is as effective as vitamin D3 in maintaining circulating concentrations of 25- hydroxyvitamin D. J. Clin. Endocrinol. Metab, 93 (3), 677–681, doi: 10.1210/jc.2007-2308. [DOI] [PMC free article] [PubMed] [Google Scholar]
- Hollander D, Muralidhara K, and Zimmerman A (1978) Vitamin D-3 intestinal absorption in vivo: Influence of fatty acids, bile salts, and perfusate pH on absorption. Gut, 19 (4), 267–272, doi: 10.1136/gut.19.4.267. [DOI] [PMC free article] [PubMed] [Google Scholar]
- Hollis BW and Wagner CL (2013) The role of the parent compound vitamin d with respect to metabolism and function: why clinical dose intervals can affect clinical outcomes. J. Clin. Endocrinol. Metab, 98 (12), 4619–4628, doi: 10.1210/jc.2013-2653. [DOI] [PMC free article] [PubMed] [Google Scholar]
- Krzyscin JW, Jaroslawski J, and Sobolewski PS (2011) A mathematical model for seasonal variability of vitamin D due to solar radiation. J. Photochem. Pho- tobiol. B, 105, 106–112, doi: 10.1016/j.jphotobiol.2011.07.008. [DOI] [PubMed] [Google Scholar]
- Lips P (2010) Worldwide status of vitamin D nutrition. The Journal of Steroid Biochemistry and Molecular Biology, 121 (1–2), 297–300, doi: 10.1016/j.jsbmb.2010.02.021. [DOI] [PubMed] [Google Scholar]
- Looker AC, Johnson CL, Lacher DA, Pfeiffer CM, Schleicher RL, and Sempos CT (2011) Vitamin d status: United states, 2001–2006. NCHS data brief., 59 URL http://198.246.124.22/nchs/data/databriefs/db59.pdf. [PubMed] [Google Scholar]
- Mawer E, Backhouse J, Holman C, Lumb G, and Stanbury S (1972) The distribution and storage of vitamin d and its metabolites in human tissue. Clin. Sci, 43 (3), 413–31. [DOI] [PubMed] [Google Scholar]
- Nestorov IA, Aarons LJ, and Rowland M (1997) Physiologically based pharmacokinetic modeling of a homologous series of barbiturates in the rat: a sensitivity analysis. J. Pharmacokinet. Biopharm, 25 (4), 413–447. [DOI] [PubMed] [Google Scholar]
- Olds W, McKinley A, Moore M, and Kimlin M (2008) In vitro model of vitamin D3 (cholecalciferol) synthesis by UV radiation: Dose-response relationships. J. Photochem. Photobiol. B, 93 (2), 88–93, doi: 10.1016/j.jphotobiol.2008.07.004. [DOI] [PubMed] [Google Scholar]
- Pludowski P, Holick MF, Pilz S, Wagner CL, Hollis BW, Grant WB, Shoenfeld Y, Lerchbaum E, Llewellyn DJ, Kienreich K, and Soni M (2013) Vitamin D effects on musculoskeletal health, immunity, autoimmunity, cardiovascular disease, cancer, fertility, pregnancy, dementia and mortality-a review of recent evidence. Autoimmun. Rev, 12 (10), 976–989, doi: 10.1016/j.autrev.2013.02.004. [DOI] [PubMed] [Google Scholar]
- Poulin P (2015) A paradigm shift in pharmacokinetic-pharmacodynamic (pkpd) modeling: Rule of thumb for estimating free drug level in tissue compared with plasma to guide drug design. J. Pharm. Sci, 104 (7), 2359–2368, doi: 10.1002/jps.24468. [DOI] [PubMed] [Google Scholar]
- Poulin P and Haddad S (2012) Advancing prediction of tissue distribution and volume of distribution of highly lipophilic compounds from a simplified tissue-composition-based model as a mechanistic animal alternative methods. J. Pharm. Sci, 101 (6), 2250–2261, doi: 10.1002/jps.23090. [DOI] [PubMed] [Google Scholar]
- Ramakrishnan V, Yang QJ, Quach HP, Cao Y, Chow EC, Mager DE, and Pang KS (2016) Physiologically-based pharmacokinetic- pharmacodynamic modeling of 1a, 25-dihydroxyvitamin d3 in mice. Drug Metab. Dispos, 44 (2), 189–208. [DOI] [PubMed] [Google Scholar]
- Reboul E, Goncalves A, Comera C, Bott R, Nowicki M, Landrier JF, Jourdheuil-Rahmani D, Dufour C, Collet X, and Borel P (2011) Vitamin D intestinal absorption is not a simple passive diffusion: evidences for involvement of cholesterol transporters. Molecular nutrition & food research, 55 (5), 691–702, doi: 10.1002/mnfr.201000553. [DOI] [PubMed] [Google Scholar]
- Ross A, Taylor C, Yaktine A, and Del Valle H (2011) Dietary reference intakes for calcium and vitamin D, Natl Academy Pr. [PubMed] [Google Scholar]
- Sakaki T, Kagawa N, Yamamoto K, and Inouye K (2005) Metabolism of vitamin D3 by cytochromes P450. Front. Biosci, 10, 119–134. URL. http://www.bioscience.org/2005/v10/af/1514/fulltext.htm. [DOI] [PubMed] [Google Scholar]
- Schulz TJ and Tseng YH (2013) Brown adipose tissue: development, metabolism and beyond. Biochem. J, 453 (2), 167–178. [DOI] [PMC free article] [PubMed] [Google Scholar]
- Schuster I (2011) Cytochromes P450 are essential players in the vitamin D signaling system. Biochim. Biophys. Acta, Proteins Proteomics, 1814 (1), 186–199, doi: 10.1016/j.bbapap.2010.06.022. [DOI] [PubMed] [Google Scholar]
- Shinkyo R, Sakaki T, Kamakura M, Ohta M, and Inouye K (2004) Metabolism of vitamin D by human microsomal CYP2R1. Biochem. Biophys. Res. Commun, 324, 451–457, doi: 10.1016/j.bbrc.2004.09.073. [DOI] [PubMed] [Google Scholar]
- Speeckaert MM, Taes YE, De Buyzere ML, Christophe AB, Kaufman JM, and Delanghe JR (2010) Investigation of the potential association of vitamin d binding protein with lipoproteins. Ann. Clin. Biochem, 47 (2), 143–150, doi: 10.1258/acb.2009.009018. [DOI] [PubMed] [Google Scholar]
- Tang EK, Tieu EW, and Tuckey RC (2012) Expression of human CYP27B1 in Escherichia coli and characterization in phospholipid vesicles. FEBS J, 279 (19), 3749–3761, doi: 10.1111/j.1742-4658.2012.08736.x. [DOI] [PubMed] [Google Scholar]
- Tripkovic L, Lambert H, Hart K, Smith CP, Bucca G, Penson S, Chope G, Hypponen E, Berry J, Vieth R, and Lanham-New S (2012) Comparison of vitamin D2 and vitamin D3 supplementation in raising serum 25- hydroxyvitamin D status: a systematic review and meta-analysis. Am. J. Clin. Nutr, 95 (6), 1357–1364, doi: 10.3945/ajcn.111.031070. [DOI] [PMC free article] [PubMed] [Google Scholar]
- Vieth R (1999) Vitamin D supplementation, 25-hydroxyvitamin D concentrations, and safety. Am. J. Clin. Nutr, 69 (5), 842–856. URL http://www.ajcn.org/content/69/5/842.abstract. [DOI] [PubMed] [Google Scholar]
- Wagner CL, Taylor SN, and Hollis BW (2008) Does vitamin D make the world go ‘round’? Breastfeed Med, 3 (4), 239–250, doi: 10.1089/bfm.2008.9984. [DOI] [PMC free article] [PubMed] [Google Scholar]
- Webb AR (2006) Who, what, where and when-influences on cutaneous vitamin D synthesis. Prog. Biophys. Mol. Biol, 92 (1), 17–25, doi: 10.1016/j.pbiomolbio.2006.02.004. [DOI] [PubMed] [Google Scholar]
- White P and Cooke N (2000) The multifunctional properties and characteristics of vitamin D-binding protein. Trends Endocrinol. Metab, 11 (8), 320–327. [DOI] [PubMed] [Google Scholar]
- Wilson Z, Rostami-Hodjegan A, Burn J, Tooley A, Boyle J, Ellis S, and Tucker G (2003) Inter-individual variability in levels of human microsomal protein and hepatocellularity per gram of liver. Br. J. Clin. Pharmacol, 56 (4), 433–440, doi: 10.1046/j.1365-2125.2003.01881.x. [DOI] [PMC free article] [PubMed] [Google Scholar]
- Zerwekh JE (2008) Blood biomarkers of vitamin D status. Am. J. Clin. Nutr, 87 (4), 1087S–1091S. URL http://ajcn.nutrition.org/content/87/4/1087S.full.pdf+html. [DOI] [PubMed] [Google Scholar]
- Zwart SR, Mehta SK, Ploutz-Snyder R, Bourbeau Y, Locke JP, Pierson DL, and Smith SM (2011) Response to vitamin D supplementation during antarctic winter is related to BMI, and supplementation can mitigate Epstein- Barr virus reactivation. The Journal of Nutrition, 141 (4), 692–697, doi: 10.3945/jn.110.134742. [DOI] [PubMed] [Google Scholar]