


Abstract
The psychoactive properties of lysergic acid diethylamide (LSD) have fascinated scientists across disciplines and the exploration of other analogues and derivatives has been motivated by deepening the understanding of ligand-receptor interactions at the molecular level as well as by the search for new therapeutics. Several LSD congeners have appeared on the new psychoactive substances (NPS) market in the form of blotters or powders. Examples include 1-propionyl-LSD (1P–LSD), AL-LAD, and LSZ. The absence of analytical data for novel compounds is a frequent challenge encountered in clinical and toxicological investigations. Two newly emerging lysergamides, namely N6-ethyl-6-norlysergic acid diethylamide (ETH-LAD) and 1P–ETH-LAD, were characterized by gas chromatography–mass spectrometry (GC–MS), low and high mass accuracy electrospray MS(/MS), GC solid-state infrared analysis, high performance liquid chromatography diode array detection as well as nuclear magnetic resonance spectroscopy. Limited analytical data for ETH-LAD were previously available, whereas information about 1P–ETH-LAD has not previously been encountered in the scientific literature. This study extends the characterization of lysergamides distributed on the NPS market, which will help to make analytical data available to clinicians, toxicologists, and other stakeholders who are likely to encounter these substances. The analysis of a test incubation of 1P–ETH-LAD with human serum at 37°C by LC single quadrupole MS at various time points (0–6 h, once per hour and one measurement after 24 h) revealed the formation of ETH-LAD, suggesting that 1P–ETH-LAD might serve as a pro-drug. 1P–ETH-LAD was still detectable in serum after 24 h.
Keywords: new psychoactive substances, LSD, lysergamides, psychedelics, chemical analysis
Introduction
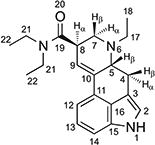
Whereas the history of human use of psychoactive lysergamides goes back at least centuries with the ritual usage of ergine (d-lysergic acid amide),[1] the synthesis and psychoactive effects of lysergic acid diethylamide (LSD) were first described in the early 1940s.[2,3] Since that time, the pharmacological and psychoactive properties of LSD and its congeners have attracted substantial interest. One area of focus has been the structure–activity relationships of lysergic acid amides. For example, studies have examined the effect of alkyl substitution at the N6-position, which contains a methyl substituent in the case of LSD (Figure 1). Synthesis and pharmacological evaluation of a series of N6-alkyl norlysergic acid diethylamide derivatives revealed that LSD-like activity in rats was either maintained or increased with ethyl, n-propyl, or allyl substituents, whereas longer or bulkier substituents, such as isopropyl and n-butyl, reduced activity.[4–6] The extent to which these findings are translatable to humans remains unclear but anecdotal reports indicate that some N6-alkyl homologues of LSD have hallucinogenic effects in humans.[7,8] From the perspective of molecular pharmacology, investigating the structure–activity relationships of lysergic acid amides may help to elucidate the molecular interactions that occur between LSD and its biological targets.[9–11]
Figure 1.

Lysergide (LSD) and derivatives that appeared on the new psychoactive substances market.
Currently, a wide variety of psychoactive substances are marketed to the general public by Internet vendors; many of these substances, commonly referred to as new psychoactive substances (NPS) or ‘research chemicals’, were originally synthesized during the course of scientific research, but others developed by NPS vendors as potential recreational drugs.[12,13] To date, only a few LSD congeners have appeared on the NPS market. N6-Allyl-6-norlysergic acid diethylamide (AL-LAD) and (2’S,4’S)-lysergic acid 2,4-dimethylazetidide (LSZ), which have been available on the NPS market for a few years as bulk powdered material or absorbed on blotter paper,[14] are examples of compounds drawn from the scientific literature.[4,15] Conversely, 1-propionyl-LSD (1P–LSD; Figure 1), which first emerged online in early 2015, appeared to be unknown in the scientific literature prior to its appearance as a new psychoactive substance.[16]
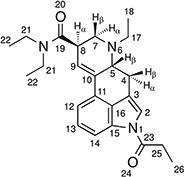
The preparation of N6-ethyl-6-norlysergic acid diethylamide ((8β)-N,N,6-triethyl-9,10-didehydroergoline-8-carboxamide, ETH-LAD; Figure 1) was first reported in 1976.[17] The same group subsequently found that ETH-LAD mimics the hyperthermic effect of LSD in rabbits and rats[18] and has greater oxytocic activity than LSD in the isolated rat uterus.[19] ETH-LAD reportedly produces complete substitution in rats trained to discriminate LSD and is even more potent than the training drug.[4] In addition, ETH-LAD was subsequently shown to produce hallucinogenic effects in humans at slightly lower doses than LSD,[7] which is consistent with the relative potencies of ETH-LAD and LSD in the drug discrimination paradigm. Moreover, similar to LSD, ETH-LAD has high affinity for 5-HT2A receptors (Ki = 5.1 nM vs. [3H]ketanserin), dopamine D1 receptors (Ki = 22.1 nM vs. [3H]SCH-23390), and dopamine D2 receptors (Ki = 4.4 nM vs. [3H]spiperone).[4,20] Both LSD and ETH-LAD were found to act as partial agonists (measured using cAMP accumulation) when tested in C-6 glioma cells expressing the rhesus macaque D1A receptor.[20] In contrast to ETH-LAD, no information about 1-propionyl-ETH-LAD (1P–ETH-LAD; Figure 1) was found in the scientific literature.
In the present study, the newly emerging lysergamides ETH-LAD and 1P–ETH-LAD were extensively characterized using a variety of chromatographic, mass spectrometric, and spectroscopic methods. To date, only limited analytical data have been reported for ETH-LAD and information about 1P–ETH-LAD appears to be absent from the scientific literature. These studies extend the characterization of lysergamides distributed on the NPS market,[14,16] which will help to make analytical data available to clinicians, toxicologists and other stakeholders who are likely to encounter these substances. Previous work on 1P–LSD indicated that it served as a pro-drug for LSD when incubated in human serum.[16] In the present study, a test incubation of 1P–ETH-LAD with human serum at 37°C was also included to assess ETH-LAD formation.
Experimental
Materials
All chemicals used were of analytical or high performance liquid chromatography (HPLC) grade and were obtained either from Rathburn Chemicals Ltd (Walkerburn, Scotland, UK), Fisher Scientific (Dublin, Ireland) or Aldrich (Dorset, UK). Dimethyl sulphoxide-d6 (99.9% D) was from Aldrich (Dorset, UK). Powdered samples of ETH-LAD and 1P–ETH-LAD were provided by Synex Synthetics BV (Delft, the Netherlands) and characterized as the hemitartrate salt forms.
Instrumentation
Gas chromatography–mass spectrometry
Electron ionization (EI) mass spectra (70 eV) were recorded using a Finnigan TSQ 7000 triple stage quadrupole mass spectrometer coupled to a gas chromatograph (Trace GC Ultra, Thermo Electron, Dreieich, Germany). Sample introduction was carried out using a CTC CombiPAL (CTC Analytics, Zwingen, Switzerland) autosampler. The emission current was 200 µA and the scan time was 1 s spanning a scan range between m/z 29 and m/z 600. The ion source temperature was maintained at 175°C. Samples were introduced via gas chromatography with splitless injection using a fused silica capillary DB-1 column (30 m × 0.25 mm, film thickness 0.25 µm). For the analysis of ETH-LAD, the temperature program consisted of an initial temperature of 80°C, held for 1 min, followed by a ramp to 280°C at 15°C/min. The final temperature was held for 21 min. For the analysis of 1P–ETH-LAD, the temperature program consisted of an initial temperature of 80°C, held for 2 min, followed by a ramp to 310°C at 20°C/min. The final temperature was held for 23 min. The injector temperature was 220°C/250°C (for ETH-LAD/1P–ETH-LAD, respectively). The transfer line temperature was maintained at 280°C/300°C (for ETH-LAD/1P–ETH-LAD, respectively) and the carrier gas was helium in constant flow mode at a flow rate of 1.2 mL/min. Approximately 2 mg were dissolved in 1.5 mL chloroform. For analysis, 1 µL sample solution was injected into the GC–MS system. Kovats retention indices (RI) were calculated from measurement of an n-alkane mixture analyzed with the above-mentioned temperature programs.
Gas chromatography solid-state infrared analysis
Samples were analyzed using a GC-solid phase-IR-system that consisted of an Agilent GC 7890B (Waldbronn, Germany) with probe sampler Agilent G4567A and a DiscovIR-GC™ (Spectra Analysis, Marlborough, MA, USA). The column eluent was cryogenically accumulated on a spirally rotating ZnSe disk cooled by liquid nitrogen. IR spectra were recorded through the IR-transparent ZnSe disk using a nitrogen-cooled MCT detector. GC parameters: injection in splitless mode with an injection port temperature set at 240°C and a DB-1 fused silica capillary column (30 m × 0.32 mm i.d., 0.25 µm film thickness). The carrier gas was helium with a flow rate of 2.5 mL/min and the oven temperature program was as follows: 80°C for 2 min, ramped to 290°C at 20°C/min, and held at for 20 min. The transfer line was heated at 280°C. Infrared conditions: oven temperature, restrictor temperature, disc temperature, and Dewar cap temperatures were 280°C, 280°C, −40°C, and 35°C, respectively. The vacuum was 0.2 mTorr, disc speed 3 mm/s, spiral separation was 1 mm, wavelength resolution 4 cm−1 and IR range 650–4000 cm−1. Acquisition time was 0.6 s/file with 64 scans/spectrum. Data were processed using GRAMS/AI Ver. 9.1 (Grams Spectroscopy Software Suite, Thermo Fischer Scientific, Dreieich, Germany) followed by implementation of the OMNIC Software, Ver. 7.4.127 (Thermo Electron Corporation, Dreieich, Germany).
High mass accuracy electrospray mass spectrometry
Ultrahigh-performance liquid chromatography quadrupole time-of-flight single and tandem mass spectrometry (UHPLC-QTOF-MS/MS) data were obtained from an Agilent 6540 UHD Accurate-Mass Q-TOF LC–MS system coupled to an Agilent 1290 Infinity UHPLC system (Agilent, Cheadle, Cheshire, UK). Separation was achieved using an Agilent Zorbax Eclipse Plus C18 column (100 mm × 2.1 mm, 1.8 µm) (Agilent, Cheadle, Cheshire, UK). Mobile phases consisted of 100% acetonitrile (1% formic acid) and 1% formic acid in water. The column temperature was set at 40°C (0.6 mL/min) and data were acquired for 5.5 min. The gradient was set at 5–70% acetonitrile over 3.5 min, then increased to 95% acetonitrile in 1 min and held for 0.5 min before returning to 5% acetonitrile in 0.5 min. QTOF-MS data were acquired in positive mode scanning from m/z 100–m/z 1000 with and without auto MS/MS fragmentation. Ionization was achieved with an Agilent JetStream electrospray source and infused internal reference masses. QTOF-MS parameters: gas temperature 325°C, drying gas 10 L/min and sheath gas temperature 400°C. Internal reference ions at m/z 121.0509 and m/z 922.0098 were used for calibration purposes.
Liquid chromatography electrospray ionization mass spectrometry
HPLC single quadrupole mass spectrometry (LC-Q-MS) analyses were carried out on an Agilent 1100 system using a Restek (Bellefonte, PA, USA) Allure PFPP column (5 µm, 50 × 2.1 mm). The aqueous mobile phase A consisted of 0.1% formic acid, whereas, mobile phase B consisted of 0.1% formic acid in acetonitrile. The total run time was 25 min. The following gradient elution program was used: 0–2 min 2% B, followed by an increase to 60% within 15 min, then up to 80% within 20 min, returning to 2% within 25 min. The Agilent LC-MSD settings were as follows: positive electrospray mode, capillary voltage 3500 V, drying gas (N2) 12 L/min at 350°C, nebulizer gas (N2) pressure 50 psi, scan mode m/z 70–m/z 500, fragmentor voltage values used for in-source collision-induced dissociation (CID) were 30 V and 150 V, respectively. The sample was dissolved in acetonitrile/water (1:1, containing 0.1% formic acid) at a concentration of 10 µg/mL. The injection volume was 1 µL, flow rate was 0.80 mL/min and the column temperature was 30°C.
Nuclear magnetic resonance spectroscopy
Samples were prepared in deuterated dimethyl sulfoxide (DMSO-d6). 1H NMR spectra (400.23 MHz) were recorded on a Bruker Avance III 400 NMR spectrometer using a 5 mm BBFO probe with z-axis gradients. 13C spectra (150.90 MHz) were recorded on a Bruker AV600 NMR spectrometer using a 5 mm TCI cryoprobe. Spectra were referenced to residual solvent and assignments were supported by both 1D and 2D experiments.
Results and discussion
The EI mass spectra for ETH-LAD and 1P–ETH-LAD are shown in Figure 2 and it can be seen that the relative abundance of the molecular ions was significant for both compounds, which are in agreement with other lysergamides investigated previously.[14,16] Some key fragments recorded for ETH-LAD (Figure 2A) were reported previously.[17] Additionally, the entire EI mass spectrum reported here appears comparable to the spectrum of a purported ETH-LAD sample available in the public domain.[21] The ETH-LAD spectrum exhibited fragments that were also encountered in the mass spectrum of LSD, such as the iminiumions at m/z 72, fragment clusters at m/z 151–m/z 156, m/z 178–m/z 182 and m/z 205–m/z 208, and the retro-Diels-Alder fragment at m/z 280.[16] As suggested in the Supporting Information section, further fragmentation of this particular species might have accounted for the formation of both the m/z 265 and m/z 207 species, respectively. The same three ions were also observed in the EI mass spectra of LSD[16] and AL-LAD,[14] which are considered characteristic for lysergamides with N,N-diethylamide substitution given that the N6-alkyl group is lost during fragmentation, thus, leaving the masses of the characteristic ions unchanged. Aside from the m/z of M•+, the most prominent feature pointing to ETH-LAD (i.e. reflecting the presence of the N6-ethyl group) was detected at m/z 235, presumably induced via a loss of N,N-diethylformamide and cleavage of a hydrogen radical (Supporting Information). Correspondingly, the equivalent species in LSD may have been observed at m/z 221 (N6-methyl),[16] whereas the N6-allyl equivalent in AL-LAD (Figure 1) gave rise to m/z 247.[14] The EI mass spectrum recorded for 1P–ETH-LAD (Figure 2B) was comparable to those recorded for LSD and 1P–LSD[16]; the two most important features differentiating the EI-MS of 1P–ETH-LAD and 1P–LSD were the 14 Da (N6-ethyl group) mass shifts at m/z 236–m/z 237 and m/z 291–m/z 293 clusters. In the case of 1P–LSD, these shifts were detected at 221–m/z 223 and m/z 277–m/z 279.[16] The detection of m/z 336, m/z 321 and m/z 263 (Figure 2B) represented the mass shift induced by the 1-propionyl group and might have reflected the retro-Diels Alder counterpart at m/z 280 followed by formation of m/z 265 and m/z 207 mentioned above for LSD and AL-LAD (Supporting Information). As described in the Experimental section, the GC analysis of 1P–ETH-LAD required higher temperatures to facilitate the determination of the Kovats retention index since the implementation of the temperature profile used to elute ETH-LAD resulted in a retention time beyond the last eluting n-alkane standard.
Figure 2.

Electron ionization mass spectra of (A) ETH-LAD and (B) 1P–ETH-LAD.
When subjected to GC–MS analysis, ETH-LAD but not 1P–ETH-LAD formed three additional degradation products of comparatively minor abundance (Supporting Information); the similarity of the mass spectral data indicated that these GC-induced degradations (which were absent under HPLC conditions) might have reflected the presence of isomeric species. The EI mass spectrum shown in Figure 2A belongs to the most abundant peak, which is referred to as isomer III (Supporting Information). GC-induced degradation was also observed previously in an investigation of LSZ, although degradation did not occur during the analysis of AL-LAD.[14] The solid-state infrared (sIR) spectra recorded from the peaks eluting from the GC column, as well as those recorded directly from the hemitartrate salts, are provided as Supporting Information. The advantage of using GC-sIR is that also compound mixtures and substances available in small amounts, such as those encountered on blotters, are also amenable to IR analysis. The resulting spectra are comparable to those obtained under traditional conditions where individual (and pure) substances are converted to the free base state and subjected to neat ATR-IR measurements. A key difference between ETH-LAD and 1P–ETH-LAD was the absence of the indole NH group in the latter (~3000 cm−1), which is comparable with observations made previously with 1P–LSD. Correspondingly, the appearance of a second carbonyl signal in the spectrum of 1P–ETH-LAD was detected at 1704 cm−1 due to the presence of the propionyl group in the 1-position. GC-sIR spectra were recorded for three of the four ETH-LAD isomers and are included individually in the Supporting Information section. In the case of GC–MS analysis of 1P–ETH-LAD (Figure 2B), a different temperature profile was employed (see Experimental section) to ensure that elution occurred within the associated series of n-alkane standards for the determination of a suitable retention index.
Similar to what was observed during GC–MS analysis, both ETH-LAD and 1P–ETH-LAD were conveniently separated using three different liquid chromatography (LC) systems (Figure 3 and Supporting Information). The electrospray ionization mass spectra, obtained for both compounds using QTOF-MS/MS as well as single quadrupole MS with in-source collision-induced dissociation, are shown in Figure 3. A characteristic production for ETH-LAD and 1P–ETH-LAD, presumably due to the presence of the N6-ethyl substituent, was the appearance of m/z 237 (Figure 3, calculated m/z 237.1386) and m/z 293 (1P–ETH-LAD, calculated m/z 293.1648, Figure 3C), respectively. Proposed mechanisms of formation for ions formed under QTOF-MS/MS conditions (Figures 3A and 3C) are summarized in Figures 4 and 5. Potentially equivalent species observed with the N,N-diethylamides LSD and AL-LAD have been reported at m/z 223 and m/z 249, respectively.[14,16] When ETH-LAD and 1P–ETH-LAD were analyzed by LC single quadrupole MS in selected ion monitoring mode (inserts in Figures 3B and 3D), only one peak was observed, indicating that the iso-forms were not detectable under the conditions used, which provided support for the conclusion that the ETH-LAD isomers detected under GC–MS conditions were artificially generated during analysis using this particular methodology. The LC-diode array detection data for both ETH-LAD and 1P–ETH-LSD are shown as Supporting Information. The UV spectra were recorded from the HPLC peaks using a scan range between 200 nm and 595 nm, and with 1P–ETH-LAD it can be seen that the addition of the propionyl group to the indole nitrogen introduced a third significant peak, resulting in distinct peaks at 224.4, 253.5 and 293.1 nm, compared to 226.0 and 310.5 nm for ETH-LAD (Supporting Information). For 1P–LSD, three distinct peaks were observed at 226, 250 and 294 nm, compared with peaks at 222 and 314 nm for LSD, thus offering only limited opportunities for differentiation.[16]
Figure 3.

Electrospray ionization mass spectra. (A) and (C): Quadrupole time-of-flight tandem mass spectra obtained from ETH-LAD and 1P–ETH-LAD. (B) and (D): Single quadrupole mass spectra of ETH-LAD and 1P–ETH-LAD following in-source collision-induced-dissociation. Inserts in (B) and (D): HPLC single ion monitoring using the m/z values of the protonated molecules.
Figure 4.

Proposed formation of product ions following collision-induced dissociation of ETH-LAD under QTOF-MS/MS conditions.
Figure 5.

Proposed formation of product ions following collision-induced dissociation of 1P–ETH-LAD under QTOF-MS/MS conditions.
The nuclear magnetic resonance spectroscopy (NMR) data collected for ETH-LAD and 1P–ETH-LAD are summarized in Tables 1 and 2; all spectra are supplied as Supporting Information. The suggested assignments were based on several lysergamides characterized previously (1P–LSD, LSD, AL-LAD, and LSZ)[14,16] and assisted by 1D and 2D experiments. One key difference observed between ETH-LAD and 1P–ETH-LAD is that an indole nitrogen proton resonance at 10.75 ppm was absent in the latter compound due to the propionyl group attachment to the 1-position. Correspondingly, a second carbonyl signal appeared in the 13C NMR spectrum of 1P–ETH-LAD at 172.45 ppm. In comparison to ETH-LAD, the 1H NMR spectrum of 1P–ETH-LAD also revealed a noticeable downfield shift for the aromatic protons H-12, H-14 and H-2. For example, the H-2 proton of ETH-LAD, found to overlap with H-12 and H-13 at 7.11–6.98 ppm, resonated as a distinct fine doublet at 7.59 ppm (J = 1.8 Hz) in 1P–ETH-LAD (Tables 1 and 2). The remaining proton chemical shifts remained largely unaffected. However, the presence of the propionyl group in 1P–ETH-LAD also led to increasing signal overlap further upfield from the aromatic chemical shifts. For example, the methylene protons (H-25) were observed to overlap with one of the protons of the N6-CH2 group (H-17) integrating to three protons. The triplet associated with the propionyl methyl group (H-26) overlapped with one of the triplets corresponding to the methyl groups present in the N,N-diethylamide moiety. Similarly, the methyl group of the N6-susbtituent (H-18) overlapped with the triplet associated with the more upfield triplet of the N,N-diethylamide group. As was the case with other lysergamides, the axial and equatorial configurations of the H-7 and H-4 protons resulted in distinct proton chemical shifts.[14,16] The two methylene protons of the N6-CH2 group (H-17) also displayed individual chemical shift values for each proton (Tables 1 and 2). Some 1H NMR data for ETH-LAD freebase in CDCl3 were reported previously,[4,17,22] though there were minor differences in some chemical shift values, presumably due to the solvents used (d6-DMSO vs. CDCl3) and the hemitartrate form investigated in the present study. Attachment of the propionyl group affected some of the 13C carbon chemical shifts compared to ETH-LAD, with the most pronounced downfield shifts experienced by C-3 (109.17 to 116.11 ppm), C-12 (111.58 to 116.50 ppm) and C-14 (110.39 to 114.72 ppm), respectively.
Table 1.
1H and 13C NMR data for ETH-LAD hemitartrate in d6-DMSO at 400 / 150 MHz
| ||
|---|---|---|
|
| ||
| No. | 13C [δ / ppm] | 1H [δ / ppm] |
|
| ||
| 1 | – | 10.75 (s, 1H) |
| 2 | 119.88 | 7.05 (t, J = 2.0 Hz, 1H) a |
| 3 | 109.17 | – |
| 4 | 26.88 | 3.54–3.47 (m, 4β -H, 1H) b |
| 2.60–2.51 (m, 4α-H, 1H) c | ||
| 5 | 59.59 | 3.47–3.41 (m, H-5β, 1H) d |
| 6 | – | – |
| 7 | 51.44 | 3.11 (dd, J = 10.8, 4.6 Hz, H-7α) e |
| 2.84–2.67 (m, H-7β, 1H) f | ||
| 8 | 39.22 | 3.83–3.71 (m, H-8α, 1H) |
| 9 | 120.64 | 6.24 (s, 1H) |
| 10 | 135.88 | – |
| 11 | 127.85 | – |
| 12 | 111.58 | 7.02 (dd, J = 7.2, 0.8 Hz, 1H) g |
| 13 | 122.79 | 7.07 (t, J = 7.3 Hz, 1H) h |
| 14 | 110.39 | 7.20 (dd, J = 7.2, 0.8 Hz, 1H) |
| 15 | 134.28 | – |
| 16 | 126.31 | – |
| 17 | 47.62 | 3.09–3.01 (m, 1H) i |
| 47.62 | 2.84–2.67 (m, 1H) j | |
| 18 | 10.37 | 1.09 (t, J = 7.2 Hz, 1H) k |
| 19 | 171.09 | – |
| 20 | – | – |
| 21 | 42.01 | 3.47–3.41 (m, 2H) l |
| 21 | 39.72 | 3.32 (q, J = 7.1 Hz, 2H) |
| 22 | 15.29 | 1.19 (t, J = 7.1 Hz, 3H) |
| 22 | 13.55 | 1.07 (t, J = 7.1 Hz, 3H) m |
| TA n | 72.33 | 4.18 (s, 1H) |
| TA n | 173.89 | – |
Overlapping with H-13 and H-12.
Overlapping with H-5β and H-21 (2H).
Overlapping with solvent.
Overlapping H-4β and H-21 (2H).
Overlapping H-17 (1H).
Overlapping with H-17 (1H).
Overlapping with H-13 and H-2.
Overlapping with H-12 and H-2.
Overlapping with H-7α.
Overlapping with H-7β.
Overlapping with H-22 (3H).
Overlapping H-5β and H-4β (1H).
Overlapping with H-18 (3H).
TA: tartaric acid.
Table 2.
1H and 13C NMR data for 1P–ETH-LAD hemitartrate in d6-DMSO at 400 / 150 MHz
| ||
|---|---|---|
|
| ||
| No. | 13C [δ / ppm] | 1H [δ / ppm] |
|
| ||
| 1 | – | – |
| 2 | 119.89 | 7.59 (d, J = 1.8 Hz, 1H) |
| 3 | 116.11 | – |
| 4 | 26.08 | 3.49 (dd, J = 15.3, 5.4 Hz, 4β-H, 1H) a |
| 2.49–2.39 (m, 4α-H, 1H) b | ||
| 5 | 58.23 | 3.41–3.36 (m, H-5β, 1H) c |
| 6 | – | – |
| 7 | 50.83 | 3.08 (dd, J = 11.4, 4.6 Hz, H-7α, 1H) d |
| 2.68–2.59 (m H-7β, 1H) e | ||
| 8 | 39.07 | 3.80–3.70 (m, H-8α, 1H) |
| 9 | 122.17 | 6.34 (s, 1H) |
| 10 | 134.05 | – |
| 11 | 128.14 | – |
| 12 | 116.50 | 7.34 (dd, J = 7.6, 1.4 Hz, 1H) f |
| 13 | 125.86 | 7.31 (t, J = 7.2 Hz, 1H) g |
| 14 | 114.72 | 8.01 (dd, J = 7.2, 0.8 Hz, 1H) |
| 15 | 133.08 | – |
| 16 | 127.56 | – |
| 17 | 46.94 | 3.37–3.26 (m, 1H) h |
| 46.94 | 2.77–2.68 (m, 1H) i | |
| 18 | 9.99 | 1.07 (t, J = 7.0 Hz, 3H) j |
| 19 | 170.51 | – |
| 20 | – | – |
| 21 | 41.54 | 3.47–3.41 (m, 2H) k |
| 21 | 39.43 | 3.37–3.26 (m, 2H) l |
| 22 | 14.79 | 1.19 (t, J = 7.0 Hz, 3H) m |
| 22 | 13.04 | 1.07 (t, J = 7.0 Hz, 3H) n |
| 23 | 172.45 | – |
| 24 | – | – |
| 25 | 28.15 | 3.37–3.26 (m, 2H) o |
| 26 | 8.54 | 1.18 (t, J = 7.2 Hz, 3H) p |
| TA q | 71.94 | 4.25 (s, 1H) |
| TA q | 173.19 | – |
Overlapping with H-21 (2H).
Overlapping with solvent.
Overlapping H-21 (2H).
Overlapping H-17 (1H) and H-25.
Overlapping with H-17 (1H).
Overlapping with H-13.
Overlapping with H-12.
Overlapping with H-7α and H-25.
Overlapping with H-7β.
Overlapping with H-22 (3H).
Overlapping H-4β (1H).
Overlapping H-5β (1H).
Overlapping with H-26 (3H).
Overlapping with H-18 (3H).
Overlapping with H-7α and H-17 (1H).
Overlapping with H-22 (3H).
TA: tartaric acid.
1P–LSD was previously shown to hydrolyze to LSD when exposed to human serum.[16] As depicted in the Supporting Information, 1P–ETH-LAD conversion to ETH-LAD was also identified following incubation in human serum at 37°C and analysis by LC–MS analysis in selective ion monitoring mode. The analysis was carried out at various time points (0–6 h, once per hour and one measurement after 24 h) and it was found that ETH-LAD was detectable at the first sampling interval (1 h), which indicated that 1P–ETH-LAD might also serve as a pro-drug in vivo. 1P–ETH-LAD was still detectable in serum after 24 h.
Conclusion
In the present study, ETH-LAD and 1P–ETH-LAD, two recently emerging lysergamides available on the NPS market, were subjected to a comprehensive analytical characterization, which revealed that the differentiation between the two was straightforward. These studies extend the characterization of lysergamides distributed on the NPS market, which will help to make analytical data available to clinicians, toxicologists and other stakeholders who are likely to encounter these substances. Further studies are warranted to determine whether 1P–ETH-LAD shows bioactivity independent from the hydrolysis product ETH-LAD, which was detected during the incubation of 1P–ETH-LAD with human serum at 37°C.
Supplementary Material
Acknowledgments
This work was supported by an award from NIDA (R01 DA041336). The support from Isomer Design (Toronto, Canada) is also gratefully acknowledged.
Footnotes
Additional Supporting Information may be found online in the supporting information tab for this article.
References
- 1.Schultes RE. Hallucinogens of plant origin. Science. 1969;163:245. doi: 10.1126/science.163.3864.245. [DOI] [PubMed] [Google Scholar]
- 2.Stoll A, Hofmann A. Partialsynthese von Alkaloiden vom Typus des Ergobasins. 6. Mitteilung über Mutterkornalkaloide. Helv. Chim. Acta. 1943;26:944. [Google Scholar]
- 3.Stoll WA. Lysergsäure-diäthylamid, ein Phantastikum aus der Mutterkorngruppe. Schweiz. Arch. Neurol. Psychiatr. 1947;60:279. [Google Scholar]
- 4.Hoffman AJ, Nichols DE. Synthesis and LSD-like discriminative stimulus properties in a series of N(6)-alkyl norlysergic acid N,N-diethylamide derivatives. J. Med. Chem. 1985;28:1252. doi: 10.1021/jm00147a022. [DOI] [PubMed] [Google Scholar]
- 5.Nichols DE, Oberlender R, McKenna DJ. In: Biochemistry and Physiology of Substance Abuse. Watson RR, editor. Vol. 3. CRC Press; Boca Raton, FL, USA: 1991. p. 1. [Google Scholar]
- 6.Pfaff RC, Huang X, Marona-Lewicka D, Oberlender R, Nichols DE. In: Hallucinogens: An Update. NIDA Research Monograph. Lin GC, Glennon RA, editors. Vol. 146. National Institute on Drug Abuse; Rockville, MD, USA: 1994. p. 52. [PubMed] [Google Scholar]
- 7.Shulgin A, Shulgin A. TIHKAL: The Continuation. Transform Press; Berkeley, USA: 1997. [Google Scholar]
- 8.Shulgin AT. In: Hallucinogens. A Forensic Drug Handbook. Laing R, editor. Academic Press; London: 2003. p. 67. [Google Scholar]
- 9.Wang C, Jiang Y, Ma JM, Wu HX, Wacker D, Katritch V, Han GW, Liu W, Huang XP, Vardy E, McCorvy JD, Gao X, Zhou XE, Melcher K, Zhang CH, Bai F, Yang HY, Yang LL, Jiang HL, Roth BL, Cherezov V, Stevens RC, Xu HE. Structural basis for molecular recognition at serotonin receptors. Science. 2013;340:610. doi: 10.1126/science.1232807. [DOI] [PMC free article] [PubMed] [Google Scholar]
- 10.Wacker D, Wang C, Katritch V, Han GW, Huang XP, Vardy E, McCorvy JD, Jiang Y, Chu MH, Siu FY, Liu W, Xu HE, Cherezov V, Roth BL, Stevens RC. Structural features for functional selectivity at serotonin receptors. Science. 2013;340:615. doi: 10.1126/science.1232808. [DOI] [PMC free article] [PubMed] [Google Scholar]
- 11.Wacker D, Wang S, McCorvy JD, Betz RM, Venkatakrishnan AJ, Levit A, Lansu K, Schools ZL, Che T, Nichols DE, Shoichet BK, Dror RO, Roth BL. Crystal structure of an LSD-bound human serotonin receptor. Cell. 2017;168:377. doi: 10.1016/j.cell.2016.12.033. [DOI] [PMC free article] [PubMed] [Google Scholar]
- 12.Brandt SD, King LA, Evans-Brown M. The new drug phenomenon. Drug Test. Anal. 2014;6:587. doi: 10.1002/dta.1686. [DOI] [PubMed] [Google Scholar]
- 13.Evans-Brown M, Sedefov R. New psychoactive substances: driving greater complexity into the drug problem. Addiction. 2017;112:36. doi: 10.1111/add.13528. [DOI] [PubMed] [Google Scholar]
- 14.Brandt SD, Kavanagh PV, Westphal F, Elliott SP, Wallach J, Colestock T, Burrow TE, Chapman SJ, Stratford A, Nichols DE, Halberstadt AL. Return of the lysergamides. Part II: Analytical and behavioural characterization of N6-allyl-6-norlysergic acid diethylamide (AL-LAD) and (2′S,4′S)-lysergic acid 2,4-dimethylazetidide (LSZ) Drug Test. Anal. 2017;9:38. doi: 10.1002/dta.1985. [DOI] [PMC free article] [PubMed] [Google Scholar]
- 15.Nichols DE, Frescas S, Marona-Lewicka D, Kurrasch-Orbaugh DM. Lysergamides of isomeric 2,4-dimethylazetidines map the binding orientation of the diethylamide moiety in the potent hallucinogenic agent N,N-diethyllysergamide (LSD) J. Med. Chem. 2002;45:4344. doi: 10.1021/jm020153s. [DOI] [PubMed] [Google Scholar]
- 16.Brandt SD, Kavanagh PV, Westphal F, Stratford A, Elliott SP, Hoang K, Wallach J, Halberstadt AL. Return of the lysergamides. Part I: Analytical and behavioural characterization of 1-propionyl-d-lysergic acid diethylamide (1P-LSD) Drug Test. Anal. 2016;8:891. doi: 10.1002/dta.1884. [DOI] [PMC free article] [PubMed] [Google Scholar]
- 17.Niwaguchi T, Nakahara Y, Ishii H. Studies on lysergic acid diethylamide and related compounds. IV. Syntheses of various amide derivatives of norlysergic acid and related compounds. Yakugaku Zasshi. 1976;96:673. [PubMed] [Google Scholar]
- 18.Hashimoto H, Hayashi M, Nakahara Y, Niwaguchi T, Ishii H. Hyperthermic effects of D-lysergic acid diethylamide (LSD) and its derivatives in rabbits and rats. Arch. Int. Pharmacodyn. Ther. 1977;228:314. [PubMed] [Google Scholar]
- 19.Hashimoto H, Hayashi M, Nakahara Y, Niwaguchi T, Ishii H. Actions of D-lysergic acid diethylamide (LSD) and its derivatives on 5-hydroxytryptamine receptors in the isolated uterine smooth muscle of the rat. Eur. J. Pharmacol. 1977;45:341. doi: 10.1016/0014-2999(77)90273-4. [DOI] [PubMed] [Google Scholar]
- 20.Watts VJ, Lawler CP, Fox DR, Neve KA, Nichols DE, Mailman RB. LSD and structural analogs: pharmacological evaluation at D1 dopamine receptors. Psychopharmacology (Berl) 1995;118:401. doi: 10.1007/BF02245940. [DOI] [PubMed] [Google Scholar]
- 21.Slovenian National Forensic Laboratory. European Project RESPONSE to challenges in forensic drug analyses. NPS and Analytical Reports. 2017 Feb 9; Available at: http://www.policija.si/apps/nfl_response_web/seznam.php.
- 22.Hoffman AJ. PhD dissertation. Purdue University; West Lafayette, IN, USA: 1987. Synthesis and pharmacological evaluation of N(6)-alkyl norlysergic acid N,N-diethylamide derivatives. [Google Scholar]
Associated Data
This section collects any data citations, data availability statements, or supplementary materials included in this article.