Abstract
Linkers of the nucleoskeleton and cytoskeleton are key molecular complexes that span the nuclear envelope (NE) and provide a direct linkage between the nucleoskeleton and cytoskeleton. Two major components of these complexes are members of the SUN and KASH protein families that interact in the perinuclear space to allow the transmission of mechanochemical signals across the NE. Structural details of the mammalian SUN domain protein SUN2 have established that SUN2 must form a trimer to bind to KASH, and that this trimerization is mediated through two predicted coiled-coil regions of the protein, CC1 and CC2, which precede the SUN domain. Recent crystallographic data suggest that CC2-SUN formed an unexpected autoinhibited monomer unable to bind to KASH. These structural insights raise the question of how full-length SUN2 transitions from a monomer to a trimer inside the NE. In this study we used a computational approach to model a fragment of SUN2 containing CC1, CC2, and the SUN domain. We observed the dynamics of these modeled structures using ∼1 μs molecular dynamics simulations and showed that the interplay between CC1 and CC2 may be sufficient for the release of CC2-SUN2 from its autoinhibited state. Additionally, using our models and gel filtration analysis, we show the involvement of an E452 residue on CC1 in the monomer–trimer transition of SUN2. Intriguingly, mutations in this residue have been seen in muscular dystrophy–associated SUN2 variants. Finally, we propose a Ca2+-dependent monomer–trimer transition of SUN2.
INTRODUCTION
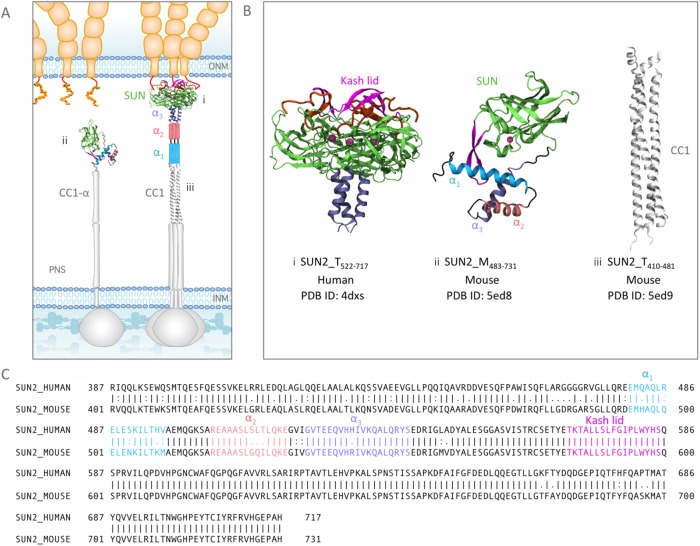
The nucleoskeleton and cytoskeleton are physically integrated through linkers of nucleoskeleton and cytoskeleton (LINC) that span the nuclear envelope (NE; Starr and Han, 2002; Padmakumar et al., 2005; Crisp et al., 2006; Haque et al., 2006). LINC complexes are formed by an interaction of inner nuclear membrane (INM) Sad1/UNC-84 (SUN) and outer nuclear membrane (ONM) Klarsicht/ANC-1/SYNE homology (KASH) proteins (Crisp et al., 2006) in the perinuclear space (PNS; Figure 1A). The nucleoplasmic domains of SUN proteins and the cytoplasmic domains of KASH proteins associate with the nucleoskeleton and cytoskeleton, respectively, and provide a crucial means for the transmission of mechanical forces across the NE (Sosa et al., 2012, 2013; Cain and Starr, 2015; Jahed et al., 2015, 2016; Soheilypour et al., 2016; Jahed and Mofrad, 2018). Several fundamental cellular processes are therefore dependent on LINC complex functions, including mechanotransduction, meiotic chromosome pairing, and nuclear positioning (Khatau et al., 2009; Lombardi et al., 2011; Gundersen and Worman, 2013; Jahed et al., 2014). Emphasizing their significance is a growing list of human diseases associated with mutations in genes coding for LINC complex proteins, including cardiac and skeletal muscular disorders, cancers, and hearing loss (Haque et al., 2010; Méjat and Misteli, 2010; Puckelwartz et al., 2010; Meinke et al., 2011, 2014; Folker and Baylies, 2013; Horn et al., 2013; Isermann and Lammerding, 2013; Yang et al., 2013; Stroud et al., 2014; Matsumoto et al., 2015).
FIGURE 1:
Structures of various fragments of SUN2 in a trimeric or monomeric state in the NE. (A) Schematic representation of the standing model of SUN2 organization in the NE. The in vitro crystal structures available from various studies are shown in their respective positions, and all other regions for which no experimental structural information is available are shown with schematic cartoon representations. Note that the organization of α1 and α2 in the trimer, as well as CC1-α in the monomer, is unknown. (B) Available structures of SUN2 fragments: (i) structure of Human Sun2522–717 trimer bound to three KASH peptides, (ii) structure of Mouse SUN2483–731 monomer, and (iii) structure of coiled coil (CC1) of Mouse SUN2420–481. Each structural fragment is represented by its residue range. SUN2_M is used for the monomeric state of each fragment and SUN2_T for a trimeric state. (C) Amino acid sequences of Human and Mouse SUN2. Structural domains on Human and Mouse Sun2 are shown with similar colors for comparison (α3 in purple, α2 in pink, α1 in cyan, Sun domain in green, and the KASH lid in magenta).
Two widely expressed and extensively studied proteins of the SUN family are mammalian SUN1 and SUN2, which have been shown to interact with the KASH peptides of at least four KASH proteins (nesprin 1–4; Wilhelmsen 2005; Haque et al., 2006; Roux et al., 2009; Zhang et al., 2009; Lombardi et al., 2011; Yu et al., 2011). Although the details of LINC complex regulation remain unknown, recent crystal structures of various fragments of SUN2 have provided invaluable insights into the molecular structure and regulation of SUN2 and its interaction with KASH proteins (Sosa et al., 2012; Wang et al., 2012; Zhou et al., 2012; Nie et al., 2016; Xu et al., 2018). Based on these studies, there are at least two well-established features of LINC complex regulation.
First, these studies collectively agree that the conserved SUN domain of SUN2 functions as a trimer and must oligomerize to interact with KASH. Sosa et al. showed that in a trimeric state, SUN2 can bind to three KASH peptides simultaneously to form an overall hexameric structure (Figure 1Bi; Sosa et al., 2012). In this structure, an α-helix (α3) preceding the SUN domain formed a trimeric coiled coil. Additionally, the SUN domain contained a “KASH-lid” region that served as the main binding site for KASH peptides (Figure 1, B and C). Each KASH peptide was sandwiched between two protomers and interacted with the KASH-lid of one protomer and the core of the neighboring protomer (Figure 1Bi).
Second, these studies suggest that the SUN domain alone is not sufficient for the trimerization of SUN2, and that coiled-coil (CC) domains preceding the SUN domain may regulate its trimerization. In agreement with this, SUN domain proteins are predicted to contain at least two CC domains (CC1 and CC2) preceding the conserved SUN domain (Figure 1A). Point mutations in the predicted CC domains have been associated incidentally with several diseases, emphasizing their prominent role in SUN2 function. For example, a point mutation in E438 in Human (E452 in Mouse), which is on the CC1 domain of SUN2, was observed in muscular dystrophy–associated SUN2 variants (Meinke et al., 2014).
Recent crystal structures of the CC1 and CC2-SUN fragments of mouse SUN2 revealed that CC1 could independently form a trimer, whereas CC2-SUN2 unexpectedly adopts an inactive monomeric conformation (Figure 1B, ii and iii). In this inactive conformation the KASH-lid is supposedly autoinhibited through interactions with a three-helix bundle formed by three α-helices, α1, α2, and α3 (Figure 1, Bii and C; Nie et al., 2016). Consequently, a point mutation in α1 (E471A) could result in the activation and trimerization of the protein. Recently, this autoinhibitory domain was shown to be conserved in SUN1 also (Jahed et al., 2018; Xu et al., 2018). It is important to note that in these studies the crystal screening of CC1-CC2-SUN was unsuccessful, possibly due to its heterogeneous state, and to determine the crystal structures each protein fragment (CC1 and CC2-SUN) was expressed separately; therefore any structural changes resulting from interactions between CC1 and CC2-SUN could not be captured.
The reported crystal structures to date have provided a useful foundation for exploring the regulation of LINC complexes at the NE. The molecular mechanisms of LINC complex function, however, remain largely understudied. Specifically, the interplay between CC1 and CC2 and the mechanisms of monomer trimer transition of SUN2 remain unknown. In this study, we constructed structural models of monomeric CC1-CC2-SUN using the available structural fragments of SUN2 and observed the dynamics of these structures using ∼1-μs molecular dynamics (MD) simulations to provide insight into the potential molecular mechanisms of SUN2 activation.
RESULTS
Structural model of the SUN2 monomer
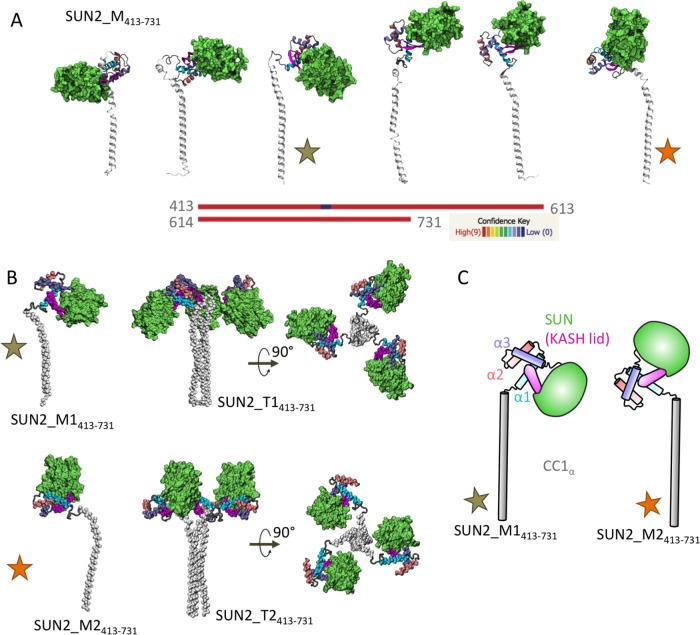
Given that current experimental attempts have failed to screen for larger fragments of SUN2 proteins, we used homology modeling (Phyre2; Kelley et al., 2015) and combined structural information obtained from various fragments of SUN2 (SUN2_T410–481 and SUN2_M483–731) as templates to predict the model of a larger fragment of the monomeric SUN2 protein SUN2_M413–731 (Figure 2A). In the modeled monomeric SUN2 structure, we labeled the α-helix of CC1 as CC1α. The region between CC1α and α1 (SUN2468–474) consists of an unstructured flexible glycine-rich loop (GGGGRVG), and so various orientations of the two protein domains, α1-SUN and CC1α, were obtained from homology modeling (Figure 2A). Also, because the modeled structures consisted of regions for which structural template information was available, the confidence scores of all models were 100% in all regions, except in the flexible glycine rich–loop region, as expected (Figure 2A). To determine the dynamics of these larger fragments of the modeled SUN2_M413–731 structure, we selected two models with distinct orientations between α1-SUN and CC1α (SUN2_M1413–731 and SUN2_M2413–731, identified with stars in Figure 2). For this selection, each modeled structure was aligned to the CC1 trimer (SUN2_T410–481) to ensure that there would be no physical overlap between residues in the three monomers (SUN2_M413–731) once they were assembled into a trimer (Figure 2B). We used these selected models with distinct orientations of α1-SUN and CC1α (SUN2_M1413–731 and SUN2_M2413–731 in Figure 2, B and C) to determine the dynamics of SUN2_M413–731, which contains the CC1α-SUN domains, using MD simulations.
FIGURE 2:
Structural models of SUN2413–731 in monomeric and trimeric states. (A) Predicted homology models of SUN2 monomer using Phyre2 with various conformations. Confidence of prediction is shown for residues 413–731. The stars represent the two conformations that were used in this study. (B) Selected homology models of SUN2413–731 monomers with two distinct conformations (SUN2_M1413–731 and SUN2_M2413–731, shown with brown and orange stars, respectively); these models showed no structural overlap with neighboring monomers when assembled into a trimer. Side and top views of the trimeric models are also shown (SUN2_T1413–731 and SUN2_T1413–731). (C) Schematic representation of structural models of SUN2_M1413–731 (brown star) and SUN2_M2413–731 (orange star) used in this study, for comparison.
Molecular dynamics trajectories of the SUN2 monomer
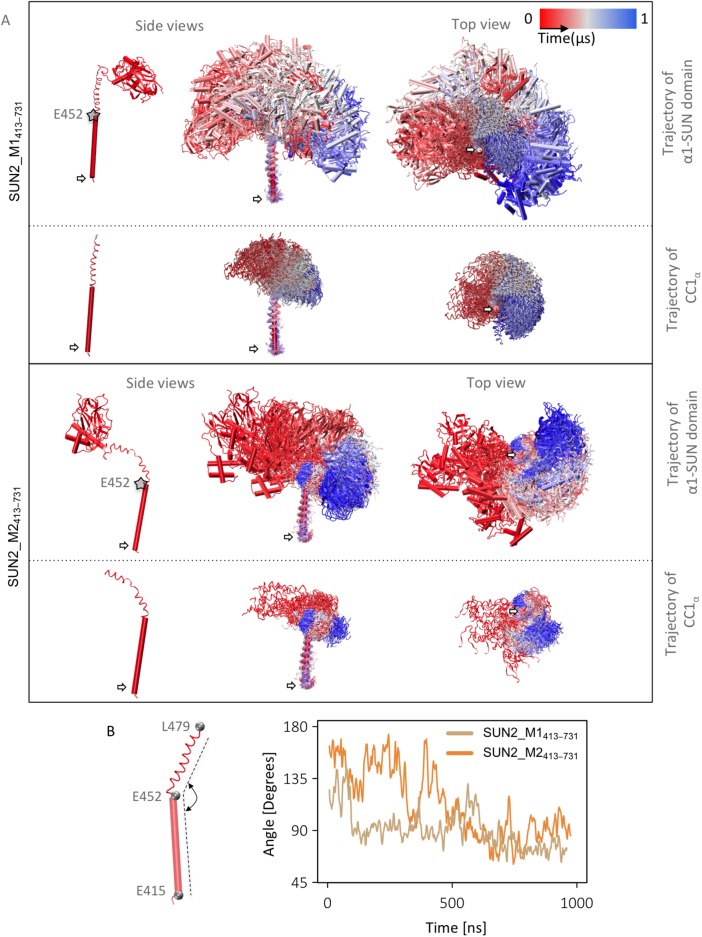
To observe the dynamics of the two selected homology models, we conducted MD simulations on these models. The MD trajectories of both models showed high variability in the position of the α1-SUN domain with respect to CC1α (Figure 3A). Notably, both modeled structures bend in the region following residue E452, which is enabled by a flexible G residue at position 454 (Figures 1C and 3). The angles between the regions on the two sides of G454 on CC1α varied between 60° and 173° over the MD simulations (Figure 3B).
FIGURE 3:
Trajectory of SUN2 monomer during MD simulations. (A) Side and top views of CC1α and α1-SUN domain trajectories (the same trajectories are shown without the α1-SUN domain for better visualization of the trajectory of CC1α alone). (B) Angles between three residues, E415, E452, and L479, in CC1α of SUN2_M1413–731 and SUN2_M2413–731. All MD simulation frames were aligned to the first time frame for this visualization using residues E415–E452. White arrows show the position of the terminal residues on CC1α.
Molecular dynamics of autoinhibited α 1-SUN in the presence of CC1 α
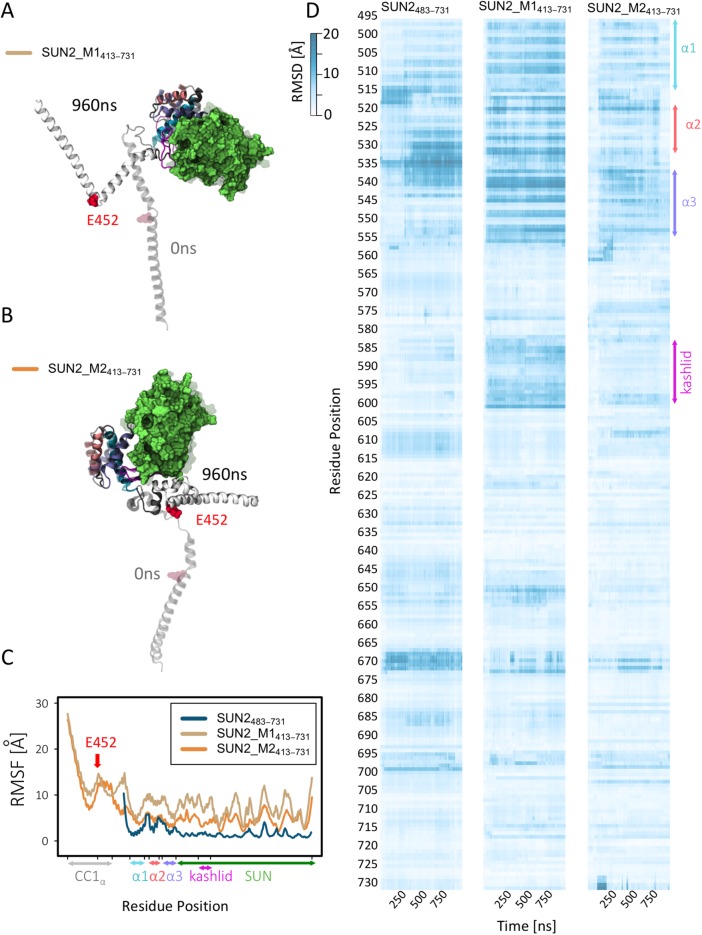
To gain insights into the dynamics of autoinhibited α1-SUN in the presence of CC1α, we compared the dynamics of the α1-SUN domains in short and long fragments of SUN2 monomer during 1-μs MD simulations. These simulations were conducted on three modeled structures, namely SUN2_M483–731, SUN2_M1413–731, and SUN2_M2413–731 (Figure 4). Both SUN2_M1413–731 and SUN2_M2413–731 experienced large conformational changes, as evidenced by the superposition of their initial and final structures over our MD simulation times (Figure 4, A and B) Moreover, we calculated average root-mean-square fluctuations (RMSF) of each model (Figure 4C). Our results show that CC1α regions of SUN2_M1413–731 and SUN2_M2413–731 fluctuate greatly compared with their α1-SUN domains. In agreement with trajectory visualizations presented in Figure 3, both modeled structures show a peak in the RMSF value at residue E452 and a kink in the CC1α region at G454 (Figure 4, A–C). We also compared the RMSF values of SUN2_M1413–731 and SUN2_M2413–731 with that of SUN2_M483–731 (Figure 4C). Both models of CC1α-SUN showed higher fluctuations in their α1-SUN domains than the isolated model of α1-SUN (SUN2_M483–731) (Figure 4C).
FIGURE 4:
Comparison of the dynamics of SUN2413–731 structural models, with wild-type SUN2483–731 monomer over 1 μs–long MD simulations. (A) First and last frames of structural models of SUN2_M1413–731 and after 1 μs–long MD simulations. (B) First and last frames of structural models of SUN2_M2413–731 after 1 μs–long MD simulations. (C) RMSFs of SUN2_M1413–731 and SUN2_M2413–731 structural models and wild-type SUN2483–731. (D) Per-residue RMSDs of SUN2_M1413–731, SUN2_M2413–731, and SUN2483–731 structural models. All simulation trajectories were aligned to the SUN2483–731 fragment of the initial frame for each model prior to RMSD calculations.
Next, to determine the conformational changes in the α1-SUN domains in the presence of the CC1α domain, we calculated the RMSD (root-mean-square deviation) of residues 483–713 (α3-SUN) from their original structures over our MD simulation times (Figure 4D; see Materials and Methods for details). The RMSDs of residues from the original structure (at time 0) were compared between the three modeled structures (SUN2_M483–731, SUN2_M1413–731, and SUN2_M2413–731) in order to determine protein domains that deviate from the original α1-SUN conformation in the presence of CC1α (Figure 4D). RMSD values up to 20 Å were observed for several residues in the α1–α3-helix bundle and the KASH-lid regions for the modeled structure of SUN2_M1413–731 (Figure 4D), indicating a high variation in these regions compared with the isolated α1-SUN. High RMSD values were also observed for α3 regions of SUN2_M2413–731; however, the RMSD of the KASH-lid of this modeled structure was lower than that of SUN2_M1413–731.
The KASH-lid is released from its autoinhibited state in the presence of CC1 α
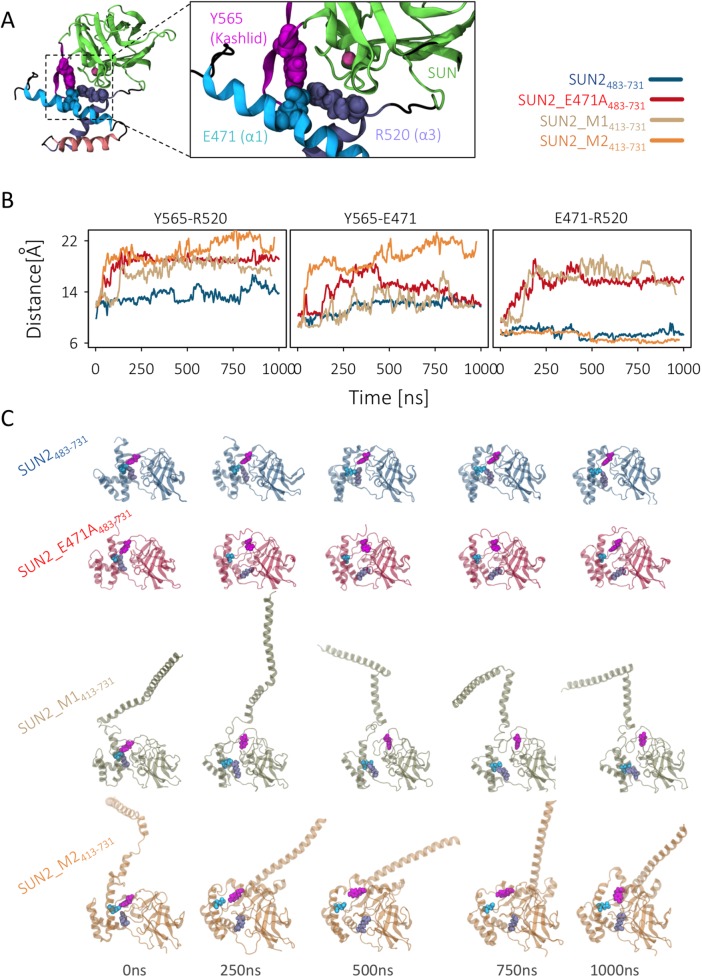
The autoinhibition of the KASH-lid of SUN2 is mediated by a three-residue cross bridge where Y565 on the KASH-lid interacts with E471 and R520 on α1 and α3, respectively (Figure 5A; Nie et al., 2016). A mutation E471A is suggested to disrupt this three-residue cross bridge, release the KASH-lid from its proposed autoinhibited state, and promote KASH binding in vitro (Nie et al., 2016). We therefore developed a fourth model, SUN2_M_E471A483–731, which contained the abovementioned mutation. To obtain insight into the autoinhibitory state of SUN2 in the presence of CC1α, we compared the distances between the centers of mass of these three residues during 1-µs MD simulations in our four modeled structures (Figure 5, B and C). Mutation of E471A resulted in a 5.50 ± 1.34-Å increase in the distance between residue Y565 on the KASH-lid and residue R520 on α3, compared with WT SUN2_M483–731 (Figure 5, B and C). Interestingly, our two models of CC1α-SUN, SUN2_M1413–731 and SUN2_M2413–731, which contained E at position 471, also showed separation between Y565 and R520 similar to that of the mutated model, SUN2_M_E471A483–731 (Figure 5, B and C).
FIGURE 5:
The link between KASH lid and α1–α3 helix bundle is lost in SUN2413–731 structural models. (A) The main residue cross-bridge that maintains the KASH lid in an autoinhibited state in the SUN2483–731 monomer. An E471A mutation has been shown to release the KASH lid from the α1–α3 helix bundle and activate it for KASH binding (Nie et al., 2016). (B) Distance between the three residues on SUN2413–731 structural models, compared with wild-type and E471A mutant SUN2483–731 monomers over microsecond-long MD simulations. (C) Five frames of each simulation trajectory are shown to represent the evolution of the distances of these residues in the four structural models during each simulation run. Residues 413–731 are aligned on the four structures to facilitate visual comparisons.
Residue Y565 and R520 showed an increased distance of 7.07 ± 1.7 and 4.25 ± 1.63 Å in models SUN2_M1413–731 and SUN2_M2413–731, respectively. Note that the first 200 ns of simulations were omitted in the calculation of the average changes in residue distances. These results suggest that CC1α can induce changes in the conformation of α1-SUN to mediate the release of the KASH-lid from its autoinhibitory state.
CC1 α-SUN is an unstable trimer in vitro and mutations in E471 can change the trimer–monomer ratio
We performed analytical gel filtration on the CC1α-SUN fragment (SUN2410–731) to determine the oligomeric state of this region in vitro. Our results show that this fragment is an unstable trimer and forms a monomer–trimer equilibrium in vitro (Figure 6). As previously mentioned, the CC1α region in both modeled structures of CC1α-SUN acquired a kink at the same location near E452 during our MD simulations. To determine the importance of the region involved in forming this kink in the activation (trimerization) of SUN2, we deleted the region and tested the oligomer state of a shorter fragment (SUN2458–731). Deletion of SUN2410–456 forced SUN2 completely into a monomeric state. Next, we examined the role of E452 (E438 in Human) in the oligomer state of the SUN2410–731 fragment by introducing point mutations. An E452 mutation changes the ratio between monomers and trimers in solution. Replacement of E452 with a hydrophobic residue (E452A) significantly reduces the monomer concentration, whereas mutation to a positively charged residue (E452R) reduces the trimer concentration and increases the monomeric concentration. Most noteworthy is the conserved substitution with a negatively charged residue (E452D), which has previously been observed in muscular dystrophy–associated SUN2 variants (Meinke et al., 2014). This substitution maintains the WT trimer concentration, but increases the monomer concentration significantly compared with WT. Our analytical gel-filtration results show that E452 plays a significant role in the oligomerization of SUN2.
FIGURE 6:
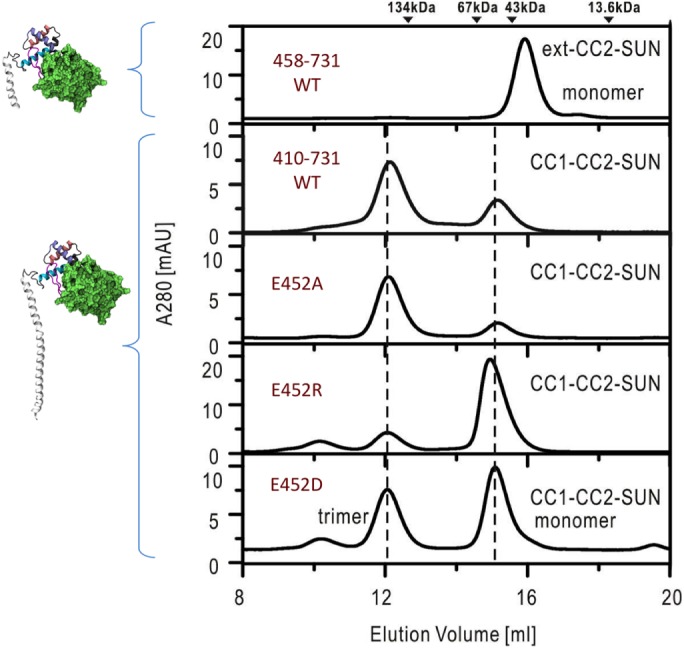
Point mutations in E452 change the monomer–trimer ratio of SUN2: analytical gel-filtration analysis of CC1-CC2-SUN (residues 410–731) and the mutants. The elution volumes of MW markers are indicated at the top.
Calcium ion binding may regulate activation of SUN2
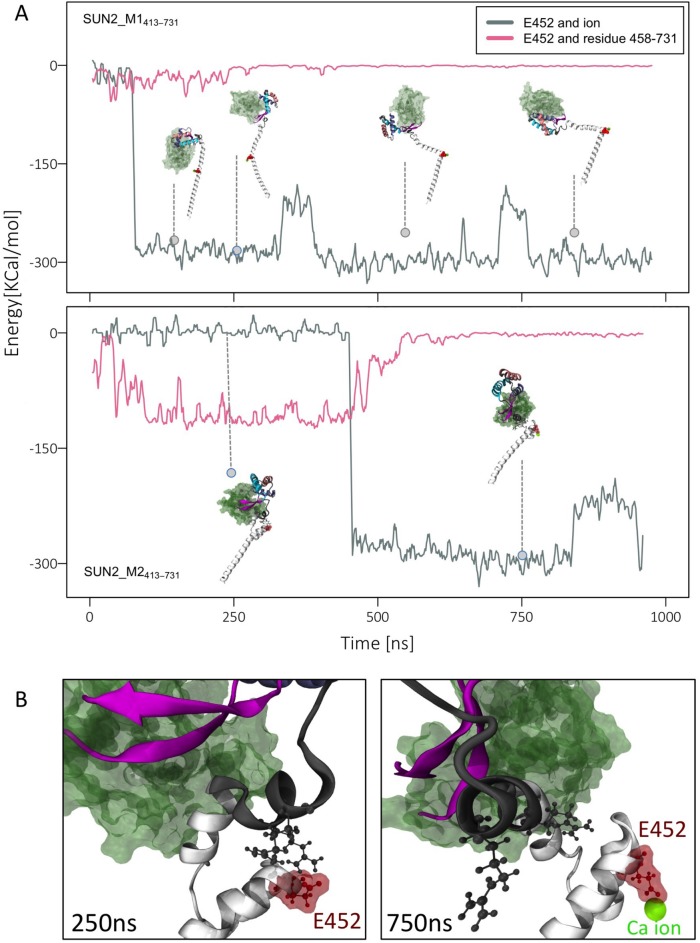
Finally, to explain a potential mechanism by which E452 may be involved in trimer–monomer transition of SUN2413–731, we took a closer look at the dynamics and interactions of this residue in our MD simulations. In model SUN2_M1413–731, E452 binds stably to a Ca2+ ion in our modeled system within the first ∼60 ns and maintains this interaction up to 1 µs (Figure 7A). In this model, CC1α kinks, but there are no interactions between the SUN domain and CC1α. In model SUN2_M2413–731, E452 also binds to a Ca2+ ion at ∼370 ns. Interestingly, when not bound to an ion, the CC1α interacts with the SUN2458–731 region through E452, as evident from the electrostatic energies calculated between these regions throughout the simulation time (Figure 7, A and B). The correlation between ion binding and SUN2458–731 binding of E452 was calculated as r = –0.84. indicating a strong negative correlation (Figure 7A). These results suggest that if E452 is not occupied by a Ca2+, it interacts with other regions of the molecule including the SUN domain.
FIGURE 7:
EDMD-related residue (E452) binds to Ca2+ ion and regulates the conformation of CC1-CC2-SUN domain. (A) Electrostatic interactions between calcium ion and residue E452, compared with nonbonded interactions between E452 and residues 458–731 for SUN2_M1413–731 (top) and SUN2_M2413–731 (bottom), showing a negative correlation between these interactions (r = –0.84) (B) Representative image of E452 bound to residues 458–731 in the absence of Ca2+ ion (left, 250 ns), and representative image of E452 associated with a Ca2+ ion and separated from other domains (right, 750 ns).
To determine whether Ca2+ would have any affect on the oligomer state of SUN2_M1413–-731 in vitro, we conducted a gel filtration analysis in the presence of 10 mM of CaCl2 or 10 mM of MgCl2 (Figure 8). Our results showed that the monomer–trimer ratio of SUN2_M1413–731 is dependent on ion concentration as well as pH (Figure 8).
FIGURE 8:
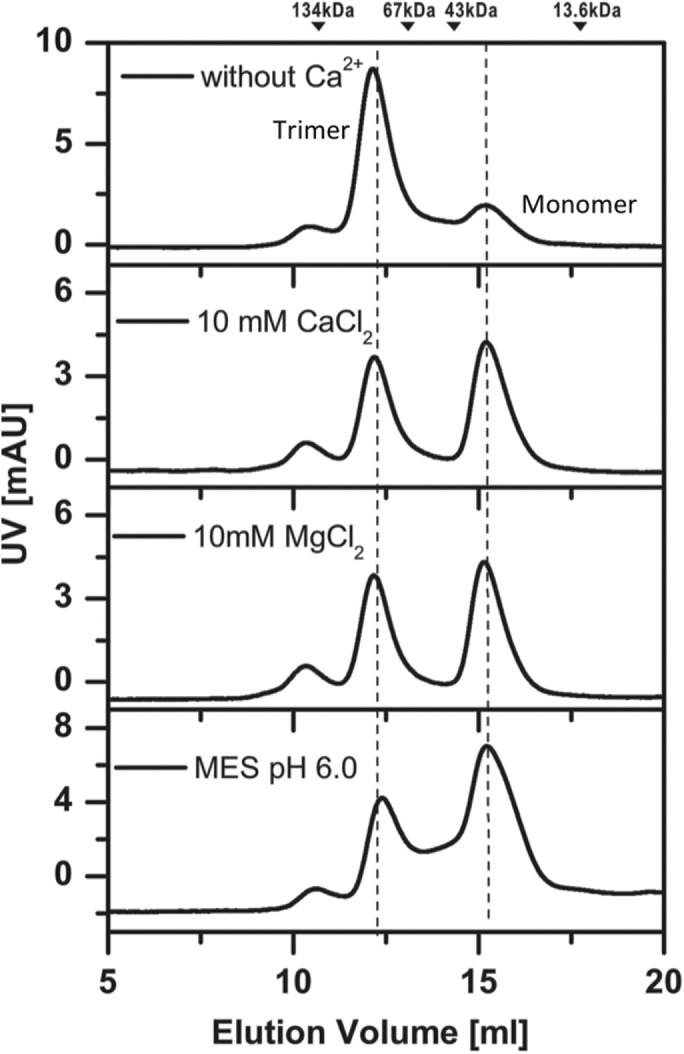
Analytical gel filtration analysis of CC1-CC2-SUN (residues 410–731) in different buffers. The elution volumes of MW markers are indicated at the top.
DISCUSSION
Structural information on small fragments of the LINC complex has greatly enhanced our understanding of the interaction of SUN2 and KASH proteins in the NE (Sosa et al., 2012; Wang et al., 2012; Nie et al., 2016). Experimental crystal screening of larger fragments of SUN2 proteins has been reported as unsuccessful, likely due to SUN2’s heterogeneous state, limiting our understanding of the molecular-scale dynamics and regulation of these proteins in the NE. To determine the crystal structure of SUN2, various fragments of the protein have been expressed separately, and thus any structural changes resulting from associations of various regions of SUN2 have not been captured by current experiments (Sosa et al., 2012; Wang et al., 2012; Nie et al., 2016). For this reason, we used an integrative computational approach incorporating all available structural information to develop a model of a large fragment of the SUN2 monomer, which consisted of the CC1α and the reported autoinhibited α1-SUN domain of SUN2.
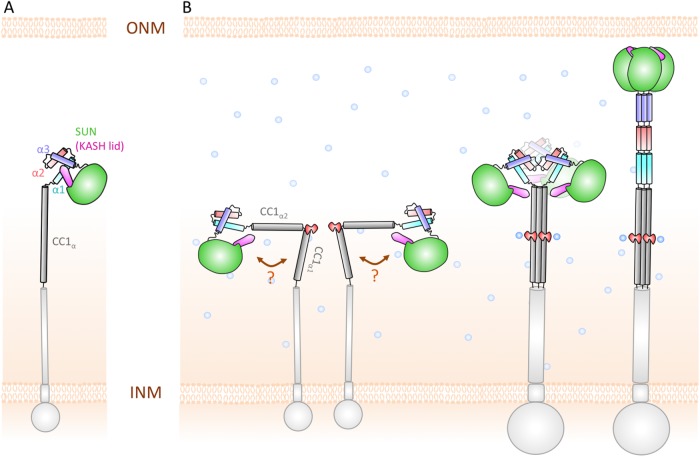
Through microsecond MD simulations, we showed that CC1α is highly flexible as a monomer and adopts a hingelike motion at residue G454 (Figures 3 and 5), forming a V-shaped CC1α (Figure 9). This may suggest that CC1α actually contains two separate α-helices (we name them CC1α1 and CC1α2) that are linked through a flexible glycine residue (Figure 9). Our gel filtration analysis shows that CC1α1 is essential for activation, and deleting CC1α1 completely disrupts the trimerization of SUN2413–731 (Figure 6). In fact, although both CC1α1 and CC1α2 have been reported to be important in the formation of CC1 in vitro (Nie et al., 2016), CC predictors all predict a zero probability for CC1α2 to form a CC. In agreement with these predictions, our results suggest that CC1α1, and not CC1α2, is the main regulator of trimerization. Additionally, because the SUN2413–731 trimer is unstable between a trimer and a monomer (Nie et al., 2016), it is plausible that the domains preceding CC1α1 stabilize SUN2413–731. In agreement with this hypothesis, CC predictors suggest that regions preceding CC1α1 can also form CCs. Gel filtration experiments including regions preceding CC1α1 would be needed to further test this hypothesis.
FIGURE 9:
Hypothetical model of SUN2 arrangement in the NE. (A) Standing model of SUN2 monomer inside the NE, where the KASH-lid of SUN2 is autoinhibited by α1–α3 helices, (B) Our hypothetical model of SUN2 monomer in the NE, where CC1 bends at residue E452 into two separate α-helices, CC1α1 and CC1α2. Additionally, in this model, the KASH-lid is not autoinhibited. E452 (shown in red) is involved in the monomer–trimer transition and mediates the association of the SUN domain with the CC regions of SUN2 through Ca2+ binding.
Additionally, our results show that the presence of CC1α alters the dynamics and conformation of α1-SUN domains (Figure 4). The lower overall RMSF of the α1-SUN (SUN2_M483–731) model compared with the models of CC1α-SUN fragments (SUN2410–731) indicates that CC1α increases the fluctuations in the α1-SUN region of the protein (Figure 4C). In agreement with this, our analytical gel-filtration analysis revealed that CC1α-SUN fragments are unstable trimers in vitro, whereas the α1-SUN fragment is a stable monomer. These results suggest that CC1α may be sufficient to activate the KASH-lid and release it from its supposed autoinhibitory monomeric state (Figure 5). Based on these results, it is unclear whether full-length SUN2 has the ability to actually adopt an autoinhibited conformation in the NE. We hypothesize that the KASH-lid is free in the full-length molecule and does not adapt an autoinhibited conformation (Figure 9).
SUN proteins must overcome the 30–50-nm NE spacing to bind to KASH (Cain and Starr, 2015). Hence, taking the anchorage of SUN2 to the INM into consideration, the hinge formed between CC1α1 and CC1α2 would position the SUN domain closer to the INM and even more inaccessible to short KASH domains at the ONM (Figure 9B). A monomer–trimer transition could result in the straightening of the molecule and the extension of SUN2 across the NE where it meets KASH (Figure 9; Jahed and Mofrad, 2018). Although the requirement for SUN2 trimerization is now widely accepted, the regulators of its monomer–trimer transition are not known. For example, although SUN2 trimerization is required for KASH binding, some predictions suggested that as trimers, SUN2 proteins may be too large to be transported through the nuclear pore (Jahed et al., 2016). Then how would SUN2 selectively regulate its oligomerization once localized to the INM and ready to bind to KASH? Several experimental studies are needed to elucidate these mechanisms; however, we propose a hypothetical model in which residue E471 is highly involved in the monomer–trimer transition of SUN2. Our analytical gel-filtration results show that E452 plays a significant role in the oligomerization of SUN2 in vitro (Figure 6). These results show that different point mutations in E452 could change the monomer–trimer ratio of CC1-CC2-SUN2 (Figure 6). Previous crystal screening attempts for CC1-CC2-SUN2 may have been unsuccessful due to the instability of this fragment as a trimer (Figure 6). Based on present results, CC1-CC2-SUN2_E452A can force the molecule into a monomer state, and CC1-CC2-SUN2_E452R can force the molecule into a trimer complex. It would be interesting to screen for crystals with these mutations to capture the monomer and trimer states of CC1-CC2-SUN2.
Finally, how would E452 be involved in SUN2 oligomerization in vivo? Based on our MD results, we propose that in the NE, the interactions of Ca2+ with E452 of each SUN2 monomer may be a factor in the trimerization of SUN2 (Figure 7). There is accumulating evidence that Ca2+ ion channels in the INM and ONM of mammalian cells can generate and maintain ion gradients in the PNS (Matzke et al., 2010). In agreement with this, our gel filtration analysis suggests a Ca2+ dependence on the oligomer state of CC1-CC2-SUN2 (Figure 8).
Ca2+ signaling regulates several cellular processes, and based on the data provided in this paper, it is plausible that it plays a role in the activation of SUN2 for KASH binding and ultimately the formation of LINC complexes (Petersen et al., 1998; Matzke et al., 2010). Interestingly, calcium has also been reported to induce conformational changes in other LINC complex–associated proteins such as lamin A (Kalinowski et al., 2013); however, whether Ca2+ can affect LINC complex function in vivo requires further experimentation.
MATERIALS AND METHODS
Sequence alignment
The amino acid sequences of Mouse and Human SUN2 were obtained from Uniprot (Magrane and UniProt Consortium, 2011; UniProt Consortium, 2017) and aligned using the Basic Local Alignment Search Tool (BLAST; UniProt Consortium, 2017). Isoform1 of Mouse SUN2 is used for residue numbering throughout the manuscript unless otherwise stated.
Structural models of SUN2
SUN2_M483–731 and SUN2_M_E471A483–731: The solved crystal structure of monomeric Mouse SUN2_M483–731 was directly downloaded from the Protein Data Bank (PDB: 5ed8). To develop the SUN2_M_E471A483–731 model, a point mutation E471A was introduced into SUN2_M483–731 using the VMD mutator tool.
SUN2_M1483–731 and SUN2_M2483–731: We used the solved crystal structures of monomeric Mouse SUN2483–731 (PDB: 5ed8) and one monomer of the trimeric coiled coil (CC1) of Mouse SUN2420–481 (PDB: 5ed9) as templates to generate homology models of monomeric Mouse SUN2413–731. Homology modeling was performed using the Phyre2 Protein Fold Recognition Server Intensive mode (Kelley et al., 2015). Phyre2 produced structural models of various conformations of monomeric Mouse SUN2413–731, where 316 residues (98%) were modeled at >90% accuracy (Kelley et al., 2015), two of which were chosen for this study, model 1 (SUN2_M1413–731) and model 2 (SUN2_M2413–731). These two models were chosen because they adopt distinct conformations at the two bounds of conformations obtained with homology modeling and showed no structural overlap with neighboring monomers when assembled into a trimer. All models produced by Phyre2 were monomeric, and so trimers of model 1 (SUN2_T1413–731) and model 2 (SUN2_T2413–731) were produced by manual placement of three monomers to check for overlap. Modeled structures were all visualized using VMD (www.ks.uiuc.edu/Research/vmd/vmd-1.9.1/, version 1.9.1; Humphrey et al., 1996; Phillips et al., 2005). All models were solvated in water using the NAMD solvate package, with a 2.4-Å boundary and 20-Å box padding. The system was subsequently neutralized with counterions and ionized with KCl and CaCl2. Calcium concentrations in the PNS are predicted to be similar to that of the ER. However, due to several limitations in methods of measuring intra-ER Ca2+, various measurements have been reported for the concentration of Ca2+, ranging from ∼10 to 1000 µM (Gerasimenko et al., 2014). In this study we used a concentration of 500 µM of Ca2+. The final sizes of the four systems, including the proteins, ions, and water, were 71K, 72K, 165K, and 225K atoms for SUN2_M483–731, SUN2_M_E471A483–731, SUN2_M1483–731, and SUN2_M2483–731, respectively.
Molecular dynamics simulations
All-atom MD simulations for this study were performed using NAMD scalable MD with the CHARMM force field (Phillips et al., 2005). All systems were minimized at 5000 steps and equilibrated for 2 ns with a time step of 2 fs where all linear bonds involving hydrogen and any other atoms were considered to be rigid (nonvibrating). Simulations were performed at a constant temperature of 310 K and a constant pressure of 1 atm using the Langevin piston method and Hoover’s method during minimization and equilibration. Periodic boundary conditions were applied in all three directions and particle mesh Ewald (PME) was used with a 1-Å maximum space between grid points for calculating electrostatic interactions during MD simulations with periodic boundary conditions. All simulations were run for ∼1 μs.
Electrostatic interaction energy plots
The nonbonded electrostatic interaction energies were calculated using VMD and NAMD energy (Version 1.4) with the cutoff for nonbonded interactions set to 12 Å, and using a switching function with a switching distance of 10 Å (Phillips et al., 2005). All plots were produced using the R gplot package. The correlation coefficient between the energies was calculated using the cor() function (www.r-tutor.com/elementary-statistics/numerical-measures/correlation-coefficient). Using this function, the correlation coefficient Sx,y between two variables x and y, with individual standard deviations Sx and Sy and a covariance of Sx,y, is calculated using the following formula:
 |
A correlation coefficient of 1 indicates that the variables are positively linearly related, and -1 indicates that the variables are negatively linearly related.
RMSD and RMSF calculations
The RMSDs of residues 483–731 of three structural models, SUN2_M483–731, SUN2_M1413–731, and SUN2_M2413–731, were computed using the RMSD visualizer tool VMD. To eliminate the effect of rotation and translation of the molecules during the simulation, for each model we aligned all frames of the trajectory to a reference frame (frame 0) using only residues 483–731, prior to RMSD computations. Atomic RMS Fluctuations over MD trajectories, were evaluated using the rmsf() function in R Bio3D package (Grant et al., 2006). The RMSF values are often used as measures of conformational variance in MD simulations. All plots were generated using the plot() or heatmap.2() functions of the R gplot package.
Protein purification and gel-filtration analysis
DNA sequences of SUN2458–731 and SUN2410–731 were amplified by PCR from the full-length mouse SUN2 (NM_194342) and then inserted into a modified pET32a vector (with an N-terminal GB1-His6 tag). Point mutations in E452 of SUN2410–731 were created using the standard PCR-based mutagenesis method and confirmed by DNA sequencing. Recombinant proteins were expressed in Escherichia coli BL21 (DE3) host cells at 16°C. The GB1-His6-tagged proteins were purified by affinity chromatography (Ni2+-Sepharose 6 Fast Flow; GE Healthcare) followed by size exclusion chromatography (Superdex-200 26/60; GE Healthcare). After cleavage of the tag, the resulting proteins were further purified by another run of size-exclusion chromatography. The oligomeric states of all the protein samples were checked by analytical gel filtration (Superdex-200 10/300GL; GE Healthcare) in the buffer 50 mM Tris-HCl, pH 8.0, 100 mM NaCl, 1 mM DTT, 1 mM EDTA. All experiments were performed at room temperature. Additionally, ion and pH dependence were tested in the presence of 10 mM CaCl2, 10 mM MgCl2, or 50 mM MES buffer (pH 6.0).
Acknowledgments
We gratefully acknowledge discussions with members of the Molecular Cell Biomechanics Laboratory. This study was supported by National Science Foundation (NSF) Award BMMB-1538707 to M.R.K.M, the National Key R&D Program of China (2017YFA0503501), and the National Natural Science Foundation of China (31600622). In addition, this work used the Extreme Science and Engineering Discovery Environment (XSEDE), which is supported by the NSF (Grant ACI-1053575).
Abbreviations used:
- CC
coiled-coil
- INM
inner nuclear membrane
- KASH
Klarsicht, ANC-1, SYNE homology
- MD
molecular dynamics
- NE
nuclear envelope
- ONM
outer nuclear membrane
- PNS
perinuclear space
- RMSD
root-mean-square deviation
- SUN
Sad1 and UNC-84
Footnotes
This article was published online ahead of print in MBoC in Press (http://www.molbiolcell.org/cgi/doi/10.1091/mbc.E18-04-0266) on July 11, 2018.
REFERENCES
- Cain NE, Starr DA, (2015). SUN proteins and nuclear envelope spacing. Nucleus , 2–7. [DOI] [PMC free article] [PubMed] [Google Scholar]
- Crisp M, Liu Q, Roux K, Rattner JB, Shanahan C, Burke B, Stahl PD, Hodzic D. (2006). Coupling of the nucleus and cytoplasm: role of the LINC complex. J Cell Biol , 41–53. [DOI] [PMC free article] [PubMed] [Google Scholar]
- Folker ES, Baylies MK, (2013). Nuclear positioning in muscle development and disease. Front Physiol , 363. [DOI] [PMC free article] [PubMed] [Google Scholar]
- Gerasimenko JV, Petersen OH, Gerasimenko OV, (2014). Monitoring of intra-ER free Ca2+. Wiley Interdiscip Rev Membr Transp Signal , 63–71. [Google Scholar]
- Grant BJ, Rodrigues APC, ElSawy KM, McCammon JA, Caves LSD. (2006). Bio3d: an R package for the comparative analysis of protein structures. Bioinformatics , 2695–2696. [DOI] [PubMed] [Google Scholar]
- Gundersen GG, Worman HJ, (2013). Nuclear positioning. Cell , 1376–1389. [DOI] [PMC free article] [PubMed] [Google Scholar]
- Haque F, Lloyd DJ, Smallwood DT, Dent CL, Shanahan CM, Fry AM, Trembath RC, Shackleton S. (2006). SUN1 interacts with nuclear lamin A and cytoplasmic nesprins to provide a physical connection between the nuclear lamina and the cytoskeleton. Mol Cell Biol , 3738–3751. [DOI] [PMC free article] [PubMed] [Google Scholar]
- Haque F, Mazzeo D, Patel JT, Smallwood DT, Ellis J, Shanahan CM, Shackleton S. (2010). Mammalian SUN protein interaction networks at the inner nuclear membrane and their role in laminopathy disease processes. J Biol Chem , 3487–98. [DOI] [PMC free article] [PubMed] [Google Scholar]
- Horn HF, Brownstein Z, Lenz DR, Shivatzki S, Dror AA, Dagan-Rosenfeld O, Friedman LM, Roux KJ, Kozlov S, Jeang KT, et al. (2013). The LINC complex is essential for hearing. J Clin Invest , 740–750. [DOI] [PMC free article] [PubMed] [Google Scholar]
- Humphrey W, Dalke A, Schulten K. (1996). VMD: visual molecular dynamics. J Mol Graph , 33–38, 27–8. [DOI] [PubMed] [Google Scholar]
- Isermann P, Lammerding J. (2013). Nuclear mechanics and mechanotransduction in health and disease. Curr Biol , R1113–R1121. [DOI] [PMC free article] [PubMed] [Google Scholar]
- Jahed Z, Fadavi D, Vu UT, Asgari E, Luxton GWG, Mofrad MRK. (2018). Molecular insights into the mechanisms of SUN1 oligomerization in the nuclear envelope. Biophys J , 1190–1203. [DOI] [PMC free article] [PubMed] [Google Scholar]
- Jahed Z, Mofrad MRK. (2018). Mechanical LINCs of the nuclear envelope: where SUN meets KASH. Extreme Mech Lett , 99–103. [Google Scholar]
- Jahed Z, Shams H, Mehrbod M, Mofrad MRK. (2014). Mechanotransduction pathways linking the extracellular matrix to the nucleus. Int Rev Cell Mol Biol , 171–220. [DOI] [PubMed] [Google Scholar]
- Jahed Z, Shams H, Mofrad MRK. (2015). A disulfide bond is required for the transmission of forces through SUN-KASH complexes. Biophys J , 1–9. [DOI] [PMC free article] [PubMed] [Google Scholar]
- Jahed Z, Soheilypour M, Peyro M, Mofrad MRK. (2016). The LINC and NPC relationship—it’s complicated! J Cell Sci , 3219–3229. [DOI] [PubMed] [Google Scholar]
- Kalinowski A, Qin Z, Coffey K, Kodali R, Buehler MJ, Lösche M, Dahl KN. (2013). Calcium causes a conformational change in lamin A tail domain that promotes farnesyl-mediated membrane association. Biophys J , 2246–2253. [DOI] [PMC free article] [PubMed] [Google Scholar]
- Kelley LA, Mezulis S, Yates CM, Wass MN, Sternberg MJE. (2015). The Phyre2 Web portal for protein modelling, prediction and analysis. Nat Protoc , 845–858. [DOI] [PMC free article] [PubMed] [Google Scholar]
- Khatau SB, Hale CM, Stewart-Hutchinson PJ, Patel MS, Stewart CL, Searson PC, Hodzic D, Wirtz D. (2009). A perinuclear actin cap regulates nuclear shape. Proc Natl Acad Sci USA , 19017–19022. [DOI] [PMC free article] [PubMed] [Google Scholar]
- Lombardi ML, Jaalouk DE, Shanahan CM, Burke B, Kyle J, Roux J, Lammerding J. (2011). The interaction between nesprins and SUN proteins at the nuclear envelope is critical for force transmission between the nucleus and cytoskeleton. J Biol Chem , 26743–26753. [DOI] [PMC free article] [PubMed] [Google Scholar]
- Magrane M, UniProt Consortium (2011). UniProt knowledge base: a hub of integrated protein data. Database (Oxford) , bar009. [DOI] [PMC free article] [PubMed] [Google Scholar]
- Matsumoto A, Hieda M, Yokoyama Y, Nishioka Y, Yoshidome K, Tsujimoto M, Matsuura N. (2015). Global loss of a nuclear lamina component, lamin A/C, and LINC complex components SUN1, SUN2, and nesprin-2 in breast cancer. Cancer Med , 1547–1557. [DOI] [PMC free article] [PubMed] [Google Scholar]
- Matzke AJM, Weiger TM, Matzke M. (2010). Ion channels at the nucleus: electrophysiology meets the genome. Mol Plant , 642–652. [DOI] [PMC free article] [PubMed] [Google Scholar]
- Meinke P, Mattioli E, Haque F, Antoku S, Columbaro M, Straatman RK, Worman JH, Gundersen GG, Lattanzi G, Wehnert M, et al. (2014). Muscular dystrophy-associated SUN1 and SUN2 variants disrupt nuclear-cytoskeletal connections and myonuclear organization. PLoS Genet , e1004605. [DOI] [PMC free article] [PubMed] [Google Scholar]
- Meinke P, Nguyen TD, Wehnert MS. (2011). The LINC complex and human disease. Biochem Soc Trans , 1693–1697. [DOI] [PubMed] [Google Scholar]
- Méjat A, Misteli T. (2010). LINC complexes in health and disease. Nucleus , 40–52. [DOI] [PMC free article] [PubMed] [Google Scholar]
- Nie S, Ke H, Gao F, Ren J, Wang M, Huo L, Gong W, Feng W. (2016). Coiled-coil domains of SUN proteins as intrinsic dynamic regulators. Structure , 80–91. [DOI] [PubMed] [Google Scholar]
- Padmakumar VC, Libotte T, Lu W, Zaim H, Abraham S, Noegel A, Gotzmann J, Foisner R, Karakesisoglou I. (2005). The inner nuclear membrane protein Sun1 mediates the anchorage of Nesprin-2 to the nuclear envelope. J Cell Sci (Pt 15), 3419–3430. [DOI] [PubMed] [Google Scholar]
- Petersen OH, Gerasimenko OV, Mogami H, Tepikin AV, Gerasimenko JV. (1998). The calcium store nuclear envelope. Cell Calcium , 87–90. [DOI] [PubMed] [Google Scholar]
- Phillips JC, Braun R, Wang W, Gumbart J, Tajkhorshid E, Villa E, Chipot C, Skeel RD, Kalé L, Schulten K. (2005). Scalable molecular dynamics with NAMD. J Comput Chem , 1781–1802. [DOI] [PMC free article] [PubMed] [Google Scholar]
- Puckelwartz MJ, Kessler EJ, Kim G, Dewitt MM, Zhang Y, Earley JU, Depreux FFS, Holaska J, Mewborn SK, Pytel P, et al. (2010). Nesprin-1 mutations in human and murine cardiomyopathy. J Mol Cell Cardiol , 600–608. [DOI] [PMC free article] [PubMed] [Google Scholar]
- Roux KJ, Crisp ML, Liu Q, Kim D, Kozlov S, Stewart CL, Burke B. (2009). Nesprin 4 is an outer nuclear membrane protein that can induce kinesin-mediated cell polarization. Proc Natl Acad Sci USA , 2194–2199. [DOI] [PMC free article] [PubMed] [Google Scholar]
- Soheilypour M, Peyro M, Jahed Z, Mofrad MRK. (2016). On the nuclear pore complex and its roles in nucleo-cytoskeletal coupling and mechanobiology. Cell Mol Bioeng , 217–226. [Google Scholar]
- Sosa BA, Kutay U, Schwartz TU. (2013). Structural insights into LINC complexes. Curr Opin Struct Biol , 285–291. [DOI] [PMC free article] [PubMed] [Google Scholar]
- Sosa BA, Rothballer A, Kutay U, Schwartz TU. (2012). LINC complexes form by binding of three KASH peptides to domain interfaces of trimeric SUN proteins. Cell , 1035–1047. [DOI] [PMC free article] [PubMed] [Google Scholar]
- Starr DA, Han M. (2002). Role of ANC-1 in tethering nuclei to the actin cytoskeleton. , 2000–2003. [DOI] [PubMed] [Google Scholar]
- Stroud MJ, Banerjee I, Lowe J, Chen J. (2014). LINC complex proteins in cardiac structure, function, and disease. Circ Res , 538–548. [DOI] [PMC free article] [PubMed] [Google Scholar]
- UniProt Consortium (2017). UniProt: the universal protein knowledgebase. Nucleic Acids Res , D158–D169. [DOI] [PMC free article] [PubMed] [Google Scholar]
- Wang W, Shi Z, Jiao S, Chen C, Wang H, Liu G, Wang Q, Zhao Y, Greene MI, Zhou Z. (2012). Structural insights into SUN-KASH complexes across the nuclear envelope. Cell Res , 1440–1452. [DOI] [PMC free article] [PubMed] [Google Scholar]
- Wilhelmsen K. (2005). Nesprin-3, a novel outer nuclear membrane protein, associates with the cytoskeletal linker protein plectin. J Cell Biol , 799–810. [DOI] [PMC free article] [PubMed] [Google Scholar]
- Xu Y, Li W, Ke H, Feng W. (2018). Structural conservation of the autoinhibitory domain in SUN proteins. Biochem Biophys Res Commun , 1337–1343. [DOI] [PubMed] [Google Scholar]
- Yang L, Munck M, Swaminathan K, Kapinos LE, Noegel AA, Neumann S. (2013). Mutations in LMNA modulate the lamin A–Nesprin-2 interaction and cause LINC complex alterations. PLoS One , e71850. [DOI] [PMC free article] [PubMed] [Google Scholar]
- Yu J, Lei K, Zhou M, Craft CM, Xu G, Xu T, Zhuang Y, Xu R, Han M. (2011). KASH protein Syne-2/Nesprin-2 and SUN proteins SUN1/2 mediate nuclear migration during mammalian retinal development. Hum Mol Genet , 1061–1073. [DOI] [PMC free article] [PubMed] [Google Scholar]
- Zhang X, Lei K, Yuan X, Wu X, Zhuang Y, Xu T, Xu R, Han M. (2009). SUN1/2 and Syne/Nesprin-1/2 complexes connect centrosome to the nucleus during neurogenesis and neuronal migration in mice. Neuron , 173–187. [DOI] [PMC free article] [PubMed] [Google Scholar]
- Zhou Z, Du X, Cai Z, Song X, Zhang H, Mizuno T, Suzuki E, Yee MR, Berezov A, Murali R, et al. (2012). Structure of Sad1-UNC84 homology (SUN) domain defines features of molecular bridge in nuclear envelope. J Biol Chem , 5317–5326. [DOI] [PMC free article] [PubMed] [Google Scholar]


