Significance
Circadian rhythms are oscillations with a period of 24 h inherent in numerous biological processes. The prevailing model describing the molecular machinery of the mammalian circadian rhythms is governed by a core set of genes including BMAL1, CLOCK, and PER2. However, emerging evidence highlighted the importance of a new but contradictory role of SIRT1 on the core circadian machinery. Briefly, the two major contradictions are that (i) BMAL1 and PER2 are directly deacetylated by SIRT1 and (ii) loss of SIRT1 leads to dampening and robustness of the circadian amplitude. These contradictions remain without explanation or resolution. Our findings provide support for PER2 as a direct target of SIRT1 and identify a potential role for PGC1α in the circadian network.
Keywords: computational model, circadian regulation, SIRT1, amplitude, luminescence imaging
Abstract
The circadian clock orchestrates 24-h rhythms in physiology in most living organisms. At the molecular level, the dogma is that circadian oscillations are based on a negative transcriptional feedback loop. Recent studies found the NAD+-dependent histone deacetylase, SIRT1, directly regulates acetylation status of clock components and influences circadian amplitude in cells. While Nakahata et al. [Nakahata Y, Kaluzova M (2008) Cell 134:329–340] reported that loss of SIRT1 increases amplitude through BMAL1 acetylation, Asher et al. [Asher G, Gatfield D (2008) Cell 134:317–328] reported that loss of SIRT1 decreases amplitude through an increase in acetylated PER2. To address this SIRT1 paradox, we developed a circadian enzymatic model. Predictions from this model and experimental validation strongly align with the findings of Asher et al., with PER2 as the primary target of SIRT1. Further, the model suggested SIRT1 influences BMAL1 expression through actions on PGC1α. We validated this finding experimentally. Thus, our computational and experimental approaches suggest SIRT1 positively regulates clock function through actions on PER2 and PGC1α.
The circadian clock enables organisms to adapt to common daily and seasonal changes, such as the day−night cycle and food availability. In mammals, the central pacemaker is in the suprachiasmatic nucleus of the hypothalamus, which receives entraining signals (e.g., light) from the environment and coordinates timing information to clocks elsewhere in the body (1). While peripheral tissues also contain circadian clocks, they do not respond to light−dark cycles. Instead, hormonal rhythms, temperature, and behavior (e.g., feeding) help synchronize peripheral clocks to drive their rhythms (2–4). Further evidence suggests that the clock both regulates and is regulated by metabolism (5).
At the molecular level, circadian oscillations are generated by interlocked transcriptional−translational feedback loops (6, 7). Central to this clock machinery are the core transcription factors CLOCK and BMAL1, which heterodimerize, form a complex (CLOCK−BMAL1), and bind to E-box response elements to drive target gene transcription (8). Among the many CLOCK−BMAL1 targets are the period (PER1, PER2, PER3) and cryptochrome genes (CRY1, CRY2). Besides the primary E-box−driven loop, the ROR/REV-ERB loop is also regulated by CLOCK−BMAL1 and contributes to the transcriptional control of primary loop components (e.g., BMAL1), conferring robustness to the mechanism (9). Moreover, the clock machinery is subject to epigenetic regulation that involves chromatin remodeling to allow for DNA transcription in a dynamic manner (10, 11). Posttranslational modifications such as histone acetylation by histone acetyltransferases (HAT), histone deacetylation by histone deacetylases (HDAC), methylation, sumoylation, and ubiquitination occur in a periodic manner to confer transcriptional stability for the maintenance of the circadian rhythm (11–13). The time-dependent reversible actions of HATs and HDACs aid in recruitment of clock proteins to their DNA binding sites for transcriptional activation and repression leading to circadian rhythms (14).
To study the molecular clockwork architecture, mathematical models for several clock systems have been proposed (15–26). A key objective of these models is to quantify transcriptional/translational feedback loops that drive circadian rhythms. However, emerging studies highlight the importance of a new enzymatic loop absent from the prevailing transcriptional/translational feedback loop dogma. This enzymatic loop is constituted by SIRT1, an HDAC from the sirtuins family, which likely mediates information of cellular energetics to the chromatin remodeling of clock (13). Through its HDAC activity, SIRT1 regulates the circadian gene expression by repressing the transcription (27).
Two studies by Nakahata et al. (28) and Asher et al. (29) showed that the NAD+-dependent enzyme, SIRT1, functions as a deacetylase that modifies the activity of core clock components BMAL1 and PER2. While Nakahata et al. reported their observations in mouse embryo fibroblasts (MEFs) extracted from male BALB/c and liver-specific SIRT1−/− mice, Asher et al. reported their observation in NIH 3T3 cells and MEFs from wild-type (WT) and SIRT1−/− mice. Both studies demonstrate SIRT1 regulates circadian amplitude of core clock genes, with more-recent studies replicating some of these findings (30, 31). However, the two studies differed in some of their critical findings. Nakahata et al. show loss of SIRT1 led to higher amplitude of the circadian rhythms, while Asher et al. show loss of SIRT1 led to lower amplitude of the circadian rhythms (32). CLOCK-mediated acetylation of BMAL1 at Lys537 increases efficacy of CRY-mediated repression on CLOCK−BMAL1 mediated transcription (33). Nakahata et al. demonstrated that SIRT1 acts as a molecular rheostat of CLOCK’s HAT activity on BMAL1 by directly interacting with the CLOCK−BMAL1 complex on circadian gene promoters and deacetylating BMAL1. Although Asher et al. observed an interaction of SIRT1 with CLOCK−BMAL1 dimer, in contrast to Nakahata et al., they identify a SIRT1-mediated deacetylase activity on PER2 but not BMAL1. To summarize, while Nakahata et al. suggest SIRT1 worked through deacetylation of BMAL1, Asher et al. suggested SIRT1 regulates clock function by deacetylation and degradation of PER2. We refer to these discrepancies as the “SIRT1 paradox.”
Here we attempt to reconcile this paradox by developing and experimentally validating a circadian enzymatic model that accommodates the traditional transcriptional feedback loop. Our model has the following properties: (i) circadian oscillations governed by the canonical transcription (PER−CRY/CLOCK−BMAL1) feedback loop; (ii) circadian control of the enzymatic NAD+ salvage pathway; (iii) integration of the mammalian circadian clock with energy (NAD+) metabolism through acetylation of both the activator BMAL1 and the repressor PER2; and (iv) the inclusion of the auxiliary ROR/REV-ERB feedback loop and its effect on BMAL1 transcription.
We used RNAi, genetic interaction mapping, and quantitative luminescence imaging to validate our model. Regardless of the biochemical outcome of acetylation, if SIRT1 and BMAL1 exhibit epistasis at the genetic level, individual knockdowns of SIRT1 and BMAL1 should exhibit similar phenotypes, while combinatorial knockdowns should generate a synergistic phenotype. Concomitantly, if SIRT1 functions through PER2, then knockdown of SIRT1 should resemble knockdown of PER2. In both mouse NIH 3T3 and human U2-OS cells stably expressing a BMAL1::LUC reporter, knockdown of SIRT1 phenocopied the reporter baseline and amplitude as seen with knockdown of PER2 but not BMAL1 (or CLOCK). Interestingly, knockdown of SIRT1 drove reporter levels down, in perfect contrast to BMAL1 knockdown on BMAL1::LUC reporter levels. This effect on baseline activity of the BMAL1::LUC reporter was modeled only after incorporating the auxiliary ROR/REV-ERB transcriptional feedback loop into the model, and the importance of the coactivator PGC1α on rhythmic regulation of BMAL1 was, in turn, highlighted (34, 35). In the absence of SIRT1 deacetylation, PGC1α is unable to coactivate ROR-driven BMAL1 transcription. In summary, the dual effects of SIRT1 on PER2 and PGC1α appear to contribute to regulating the circadian amplitude of gene expression.
Results and Discussion
Modeling Insights into the Circadian Amplitude Variation Without Enzymatic Feedback.
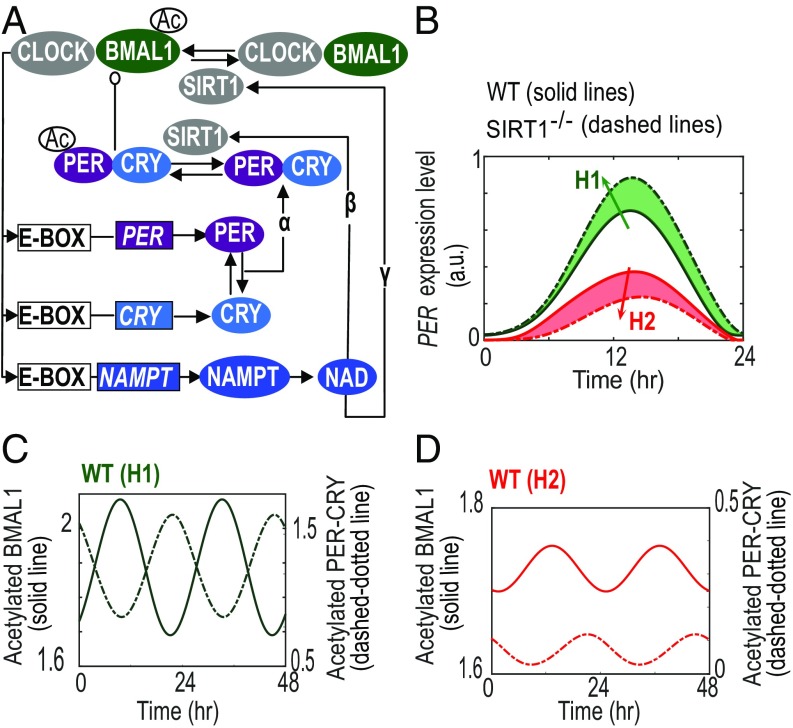
We assessed the performance of model A (Fig. 1A) for each given parameter set in SI Appendix, Table S1, by comparing the cellular dynamics with and without enzymatic feedback. Interestingly, this model recapitulates the contrasting responses observed by Nakahata et al. (28) and Asher et al. (29), based on predominance of parameter set H1 and H2, respectively (Fig. 1B). Parameter set H1 simulated the positive arm (i.e., BMAL1) as the predominant deacetylase target for SIRT1 [in congruence with data presented by Nakahata et al. (28)], while parameter set H2 considers the negative limb (i.e., the PER−CRY complex) to be the predominant target of SIRT1 [as reported by Asher et al. (29)] (SI Appendix, Fig. S1A). Simulating SIRT1−/− in model A predicts a nonoscillatory constitutive increase in levels of acetylated BMAL1 under both parameter sets H1 and H2 (SI Appendix, Fig. S1 B and C). However, under WT and SIRT1−/− simulations, the amplitude of acetylated BMAL1 (BMAL1AC) is significantly lower in parameter set H2 compared with set H1. As for the acetylated repressor complex (PERAC−CRY), the model also simulates lower amplitude in WT condition. Despite this lower WT rhythm, the simulated levels of PERAC−CRY are greater in SIRT1−/− mutant (dashed line, SI Appendix, Fig. S1D) than in WT (solid line, SI Appendix, Fig. S1D) and in qualitative agreement with the data presented by Asher et al. (29).
Fig. 1.
Network topology and dynamics obtained from circadian model A. (A) Network topology of the circadian enzymatic model with constitutive BMAL1 gene expression (model A). Greek letters (α, β, γ) represent the interlocked transcriptional and enzymatic feedback loops exerted by the PER-CRY loop (α), the NAD loop and its deacetylation effects on PER-CRY repressor (β), and BMAL1 activator (γ). (B) Model recapitulates the experimentally observed differential amplitude response due to lack of SIRT1. Solid lines represent the control WT condition, while dash-dotted lines represent SIRT1−/−. (C and D) Stoichiometric variance in (acetylated) core clock components is critical for the amplitude phenotype of SIRT1−/−. Solid lines represent the WT dynamics of the acetylated activator (BMAL1AC) and repressor (PERAC-CRY) simulated using either parameter set (C) H1 (green lines) or (D) H2 (red lines). See also SI Appendix, Figs. S1 and S2 and Table S1.
With regards to the directionality of amplitude response under SIRT1−/−, further analysis indicates that it is primarily determined by the stoichiometric ratios between activator (BMAL1AC) and repressor (PERAC−CRY) complexes (Fig. 1 C and D). In particular, larger ratios of activator to repressor complexes can give rise to the reduced amplitude phenotype as observed by Asher et al. (29), while smaller ratios can give rise to the increased amplitude phenotype as observed by Nakahata et al. (28). From a computational standpoint, larger ratios between activator and repressor are attributed to high levels of the activator and low levels of the repressor (SI Appendix, Fig. S1D). Notably, it has been previously shown that the robustness and thereby the amplitude of circadian rhythms in cultured fibroblasts was dramatically enhanced by equalizing the ratio between activator and repressor (36). Consistent with these data, the 1:1 molar ratio between activator and repressor is critical for a new class of mathematical models, known as protein sequestration-based models, to generate robust rhythms (37, 38). Such stoichiometry was also observed experimentally in the macromolecular study by Aryal et al. (39) with the activator (CLOCK−BMAL1) and repressor (PER−CRY) existing in ∼0.75- and ∼0.9-MDa complexes, respectively. Taken together, our results support the hypothesis that inherent genetic variation in cell lines and/or mouse strains used in an experiment could potentially influence and therefore account for the paradoxical phenotypic responses observed in SIRT1−/− (28, 29).
In Silico Hypotheses Generated by Model A in Reconciling the “SIRT1 Paradox”.
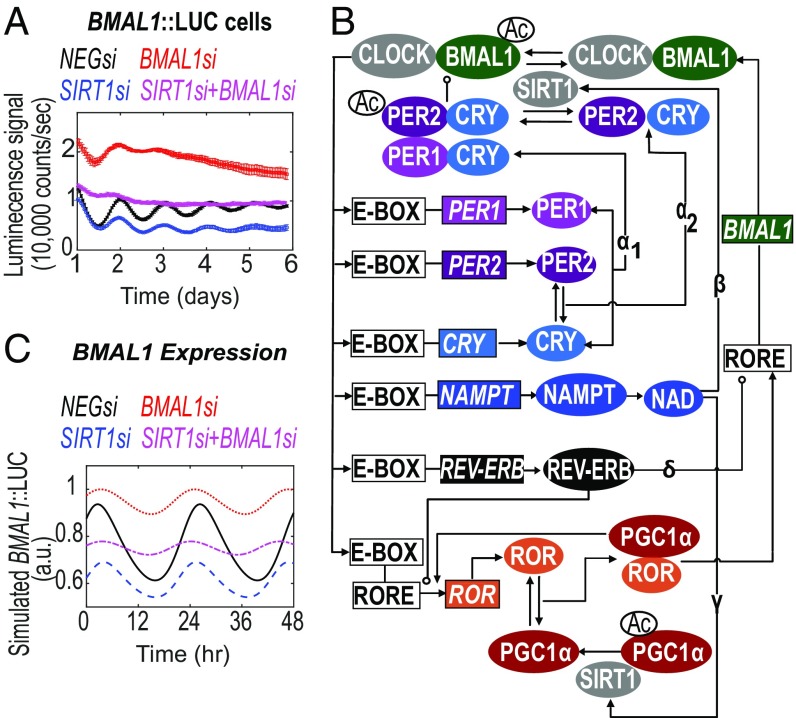
By saturating the acetylation rate for the repressor (vPAC), i.e., acetylation on PER, the model predicts increased amplitude in the absence of SIRT1 (SI Appendix, Fig. S2 A and B). Under this single (parametric) perturbation, the deacetylation rate of SIRT1 on PER becomes negligible due to high PER acetylation. Alternatively, such perturbation is equivalent to the case where model parameters are set to consider BMAL1 as the predominant target of SIRT1. Under this condition, the model predicts increased amplitude of oscillations in SIRT1−/− [consistent with the findings from Nakahata et al. (28)]. However, testing this prediction experimentally is not feasible, as the PER2 specific acetyltransferase remains unknown. Similar predictions are also obtained if the saturation effect of PER acetylation is followed by a simultaneous reduction in the acetylation rate of BMAL1. In this case, the circadian amplitude increases to a greater extent in the SIRT1−/− mutant. As CLOCK acetylates BMAL1 (32), the phenotype following a CLOCK knockdown should, in part, be due to decreased rates in BMAL1 acetylation. However, knockdown of CLOCK has been observed, by us (40) and others (41), to cause dampened rhythms. Furthermore, model A suggests that, when both H1 and H2 mechanisms coexist, the loss of circadian oscillations simulated by insufficient levels of BMAL1 can be rescued by simultaneously clamping the expression of SIRT1 (SI Appendix, Fig. S2C). This can be explained by the complex interplay between the positive and the enzymatic loop (dual effects of SIRT1) in model A. We tested this hypothesis by siRNA-mediated knockdown of BMAL1 (BMAL1si), SIRT1 (SIRT1si), or both (SIRT1si+BMAL1si) in U2-OS BMAL1::LUC (Fig. 2) and PER2::LUC cell lines (SI Appendix, Fig. S3A). In both cell lines, knockdown of BMAL1 led to an increase in the baseline of the reporter oscillations followed by loss of amplitude, as described before (40). Loss of SIRT1 expression led to concurrent loss in reporter baseline, with a modest reduction in amplitude (Fig. 2A and SI Appendix, Fig. S3A). This result is consistent with the findings of Asher et al. (29), but not Nakahata et al. (28). Furthermore, under SIRT1si+BMAL1si conditions, an additive effect was observed in U2-OS BMAL1::LUC cells, with baseline levels being intermediate to the knockdowns of the individual genes (Fig. 2A). Similar luminescence recordings are observed if these experiments are repeated in mouse NIH 3T3 reporter lines (SI Appendix, Fig. S3 B and C). Model A, however, failed to capture this effect. To reconcile the inconsistencies in model A, we included the rhythmic regulation of BMAL1 transcription by the auxiliary PGC1α/ROR/REV-ERB feedback loop (model B) (Fig. 2B).
Fig. 2.
Network topology and relevant dynamics obtained from circadian model B. (A) Luminescence of U2-OS BMAL1::LUC was measured from cells transfected with siRNAs targeting BMAL1, SIRT1, or both, illustrated as BMAL1si, SIRT1si, and SIRT1si+BMAL1si lines, respectively. Data are represented as mean ± SEM. (B) Network of interacting components of the circadian enzymatic model B incorporating the ROR/REV-ERB loop. Greek letters (α1, α2, β, γ, δ) represent the core PER/CRY loop including both homologs of PER1 and PER2 genes (α1, α2), the metabolic NAD loop and its deacetylation effects on PER2/CRY and BMAL1 (β), and PGC1α (γ). The second transcriptional ROR/REV-ERB loop (δ) participates in the regulation of BMAL1 expression. (C) In silico reproduction of the circadian effects of SIRT1 and BMAL1 knockdown on BMAL1 expression. Individual knockdowns of SIRT1si and BMAL1si are shown in blue dashed and red dotted lines, respectively. The combination knockdown (SIRT1si+BMAL1si) is shown in magenta dash-dotted lines. See also SI Appendix, Figs. S3 and S4.
Model B Aligns with Majority of the Experimental Observations.
We systematically tested model B by simulating (i) permutations of BMAL1, PER2, and PGC1α as the potential deacetylation targets for SIRT1 and (ii) perturbations wherein expression in core clock genes were modulated. We compared the model predictions to observations made experimentally in U2-OS and NIH 3T3 reporter lines wherever feasible.
Testing epistatic interactions of BMAL1 and SIRT1.
We first simulated and experimentally tested a partial loss in BMAL1 expression and assayed the resulting response in U2-OS BMAL1::LUC cells. In agreement with our previous study (40, 41), we observed ∼46% reduction in REV-ERB expression following BMAL1 knockdown (SI Appendix, Fig. S3D). From a modeling standpoint, parameters are set to consider (i) BMAL1, PER2, and PGC1α as direct deacetylation targets of SIRT1 and (ii) REV-ERB as the dominant driving force within the ROR/REV-ERB loop. Therefore, following loss of BMAL1 expression, the reduced expression of BMAL1 inhibitor (REV-ERB, SI Appendix, Fig. S3E) outweighs the concurrent reduction in expression of BMAL1 activator (ROR, SI Appendix, Fig. S3F), resulting in increased baseline of simulated BMAL1 expression (Fig. 2C). This model prediction is in agreement with our observed experimental results in U2-OS and 3T3 cells (Fig. 2A and SI Appendix, Fig. S3B).
SIRT1−/− in the aforementioned parametric set for model B simulates lower baseline and amplitude of BMAL1 expression consistent with the BMAL1::LUC oscillations data provided by Asher et al. (29) and experimental observations in this study (Fig. 2A and SI Appendix, Fig. S3B). Furthermore, the phenotype from the simultaneous knockdown of SIRT1 and BMAL1, which appears to be additive and intermediate to the phenotypes of the individual knockdowns, is also faithfully captured by model B (compare Fig. 2 A and C and SI Appendix, Fig. S3B). A similar congruence is observed between simulation results and experimental observations with knockdown of ROR alone or in combination with SIRT1 (compare SI Appendix, Fig. S3 G and H), further supporting the modeling hypothesis.
Next, we constrained parameters in model B so that all permutations of BMAL1, PER2, and PGC1α were considered as targets for SIRT1-mediated deacetylation and compared the simulation results to the experimental data. When SIRT1 is modeled to only target PER2, the simulations results successfully capture the compromised amplitude/baseline with knockdown of SIRT1 (SIRT1si) and double knockdown of SIRT1/BMAL1 (SIRT1si+BMAL1si) in PER2 expression rhythms (compare PER2 in SI Appendix, Figs. S4A and S3A). In contrast, simulations under these conditions failed to reproduce the experimentally observed BMAL1 expression rhythms (compare BMAL1 in Fig. 2A and SI Appendix, Figs. S4A). Similarly, when SIRT1 is modeled to only target PGC1α, the simulations capture the experimentally observed effects of SIRT1si and SIRT1si+BMAL1si on BMAL1 expression rhythms (compare BMAL1 in SI Appendix, Fig. S4B and Fig. 2A) but not PER2 expression rhythms (compare PER2 in SI Appendix, Figs. S4B and S3A). Next, modeling SIRT1 to target both PER2 and PGC1α successfully reproduces the experimental data for both PER2 (compare PER2 in SI Appendix, Figs. S4C and S3A) and BMAL1 (compare BMAL1 in SI Appendix, Fig. S4C and Fig. 2A) expression rhythms. Finally, considering SIRT1 to only target BMAL1 for deacetylation completely fails to capture experimental observation. Under this condition, our model predicts loss of BMAL1/PER2 oscillations in BMAL1si and a rescue of oscillations in the double knockdown condition (SIRT1si+BMAL1si) (SI Appendix, Fig. S4D). This inconsistency with experimental observation is not resolved even if, in addition to BMAL1, SIRT1 is modeled to also act on PER2 (SI Appendix, Fig. S4E) or PGC1α (SI Appendix, Fig. S4F). Taken together, the dual effects of SIRT1 on PER2 and PGC1α appear necessary and sufficient in recapitulating all experimentally observed phenotypes from the epistatic interactions of SIRT1 and BMAL1.
Testing epistatic interactions of CLOCK and SIRT1.
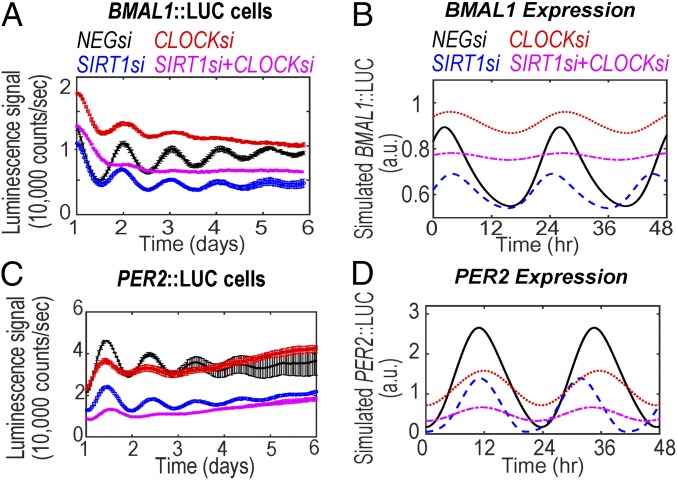
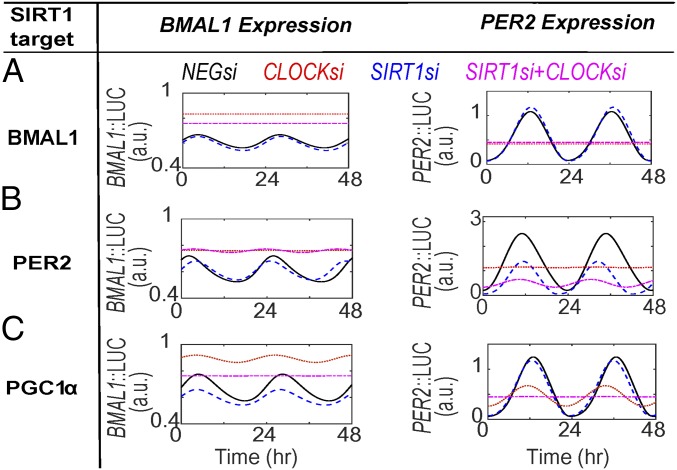
One of the key assumptions involved in model B is that BMAL1 undergoes reversible CLOCK-mediated acetylation as exemplified by previous studies (28, 32). To investigate whether SIRT1 epistatically interacts with CLOCK, we analyzed the effect of dual knockdown of SIRT1/CLOCK on BMAL1/PER2 oscillations under the parametric condition that SIRT1 can deacetylate both PER2 and PGC1α. Under this condition, the model faithfully captures the experimentally observed results using the BMAL1::LUC (U2-OS: compare Fig. 3 A and B; NIH 3T3: compare SI Appendix, Fig. S5A and Fig. 3B) and PER2::LUC (U2-OS: compare Fig. 3 C and D; NIH 3T3: compare SI Appendix, Fig. S5B and Fig. 3D) reporter lines. However, when the model considers any other permutation of targets for SIRT1 deacetylase activity, simulation result fails to reproduce the experimental observations. Importantly, modeling BMAL1 as the only target for SIRT1 predicts negligible change in BMAL1 expression rhythms and an increase in amplitude of PER2 rhythms under simulated loss in SIRT1 (SIRT1si) expression (compare Fig. 4A, Per2::LUC). Similarly, such inconsistencies continue to be simulated if SIRT1-mediated deacetylation is considered for BMAL1+PGC1α (SI Appendix, Fig. S6A), BMAL1+PER2 (SI Appendix, Fig. S6B), BMAL1+PGC1α+PER2 (SI Appendix, Fig. S6C), only PER2 (Fig. 4B), and only PGC1α (Fig. 4C). Taken together, to faithfully capture all of the phenotypes observed by the combinatorial knockdowns of SIRT1/BMAL1 and SIRT1/CLOCK requires our models to consider PER2 and PGC1α, and not BMAL1, as the deacetylation targets of SIRT1.
Fig. 3.
Effect of dual knockdown of SIRT1/CLOCK on BMAL1 and PER2 luciferase oscillations. (A) BMAL1::LUC and (B) PER2::LUC oscillations measured in U2-OS cells transfected with siRNAs targeting SIRT1 (SIRT1si), CLOCK (CLOCKsi), or both (SIRT1si+CLOCKsi). Oscillations from NIH 3T3 cells were also measured, and are shown in SI Appendix, Fig. S5. Data are represented as mean ± SEM. (C and D) In silico reproduction of the circadian effects of SIRT1/CLOCK dual knockdown on BMAL1/PER2 expression. Note that simulations are performed under conditions where SIRT1 does not deacetylate BMAL1 but deacetylates both PER2 and PGC1α. Individual knockdowns of SIRT1si and CLOCKsi are shown in blue dashed and red dotted lines, respectively. The combination knockdown (SIRT1si+CLOCKsi) is shown in magenta dash-dotted lines.
Fig. 4.
Simulation results of the circadian effects of SIRT1/CLOCK knockdown on BMAL1/PER2 luciferase oscillations. Predicted BMAL11/PER2 oscillations in the presence of SIRT1/CLOCK dual knockdown while testing permutation of BMAL1, PER2, and PGC1α as SIRT1 targets for deacetylation. Simulation results are generated under conditions where (A) SIRT1 targets only BMAL1, (B) SIRT1 targets only PER2, or (C) SIRT1 targets only PGC1α. Simulations pertaining to other permutations of SIRT1 action are shown in SI Appendix, Fig. S6. Individual knockdowns of SIRT1si and CLOCKsi are illustrated in blue dashed and red dotted lines, respectively. The combination knockdown (SIRT1si+CLOCKsi) is shown in magenta dash-dotted lines.
Cell type-dependent phenotypes with epistatic interactions of PER2/SIRT1 and PGC1α/SIRT1.
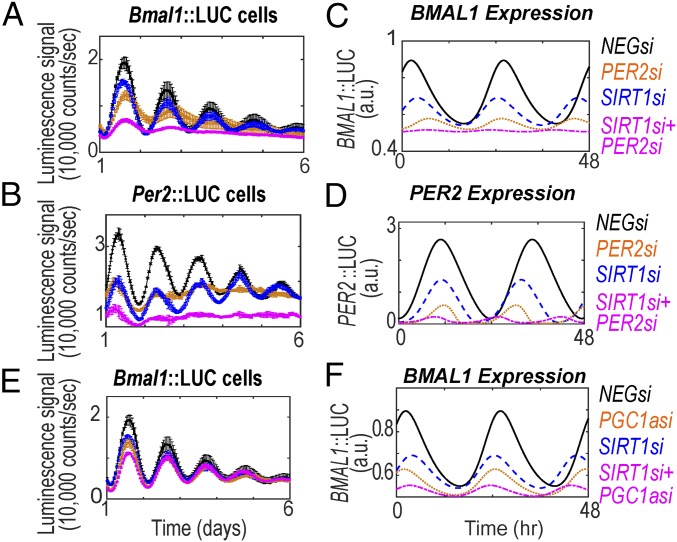
We observed subtle but clear phenotypic differences following experimental perturbations in U2-OS versus NIH 3T3 cell lines. Per2si, Sirt1si, and Sirt1si+Per2si perturbations lead to loss of amplitude and baseline in NIH 3T3 cell lines (Fig. 5 A and B), but the effect of baseline in U2-OS cell lines was not pronounced (SI Appendix, Fig. S7). Our current model recapitulates the circadian effect as seen in NIH 3T3 cell line (Fig. 5 C and D) under conditions summarized in SI Appendix, Table S2. Interestingly, the expression levels of CRY and REV-ERBa under these perturbations align well with both cell lines tested experimentally (SI Appendix, Fig. S7 E and D).
Fig. 5.
Effects of dual knockdown of SIRT1/PER2 and SIRT1/PGC1α on BMAL1/PER2 luciferase oscillations. (A) Bmal1::LUC and (B) Per2::LUC oscillations measured from NIH 3T3 cells transfected with siRNAs targeting Per2 (Per2si), Sirt1 (Sirt1si), or both (Per2si+Sirt1si). (C and D) In silico simulation of BMAL1 and PER2 expression while considering loss of gene expression under PER2si (orange dotted line), SIRT1si (blue dashed line), or PER2si+SIRT1si (magenta dash-dotted line) conditions. Simulations are performed under conditions wherein SIRT1 does not deacetylate BMAL1 but does deacetylate PER2 and PGC1α. (E) Bmal1::LUC oscillations measured in NIH 3T3 cells transfected with siRNAs targeting Pgc1α (Pgc1αsi), Sirt1 (Sirt1si), or both (Sirt1si+Pgc1αsi). BMAL1::LUC oscillations from U2-OS cells are shown in SI Appendix, Fig. S8. (F) In silico reproduction of the circadian effects of individual and combinatorial knockdowns of SIRT1 and PGC1α on BMAL1 expression. Experimental data are represented as mean ± SEM. Note that gene names in the figure legend are represented in the uppercase italics naming convention (i.e., for genes of human origin) only for simplifying this figure’s representation.
With regard to PGC1α knockdown data, an increase in BMAL1::LUC is observed in U2-OS cells (SI Appendix, Fig. S8A), while, in contrast, 3T3 cells exhibit reduced baseline (Fig. 5E). Similar to PER2si, our model predictions for PGC1α knockdown either alone (PGC1αsi) or in combination with SIRT1 (SIRT1si+PGC1αsi) are consistent with the experimental phenotype in 3T3 cells (Fig. 5F). Although a mechanistic investigation of cell type-specific circadian phenotypes is beyond the scope of this study, we repeated PGC1αsi simulations under the assumption that PGC1αsi induces an increase in the active ROR complex association parameter. Operating under this assumption, the model successfully recapitulated the U2-OS PGC1αsi data (SI Appendix, Fig. S8B).
Taken together, our observations in this study are in strong alignment with a previously published study by Ramanathan et al. (42). Like the experimental observations reported in this study, Ramanathan et al. (42) reports cell type-specific differences in knockdown related circadian phenotypes, especially when targeting the PER gene family. In future studies, we will investigate the potential for cell type-specific factors forming distinctive functional networks, leading to the observed differences in phenotypes.
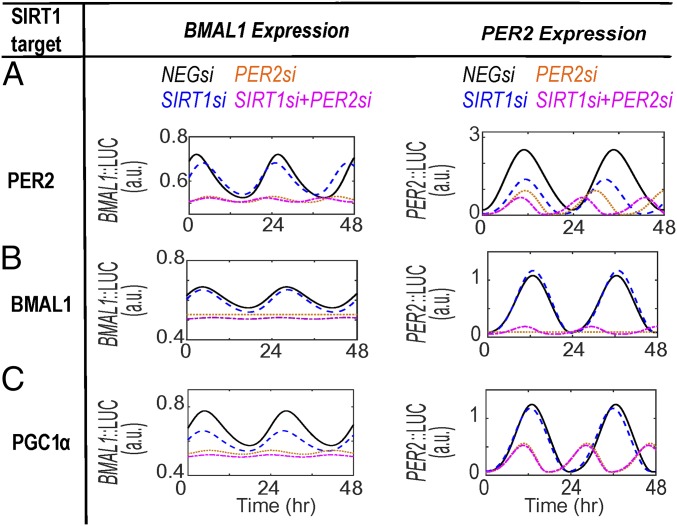
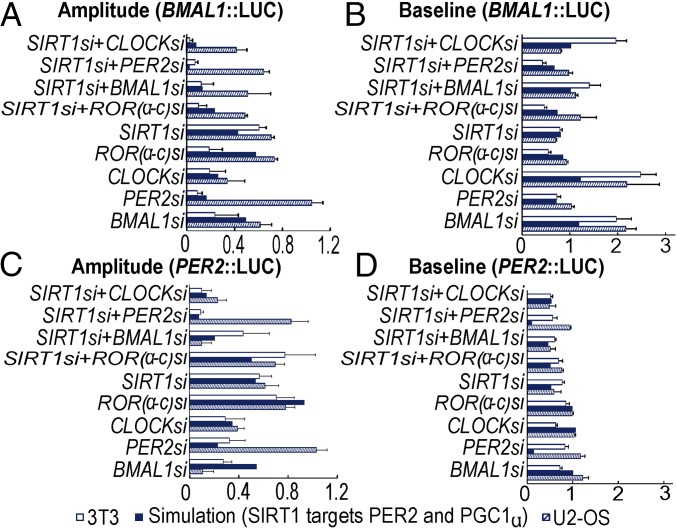
Despite the inconsistencies in phenotypic observations, when involving PGC1αsi and PER2si, between the two cell lines, our proposed model predicts the PGC1α/SIRT1 interaction as an important regulator of BMAL1 expression (previously shown in Figs. 2–4). Furthermore, we once again tested all permutations of BMAL1, PER2, and PGC1α as potential deacetylation targets while simulating loss in expression of PER2/SIRT1. When PER2 is modeled as the only target for SIRT1 deacetylation under PER2si, SIRT1si, and SIRT1si+PER2si conditions, our model recapitulates the reduced baseline/amplitude in PER2 expression rhythms (compare Fig. 6A, PER2 and Fig. 5B) but not for BMAL1 expression rhythms (Fig. 6A, BMAL1 and Fig. 5A). Similarly, simulations either partially or fully fail to capture experimental observations from either cell types under PER2si, SIRT1si, and SIRT1si+PER2si, when considering SIRT1 to target only BMAL1 (Fig. 6B), only PGC1α (Fig. 6C, inconsistent PER2 expression), PGC1α+BMAL1 (SI Appendix, Fig. S9A), and BMAL1+PER2 (SI Appendix, Fig. S9B). Taken together, our simulation results once again suggest PER2 and PGC1α as the predominant SIRT1 targets that contribute to the circadian phenotypes generated by the SIRT1 and PER2 epistatic interactions. Furthermore, model B is able to capture majority of phenotypic rhythmic expression data in both U2-OS and 3T3 cell lines (Fig. 7).
Fig. 6.
Simulation results of the circadian effects of SIRT1 and PER2 knockdown on BMAL1::LUC and PER2::LUC oscillations. Predicted BMAL1::LUC and PER2::LUC oscillations in the presence of SIRT1/PER2 knockdown while testing permutation of BMAL1, PER2, and PGC1α as SIRT1 targets for deacetylation. Individual knockdowns of SIRT1si and PER2si are illustrated in blue dashed and orange dotted lines, respectively. The combination knockdown (SIRT1si+PER2si) is shown in magenta dash-dotted lines. Simulations are performed under the assumption that (A) SIRT1 targets only PER2, (B) SIRT1 targets only BMAL1, or (C) SIRT1 targets only PGC1α. Orange and magenta traces are superimposed in C (PER2::LUC). Simulations pertaining to other potential combinations of SIRT1 action are shown in SI Appendix, Fig. S9.
Fig. 7.
Comparison of model output and experimental (siRNA) data for BMAL1::LUC and PER2::LUC oscillations in both U2-OS and 3T3 cells. Simulated (A) amplitude and (B) baseline of BMAL1::LUC oscillations and relevant siRNA data (U2-OS, pattern fill; 3T3, white fill). Simulated (C) amplitude and (D) baseline of PER2::LUC oscillations compared with relevant siRNA. Data are represented as mean ± SEM and normalized with respect to control (NEGsi) condition while applying the naming convention of U2-OS. Simulations are performed under conditions where SIRT1 deacetylates both PER2 and PGC1α but not BMAL1. Correlation analysis suggests that the effect of SIRT1 on these targets is critical for recapitulating the relevant siRNA data for both BMAL1/PER2 LUC oscillations. Correlation coefficient for the amplitude and baseline of BMAL1::LUC oscillations is 0.9 (P value = 0.001) and 0.8 (P value = 0.03), respectively. Correlation coefficient for the amplitude and baseline of PER2::LUC oscillations is 0.8 (P value = 0.01) and 0.9 (P value < 0.001), respectively. Note that (i) the U2-OS PER2si data have been excluded from the estimation of the correlation coefficient and (ii) gene names are represented in the uppercase italics naming convention (i.e., for genes of human origin) only for simplifying this figure’s representation.
In summary, we have identified strong evidence to support PER2 and not BMAL1 as the SIRT1 deacetylation target. This finding is consistent with data from Asher et al. (29). These findings are also consistent with the cellular phenotypes reported for SIRT1 at the tissue level (30, 31). Additionally, our modeling efforts provide computational evidence for PGC1α, a metabolic regulator of BMAL1 expression, as another direct deacetylation target for SIRT1. This finding agrees with the observations reported by Chang et al. (31).
Experimental Procedures
siRNA Transfections and Kinetic Bioluminescence Recording.
We used human U2-OS cells expressing luciferase under the control of a minimal BMAL1 or PER2 promoter (40, 41). These U2-OS cell lines were grown in DMEM (Invitrogen) supplemented with 10% FBS (Atlanta Biosciences) and 1× penicillin/streptomycin/glutamine (PSG; Invitrogen), and maintained at 37 °C in 5% CO2. The siRNA transfections and continuous bioluminescence recording over a course of 5 d or more was carried out by adapting published techniques (40). Further details can be found in SI Appendix.
Isolation of RNA and Gene Expression Assays.
RNA was isolated using a combination of TRIzol (Invitrogen) and either RNeasy Mini kit (Qiagen) or DirectZol kit (Zymo Research) as described (40) and as per the manufacturer’s instructions (SI Appendix, Table S3).
Model Derivation for the SIRT1-Dependent Deacetylation of BMAL1 and PER2 (Model A).
Model A, as shown in Fig. 1A, extends the dynamics of the mammalian circadian core oscillator by quantifying its regulation by the newly identified NAD+ feedback loop. Specifically, CLOCK−BMAL1 regulates the rhythmic expression of nicotinamide phosphoribosyltransferase (NAMPT), as shown in both synchronized fibroblasts (43) and peripheral tissues (e.g., liver) (44). Rhythmic NAMPT protein drives the daily oscillations of cellular NAD+ levels, a metabolic cofactor that serves as a substrate for SIRT1 deacetylase. This new time-keeping loop is closed by feedback of SIRT1 through deacetylation of BMAL1 (28) and PER2 (29). All modeling assumptions and equations are outlined in SI Appendix.
Model Derivation for the SIRT1-Dependent Regulation of BMAL1, PER2 and PGC1α (Model B).
Model B, as shown in Fig. 2B, considers the rhythmic regulation of BMAL1 transcription by the ROR/REV-ERB feedback loop. A key feature of this model is that SIRT1 affects the circadian machinery via its effects on BMAL1 and PER2 deacetylation and also on PGC1α. Further details can be found in SI Appendix.
Estimation of Model Parameters.
To estimate the unknown parameters for both models A and B, Mirsky et al.’s evolutionary search (22) was performed, satisfying a set of criteria (SI Appendix, Table S4).
Design of in Silico Experiments.
To evaluate these models, we (i) calibrated the model producing self-sustained oscillations and relevant phases (SI Appendix, Tables S4 and S5), (ii) verified whether the model captured cell-autonomous phenotypes due to loss of core clock genes or SIRT1, and (iii) verified whether SIRT1−/− increased or decreased circadian amplitude, the apparent “SIRT1 paradox.” Finally, (iv) we did knockdown experiments of SIRT1 and various clock components to validate model predictions (SI Appendix, Table S6).
Supplementary Material
Acknowledgments
We thank Dr. Pramod Rajaram and Mr. John H. Abel for their thoughtful feedback and suggestions for this manuscript. This work was supported by the Institute for Collaborative Biotechnologies under Grant W911NF-09-D-0001 (to F.J.D.) and the National Institute of Neurological Disorders and Stroke Program R01 NS054794 (to J.B.H.). The funders had no role in study design, data collection and analysis, decision to publish, or preparation of the manuscript.
Footnotes
The authors declare no conflict of interest.
This article is a PNAS Direct Submission.
This article contains supporting information online at www.pnas.org/lookup/suppl/doi:10.1073/pnas.1803410115/-/DCSupplemental.
References
- 1.Cermakian N, Sassone-Corsi P. Multilevel regulation of the circadian clock. Nat Rev Mol Cell Biol. 2000;1:59–67. doi: 10.1038/35036078. [DOI] [PubMed] [Google Scholar]
- 2.Green CB, Takahashi JS, Bass J. The meter of metabolism. Cell. 2008;134:728–742. doi: 10.1016/j.cell.2008.08.022. [DOI] [PMC free article] [PubMed] [Google Scholar]
- 3.Bechtold DA, Gibbs JE, Loudon AS. Circadian dysfunction in disease. Trends Pharmacol Sci. 2010;31:191–198. doi: 10.1016/j.tips.2010.01.002. [DOI] [PubMed] [Google Scholar]
- 4.Venkataraman A, Balance H, Hogenesch JB. The role of the circadian system in homeostasis. In: Walhout M, Vidal M, Dekker J, editors. Handbook of Systems Biology. Elsevier; New York: 2012. pp. 415–436. [Google Scholar]
- 5.Bass J, Takahashi JS. Circadian integration of metabolism and energetics. Science. 2010;330:1349–1354. doi: 10.1126/science.1195027. [DOI] [PMC free article] [PubMed] [Google Scholar]
- 6.Ko CH, Takahashi JS. Molecular components of the mammalian circadian clock. Hum Mol Genet. 2006;15:R271–R277. doi: 10.1093/hmg/ddl207. [DOI] [PubMed] [Google Scholar]
- 7.Partch CL, Green CB, Takahashi JS. Molecular architecture of the mammalian circadian clock. Trends Cell Biol. 2014;24:90–99. doi: 10.1016/j.tcb.2013.07.002. [DOI] [PMC free article] [PubMed] [Google Scholar]
- 8.Buhr ED, Takahashi JS. Molecular components of the mammalian circadian clock. Handb Exp Pharmacol. 2013:3–27. doi: 10.1007/978-3-642-25950-0_1. [DOI] [PMC free article] [PubMed] [Google Scholar]
- 9.Preitner N, et al. The orphan nuclear receptor REV-ERBalpha controls circadian transcription within the positive limb of the mammalian circadian oscillator. Cell. 2002;110:251–260. doi: 10.1016/s0092-8674(02)00825-5. [DOI] [PubMed] [Google Scholar]
- 10.Papazyan R, Zhang Y, Lazar MA. Genetic and epigenomic mechanisms of mammalian circadian transcription. Nat Struct Mol Biol. 2016;23:1045–1052. doi: 10.1038/nsmb.3324. [DOI] [PMC free article] [PubMed] [Google Scholar]
- 11.Etchegaray J-P, Lee C, Wade PA, Reppert SM. Rhythmic histone acetylation underlies transcription in the mammalian circadian clock. Nature. 2003;421:177–182. doi: 10.1038/nature01314. [DOI] [PubMed] [Google Scholar]
- 12.Curtis AM, et al. Histone acetyltransferase-dependent chromatin remodeling and the vascular clock. J Biol Chem. 2004;279:7091–7097. doi: 10.1074/jbc.M311973200. [DOI] [PubMed] [Google Scholar]
- 13.Bellet MM, Sassone-Corsi P. Mammalian circadian clock and metabolism–The epigenetic link. J Cell Sci. 2010;123:3837–3848. doi: 10.1242/jcs.051649. [DOI] [PMC free article] [PubMed] [Google Scholar]
- 14.Ripperger JA, Merrow M. Perfect timing: Epigenetic regulation of the circadian clock. FEBS Lett. 2011;585:1406–1411. doi: 10.1016/j.febslet.2011.04.047. [DOI] [PubMed] [Google Scholar]
- 15.Clodong S, et al. Functioning and robustness of a bacterial circadian clock. Mol Syst Biol. 2007;3:90. doi: 10.1038/msb4100128. [DOI] [PMC free article] [PubMed] [Google Scholar]
- 16.Wang JW, Zhou TS. A computational model clarifies the roles of positive and negative feedback loops in the Drosophila circadian clock. Phys Lett A. 2010;374:2743–2749. [Google Scholar]
- 17.Leloup JC, Goldbeter A. A model for circadian rhythms in Drosophila incorporating the formation of a complex between the PER and TIM proteins. J Biol Rhythms. 1998;13:70–87. doi: 10.1177/074873098128999934. [DOI] [PubMed] [Google Scholar]
- 18.Bagheri N, Lawson MJ, Stelling J, Doyle FJ., 3rd Modeling the Drosophila melanogaster circadian oscillator via phase optimization. J Biol Rhythms. 2008;23:525–537. doi: 10.1177/0748730408325041. [DOI] [PMC free article] [PubMed] [Google Scholar]
- 19.Smolen P, Baxter DA, Byrne JH. Modeling circadian oscillations with interlocking positive and negative feedback loops. J Neurosci. 2001;21:6644–6656. doi: 10.1523/JNEUROSCI.21-17-06644.2001. [DOI] [PMC free article] [PubMed] [Google Scholar]
- 20.Zeilinger MN, Farré EM, Taylor SR, Kay SA, Doyle FJ., 3rd A novel computational model of the circadian clock in Arabidopsis that incorporates PRR7 and PRR9. Mol Syst Biol. 2006;2:58. doi: 10.1038/msb4100101. [DOI] [PMC free article] [PubMed] [Google Scholar]
- 21.Locke JCW, Millar AJ, Turner MS. Modelling genetic networks with noisy and varied experimental data: The circadian clock in Arabidopsis thaliana. J Theor Biol. 2005;234:383–393. doi: 10.1016/j.jtbi.2004.11.038. [DOI] [PubMed] [Google Scholar]
- 22.Mirsky HP, Liu AC, Welsh DK, Kay SA, Doyle FJ., 3rd A model of the cell-autonomous mammalian circadian clock. Proc Natl Acad Sci USA. 2009;106:11107–11112. doi: 10.1073/pnas.0904837106. [DOI] [PMC free article] [PubMed] [Google Scholar]
- 23.Leloup JC, Goldbeter A. Modelling the dual role of Per phosphorylation and its effect on the period and phase of the mammalian circadian clock. IET Syst Biol. 2011;5:44. doi: 10.1049/iet-syb.2009.0068. [DOI] [PubMed] [Google Scholar]
- 24.Leloup JC, Goldbeter A. Toward a detailed computational model for the mammalian circadian clock. Proc Natl Acad Sci USA. 2003;100:7051–7056. doi: 10.1073/pnas.1132112100. [DOI] [PMC free article] [PubMed] [Google Scholar]
- 25.Forger DB, Peskin CS. Stochastic simulation of the mammalian circadian clock. Proc Natl Acad Sci USA. 2005;102:321–324. doi: 10.1073/pnas.0408465102. [DOI] [PMC free article] [PubMed] [Google Scholar]
- 26.Forger DB, Peskin CS. A detailed predictive model of the mammalian circadian clock. Proc Natl Acad Sci USA. 2003;100:14806–14811. doi: 10.1073/pnas.2036281100. [DOI] [PMC free article] [PubMed] [Google Scholar]
- 27.Bellet MM, et al. Pharmacological modulation of circadian rhythms by synthetic activators of the deacetylase SIRT1. Proc Natl Acad Sci USA. 2013;110:3333–3338. doi: 10.1073/pnas.1214266110. [DOI] [PMC free article] [PubMed] [Google Scholar]
- 28.Nakahata Y, et al. The NAD+-dependent deacetylase SIRT1 modulates CLOCK-mediated chromatin remodeling and circadian control. Cell. 2008;134:329–340. doi: 10.1016/j.cell.2008.07.002. [DOI] [PMC free article] [PubMed] [Google Scholar]
- 29.Asher G, et al. SIRT1 regulates circadian clock gene expression through PER2 deacetylation. Cell. 2008;134:317–328. doi: 10.1016/j.cell.2008.06.050. [DOI] [PubMed] [Google Scholar]
- 30.Wang R-H, et al. Negative reciprocal regulation between Sirt1 and Per2 modulates the circadian clock and aging. Sci Rep. 2016;6:28633. doi: 10.1038/srep28633. [DOI] [PMC free article] [PubMed] [Google Scholar]
- 31.Chang HC, Guarente L. SIRT1 mediates central circadian control in the SCN by a mechanism that decays with aging. Cell. 2013;153:1448–1460. doi: 10.1016/j.cell.2013.05.027. [DOI] [PMC free article] [PubMed] [Google Scholar]
- 32.Belden WJ, Dunlap JC. SIRT1 is a circadian deacetylase for core clock components. Cell. 2008;134:212–214. doi: 10.1016/j.cell.2008.07.010. [DOI] [PMC free article] [PubMed] [Google Scholar]
- 33.Hirayama J, et al. CLOCK-mediated acetylation of BMAL1 controls circadian function. Nature. 2007;450:1086–1090. doi: 10.1038/nature06394. [DOI] [PubMed] [Google Scholar]
- 34.Nemoto S, Fergusson MM, Finkel T. SIRT1 functionally interacts with the metabolic regulator and transcriptional coactivator PGC-1α. J Biol Chem. 2005;280:16456–16460. doi: 10.1074/jbc.M501485200. [DOI] [PubMed] [Google Scholar]
- 35.Liu C, Li S, Liu T, Borjigin J, Lin JD. Transcriptional coactivator PGC-1alpha integrates the mammalian clock and energy metabolism. Nature. 2007;447:477–481. doi: 10.1038/nature05767. [DOI] [PubMed] [Google Scholar]
- 36.Lee Y, Chen R, Lee HM, Lee C. Stoichiometric relationship among clock proteins determines robustness of circadian rhythms. J Biol Chem. 2011;286:7033–7042. doi: 10.1074/jbc.M110.207217. [DOI] [PMC free article] [PubMed] [Google Scholar]
- 37.Kim JK. Protein sequestration versus Hill-type repression in circadian clock models. IET Syst Biol. 2016;10:125–135. doi: 10.1049/iet-syb.2015.0090. [DOI] [PMC free article] [PubMed] [Google Scholar]
- 38.Kim JK, Forger DB. A mechanism for robust circadian timekeeping via stoichiometric balance. Mol Syst Biol. 2012;8:630. doi: 10.1038/msb.2012.62. [DOI] [PMC free article] [PubMed] [Google Scholar]
- 39.Aryal RP, et al. Macromolecular assemblies of the mammalian circadian clock. Mol Cell. 2017;67:770–782.e6. doi: 10.1016/j.molcel.2017.07.017. [DOI] [PMC free article] [PubMed] [Google Scholar]
- 40.Baggs JE, et al. Network features of the mammalian circadian clock. PLoS Biol. 2009;7:e52. doi: 10.1371/journal.pbio.1000052. [DOI] [PMC free article] [PubMed] [Google Scholar]
- 41.Zhang EE, et al. A genome-wide RNAi screen for modifiers of the circadian clock in human cells. Cell. 2009;139:199–210. doi: 10.1016/j.cell.2009.08.031. [DOI] [PMC free article] [PubMed] [Google Scholar]
- 42.Ramanathan C, et al. Cell type-specific functions of period genes revealed by novel adipocyte and hepatocyte circadian clock models. PLoS Genet. 2014;10:e1004244. doi: 10.1371/journal.pgen.1004244. [DOI] [PMC free article] [PubMed] [Google Scholar]
- 43.Nakahata Y, Sahar S, Astarita G, Kaluzova M, Sassone-Corsi P. Circadian control of the NAD+ salvage pathway by CLOCK-SIRT1. Science. 2009;324:654–657. doi: 10.1126/science.1170803. [DOI] [PMC free article] [PubMed] [Google Scholar]
- 44.Ramsey KM, et al. Circadian clock feedback cycle through NAMPT-mediated NAD+ biosynthesis. Science. 2009;324:651–654. doi: 10.1126/science.1171641. [DOI] [PMC free article] [PubMed] [Google Scholar]
Associated Data
This section collects any data citations, data availability statements, or supplementary materials included in this article.


