

Abstract
Key points
The reduced oxygen tension of high altitude compromises performance in lowlanders. In this environment, Sherpa display superior performance, but little is known on this issue.
Sherpa present unique genotypic and phenotypic characteristics at the muscular level, which may enhance resistance to peripheral fatigue at high altitude compared to lowlanders.
We studied the impact of gradual ascent and exposure to high altitude (5050 m) on peripheral fatigue in age‐matched lowlanders and Sherpa, using intermittent electrically‐evoked contractions of the knee extensors.
Peripheral fatigue (force loss) was lower in Sherpa during the first part of the protocol. Post‐protocol, the rate of force development and contractile impulse recovered faster in Sherpa than in lowlanders. At any time, indices of muscle oxygenation were not different between groups.
Muscle contractile properties in Sherpa, independent of muscle oxygenation, were less perturbed by non‐volitional fatigue. Hence, elements within the contractile machinery contribute to the superior physical performance of Sherpa at high altitude.
Abstract
Altitude‐related acclimatisation is characterised by marked muscular adaptations. Lowlanders and Sherpa differ in their muscular genotypic and phenotypic characteristics, which may influence peripheral fatigability at altitude. After gradual ascent to 5050 m, 12 lowlanders and 10 age‐matched Sherpa (32 ± 10 vs. 31 ± 11 years, respectively) underwent three bouts (separated by 15 s rest) of 75 intermittent electrically‐evoked contractions (12 pulses at 15 Hz, 1.6 s between train onsets) of the dominant leg quadriceps, at the intensity which initially evoked 30% of maximal voluntary force. Trains were also delivered at minutes 1, 2 and 3 after the protocol to measure recovery. Tissue oxygenation index (TOI) and total haemoglobin (tHb) were quantified by a near‐infrared spectroscopy probe secured over rectus femoris. Superficial femoral artery blood flow was recorded using ultrasonography, and delivery of oxygen was estimated (eDO2). At the end of bout 1, peak force was greater in Sherpa than in lowlanders (91.5% vs. 84.5% baseline, respectively; P < 0.05). Peak rate of force development (pRFD), the first 200 ms of the contractile impulse (CI200), and half‐relaxation time (HRT) recovered faster in Sherpa than in lowlanders (percentage of baseline at 1 min: pRFD: 89% vs. 74%; CI200: 91% vs. 80%; HRT: 113% vs. 123%, respectively; P < 0.05). Vascular measures were pooled for lowlanders and Sherpa as they did not differ during fatigue or recovery (P < 0.05). Mid bout 3, TOI was decreased (90% baseline) whereas tHb was increased (109% baseline). After bout 3, eDO2 was markedly increased (1266% baseline). The skeletal muscle of Sherpa seemingly favours repeated force production at altitude for similar oxygen delivery compared to lowlanders.
Keywords: contractile properties, electrical stimulation, hypoxia, muscle oxygenation, quadricep
Key points
The reduced oxygen tension of high altitude compromises performance in lowlanders. In this environment, Sherpa display superior performance, but little is known on this issue.
Sherpa present unique genotypic and phenotypic characteristics at the muscular level, which may enhance resistance to peripheral fatigue at high altitude compared to lowlanders.
We studied the impact of gradual ascent and exposure to high altitude (5050 m) on peripheral fatigue in age‐matched lowlanders and Sherpa, using intermittent electrically‐evoked contractions of the knee extensors.
Peripheral fatigue (force loss) was lower in Sherpa during the first part of the protocol. Post‐protocol, the rate of force development and contractile impulse recovered faster in Sherpa than in lowlanders. At any time, indices of muscle oxygenation were not different between groups.
Muscle contractile properties in Sherpa, independent of muscle oxygenation, were less perturbed by non‐volitional fatigue. Hence, elements within the contractile machinery contribute to the superior physical performance of Sherpa at high altitude.
Introduction
The reduction in partial pressure of inspired oxygen (P IO2) with ascent to high altitude leads to multiple, interconnected adjustments within the locomotor system that compromise the ability of humans to perform physical activity (Martin et al. 2010). When exposed acutely to hypoxia, individuals who reside close to sea level (lowlanders) present greater fatigue and impaired physical performance, compared to normoxia (Katayama et al. 2010; Jubeau et al. 2017; Ruggiero et al. 2018). With continued exposure to high altitude (i.e. acclimatisation), the human body undergoes systemic changes (West, 2012), which result in partial or complete recovery of both fatigability and performance to normoxic levels (Kayser et al. 1994; Amann et al. 2013; Goodall et al. 2014; Ruggiero et al. 2018). Adaptation to altitude‐related hypoxia is a subject of great debate (Dempsey & Morgan, 2015), and with reference to peripheral fatigability (i.e. at or distal to the neuromuscular junction), the mechanisms are poorly understood (Perrey & Rupp, 2009).
Although lowlanders show marked adaptations with short‐ or medium‐term exposure to hypoxia (0–14 days and 14–42 days, as defined by Horscroft & Murray 2014), Sherpa are the descendants of people who have inhabited the Tibetan Plateau for >21,000 years (Zhao et al. 2009). Consequently, Sherpa possess unique genotypic and phenotypic characteristics (Ge et al. 2015; Simonson, 2015; Horscroft et al. 2017; Murray et al. 2018) that lead to remarkable physical performance at high altitude (Gilbert‐Kawaii et al. 2014). At the level of the muscle, Sherpa present numerous physiological differences compared to acclimatised lowlanders. These include reduced muscle fibre cross‐sectional area and mitochondrial density (Kayser et al. 1991), decreased mitochondrial oxidative capacity but increased coupling efficiency (Horscroft & Murray, 2014; Horscroft et al. 2017), and greater protection against oxidative stress (Horscroft et al. 2017). The latter two physiological characteristics would lead to smaller metabolic changes in the muscle and enhanced resistance to cellular mechanisms of skeletal muscle fatigue, especially in a hypoxic environment. However, to date there are no data to compare muscle performance and peripheral fatigability at altitude in Sherpa and lowlanders.
In a study designed to assess supraspinal fatigue and neural excitability during a voluntary sustained isometric elbow flexor task, we found recently that the fatigue‐induced decrease in peripheral excitability (maximal compound muscle action potential) observed in lowlanders was absent in Sherpa (Ruggiero & McNeil, 2018). We attributed the finding to a superior ability of the muscles of Sherpa to keep pace with the contraction‐induced efflux of potassium ions. Although the measure reflected a peripheral‐level difference between groups with fatiguing activity, the central nervous system unavoidably influences muscle fibres during volitional tasks. To best assess muscle‐level responses to repetitive activity (i.e. peripheral fatigue), the fatiguing task itself should have no influence from the central nervous system. In humans, the most effective way to minimise a role of the central nervous system is to apply external stimulation to a peripheral nerve or muscle belly to induce muscle contraction (Maffiuletti, 2010).
Hence, the purpose of the present experiment was to use electrically‐evoked contractions to study peripheral fatigue in acclimatised age‐matched lowlanders and Sherpa at an altitude of 5050 m. Contractile properties related to knee extensor force as well as measures of muscle oxygenation and blood flow were monitored during and after application of intermittent muscle belly stimulation to the quadriceps of the dominant leg. In light of the muscle phenotypic characteristics typically exhibited by Sherpa, we hypothesised that this group, compared to lowlanders, would exhibit lower impairment of muscle contractile capabilities and faster recovery from fatigue at high altitude.
Methods
Ethical approval
This study was part of a research expedition to the Ev‐K2‐CNR Pyramid Laboratory (5050 m, Nepal) which took place from October to November 2016. All testing procedures were approved by the Clinical Research Ethical Review Board of the University of British Columbia (Application ID: H16‐01028), and conformed to the standards set by the Declaration of Helsinki, except for registration in a database.
Participants
Twelve lowlanders (mean ± SD; height: 1.77 ± 0.06 m; body mass: 77 ± 9 kg) and 10 Sherpa (height: 1.67 ± 0.08 m; body mass: 66 ± 15 kg) took part in the study. The groups were age‐matched (lowlanders, age: 32 ± 10 years; Sherpa, age: 31 ± 11 years). All Sherpa were born, and habitually residing, in the Khumbu valley (>3440 m). The time spent at elevation in their lifetime ranged between 12 and 59 years. All participants were members of the research expedition, and provided informed written consent. Two lowlanders and nine Sherpa also took part in our recent investigation of central fatigue in the two groups (Ruggiero & McNeil, 2018); however, only the baseline pulse oximeter data of arterial saturation (S pO2) and heart rate (HR) overlap between studies. Haematological variables reported in this study were obtained from the UBC‐Nepal Expedition database.
Study design
All experimental procedures were conducted at an altitude of 5050 m above sea level at the Ev‐K2‐CNR Pyramid Laboratory (Nepal, barometric pressure = 413 ± 4 mmHg, P IO2 = 76 ± 1 mmHg), within 3–9 days of arrival. Participants (including Sherpa) met in Kathmandu, where they sojourned 3–7 days, then flew to Lukla (2860 m) and trekked over 9 days to the Ev‐K2‐CNR Pyramid Laboratory, with two rest days in both Namche Bazaar (3440 m) and Pheriche (4240 m). Notably, this ascent profile was identical for both lowlanders and Sherpa. No participants used medications to prevent or treat acute mountain sickness (e.g. acetazolamide).
Experimental set‐up
Participants were seated in a custom‐built isometric dynamometer, with their dominant lower limb secured to a linear strain gauge with a strap just above the lateral malleolus, and a 90° angle of flexion at the knee joint. To minimise movement during contractions, a seatbelt was fastened tightly over the hips. The force produced during voluntary and electrically‐evoked isometric knee extensions was measured by the strain gauge (SBO‐300; Transducer Techniques, Temecula, CA, USA), amplified (×100) (Neurolog System NL109 module; Digitimer, Welwyn Garden City, UK), sampled at 1000 Hz using a 16‐bit A/D converter (CED 1401–3; Cambridge Electronic Design, Cambridge, UK), and recorded using Spike2 software (version 7.10; Cambridge Electronic Design). The force was continuously displayed on a computer monitor to provide feedback to the participant during the experiment.
Haematological variables
On the second day of sojourn at 5050 m, arterial blood samples from the radial artery were drawn into pre‐heparinised syringes and analysed immediately using an arterial blood‐gas analysis system (ABL‐90, Radiometer, Copenhagen, Denmark) to obtain haemoglobin (Hb), haematocrit (Hct), and partial pressure of arterial O2 and CO2 (P aO2 and P aCO2, respectively). For technical reasons, Hb, Hct, P aO2 and P aCO2 data could not be obtained for two lowlanders and one Sherpa.
Arterial saturation
S pO2 and HR were sampled using a pulse oximeter (MD300K1, Beijing Choice Electronic Technology, Beijing, China) placed on the middle finger of the left hand. During pilot testing conducted before the expedition (in both normoxic and normobaric hypoxic conditions), it was observed that there was no change in S pO2 or HR across the experiment. Hence, only baseline measures were recorded for this study.
Near‐infrared spectroscopy
A tissue oximeter (OxiplexTS, ISS, Champaign, IL, USA) was used to record muscle near‐infrared spectroscopy (mNIRS) signals. An elastic strap held the mNIRS probe over the rectus femoris muscle, midway between the anterior superior iliac spine and the superior border of the patella. The OxiplexTS rigid probe has four pairs of near infrared light sources (four emitting at 690 nm and four emitting at 830 nm), located at different distances (2.0, 2.5, 3.0 and 3.5 cm) from the detector, providing the time course of the absolute concentrations (expressed in micromolar) of oxygenated haemoglobin (O2Hb), deoxygenated haemoglobin (HHb), and total haemoglobin (tHb = O2Hb + HHb). Changes in tHb can be interpreted as representing blood volume changes in the field of view of the probe (Millet et al. 2012). The tissue oxygenation index (expressed as a percentage; TOI = O2Hb/tHb) was also calculated, and represents the dynamic balance between O2 supply and O2 consumption in tissue capillaries, arterioles and venules (Ferrari et al. 2004). The mNIRS signals were sampled at 2 Hz using the OxiplexTS proprietary software. Recordings were initiated 1 min before baseline testing and continued until the end of the protocol.
Blood flow measurement
Superficial femoral artery blood flow was measured using a high‐resolution ultrasound machine (Terason 3200, Teratech, Burlington, MA, USA). A 10 MHz linear array probe was used to image the superficial femoral artery in the sagittal plane. The angle of insonation for the acquisition of velocity was 60°. Screen capture of the ultrasound was saved as an audio–video interleave file (Camtasia Studio, TechSmith Corp., Okemos, MI, USA) for future analysis.
Muscle belly stimulation
Electrically‐evoked contractions were elicited by means of two stimulating electrodes applied transversely over the muscle bellies of the quadriceps muscle of the dominant thigh, at one‐third of the distance between the anterior superior iliac spine and the superior border of the patella (cathode), and 5 cm above the superior border of the patella (anode). The electrodes consisted of aluminium foil wrapped in a thin conductive gel‐soaked cloth and were 7.5 cm high × ∼12–16 cm wide, depending on the size of the thigh (Allman & Rice, 2004). Square‐wave electrical stimuli (200 μs pulse width; 100–400 V) were delivered by a computer‐triggered stimulator (DS7AH, Digitimer). The stimulator intensity was set at a current to evoke 30% of the maximal voluntary contraction (MVC) force with a train of 12 pulses at 15 Hz (lowlanders: 20–70 mA; Sherpa: 11–45 mA). An elastic bandage wrapped around the thigh prevented movement of the electrodes or mNIRS probe.
Experimental procedures
Participants performed three brief (∼3 s) MVCs with strong verbal encouragement and visual feedback, to establish peak knee extension force. Each MVC was separated by at least 90 s of rest. Additional contractions were performed if maximal force increased by ≥5% with successive MVCs. Peak force was used to set a target on the computer monitor at 30% MVC force. The stimulator intensity was raised incrementally (5 mA steps) until the tetanus evoked by a train of 12 pulses at 15 Hz achieved the target force. After a few minutes of rest (used to obtain the optimal image of the superficial femoral artery), baseline superficial femoral artery diameter and blood velocity were recorded for 1 min before the fatiguing protocol started. The fatiguing protocol included three bouts of 75 trains of stimuli. Each train consisted of 12 pulses at 15 Hz, with 1.6 s separating the first pulse of successive trains. Each bout was separated by 15 s of rest. Recovery measures were performed at minutes 1, 2 and 3 after the end of the fatiguing protocol (R1, R2 and R3, respectively). At each time point, a train of 12 pulses at 15 Hz was delivered. Superficial femoral artery blood flow was recorded continuously during and after the protocol. However, due to movement of the artery caused by the evoked contractions and stimulation artifacts, blood flow measurements during the fatiguing protocol could be collected only in the 15 s separating each bout of contractions.
Data analysis and statistics
All mNIRS data were analysed off‐line using custom MATLAB scripts (The MathWorks, Natick, MA, USA). O2Hb, HHb, tHb and TOI were averaged over 15 s time windows at nine points: just before the start and in the middle of the first, second and third bout of stimuli, and just before the delivery of the train at R1, R2 and R3. To represent the oxygen saturation kinetics at the beginning and at the end of the fatiguing protocol, the half‐times of desaturation (during the first bout) and resaturation (after the third bout) were calculated, using a 2 s moving average window of TOI. Due to technical problems, we had to discard mNIRS data from one lowlander and one Sherpa.
Off‐line analysis of force data was conducted with Signal software (v. 5.08; Cambridge Electronic Design). Data were first digitally filtered (50 Hz notch filter). For each tetanus, peak force, peak rate of force development and relaxation (pRFD and pRFR, respectively), and half‐relaxation time (HRT) were calculated. pRFD and pRFR are calculated over a 6 ms interval (3 ms on either side of the steepest instantaneous slope). The contractile impulse of each tetanus was calculated as the area under the whole force–time curve (CI) or just the first 200 ms (CI200). For measurements during the fatiguing protocol, the aforementioned variables were averaged within the first, middle and last five tetani of each bout. During the recovery period, the variables were obtained from the individual tetani evoked at R1, R2 and R3. The variables calculated as the average across the first five tetani of the first bout were considered as baseline measures.
At the beginning of the first bout, a transient potentiation of peak force in Sherpa and pRFD in both Sherpa and lowlanders was noted. For each participant, the tetanus number with the greatest peak force (lowlanders: 1 ± 0; Sherpa: 9 ± 8) and pRFD (lowlanders: 11 ± 3; Sherpa: 12 ± 4) was separately determined. Thereafter, potentiated peak force and pRFD were calculated as the average value of the interval including the tetanus reporting the maximum value and the respective two tetani on either side. The potentiation was then expressed as a percentage of the average peak force and pRFD of the first five tetani of the first bout. If the greatest peak force or pRFD occurred for the first or second tetanus, no potentiation was considered.
For determination of superficial femoral artery mean blood flow, audio‐video interleave files collected during the experimental sessions were analysed using edge‐detection software (FMD/BloodFlow Software Version 5.1, Reed C, Perth, Australia) (Woodman et al. 2001). A region of interest was placed around the highest quality portion of the B‐mode longitudinal image of the artery and a second region of interest surrounded the Doppler strip to record blood velocity. The software automatically and continuously tracked the walls of the vessel and peak envelope velocity trace within the regions of interest at a frequency of 30 Hz (Woodman et al. 2001). Mean superficial femoral artery blood flow (ml min−1; calculated as peak envelope blood velocity [cm s−1] × 60 s/2) × (π(0.5 × diameter [cm])2) (Evans 1985) during the protocol was determined as the average across 1 min before the start of the fatiguing protocol (baseline), the 15 s of rest between each bout, and each 1 min window during recovery.
Using haematological variables and S pO2 at rest, arterial O2 content at baseline (C aO2, ml dL−1) was estimated using the equation (1.36 × S pO2/100 × [Hb]) + (P aO2 × 0.003). Of note, [Hb] and P aO2 were obtained on the second day of sojourn at 5050 m, whereas S pO2 was obtained at the beginning of the measurement session from pulse oximetry. To provide further insight into the role of oxygen delivery we have estimated delivery of oxygen (eDO2, ml min−1) as C aO2 × superficial femoral artery mean blood flow.
Statistical analysis was conducted using SPSS Statistics version 23 (IBM Corp., Armonk, NY, USA). Normality of data was examined using skewness, kurtosis and the Shapiro–Wilk test. An independent samples Student's t test, or the Mann–Whitney U test when conditions of normality were not met, was used to compare between lowlanders and Sherpa baseline absolute values of S pO2, HR, Hb, Hct, P aO2, P aCO2, C aO2, TOI, superficial femoral artery mean blood flow, eDO2, MVC force and variables resulting from the electrically‐induced contractions at baseline. The same tests were also used to compare the half‐time of desaturation and resaturation, and the potentiation of peak force and pRFD at the start of the fatiguing protocol between groups.
Data collected during the fatiguing protocol and recovery were expressed as a percentage of baseline. Separately for both fatigue and recovery, variables were compared using two‐way repeated measures ANOVA, with group as a between‐subjects factor and time as a within‐subjects factor. If only a main effect for time was found, data were pooled for the two groups and a paired‐samples t test in conjunction with a Dunnett's table was used to determine which time points were different from baseline. If the two‐way repeated measures ANOVA reported a significant main effect for group or time × group interaction, one‐way repeated measures ANOVAs were run separately for each group to assess the effect of time. If significant, paired‐samples t‐tests and a Dunnett's table were used to determine which time points were different from baseline. For those two‐way repeated measures ANOVAs which had a main effect of group, data were compared between lowlanders and Sherpa at each time point using the Tukey–Kramer test. All data are reported as mean ± SD in the text, and as mean ± SEM in the figures. The significance level was P < 0.05.
Results
Baseline measures
Baseline cardiovascular measures as well as MVC force for lowlanders and Sherpa are reported in Table 1. No differences between groups were reported for S pO2 (P = 0.19), HR (P = 0.07), Hb (P = 0.55), Hct (P = 0.92), P aO2 (P = 0.11) and C aO2 (P = 0.41); however, P aCO2 was lower in lowlanders than Sherpa (3 mmHg; t(17) = −2.9, P < 0.05). Muscle TOI was greater in lowlanders than Sherpa (6 %; t(18) = 2.8, P < 0.05), while superficial femoral artery mean blood flow and eDO2 were not different between groups (P = 0.15 and 0.13, respectively). The MVC force was greater in lowlanders than Sherpa (14 kg; t(20) = 2.9, P < 0.05).
Table 1.
Baseline cardiovascular variables and maximal voluntary contraction force in lowlanders and Sherpa
| Lowlanders | Sherpa | |
|---|---|---|
| S pO2 (%) | 85.8 ± 3.8 | 83.7 ± 3.2 |
| HR (bpm) | 68.6 ± 12.1 | 81.7 ± 18.3 |
| Hb (g dL−1) | 14.5 ± 0.6 | 14.7 ± 0.6 |
| Hct (%) | 43.3 ± 1.9 | 43.2 ± 1.7 |
| P aO2 (mmHg) | 42.9 ± 4.1 | 39.9 ± 3.8 |
| P aCO2 (mmHg) | 29.2 ± 1.9 | 32.1 ± 2.5* |
| C aO2 (ml dL−1) | 17.3 ± 1.0 | 16.9 ± 1.1 |
| TOI (%) | 66.5 ± 4.3 | 60.5 ± 3.8* |
| SFA mean blood flow (ml min−1) | 50.2 ± 26.3 | 35.0 ± 19.8 |
| eDO2 (ml min−1) | 8.1 ± 4.5 | 5.2 ± 2.6 |
| MVC force (kg) | 58.2 ± 8.1 | 44.3 ± 14.1* |
Values are means ± SD. * P < 0.05 different between lowlanders and Sherpa. C aO2, arterial oxygen content; eDO2, estimated delivery of oxygen; Hb, haemoglobin; Hct, haematocrit; HR, heart rate; MVC, maximal voluntary contraction; P aCO2, partial pressure of arterial carbon dioxide; P aO2, partial pressure of arterial oxygen; SFA, superficial femoral artery; S pO2, arterial saturation; TOI, muscle tissue oxygenation index.
Baseline contractile parameters obtained from the electrically‐induced contractions are reported in Table 2. For the first five contractions of the first bout, as intended, the peak force was targeted at 30% of the MVC force, and not different between groups (P = 0.27). As a consequence, the absolute value of the peak force was lower in Sherpa than in lowlanders (3 kg; t(20) = 2.4, P < 0.05). For the same contractions, pRFD, pRFR, CI and CI200 were lower, while HRT was longer, in Sherpa than in lowlanders (t(20) > 1.9, P < 0.05).
Table 2.
Baseline contractile parameters in lowlanders and Sherpa
| Lowlanders | Sherpa | |
|---|---|---|
| Peak force (kg) | 16.0 ± 2.4 | 12.8 ± 4.0* |
| Peak force (% MVC force) | 28.8 ± 3.1 | 30.3 ± 3.0 |
| pRFD (kg s−1) | 161.6 ± 41.0 | 122.9 ± 54.4* |
| pRFR (kg s−1) | −160.7 ± 30.7 | −122.3 ± 45.7* |
| HRT (ms) | 87.1 ± 9.4 | 95.9 ± 8.7* |
| CI (kg s) | 11.5 ± 1.7 | 9.3 ± 2.9* |
| CI200 (kg s) | 1.3 ± 0.2 | 1.0 ± 0.3* |
Values are means ± SD. * P < 0.05 different between lowlanders and Sherpa. CI, contractile impulse of the entire tetanus; CI200, contractile impulse of the first 200 ms of the tetanus; HRT, half‐relaxation time; MVC, maximal voluntary contraction; pRFD, peak rate of force development; pRFR, peak rate of force relaxation.
Fatigue and recovery measures
Force responses
The potentiation of peak force during the initial part of the first bout was higher in Sherpa than in lowlanders (5.2 ± 5.9 % vs. 0 %; t(20) = 3.1, P < 0.05), with no differences between groups in the potentiation of pRFD (29.4 ± 22.8 % vs. 18.4 ± 14.8 %; P = 0.19). For peak force of the electrically‐induced tetani (Fig. 1 A), there was a main effect of time (F 3.3,65.0 = 189.5, P < 0.05) and group (F 1,20 = 4.5, P < 0.05) during the fatiguing protocol, while only a main effect of time was found during recovery (F 1.2,24.1 = 32.7, P < 0.05). While peak force was significantly decreased at all time points in lowlanders during the fatiguing protocol (P < 0.05), in Sherpa, a decrease was evident only from the end of the first bout (P < 0.05). In addition, the decline from baseline was 8.5% more for lowlanders than Sherpa at the end of the first bout (P < 0.05). During recovery, with no between‐group differences, post hoc testing on pooled data revealed that peak force remained lower than baseline at every time point (P < 0.05).
Figure 1. Contractile parameters of the 15 Hz tetani during the fatiguing protocol and recovery.

Mean values (± SEM) in lowlanders (circles, continuous line) and Sherpa (inverted triangles, dashed line). All values are expressed as percentage of baseline (mean value of the first 5 tetani of the fatiguing protocol). Open symbols represent data points significantly different from baseline. A, peak force was significantly decreased at all time points in lowlanders during the fatiguing protocol, while in Sherpa a decrease was evident only from the end of the first bout (P < 0.05). In addition, the decline from baseline was greater in lowlanders than Sherpa at the end of the first bout (* P < 0.05). During recovery, post hoc testing on pooled data showed a decrease in peak force throughout (P < 0.05). B, peak rate of force development (pRFD) was significantly slower in both groups (post hoc testing on pooled data) during the fatiguing protocol (P < 0.05). After the fatiguing protocol, pRFD remained depressed in lowlanders (P < 0.05) but recovered by 1 min in Sherpa. As a result, pRFD was faster in Sherpa than in lowlanders throughout recovery (* P < 0.05). C, peak rate of force relaxation (pRFR) was significantly slower in both groups (post hoc testing on pooled data) during both the fatiguing protocol and recovery (P < 0.05). D, half‐relaxation time (HRT) was slowed in both groups (post hoc testing on pooled data) at all time points during the fatiguing protocol (P < 0.05). Throughout recovery, HRT remained increased in both groups (P < 0.05) and was slower in lowlanders than in Sherpa (* P < 0.05).
Absolute pRFD and pRFR are depicted in Fig. 1 B and C, respectively. Across the fatiguing protocol, each two‐way repeated measures ANOVA reported only a main effect of time (pRFD: F 8,160 = 95.3, P < 0.05; pRFR: F 2.9,57.9 = 105.9, P < 0.05), and both pRFD and pRFR were slower at all time points (P < 0.05). During recovery, for pRFD there was a main effect of time (F 1.7,34.5 = 22.6, P < 0.05), group (F 1,20 = 7.0, P < 0.05), and a time × group interaction (F 1.7,34.5 = 5.3, P < 0.05). At all time points, pRFD was slower than control in lowlanders (P < 0.05) but equivalent to control in Sherpa; consequently, throughout recovery, pRFD was faster in Sherpa than in lowlanders (P < 0.05). For pRFR, only a main effect of time was found (F 1.4,26.9 = 62.1, P < 0.05); post hoc testing on pooled data revealed values slower than baseline throughout recovery (P < 0.05).
A slowing of the HRT occurred in both groups during the fatiguing protocol and failed to recover within 3 min (Fig. 1 D). The two‐way repeated measures ANOVA yielded a main effect of time during the fatiguing protocol (F 2.5,47.6 = 79.2, P < 0.05), and post hoc testing on pooled data revealed significantly slower HRT at all time points (P < 0.05). During recovery, main effects for time (F 2.1,41.9 = 44.1, P < 0.05) and group (F 1,20 = 5.5, P < 0.05) as well as an interaction (F 2.1,41.9 = 3.7, P < 0.05) were found. The relaxation remained slowed in both groups at all recovery time points (P < 0.05), with HRT values being higher in lowlanders than in Sherpa (P < 0.05).
The CI and CI200 are depicted in Fig. 2. During the fatiguing protocol, for both measures, only a main effect of time was reported (CI: F 3.5,70.0 = 159.4, P < 0.05; CI200: F 2.6,51.8 = 134.7, P < 0.05), and post hoc testing on pooled data indicated that both measures were decreased from baseline at all time points (P < 0.05). During recovery, for CI (Fig. 2 A) there was only a main effect of time (F 1.3,25.7 = 56.6, P < 0.05), and pooled data were still lower than baseline at each time point (P < 0.05). Differently, for CI200 (Fig. 2 B), there were main effects of time (F 1.4,28.8 = 31.8, P < 0.05) and group (F 1,20 = 5.6, P < 0.05), and a time × group interaction (F 1.4,28.8 = 4.5, P < 0.05). Specifically, CI200 was still decreased throughout recovery in lowlanders (P < 0.05), but only on the third minute of recovery in Sherpa (P < 0.05). When compared between groups, the recovery in CI200 was greater in Sherpa than in lowlanders (P < 0.05).
Figure 2. Contractile impulse of the 15 Hz tetani during the fatiguing protocol and recovery.
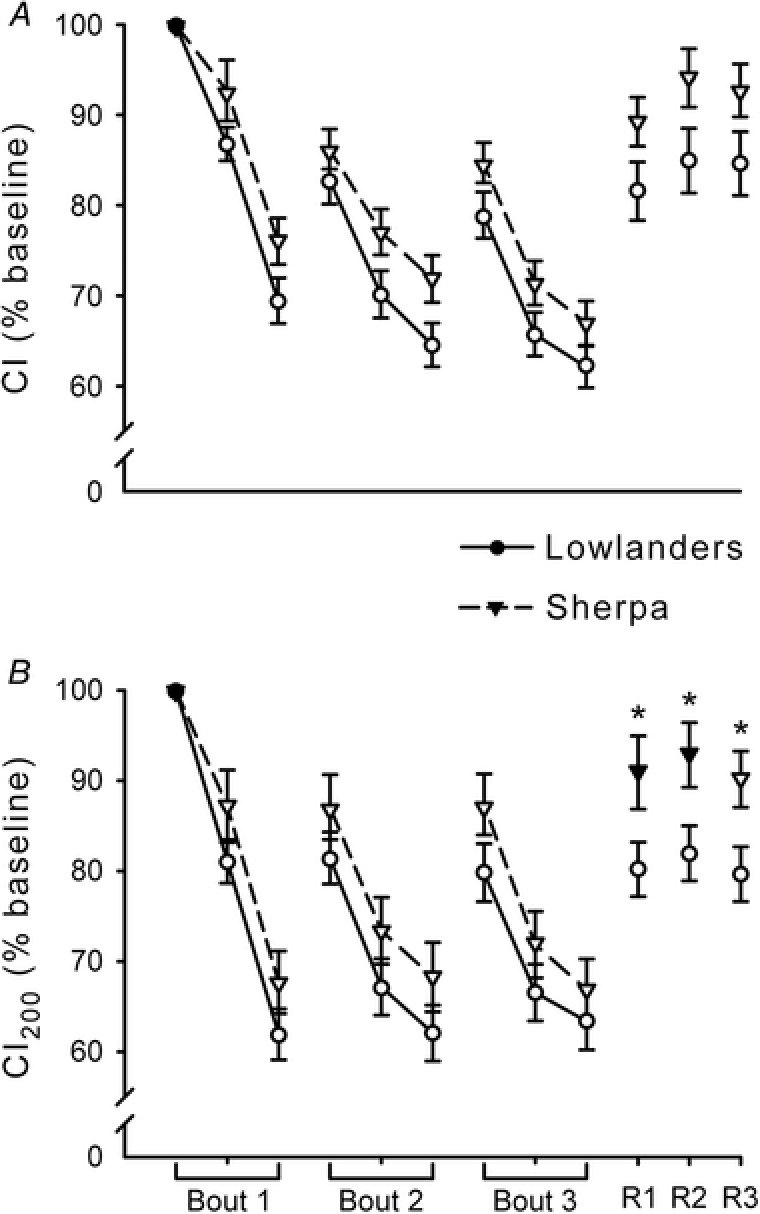
Mean values (± SEM) in lowlanders (circles, continuous line) and Sherpa (inverted triangles, dashed line). All values are expressed as percentage of baseline (mean value of the first 5 tetani of the fatiguing protocol). Open symbols represent data points significantly lower than baseline. A, contractile impulse (CI), calculated as the area under the whole force–time curve of the tetani, was lower than baseline in both groups (post hoc testing on pooled data) during both the fatiguing protocol and recovery (P < 0.05). B, contractile impulse of the first 200 ms of the tetani (CI200) was decreased from baseline in both groups (post hoc testing on pooled data) during the fatiguing protocol (P < 0.05). During recovery, CI200 was still decreased in lowlanders at all time points (P < 0.05) but only at 3 min in Sherpa (P < 0.05). When compared between groups, the recovery of CI200 was greater in Sherpa than in lowlanders (* P < 0.05).
Muscle tissue oxygenation parameters
At the start of the first bout of the fatiguing protocol, no differences were found in the half‐time of desaturation between groups (lowlanders: 11.2 ± 2.5 s; Sherpa: 11.4 ± 2.0 s; P = 0.84). Likewise, the half‐times of resaturation after the end of the fatiguing protocol were not different between groups (lowlanders: 12.5 ± 2.8 s; Sherpa: 13.4 ± 3.5 s; P = 0.59).
Values of TOI, tHb, O2Hb and HHb, normalised to baseline, are represented in Fig. 3. For all measures, for both the fatiguing protocol and recovery, the two‐way repeated measures ANOVAs reported only main effects of time (F > 16.6, P < 0.05) so post hoc testing was conducted on pooled data. TOI (Fig. 3 A) was significantly decreased at all time points of the fatiguing protocol except the start of the third bout (P < 0.05), and greater than baseline throughout recovery (P < 0.05). tHb (Fig. 3 B) was increased at all time points during both fatigue and recovery (P < 0.05). O2Hb (Fig. 3 C) showed a decrease during the first bout (P < 0.05), whereas at the start of the second and third bout as well as during recovery it was increased compared to baseline (P < 0.05). HHb (Fig. 3 D) showed a significant increase throughout the fatiguing protocol (P < 0.05), whereas it was decreased compared to baseline at any time point during recovery (P < 0.05).
Figure 3. Muscle near‐infrared spectroscopy parameters across the fatiguing protocol and recovery.
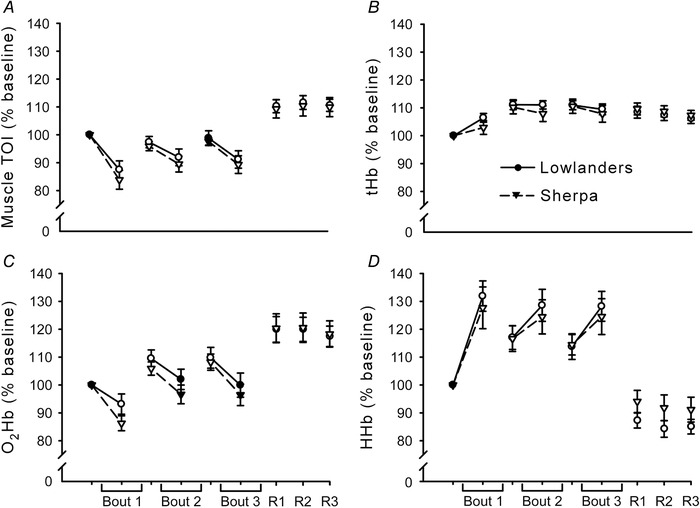
Mean values (±SEM) in lowlanders (circles, continuous line) and Sherpa (inverted triangles, dashed line). All variables were calculated over 15 s time windows at 9 points: just before the start and in the middle of the first, second and third bout of stimuli, and just before the trains delivered at R1, R2 and R3. All values are expressed as percentage of baseline, which is represented by variables calculated just before the beginning of the first bout. For all measures, data were pooled for the two groups because the two‐way repeated measures ANOVAs reported only main effects of time. Open symbols represent data points significantly different from baseline. A, muscle tissue oxygenation index (TOI) was significantly decreased at all time points during the fatiguing protocol except the start of the third bout (P < 0.05), and greater than baseline throughout recovery (P < 0.05). B, total haemoglobin (tHb) was increased at all time points during both fatigue and recovery (P < 0.05). C, oxygenated haemoglobin (O2Hb) showed a decrease during the first bout (P < 0.05), whereas at the start of the second and third bout as well as during recovery it was increased compared to baseline (P < 0.05). D, deoxygenated haemoglobin (HHb) showed a significant increase throughout the fatiguing protocol (P < 0.05), whereas it was decreased from baseline at any time point during recovery (P < 0.05).
Blood flow and estimated delivery of oxygen
Superficial femoral artery mean blood flow and eDO2, as both absolute values and normalised to baseline, are depicted in Fig. 4. For all measures, the two‐way repeated measures ANOVA resulted in main effects of time only (F > 59.1, P < 0.05). When data were pooled, all variables were significantly greater than baseline throughout the fatiguing and recovery periods (P < 0.05).
Figure 4. Superficial femoral artery mean blood flow and estimated delivery of oxygen during the fatiguing protocol and across recovery.
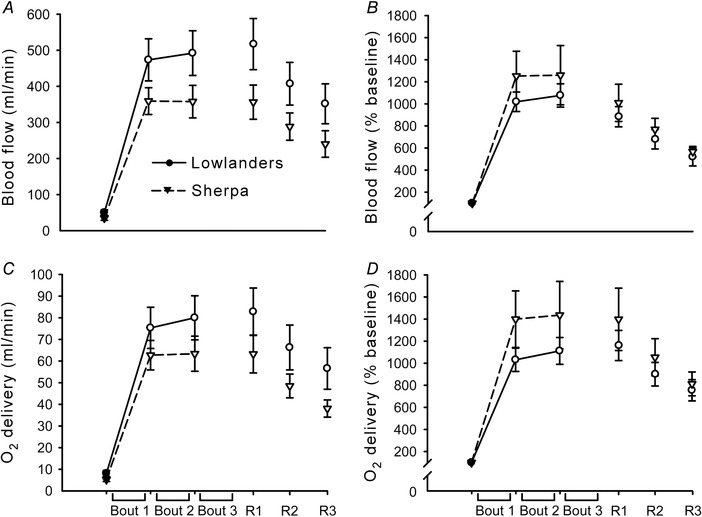
Mean values (± SEM) in lowlanders (circles, continuous line) and Sherpa (inverted triangles, dashed line). A and B, absolute (A) and normalised (B) values of superficial femoral artery mean blood flow during the protocol, determined as the average across 1 min before the start of the fatiguing protocol (baseline), the 15 s of rest between each bout, and each 1 min window during recovery. C and D, absolute (C) and normalised (D) values of superficial femoral artery estimated delivery of oxygen. Open symbols represent data points significantly greater than baseline. For all measures, data were pooled for the two groups because the two‐way repeated measures ANOVAs resulted in main effects of time only. All variables were significantly greater than baseline throughout the fatiguing and recovery periods (P < 0.05).
Discussion
The aim of the current investigation was to examine differences between lowlanders and Sherpa in muscle fatigue, with negligible influence of central factors related to muscle activation. Our research led to four principal findings: (1) the decline of peak force of the electrically‐evoked tetani was more marked in lowlanders than in Sherpa at the beginning of the protocol; (2) after the fatiguing protocol, the rate of force development and contractile impulse recovered earlier in Sherpa than in lowlanders; (3) after the fatiguing protocol, half‐relaxation time recovered to a greater extent in Sherpa than in lowlanders; (4) all of these differences occurred despite equivalent alterations of muscle oxygenation and estimated delivery of oxygen in both groups. The higher preservation of muscle performance in Sherpa compared to lowlanders at high altitude occurs independently of bulk muscle oxygen delivery and so is likely due to muscle metabolic adaptations in Sherpa.
Baseline variables
Prior to the fatiguing protocol, measures of S pO2, HR, Hb, Hct, C aO2 and superficial femoral artery mean blood flow were not different between lowlanders and Sherpa. This is in accordance with previous reports comparing lowlanders and Sherpa at an altitude, time at altitude and ascent profile similar to ours (Lewis et al. 2014; Stembridge et al. 2014; Gilbert‐Kawai et al. 2017; Horscroft et al. 2017). The higher P aCO2 in the Sherpa is consistent with the notion of a blunted hypoxic ventilatory response in this population (Lahiri et al. 1969; Samaja et al. 1997). Muscular TOI was lower in Sherpa than in lowlanders. This may be due to the combination of (not statistically significant) lower P aO2, C aO2 and superficial femoral artery mean blood flow in Sherpa. Moreover, the calculation of TOI in absolute terms is affected by a number of factors in addition to the concentration of O2Hb and tHb, particularly skin pigmentation, with darker pigmented skin augmenting signal loss from the NIRS probe (Wassenaar & Van den Brand, 2005).
Maximal force of the knee extensors was lower in Sherpa than in lowlanders. We presume much of the difference is due to the smaller body mass of the Sherpa (independent sample t test: t(20) = 2.1, P < 0.05); however, we did not assess voluntary activation so it is possible that a lower central drive in Sherpa (Ruggiero & McNeil, 2018) contributed to the lower MVC force. Importantly, if voluntary activation was modestly lower in Sherpa than in lowlanders, it would have had a minimal impact on the targeted absolute force (30% MVC) for the submaximal fatiguing protocol (Ruggiero & McNeil, 2018). All of peak force, pRFD and pRFR of the 15 Hz tetani were significantly lower in Sherpa than in lowlanders. When normalised to peak force of the tetanus, pRFD and pRFR were not different between groups (data not shown), which suggests that the slower absolute rates relate to the lower absolute peak force of the electrically‐induced tetani. The combination of lower absolute peak force and pRFD in Sherpa than in lowlanders was mirrored by CI and CI200, which showed smaller values in Sherpa. Interestingly, HRT was longer in Sherpa than in lowlanders. A slower HRT may be related either to fibre type distribution or to slower Ca2+ handling. There is not definitive evidence of greater type I fibre distribution in Sherpa than in lowlanders nor any data related to Ca2+ handling in Sherpa. Regarding type I fibre distribution, the only data come from second‐generation Tibetans born at 1300 m (Kayser et al. 1996), and those values were similar to lowland Nepalese (Kayser et al. 1996) and within the range of Caucasian lowlanders (Lexell et al. 1986). With respect to Ca2+ handling, after a 21‐day expedition to 6194 m, lowlanders had reduced Ca2+ uptake from the sarcoplasmic reticulum in vastus lateralis (Green et al. 2000). It is unknown whether this adaptation would exist or be exacerbated in Sherpa due to their long‐term altitude adaptations.
Fatigue and recovery measures
Muscle tissue oxygenation and blood flow
The mNIRS‐related variables, superficial femoral artery mean blood flow and eDO2 responded similarly in both groups during the fatiguing protocol and recovery. This indicates that delivery and kinetics of oxygen as well as the balance between oxygen delivery and utilization were not different between groups. During the bouts of contractions, TOI was lower than baseline, due to decreased O2Hb but increased tHb. The elevated tHb throughout the fatiguing protocol (driven by an increase of HHb) suggests increased blood volume beneath the mNIRS probe. Inter‐bout measures of superficial femoral artery mean blood flow and eDO2 mirrored tHb, indicating an increase in blood flow to increase delivery of oxygen to the muscle. With respect to the calculation of C aO2 and in turn eDO2, it is possible that [Hb] and P aO2 continued to increase in some participants between the second day at 5050 m (when those measurements were taken) and the testing day. This may have underestimated eDO2 at rest and during the fatiguing protocol. Importantly, any underestimation is likely to be similar in lowlanders and Sherpa because a study with an ascent profile similar to ours reported that the increase in [Hb] with increasing altitude was not different between groups (e.g. Gilbert‐Kawaii et al. 2017). This makes our measure of eDO2 comparable between groups. Overall, both eDO2 and mNIRS‐related variables suggest a similar balance of convective oxygen delivery and diffusion capacity between groups.
Peripheral fatigue‐related measures
Differences in force output between lowlanders and Sherpa were found early in the fatiguing protocol and during recovery. Importantly, as noted above, these differences between groups are likely not to be ascribed to dissimilar convective oxygen delivery or diffusion capacity. Instead, it would seem that the muscular metabolic adaptations for Sherpa (Allen et al. 1997; Hochachka et al. 2002; Horscroft et al. 2017; Murray et al. 2018) confer contractile advantages at high altitude.
At the end of the first bout, the decline of peak force of the electrically‐evoked tetani was more marked in lowlanders than in Sherpa. At the start of the bout, Sherpa displayed a potentiation of peak force that was absent in lowlanders. It is uncertain why potentiation would not occur in lowlanders but, with repeated activation, muscle force output results from a competing balance between potentiation and fatigue (Rassier & MacIntosh, 2000). Compared to lowlanders, Sherpa at altitude have greater energetic reserve (resting concentrations of ATP and PCr), coupling between ATP demand and supply, mitochondrial efficiency, and protection against oxidative stress (Allen et al. 1997; Hochachka et al. 2002; Horscroft et al. 2017; Murray et al. 2018). As an aside, the greater ATP supply–demand coupling compared to lowlanders is also evident in skeletal muscles of Quechua Andeans (Matheson et al. 1991). Quechua and Sherpa populations display numerous similar adaptations to hypoxia but, given that they last shared ancestors ∼30,000 years ago, they also possess different physiological characteristics (Hochachka et al. 1998). This extended period of separate evolution coupled with the disparity in length of time living at altitude (>21,000 years for Sherpa ancestors (Zhao et al. 2009) vs. ∼11,000 years for Andeans (Aldenderfer, 2003)) means that one should not automatically equate the physiology of the two populations. Nevertheless, data obtained from Sherpa (Allen et al. 1997; Hochachka et al. 2002; Horscroft et al. 2017; Murray et al. 2018) suggest that, in our study, the muscles of Sherpa compared to lowlanders likely had lower accumulation of inorganic phosphate and reactive oxidative species during the fatiguing protocol, and faster metabolite clearance in recovery. Inorganic phosphate is the most potent metabolite involved in skeletal muscle fatigue (Westerblad et al. 2002; Allen et al. 2008) so any reduction in concentration would be beneficial. In terms of oxidative stress, although the mechanisms are still poorly understood, there is clear evidence that endurance is impaired by reactive oxygen species during submaximal fatiguing contractions (Allen et al. 2008; Cheng et al. 2016). Thus, lower production of reactive oxidative species may promote lower peripheral fatigability. These muscle metabolic characteristics of Sherpa may have enabled potentiation and a slower decay of force during the first bout, and faster recovery of pRFD, CI200 and HRT.
Of note, the behaviour of pRFD and CI200 within and between groups after the fatiguing protocol paralleled each other, indicating that restoring pRFD is a determinant for the recovery of CI200, the latter variable being of most practical importance (among those analysed) for performance. The magnitude of the impulse over a certain period of time (in this case over the first 200 ms of the contraction) is directly proportional to the angular velocity of the knee joint, had the leg been allowed to move (Aagaard et al. 2002). Hence, recovery of CI200 favours recovery of the capacity to produce mechanical work and, in turn, to displace the centre of mass in whole‐body movements (Chapman, 2008). The faster recovery of CI200 in Sherpa compared to lowlanders may therefore confer an advantage during physical exertion at high altitude.
Conclusions
Our research showed that with muscle fatigue induced by intermittent electrically‐evoked contractions, the force‐generating capacity of the quadriceps of Sherpa was less impaired in the first part of the protocol and recovered faster after the fatiguing task. These differences in muscle capacity at high altitude seemed to occur independently of bulk muscle oxygen delivery. The greater resistance to fatigue in Sherpa people is presumably the result of muscular adaptations after millennia of life at high altitude (Horscroft et al. 2017; Murray et al. 2018). Functionally, the intrinsic resistance to muscle fatigue and faster recovery favours repeated force production at high altitude.
Additional information
Competing interests
There are no competing interests to declare.
Author contributions
Experiments were conducted at the Ev‐K2‐CNR Pyramid Laboratory in Nepal. L.R., R.L.H., P.N.A. and C.J.M. contributed to the conception and design of the experiments. All authors contributed to collection, analysis and interpretation of data. L.R. drafted the manuscript. All authors revised the manuscript critically for important intellectual content. All authors have read and approved the final version of this manuscript and agree to be accountable for all aspects of the work in ensuring that questions related to the accuracy or integrity of any part of the work are appropriately investigated and resolved. All persons designated as authors qualify for authorship, and all those who qualify for authorship are listed.
Funding
This work was supported by the Natural Sciences and Engineering Research Council of Canada (DG 435912‐2013) and the Canada Foundation for Innovation/British Columbia Knowledge Development Fund (32260).
Translational perspective.
Ascent to high altitude results in impaired performance and increased fatigue in lowlanders, owing to low partial pressure of inspired oxygen (P IO2). As descendants of people who have inhabited the Tibetan Plateau for >21,000 years, Sherpa present unique genotypic and phenotypic characteristics. This results in numerous differences between lowlanders and Sherpa in muscle physiology and ultrastructure. However, to date, there are no data on how these muscular characteristics of Sherpa may affect muscle performance and peripheral fatigability at altitude compared to lowlanders. At 5050 m (P IO2 = 76 mmHg), age‐matched lowlanders and Sherpa underwent three bouts of 75 intermittent electrically‐evoked unilateral contractions of the quadriceps muscles, initially targeting 30% of maximal force prior to the fatiguing protocol. The decline in performance was blunted in Sherpa during the first part of the task. In addition, the peak rate of force development and impulse (force–time integral) of the evoked contraction recovered faster in Sherpa than lowlanders. At any time during the protocol and recovery, indices of muscle oxygenation from near‐infrared spectroscopy (over the rectus femoris) as well as superficial femoral artery mean blood flow and estimated delivery of oxygen were not different between groups. The muscular characteristics of Sherpa, based on genetics and a lifetime above 3000 m, confer greater resistance to and recovery from isolated muscle fatigue at altitude, independent of muscle oxygen delivery. These outcomes are favourable for repeated force production and contribute to the outstanding physical performance of Sherpa during permanence at high altitude.
Acknowledgements
We are extremely grateful to ISS for the loan of the OxiplexTS tissue oximeter for the measurements conducted, and for personal communications regarding spatially resolved spectroscopy. We are also grateful to our participants and fellow travellers, for helping us to overcome the challenges of an expedition at high‐altitude.
Biography
Luca Ruggiero is completing his PhD in the Integrative Neuromuscular Physiology Laboratory at the Okanagan Campus of the University of British Columbia. His PhD research focuses on neuromuscular fatigue and motor control at high altitude as well as the neuromuscular advantages of Sherpa compared to lowlanders in such an environment. His main research interests include neuromuscular fatigue, environmental stress and biomechanics.

Edited by: Michael Hogan & Bruno Grassi
This is an Editor's Choice article from the 15 November 2018 issue.
References
- Aagaard P, Simonsen EB, Andersen JL, Magnusson P & Dyhre‐Poulsen P (2002). Increased rate of force development and neural drive of human skeletal muscle following resistance training. J Appl Physiol 93, 1318–1326. [DOI] [PubMed] [Google Scholar]
- Aldenderfer M (2003). Moving up in the world. American Scientist 91, 542–549. [Google Scholar]
- Allen DG, Lamb GD & Westerblad H (2008). Skeletal muscle fatigue: cellular mechanisms. Physiol Rev 88, 287–332. [DOI] [PubMed] [Google Scholar]
- Allen PS, Matheson GO, Zhu G, Gheorgiu D, Dunlop RS, Falconer T, Stanley C & Hochachka PW (1997). Simultaneous 31P MRS of the soleus and gastrocnemius in Sherpa during graded calf muscle exercise. Am J Physiol Regul Integr Comp Physiol 273, R999–R1007. [DOI] [PubMed] [Google Scholar]
- Allman BL & Rice CL (2004). An age‐related shift in the force‐frequency relationship affects quadriceps fatigability in old adults. J Appl Physiol 96, 1026–1032. [DOI] [PubMed] [Google Scholar]
- Amann M, Goodall S, Twomey R, Subudhi AW, Lovering AT & Roach RC (2013). AltitudeOmics: on the consequences of high‐altitude acclimatization for the development of fatigue during locomotor exercise in humans. J Appl Physiol 115, 634–642. [DOI] [PMC free article] [PubMed] [Google Scholar]
- Chapman A (2008). Biomechanical Analysis of Fundamental Human Movements. Human Kinetics, Champaign, IL, USA. [Google Scholar]
- Cheng AJ, Yamada T, Rassier DE, Andersson DC, Westerblad H & Lanner JT (2016). Reactive oxygen/nitrogen species and contractile function in skeletal muscle during fatigue and recovery. J Physiol 594, 5149–5160. [DOI] [PMC free article] [PubMed] [Google Scholar]
- Dempsey JA & Morgan BJ (2015). Humans in hypoxia: a conspiracy of maladaptation?! Physiology 30, 304–316. [DOI] [PMC free article] [PubMed] [Google Scholar]
- Evans DH (1985). On the measurement of the mean velocity of blood flow over the cardiac cycle using Doppler ultrasound. Ultrasound Med Biol 11, 735–741. [DOI] [PubMed] [Google Scholar]
- Ferrari M, Mottola L & Quaresima V (2004). Principles, techniques, and limitations of near infrared spectroscopy. Can J Appl Physiol 29, 463–487. [DOI] [PubMed] [Google Scholar]
- Ge RL, Simonson TS, Gordeuk V, Prchal JT & McClain DA (2015). Metabolic aspects of high‐altitude adaptation in Tibetans. Exp Physiol 100, 1247–1255. [DOI] [PMC free article] [PubMed] [Google Scholar]
- Gilbert‐Kawai E, Coppel J, Court J, van der Kaaij J, Vercueil A, Feelisch M, Levett D, Mythen M, Grocott MP, Martin D; Xtreme Everest 2 Research Group (2017). Sublingual microcirculatory blood flow and vessel density in Sherpa at high altitude. J Appl Physiol 122, 1011–1018. [DOI] [PMC free article] [PubMed] [Google Scholar]
- Gilbert‐Kawai ET, Milledge JS, Grocott MPW & Martin DS (2014). King of the Mountains: Tibetan and Sherpa physiological adaptations for life at high altitude. Physiology 29, 388–402. [DOI] [PubMed] [Google Scholar]
- Goodall S, Twomey R, Amann M, Ross EZ, Lovering AT, Romer LM, Subudhi AW & Roach RC (2014). AltitudeOmics: exercise‐induced supraspinal fatigue is attenuated in healthy humans after acclimatisation to high altitude. Acta Physiol 210, 875–888. [DOI] [PMC free article] [PubMed] [Google Scholar]
- Green H, Roy B, Grant S, Burnett M, Tupling R, Otto C, Pipe A & McKenzie D (2000). Downregulation in muscle Na+‐K+‐ATPase following a 21‐day expedition to 6,194 m. J Appl Physiol 88, 634–640. [DOI] [PubMed] [Google Scholar]
- Hochachka PW, Beatty CL, Burelle Y, Trump ME, McKenzie DC & Matheson GO (2002). The lactate paradox in human high‐altitude physiological performance. Physiology 17, 122–126. [DOI] [PubMed] [Google Scholar]
- Hochachka PW, Gunga HC & Kirsch K (1998). Our ancestral physiological phenotype: an adaptation for hypoxia tolerance and for endurance performance? Procl Natl Acad Sci U S A 95, 1915–1920. [DOI] [PMC free article] [PubMed] [Google Scholar]
- Horscroft JA, Kotwica AO, Laner V, West JA, Hennis PJ, Levet DZH, Howard DJ, Fernandez BO, Burgess SL, Ament Z, Gilbert‐Kawai ET, Vercueil A, Landis BD, Mitchell K, Mythen MG, Branco C, Johnson RS, Feelisch M, Montgomery HE, Griffin JL, Grocott MPW, Gnaiger E, Martin DS & Murray AJ (2017). Metabolic basis to Sherpa altitude adaptation. Pro Natl Acad Sci U S A 114, 6382–6387. [DOI] [PMC free article] [PubMed] [Google Scholar]
- Horscroft JA & Murray AJ (2014). Skeletal muscle energy metabolism in environmental hypoxia: climbing towards consensus. Extrem Physiol Med 3, 19. [DOI] [PMC free article] [PubMed] [Google Scholar]
- Jubeau M, Rupp T, Temesi J, Perrey S, Wuyam B, Millet GY & Verges S (2017). Neuromuscular fatigue during prolonged exercise in hypoxia. Med Sci Sports Exerc 49, 430–439. [DOI] [PubMed] [Google Scholar]
- Katayama K, Yoshitake Y, Watanabe K, Akima H & Ishida K (2010). Muscle deoxygenation during sustained and intermittent isometric exercise in hypoxia. Med Sci Sports Exerc 42, 1269–1278. [DOI] [PubMed] [Google Scholar]
- Kayser B, Hoppeler H, Claassen H & Cerretelli P (1991). Muscle structure and performance capacity of Himalayan Sherpa. J Apply Physiol 70, 1938–1942. [DOI] [PubMed] [Google Scholar]
- Kayser B, Hoppeler H, Desplanches D, Marconi C, Broers B & Cerretelli P (1996). Muscle ultrastructure and biochemistry of lowland Tibetans. J Appl Physiol 81, 419–425. [DOI] [PubMed] [Google Scholar]
- Kayser B, Narici M, Binzoni T, Grassi B & Cerretelli P (1994). Fatigue and exhaustion in chronic hypobaric hypoxia: influence of exercising muscle mass. J Appl Physiol 76, 634–640. [DOI] [PubMed] [Google Scholar]
- Lahiri S, Edelman NH, Cherniack NS & Fishman AP (1969). Blunted hypoxic drive to ventilation in subjects with life‐long hypoxemia. Fed Proc 28, 1289–1295. [PubMed] [Google Scholar]
- Lewis NCS, Bailey DM, duManoir GR, Messinger L, Lucas SJE, Cotter JD, Donnelly J, McEneny J, Young IS, Stembridge M, Burgess KR, Basnet AS & Ainslie PN (2014). Conduit artery structure and function in lowlanders and native highlanders: relationships with oxidative stress and role of sympathoexcitation. J Physiol 592, 1009–1024. [DOI] [PMC free article] [PubMed] [Google Scholar]
- Lexell J, Downham D & Sjöström M (1986). Distribution of different fibre types in human skeletal muscles: fibre type arrangement in m. vastus lateralis from three groups of healthy men between 15 and 83 years. J Neurol Sci 72, 211–222. [DOI] [PubMed] [Google Scholar]
- Maffiuletti NA (2010). Physiological and methodological considerations for the use of neuromuscular electrical stimulation. Eur J Appl Physiol 110, 223–234. [DOI] [PubMed] [Google Scholar]
- Martin DS, Levett DZ, Grocott MP & Montgomery HE (2010). Variation in human performance in the hypoxic mountain environment. Exp Physiol 95, 463–470. [DOI] [PubMed] [Google Scholar]
- Matheson GO, Allen PS, Ellinger DC, Hanstock CC, Gheorghiu D, McKenzie DC, Stanley C, Parkhouse WS & Hochachka PW (1991) Skeletal muscle metabolism and work capacity: a 31P‐NMR study of Andean natives and lowlanders. J Appl Physiol 70, 1963–1976. [DOI] [PubMed] [Google Scholar]
- Millet GY, Muthalib M, Jubeau M, Laursen PB & Nosaka K (2012). Severe hypoxia affects exercise performance independently of afferent feedback and peripheral fatigue. J Appl Physiol 112, 1335–1344. [DOI] [PubMed] [Google Scholar]
- Murray AJ, Montgomery HE, Feelisch M, Grocott MPW & Martin D (2018). Metabolic adjustment to high‐altitude hypoxia: from genetic signals to physiological implications. Biochem Soc Trans 46, 599–607. [DOI] [PubMed] [Google Scholar]
- Perrey S & Rupp T (2009). Altitude‐induced changes in muscle contractile properties. High Alt Med Biol 10, 175–182. [DOI] [PubMed] [Google Scholar]
- Rassier DE & MacIntosh BR (2000). Coexistence of potentiation and fatigue in skeletal muscle. Braz J Med Biol Res 33, 499–508. [DOI] [PubMed] [Google Scholar]
- Ruggiero L & McNeil CJ (2018). Supraspinal fatigue and neural evoked responses in Lowlanders and Sherpa at 5050 m. Med Sci Sports Exerc (in press; 10.1249/MSS.0000000000001748). [DOI] [PubMed] [Google Scholar]
- Ruggiero L, Yacyshyn AF, Nettleton J & McNeil CJ (2018). UBC‐Nepal expedition: acclimatisation to high‐altitude increases spinal motoneurone excitability during fatigue in humans. J Physiol 596, 3327–3339. [DOI] [PMC free article] [PubMed] [Google Scholar]
- Samaja M, Mariani C, Prestini A & Cerrettelli P (1997). Acid‐base balance and O2 transport at high altitude. Acta Physiol 159, 249–256. [DOI] [PubMed] [Google Scholar]
- Simonson TS (2015). Altitude adaptation: a glimpse through various lenses. High Alt Med Biol 16, 125–137. [DOI] [PMC free article] [PubMed] [Google Scholar]
- Stembridge M, Ainslie PN, Hughes MG, Stöhr EJ, Cotter JD, Nio AQ & Shave R (2014). Ventricular structure, function, and mechanics at high altitude: chronic remodeling in Sherpa vs. short‐term lowlander adaptation. J Appl Physiol 117, 334–343. [DOI] [PMC free article] [PubMed] [Google Scholar]
- Wassenaar EB & Van den Brand JGH (2005). Reliability of near‐infrared spectroscopy in people with dark skin pigmentation. J Clin Monit Comput 19, 195–199. [DOI] [PubMed] [Google Scholar]
- West JB (2012). High‐altitude medicine. Am J Respir Crit Care Med 186, 1229–1237. [DOI] [PubMed] [Google Scholar]
- Westerblad H, Allen DG & Lännergren J (2002). Muscle fatigue: lactic acid or inorganic phosphate the major cause? Physiology 17, 17–21. [DOI] [PubMed] [Google Scholar]
- Woodman R, Playford D, Watts G, Cheetham C, Reed C, Taylor R, Puddey I, Beilin L, Burke V, Mori T & Green D (2001). Improved analysis of brachial artery ultrasound using a novel edge‐detection software system. J Appl Physiol 91, 929–937. [DOI] [PubMed] [Google Scholar]
- Zhao M, Kong QP, Wang HW, Peng MS, Xie XD, Wang WZ, Jiayang, Duan JG, Cai MC, Zhao SN, Cidanpingcuo, Tu YQ, Wu SF, Yao YG, Bandelt HJ & Zhanga YP (2009). Mitochondrial genome evidence reveals successful Late Paleolithic settlement on the Tibetan Plateau. Proc Natl Acad Sci U S A 106, 21230–21235. [DOI] [PMC free article] [PubMed] [Google Scholar]