Abstract
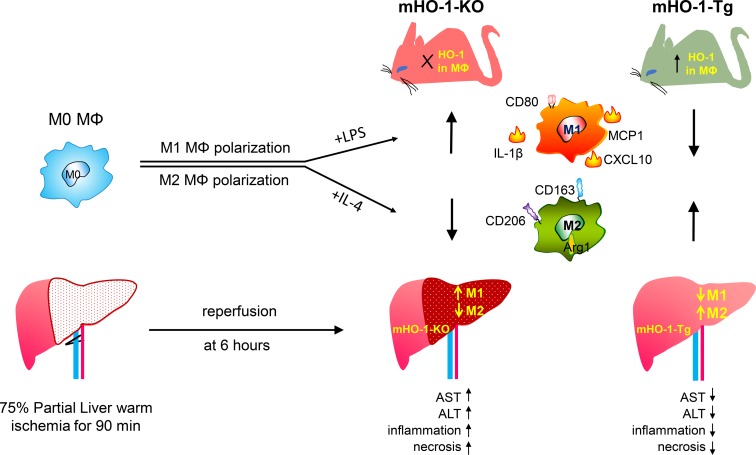
Macrophages polarize into heterogeneous proinflammatory M1 and antiinflammatory M2 subtypes. Heme oxygenase 1 (HO-1) protects against inflammatory processes such as ischemia-reperfusion injury (IRI), organ transplantation, and atherosclerosis. To test our hypothesis that HO-1 regulates macrophage polarization and protects against IRI, we generated myeloid-specific HO-1–knockout (mHO-1–KO) and –transgenic (mHO-1–Tg) mice, with deletion or overexpression of HO-1, in various macrophage populations. Bone marrow–derived macrophages (BMDMs) from mHO-1–KO mice, treated with M1-inducing LPS or M2-inducing IL-4, exhibited increased mRNA expression of M1 (CXCL10, IL-1β, MCP1) and decreased expression of M2 (Arg1 and CD163) markers as compared with controls, while BMDMs from mHO-1–Tg mice displayed the opposite. A similar pattern was observed in the hepatic M1/M2 expression profile in a mouse model of liver IRI. mHO-1–KO mice displayed increased hepatocellular damage, serum AST/ALT levels, Suzuki’s histological score of liver IRI, and neutrophil and macrophage infiltration, while mHO-1–Tg mice exhibited the opposite. In human liver transplant biopsies, subjects with higher HO-1 levels showed lower expression of M1 markers together with decreased hepatocellular damage and improved outcomes. In conclusion, myeloid HO-1 expression modulates macrophage polarization, and protects against liver IRI, at least in part by favoring an M2 phenotype.
Keywords: Hepatology, Inflammation
Keywords: Innate immunity
Myeloid HO-1 expression modulates macrophage polarization and protects against liver IRI, at least in part by favoring an antiinflammatory macrophage M2 phenotype.
Introduction
Heme oxygenase 1 (HO-1), a highly inducible enzyme in heme catabolism (1), exerts potent cytoprotective, antiapoptotic, and antiinflammatory functions (2). We and others have shown that HO-1 expression plays a beneficial role in vascular inflammatory processes, such as ischemia-reperfusion injury (IRI), organ transplantation, and atherosclerosis (3–6). In contrast, under chronic metabolic conditions, HO-1 may promote inflammation (meta-inflammation) instead (7), suggesting that HO-1’s role in the inflammatory response might be disease dependent. Therefore, understanding the HO-1 mechanisms under specific settings, whether antiinflammatory or proinflammatory, is of paramount importance.
Macrophages, the principal mediators of innate immune reactivity, can be divided into distinct subtypes owing to their high plasticity (2). Classically activated macrophages (M1) are proinflammatory, while alternatively activated macrophages (M2) harbor an antiinflammatory phenotype, often after upregulation of HO-1 (8, 9). Increasing evidence supports the importance of M1/M2 polarization in tissue injury and repair in liver (10), heart (11), and kidney (12). In addition, it has been reported that resolvin D1 (13) and microRNA-155 deficiency (14) ameliorate liver IRI by inducing M2 polarization. On the other hand, microenvironments characterized by high levels of oxidized lipids (e.g., atherosclerotic plaques) or the presence of blood (e.g., intraplaque hemorrhage) lead to the development of other macrophage subtypes, such as Mox (15) and Mhem (16), respectively, also characterized by high HO-1 expression levels. Whether HO-1 induction plays a determinant role in macrophage differentiation/polarization or is merely responsive to macrophage stimulation in IRI and other processes warrants attention.
IRI is an acute process that invariably occurs after reopening of the artery following vascular occlusions caused by thromboembolic events and during organ transplantation. It involves a local innate immune sterile inflammation-dominated response, driven by a cascade of free radicals, specifically reactive oxygen species (ROS) that ensue upon reintroduction of oxygen into the ischemic tissues. The degree of tissue damage depends on the extent and duration of the ischemia, the magnitude of the inflammatory response, mostly comprised of infiltrating macrophages and neutrophils, and the upregulation of cytoprotective mechanisms (17, 18). We have previously reported that HO-1 is highly induced after liver IRI and that global HO-1 deficiency, as in systemic HO-1 heterozygous knockout mice, results in marked enhancement of hepatic IRI (19). In the current study, we have used conditional myeloid-specific HO-1–knockout (mHO-1–KO) and HO-1–transgenic (mHO-1–Tg) overexpressing mice to focus on the role of myeloid-specific HO-1 expression in macrophage differentiation/polarization and putative protection from liver IRI.
Results
mHO-1–KO mice exhibit full deletion of HO-1 in macrophages.
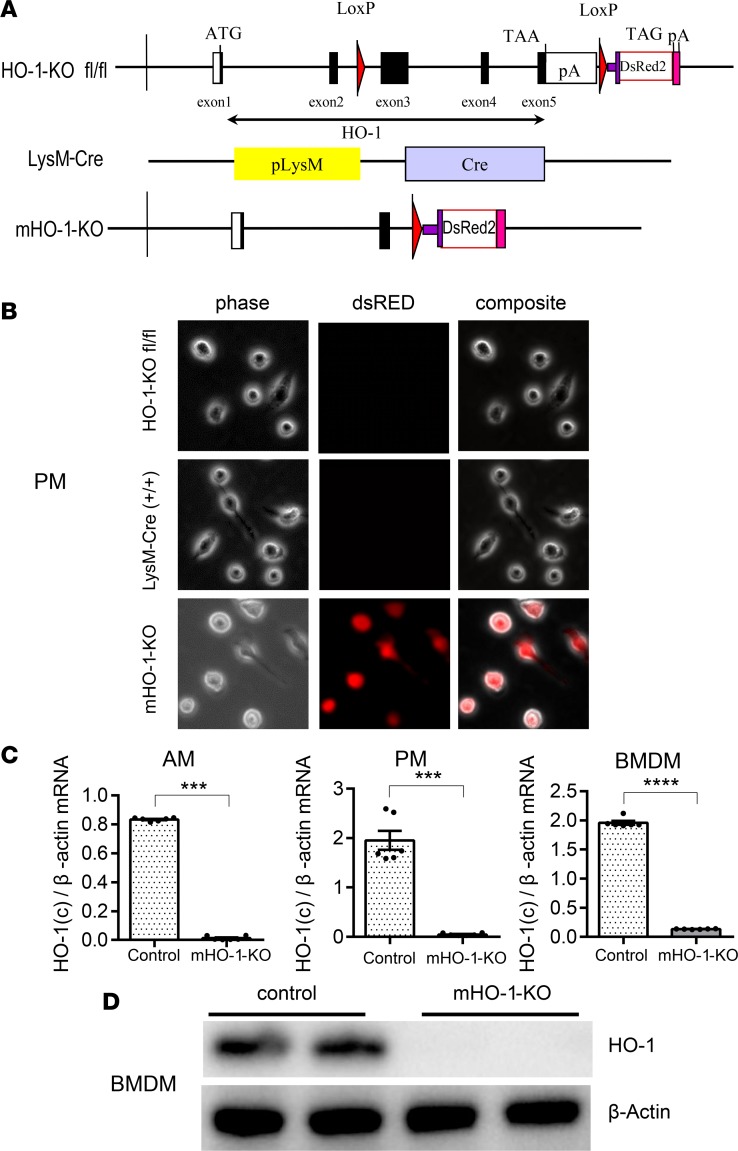
We developed mHO-1–KO mice to evaluate the effect of HO-1 deletion on macrophage polarization, using a stepwise breeding strategy of floxed HO-1–KO and LysM-Cre–Tg mice (Supplemental Figure 1; supplemental material available online with this article; https://doi.org/10.1172/jci.insight.120596DS1). Schemes for the genomic structures of the constructs employed in the generation of floxed HO-1–KO and LysM-Cre–Tg mice are shown in Figure 1A. mHO-1–KO mice were made homozygous for both floxed HO-1–KO and Cre alleles (HO-1–KOfl/fl, LysM-Cre+/+) while their controls were homozygous for the floxed HO-1–KO allele without the Cre allele (HO-1–KOfl/fl, LysM-Cre–/–). We screened for HO-1 deletion efficiency in peritoneal macrophages (PMs), alveolar macrophages (AMs), and bone marrow–derived macrophages (BMDMs) by dsRED fluorescence microscopy. All these cell types exhibited red fluorescence, indicating effective deletion of HO-1 (Figure 1B and Supplemental Figure 2), which was confirmed in AMs, PMs, and BMDMs by real-time PCR (Figure 1C), and total absence of HO-1 protein by immunoblot analysis in BMDMs (Figure 1D). We also evaluated HO-1 mRNA expression in a panel of tissues that included liver, spleen, kidneys, lung, and heart using carboxyl-terminal–specific primers and probes to assess the contribution of myeloid deletion of HO-1 at an organ level. There were trends toward lower HO-1 mRNA levels, albeit not statistically significant, in whole homogenates of liver (P = 0.095) and spleen (P = 0.056) from mHO-1–KO mice as compared with controls. This indicates that the differences in macrophage HO-1 expression in mHO-1–KO mice were buffered by HO-1 expression in other cells that were not of myeloid origin (e.g., hepatocytes, fibroblasts, and endothelial cells). Interestingly, that buffering must have been of a smaller degree in the lung and heart where differences in HO-1 expression remained significant (P < 0.01) in whole tissues (Supplemental Figure 3).
Figure 1. Characterization of myeloid-specific HO-1–knockout mice.
(A) Schematics of the genomic constructs employed in the generation of myeloid-specific HO-1–knockout mice (mHO-1–KO mice). (Top) Floxed HO-1 genomic cassette, HO-1 exons 3, 4, and 5, were flanked by loxP sites, followed by a fluorescent dsRED2 gene cassette. ATG, start codon of HO-1; TAA and TAG, stop codon of HO-1 and dsRED2 gene, respectively; pA, polyadenylation mRNA; LoxP, Cre recombinase recognition site. (Middle) LysM-Cre–Tg construct; pLysM, native promoter for the lyzM gene; Cre, cre recombinase. (Bottom) mHO-1–KO construct after Cre-mediated recombination. (B) dsRED fluorescence in peritoneal macrophages (PMs). (Top) Floxed HO-1 (HO-1–KOfl/fl) controls. (Middle) LysM-Cre. (Bottom) mHO-1–KO mice. Phase, phase contrast; dsRED, red fluorescence channel; Composite, overlay images of both channels. Original magnification, ×200. (C) mRNA expression in alveolar macrophages (AMs) (left), PMs (middle), and bone marrow–derived macrophages (BMDMs) (right) in mHO-1–KO compared with controls (n = 6/group). Data are presented as mean ± SEM (scatter dot blot). Statistical analyses were done with 2-tailed Mann-Whitney U test. ***P < 0.001; ****P < 0.0001. (D) Representative immunoblots for HO-1 and β-actin in BMDMs from mHO-1–KO mice and controls.
HO-1 deletion in myeloid cells promotes M1 polarization and exacerbates liver IRI.
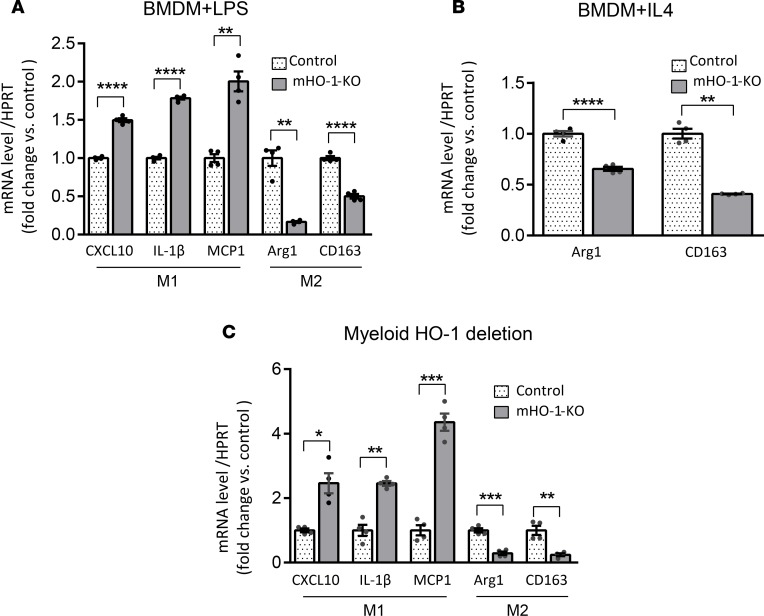
To determine whether HO-1 expression regulates macrophage differentiation/polarization ex vivo, we cultured BMDMs from mHO-1–KO mice and their respective controls, with LPS (100 ng/ml, for 6 hours), an M1-polarizing regimen, and IL-4 (10 ng/ml, for 24 hours), an M2-polarizing regimen. We found that after treatment with LPS, HO-1–deficient BMDMs exhibited significantly (P < 0.05) increased mRNA expression levels of proinflammatory M1 markers (CCXL10, IL-1β, and MCP1) (Figure 2A), with simultaneously decreased levels of antiinflammatory M2 markers (Arg1 and CD163) as compared with controls (Figure 2A). Likewise, HO-1–deficient BMDMs displayed lower mRNA levels of M2 markers after treatment with IL-4 (Figure 2B).
Figure 2. Macrophage polarization in BMDMs and IR-stressed livers mHO-1–KO mice.
Levels of mRNAs encoding CXCL10, IL-1β, and MCP1 (M1 markers); and Arg1 and CD163 (M2 markers) in BMDMs treated with LPS (A) or IL-4 (B), harvested from mHO-1–KO mice. Data were normalized to HPRT gene expression (n = 4/group) and are representative of 3 independent experiments. (C) Hepatic levels of mRNAs encoding CXCL10, IL-1β, and MCP1 (M1 markers); and Arg1 and CD163 (M2 markers) after liver IRI in mHO-1–KO mice versus controls (n = 4/group). Similar results were obtained from 3 independent experiments. Data are shown as the mean ± SEM (scatter dot blot). Statistical analyses were done with 2-tailed Mann-Whitney U test. *P < 0.05; **P < 0.01; ***P < 0.001; ****P < 0.0001.
We then tested whether HO-1 deletion would affect macrophage polarization in vivo in a model of warm liver IRI, where macrophage phenotypes play a critical role in the degree of tissue damage and repair (10). Groups of mHO-1–KO and control mice were subjected to partial (75%) warm hepatic IRI for 90 minutes. As compared with controls, at 6 hours of reperfusion, livers from mHO-1–KO mice exhibited increased mRNA levels of M1 (CCXL10, IL-1β, and MCP1) and decreased mRNA levels of M2 (Arg1 and CD163) markers (Figure 2C), similar to findings ex vivo, indicating that HO-1 deletion favored M1 programming under IR stress.
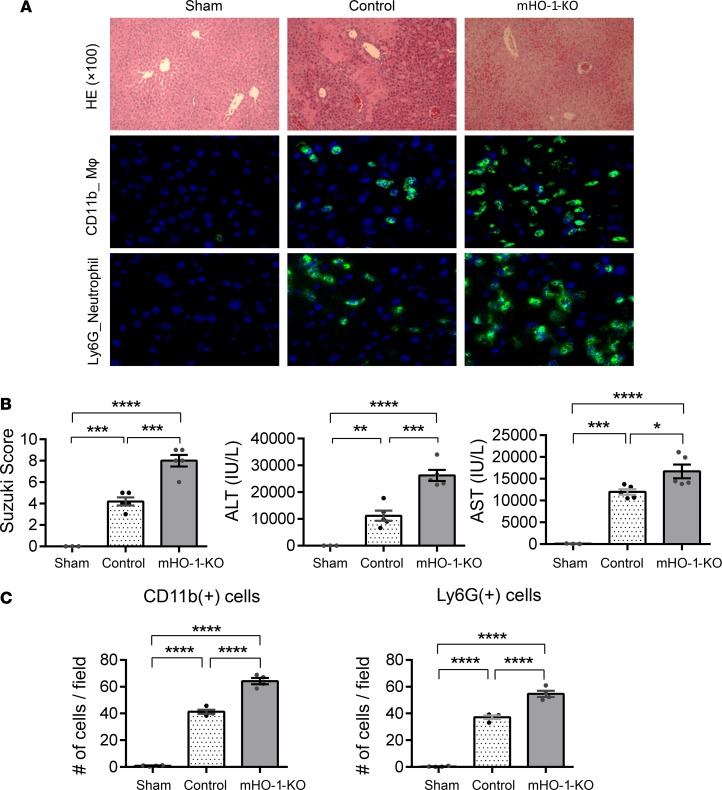
M1 polarization, exacerbated by myeloid HO-1 deletion, was accompanied by increased hepatic IR damage. Thus, mHO-1–KO mice displayed increased necrotic area in the liver as determined by H&E staining (Figure 3A), higher Suzuki histological scores of the hepatocellular damage (4.2 ± 0.37 in controls [n = 5] vs. 8 ± 0.55 in mHO-1–KO mice [n = 4]) (Figure 3B), and increased serum levels of alanine aminotransferase (ALT) (controls: 11,179 ± 1,904 IU/l [n = 5] vs. mHO-1–KO: 26,232 ± 2,058 IU/l [n = 5]) and aspartate aminotransferase (AST) (controls: 11,978 ± 643.6 IU/l [n = 5] vs. mHO-1–KO: 16,679 ± 1,577 IU/l [n = 5]) (Figure 3B). In addition, mHO-1–KO mice exhibited increased hepatic infiltration by macrophages and neutrophils, as evidenced by immunofluorescence staining of CD11b and Ly6G, respectively (Figure 3A), and quantification of macrophages (controls: 41.3 ± 1.6 vs. mHO-1–KO: 64.2 ± 2.3 cells/high-power field [HPF], n = 4 per group) and neutrophils (controls: 37.1 ± 1.4 vs. mHO-1–KO: 54.6 ± 2.4 cells/HPF, n = 4 per group) (Figure 3C) per microscopic field. Overall, our data indicate that myeloid-specific HO-1 deletion exacerbated M1 polarization, local inflammatory response, and the severity of liver IRI.
Figure 3. Myeloid HO-1 depletion exacerbates hepatic IRI.
(A) Representative liver histology. (Top) H&E staining (×100 magnification). (Middle) Macrophage (MΦ) CD11b immunofluorescence staining (×400 magnification). (Bottom) Neutrophil Ly6G immunofluorescence staining (×400 magnification). (B) Suzuki’s histological grading of liver IRI (left), serum ALT levels (middle), and serum AST levels (right) (n = 13; 3 sham, 5 control, and 5 mHO-1–KO). (C) Number of cells/HPF for hepatic CD11b+ (left), and Ly6G+ cells (right) (n = 4/group). Data are presented as the mean ± SEM (scatter dot blot). Statistical analyses were done with 1-way ANOVA with Tukey’s multiple-comparisons post hoc test. *P < 0.05; **P < 0.01; ***P < 0.001; ****P < 0.0001.
mHO-1–overexpressing mice exhibit increased HO-1 in macrophages.
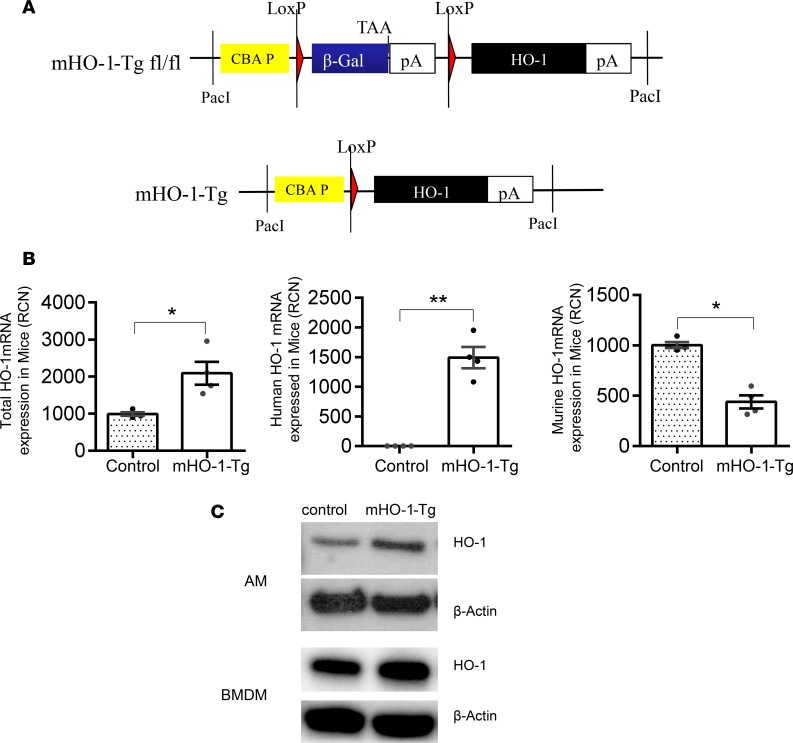
To examine the effects induced by higher baseline HO-1 expression in myeloid cells, we developed mHO-1–overexpressing mice by breeding mHO-1 floxed Tg mice (Figure 4A) with LysM-Cre–Tg mice (Figure 1A), as described in the Methods section and in Supplemental Figure 1. Degenerate primers and their corresponding Roche universal probes were used to assess mouse, human, and total HO-1 (murine HO-1 + human HO-1) mRNA expression in AMs by real-time qPCR (Supplemental Table 2). Total HO-1 expression was significantly higher in mHO-1–Tg cells due to the exclusive expression of the human HO-1 transgene in these cells, in spite of a mild downregulation of the endogenous mouse HO-1 gene in mHO-1–Tg cells as compared with controls (Figure 4B). HO-1 overexpression was further confirmed at the protein level by immunoblotting. Total HO-1 protein levels were increased in AMs as well as BMDMs from mHO-1–Tg mice as compared with controls (Figure 4C). Changes in myeloid HO-1 overexpression did not affect overall HO-1 levels in whole organs, as there were not significant differences in total HO-1 mRNA expression in liver, spleen, kidneys, lung, and heart (Supplemental Figure 4).
Figure 4. Characterization of myeloid-specific HO-1–Tg mice.
(A) Schematics of genomic construct employed in the original generation of HO-1 floxed transgenic (mHO-1–Tg) mice. PacI, PacI restriction endonuclease site; CBA P, hybrid chicken β-actin promoter with an enhancer element and a chimeric intron; β-Gal, β galactosidase gene; TAA, stop codon of β-galactosidase gene; pA, polyadenylation signal of β-galactosidase gene and HO-1 gene, respectively; LoxP, cre recombinase recognition site. (B) mRNA HO-1 expression for total (left), human (middle), and mouse (right) HO-1 genes (n = 4/group). RCN, relative copy number. Data are presented as the mean ± SEM (scatter dot blot). Statistical analyses were done with 2-tailed Mann-Whitney U test. *P < 0.05; **P < 0.01. (C) Immunoblot for HO-1 and β-actin in AMs and BMDMs from mHO-1–Tg mice versus controls.
HO-1 overexpression in myeloid cells regulates macrophage polarization and attenuates liver IRI.
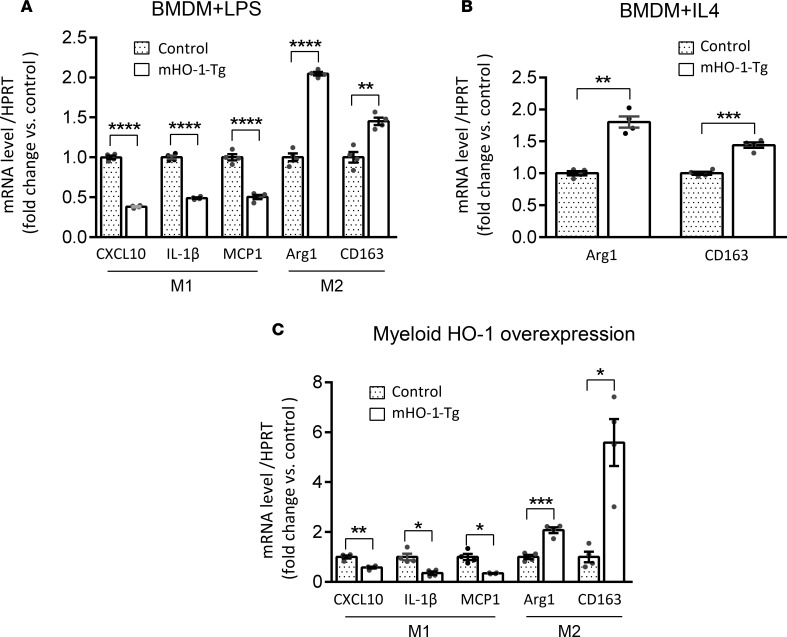
We cultured BMDMs from mHO-1–Tg mice or controls, and then treated them with LPS or IL-4, similar to how we treated cells from mHO-1–KO mice. Tg BMDMs displayed decreased expression of proinflammatory M1 but increased mRNA levels coding for antiinflammatory M2 markers as compared with controls, after LPS treatment (Figure 5A). Likewise, Tg BMDMs displayed increased M2 marker expression levels (P < 0.05) when compared with controls, after treatment with IL-4 (Figure 5B), indicating that increased HO-1 baseline expression favored M2 polarization ex vivo. We then tested effects induced by myeloid HO-1 overexpression on macrophage polarization in vivo, using the model of warm liver IRI. In contrast to the mHO-1–KO livers, the opposite patterns occurred in mHO-1–Tg livers, which exhibited significantly (P < 0.05) decreased mRNA levels of M1 markers (CXCL10, IL-1β, and MCP1) but increased mRNA levels of M2 markers (Arg1 and CD163) as compared with controls (Figure 5C). Overall, these data suggest that myeloid-specific baseline HO-1 overexpression inhibited M1 in favor of M2 polarization in IR-stressed livers.
Figure 5. Macrophage polarization in BMDMs and IR-stressed livers from mHO-1–Tg mice.
Levels of mRNAs encoding CXCL10, IL-1β, and MCP1 (M1 markers); and Arg1 and CD163 (M2 markers) in BMDMs treated with LPS (A) or IL-4 (B), harvested from mHO-1–Tg mice. Data were normalized to HPRT gene expression (n = 4/group) and are representative of 2 independent experiments. (C) Hepatic levels of mRNAs encoding CXCL10, IL-1β, and MCP1 (M1 markers); and Arg1 and CD163 (M2 markers) after liver IRI in mHO-1–Tg mice versus controls (n = 4/group). Similar results were obtained from 2 independent experiments. Data are shown as the mean ± SEM (scatter dot blot). Statistical analyses were done with 2-tailed Mann-Whitney U test. *P < 0.05; **P < 0.01; ***P < 0.001; ****P < 0.0001.
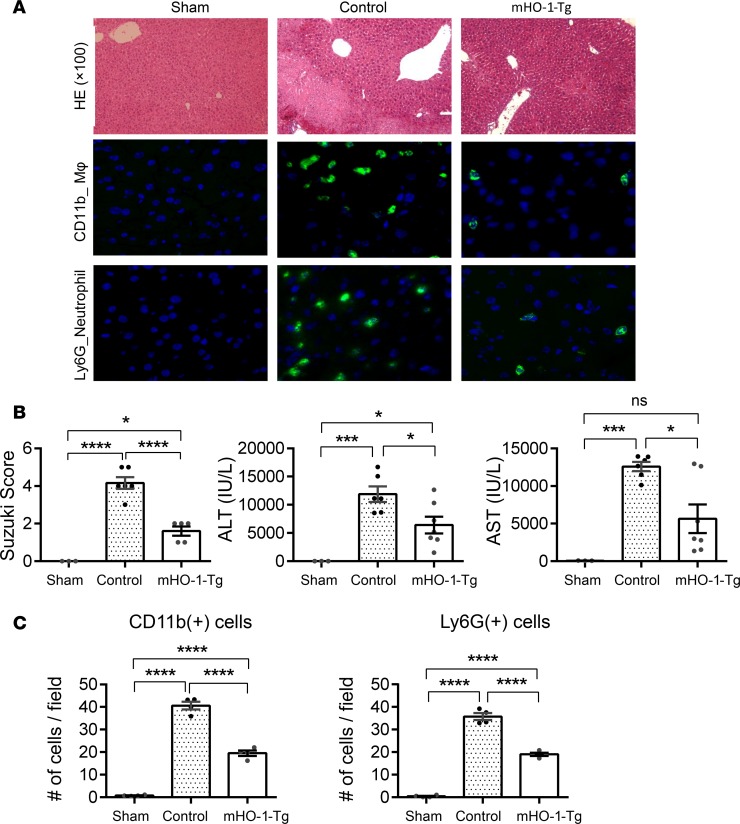
HO-1–induced M2 polarization was accompanied by decreased hepatic damage following partial warm liver IRI. mHO-1–Tg mice exhibited decreased hepatic necrotic area by H&E staining (Figure 6A) and lower Suzuki histological scores of liver tissue damage (control: 4.2 ± 0.31 [n = 6] vs. mHO-1–Tg: 1.6 ± 0.24 [n = 5]). In addition, mHO-1–Tg mice had decreased serum ALT (control: 11,867 ± 1,368 IU/l [n = 6] vs. mHO-1–Tg: 6,413 ± 1,481 IU/l [n = 7]) and AST (control: 12,590 ± 614.9 IU/l [n = 6] vs. mHO-1–Tg 5,656 ± 1,909 IU/l [n = 7]) (Figure 6B) levels, along with decreased hepatic infiltration by macrophages (control: 40.6 ± 1.7 vs. mHO-1–Tg 19.5 ± 1.2 cells/HPF, n = 4/group) and neutrophils (control: 35.7 ± 1.6 vs. mHO-1–Tg 19.0 ± 0.7 cells/HPF, n = 4/group) (Figure 6C). Altogether, myeloid HO-1 overexpression favored M2 polarization and significantly ameliorated inflammatory cell infiltration and hepatocellular injury in IRI-stressed livers.
Figure 6. Myeloid HO-1 overexpression attenuates hepatic IRI.
(A) Representative liver histology. (Top) H&E staining (×100 magnification) and macrophage (MΦ) CD11b immunofluorescence staining. (Bottom) Neutrophil Ly6G immunofluorescence staining (×400 magnification). (B) Suzuki’s histological grading of liver IRI (left), serum ALT levels (middle), and serum AST levels (right) (n = 15, 3 sham, 7 control, and 5 mHO-1–Tg). (C) Number of positive cells/HPF for CD11b+ cells (left), Ly6G+ cells (right) (n = 4/group). Data are presented as the mean ± SEM (scatter dot blot). Statistical analyses were done with 1-way ANOVA with Tukey’s multiple-comparisons post hoc test. *P < 0.05; ***P < 0.001; ****P < 0.0001; ns, not significant.
HO-1 levels in human liver transplants correlate with IR-hepatocellular M1/M2 gene expression pattern.
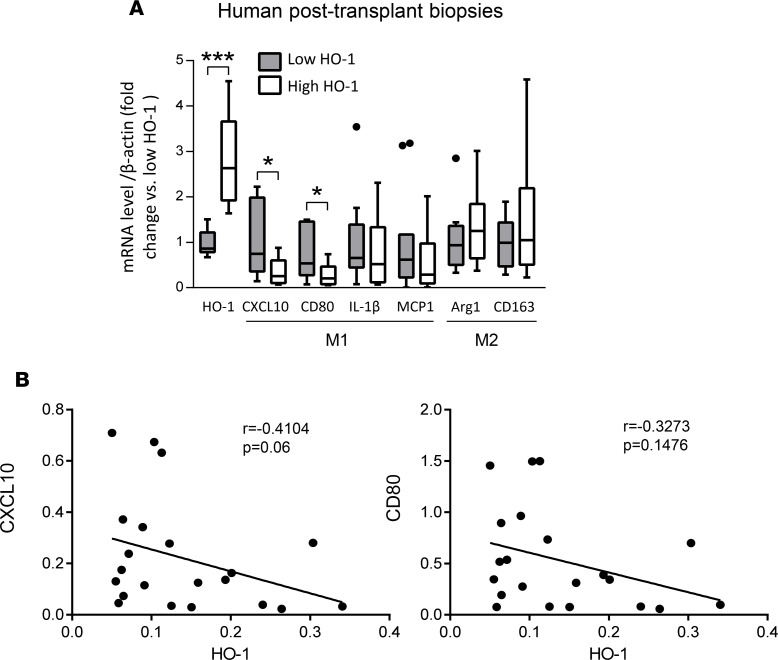
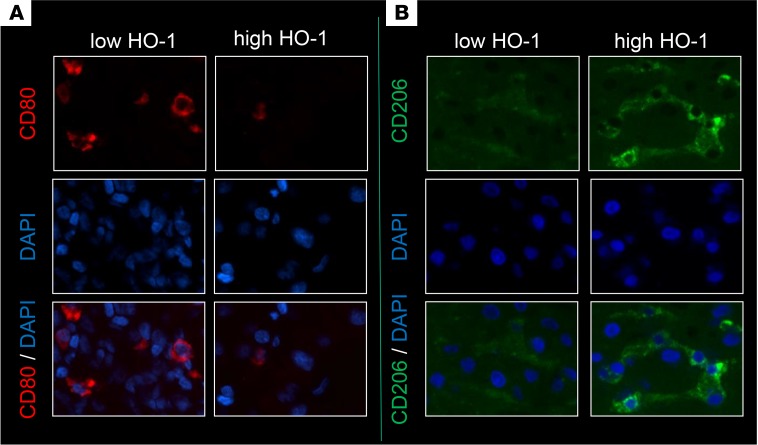
To determine whether HO-1 expression influences macrophage polarization in humans, we examined the relationship between hepatic mRNA levels coding for HO-1 and macrophage polarization markers in liver biopsies collected from 21 adult primary orthotopic liver transplant (OLT) recipients, at approximately 2 hours after reperfusion. Samples were divided into low (n = 11) versus high (n = 10) HO-1 mRNA expression groups. We previously reported that subjects characterized by low HO-1 protein expression at postoperative day 1 exhibited higher serum ALT levels (P < 0.05), higher cleaved caspase 3 (P < 0.05), increased frequency of TUNEL+ cells, and decreased cumulative survival time with a median of 712 days (range from 27 to 1,009 days) (20). These results indicate that depressed post-reperfusion HO-1 protein levels were associated with a more pronounced hepatocellular damage in human OLT. In the current study, we have contrasted the macrophage polarization pattern in the low versus high HO-1 expression in liver transplant biopsy samples. Indeed, 2 of the M1 markers that were assessed, CXCL10 and CD80 (Figure 7A), were both significantly decreased in the high HO-1 expression biopsy group as compared with the low HO-1 biopsy group (P < 0.05). In addition, there were clear trends, which however failed to reach statistical significance, for decreased expression of other M1 markers (IL-1β and MCP1) and somewhat higher expression of M2 markers (Arg1 and CD163) in the high HO-1 recipient group (Figure 7A). There were also negative, albeit not significant, correlations between HO-1 and M1 markers CXCL10 (r = –0.4104, P = 0.06) and CD80 (r = –0.3273, P = 0.1476) (Figure 7B), IL-1β (r = –0.06883) or MCP-1 (r = –0.2260), as well as positive correlations with M2 markers Arg1 (r = 0.2740) and CD163 (r = 0.1493) (Supplemental Figure 5). We performed immunohistochemical analyses of CD80 (M1 marker) and CD206 (M2 marker), which revealed that OLT biopsies with high HO-1 mRNA were characterized by lower CD80 and higher CD206 expression as compared with biopsies from the low HO-1 group (Figure 8).
Figure 7. Inflammatory gene expression in human liver transplant biopsies.
(A) mRNA levels of CXCL10, CD80, IL-1β, and MCP1 genes (M1 markers); and Arg1 and CD163 genes (M2 markers) in human liver transplant biopsies. Expression level of each gene was normalized to β-actin gene expression. Data are presented as Tukey’s box-and-whisker plots: whiskers are inner fences reaching 1.5 times the interquartile range and boxes represent the interquartile ranges, dots indicate outlying values, and lines represent median values for each gene expression level (n = 21; 11 low HO-1 and 10 high HO-1). Statistical analyses were done by 2-tailed Mann-Whitney U test. *P < 0.05, ***P < 0.001. (B) Associations between human HO-1 and CXCL10 or CD80 expression in liver biopsies after transplantation. Correlations were analyzed by nonparametric Spearman’s method in GraphPad Prism 6.
Figure 8. Macrophage polarization markers in human liver transplant biopsies.
Immunohistochemical staining for M1 marker CD80 (A) and M2 marker CD206 (B) in human liver transplant biopsies. (Top) CD80/CD206 only. (Middle) DAPI only. (Bottom) Composite of DAPI with CD80/CD206. Representative of 3/group (×400 magnification).
Discussion
This is the first study, to the best of our knowledge, demonstrating that myeloid HO-1 expression regulates macrophage polarization and protects against liver IRI, at least in part, by favoring an M2 antiinflammatory phenotype. A mouse model for myeloid-specific HO-1 overexpression was screened in parallel with myeloid-specific HO-1–deficient mice in a preclinical hepatic IRI model, broadly relevant to many pathological states. In addition, prospective human liver transplant screening indicates that HO-1 levels in hepatic biopsies were associated with proinflammatory endpoints and long-term outcomes.
Macrophages are key mediators for native and adaptive inflammatory responses. Classically activated M1 macrophages and alternatively activated M2 macrophages exhibit phenotypes that favor proinflammatory and antiinflammatory responses, respectively (2). We assessed the role of HO-1 in macrophage polarization by testing the M1/M2 expression profile of BMDMs from mHO-1–KO and mHO-1–Tg mice versus respective controls, and then used an established mouse model of warm liver IRI, to test the relevance of macrophage polarization to in vivo outcomes. In this model, HO-1 is predominantly expressed in macrophages of IR-inflamed liver (Supplemental Figure 6), suggesting that macrophage HO-1 is pivotal for cytoprotection against liver IRI. Thus, we analyzed the expression of M1 (CXCL10, IL-1β, and MCP1) and M2 (Arg1 and CD163) markers in IR-stressed livers. Those from mHO-1–KO mice exhibited an expression pattern for increased M1 but decreased M2 markers, while livers from mHO-1–Tg mice displayed the opposite molecular signature. Likewise, LPS-induced M1 polarization was enhanced in BMDMs from mHO-1–KO mice but reduced in mHO-1–Tg cells. In contrast, IL-4–mediated M2 polarization was favored by HO-1 overexpression. While our study did not specifically delineate the polarization profile of liver-resident macrophages (Kupffer cells), it is plausible that HO-1 expression in these cells would lead to phenotypes similar to those observed in vitro. Our previous study identified increased frequency of circulating macrophages compared with that of Kupffer cells in IR-stressed mouse livers (21). Indeed, Devey et al. reported that Kupffer cells are important in the protection against liver IRI in a rat model (22). Current data extend our previous report in which adoptive transfer of HO-1–overexpressing BMDMs suppressed the M1 phenotype and proinflammatory gene expression profile observed otherwise in Nrf2-deficient mice (23), with Nrf2 being an important transcription factor that regulates HO-1 expression. On the other hand, HO-1 is highly upregulated in Mox (15) and Mhem (16) phenotypes as well, raising the possibility that HO-1 expression in M2 macrophages could be an epiphenomenon rather than a causal mediator. In the current study, our data derived from myeloid-specific HO-1–Tg and –KO mice clearly indicate that HO-1 expression drives M2 polarization and inhibits hepatic IRI, whereas its deficiency promotes IR-induced M1 polarization and exacerbates hepatic IR damage.
We have previously shown that HO-1 heterozygous KO mice had worse liver IRI outcomes, indicating that globally decreased HO-1 levels augmented IR-triggered hepatocellular damage (19). This could be due to cytoprotective HO-1 actions in hepatocytes or antiinflammatory effects in liver-infiltrating cells such as macrophages and neutrophils. In the murine model of cardiac transplantation, we have reported that global HO-1 overexpression in the recipients had improved graft survival to a much larger degree than local HO-1 overexpression in the donor hearts (5), suggesting a prominent host HO-1 immunomodulatory function. In this study, we have developed myeloid-specific genetically modified mice to dissect the role of myeloid HO-1 function in hepatocellular damage induced by partial warm ischemia followed by reperfusion. We found that myeloid-specific HO-1 deficiency exacerbated liver IRI and hepatic infiltration by macrophages and neutrophils, while increased HO-1 expression in Tg mice resulted in the amelioration of liver injury. This is consistent with comparable outcomes in the model of kidney IRI (24, 25) where genetically induced HO-1 overexpression (24) or HO-1 induction by hemin administration (25) ameliorated IR damage, effects that were blunted when HO-1 had been deleted in myeloid cells (25). Importantly, our study enabled us to determine that HO-1–mediated protection was largely due to effects on myeloid functions. However, mHO-1–Tg mice are not direct counterparts to mHO-1–KO mice; myeloid cells from mHO-1–KO mice lacked HO-1 prior to, at the onset of, and following IR without any possibility of mounting an HO-1 response. This led to overall baseline HO-1 expression that was significantly lower (lungs and heart) or trended to be lower (liver, spleen, and kidneys) in KOs as compared with controls (Supplemental Figure 3). In contrast, both Tg and controls were capable of upregulating mouse HO-1 in response to IR, so the critical difference was the constitutive overexpression exhibited by Tg myeloid cells at baseline, prior to the IR insult. The difference in overall HO-1 expression in myeloid cells between Tg and controls was much smaller than that exhibited by KOs versus controls, which was reflected by the lack of trends or any significant difference in HO-1 overall expression in tissues tested (Supplemental Figure 4). In the study by Rossi et al., administration of hemin 24 hours prior to the kidney IR induced HO-1 expression in CD11b+F4/80lo myeloid cells, putative mediators of HO-1 protection (25). However, hemin was expected to induce HO-1 in a large variety of cells, not only those of the myeloid lineage. In this study, we are certain that HO-1 was constitutively overexpressed at baseline in mHO-1–Tg mice, only in myeloid cells, although we cannot rule out paracrine actions since HO-1 enzymatic byproducts, such as carbon monoxide, could have been released from infiltrating macrophages and alter neighbor hepatocytes. Our results are consistent with our previous report showing that adoptive transfer of BMDMs overexpressing HO-1 improved survival of cold-stored mouse OLTs (23). This is also relevant to the clinical organ transplantation setting where HO-1 expression could be induced in the recipient prior to transplant surgery. Taken together, our data highlight the antiinflammatory and immunomodulatory functions of HO-1 as well as the importance of targeting myeloid cells, and timing any potential manipulation of HO-1 expression, for future therapeutic applications, prior to the injurious insult (e.g., IR).
It is quite remarkable that low levels of HO-1 mRNA in human liver transplants, only 2 hours after reperfusion, were accompanied by significantly increased expression of M1 markers, CXCL10 and CD80 (Figure 7), and trends between HO-1 levels and other polarization markers, although not statistically significant (Supplemental Figure 5). This could be due to the limited number of subjects, lack of control of putative factors that influence inflammatory responses among liver recipients, differences in responses induced by partial warm ischemia in the mouse model versus cold and warm ischemia in clinical settings, or differences in the length of IR insult and tissue samplings. Importantly, the relationship between HO-1 expression and M1/M2 profile was confirmed by immunohistochemical analyses of CD80 and CD206 in liver biopsies from the high HO-1 as compared to the low HO-1 group. However, for logistical reasons, HO-1 mRNA levels were tested after 2 hours of IR, not at baseline, prior to the transplant, as was the case with the mouse studies. In spite of this, the high HO-1 expression patient cohort not only displayed a lesser degree of tissue injury shortly after reperfusion but also had improved long-term clinical outcomes, as reported separately (20). Although future studies are needed to evaluate whether differences in HO-1 expression prior to the IR and OLT have similar predictability power, this could have important therapeutic implications. Indeed, our current findings are in agreement with a clinically attractive concept (26) that prospective transplant recipients could be conditioned if needed, with HO-1–inducing compounds prior to or around the time of the surgical procedure. Alternatively, BMDMs could be genetically manipulated ex vivo to overexpress HO-1 and be autografted back to the patients prior to the actual transplantation.
In summary, our translational study documents the essential role of myeloid HO-1 expression in macrophage polarization in favor of an M2 antiinflammatory phenotype in liver IRI. Additional work is required to determine the signaling pathways in the M1 to M2 macrophage switch under the control of HO-1 and to explore their potential therapeutic applications in sterile inflammation.
Methods
Reagents.
LPS (catalog L5418-2ML) and IL-4 (catalog I1020-5UG) were purchased from Sigma-Aldrich. Mouse HO-1 antibody (H105) (catalog sc-10789) and β-actin antibody (N-21) (catalog sc-130656) were purchased from Santa Cruz Biotechnology. Rabbit anti–human/mouse HO-1 antibody (catalog ADI-SPA-896-D, Enzo Life Sciences), rat anti–mouse Ly6G antibody (catalog MCA2387, Bio-Rad), rat anti–mouse CD68 antibody (catalog MCA1957, Bio-Rad), rat monoclonal anti-CD11b antibody (catalog 550282, BD Biosciences), mouse anti-CD80 antibody (catalog MAB140, R&D Systems), and mouse anti–human CD206 antibody (catalog MAB25341, R&D Systems) were obtained from the respective vendors as indicated.
Animals.
mHO-1–KO and mHO-1–Tg mice were developed at UCLA. mHO-1–KO mice were generated by crossing HO-1 floxed mice (27) with LysM-Cre–Tg mice (28), both of which had been backcrossed onto the C57BL/6 background for more than 10 generations, using a stepwise breeding strategy (Supplemental Figure 1). HO-1 floxed mice were generated by Mamiya et al. at Tohoku University Graduate School of Medicine, Sendai, Japan, with a targeting vector that had loxP sites flanking the second intron and the terminal exon of HO-1 (27). These mice were obtained from RIKEN (strain name: B6J.129P2-Hmox<tim1Mym>, stock number: RBRC03163). LysM-Cre–Tg mice were originally developed by Clausen et al. at the University of Munich, Munich, Germany, by targeted insertion of the Cre recombinase cDNA into the endogenous lysozyme locus (28). We obtained these mice from the colony of Srinivasa Reddy at UCLA (29). A dsRED protein cassette, located downstream of the floxed HO-1 gene, was actively transcribed after Cre-mediated deletion of HO-1 exons 3–5 (Figure 1A). Therefore, dsRED fluorescence served as a reporter for efficient deletion of HO-1 exons 3–5. Primer sequences employed for the genotyping of floxed HO-1 alleles (mouse Hmox1-g62145r, mouse Hmox1-g61822f, and DsRed-N2) (Riken Inc.) and LysM-Cre gene (pLysM-FP1, LysM-RP2, and VE-Cad-Cre-R) are shown in Supplemental Table 1. mHO-1–KO mice were homozygous for both floxed HO-1 alleles and LysM-Cre alleles (HO-1fl/fl, LysM-Cre+/+), while control mice were homozygous for the floxed HO-1 allele but lacked the LysM-Cre allele (HO-1fl/fl, LysM-Cre–/–).
mHO-1–Tg mice were generated by crossing floxed HO-1–Tg mice with the aforementioned LysM-Cre–Tg mice. Floxed HO-1–Tg mice were obtained from Anupam Agarwal at the University of Alabama at Birmingham, who had generated them in the C57BL/6 background (30). This transgene contains the human HO-1 (human HMOX1) cDNA downstream from a floxed β-galactosidase gene (β-gal) and a stop-codon cassette, which are preceded by a chicken β-actin (CBA) hybrid promoter with an enhancer element and a chimeric intron, which enhances promoter activity. The schematic of the construct employed in the generation of floxed HO-1–Tg is shown in Figure 4A. The breeding strategy was similar to that used for the generation of mHO-1–KO mice (Supplemental Figure 1). mHO-1–Tg mice were homozygous for both floxed HO-1–Tg and Cre alleles (HO-1–Tgfl/fl, LysM-Cre+/+). For this purpose, we quantified copy number by real-time qPCR (31) using primers specific for HO-1 (human HMOX1 FP-101, human HMOX1 RP-101, with Roche universal probe 101) and primers for the non-intron region of the Gja5 gene as our control (Gja5 FP6 and Gja5 RP6 with Roche universal probe 6) (Supplemental Table 2). The control mice were either HO-1–Tgfl/fl, LysM-Cre–/– littermates or C57BL/6 mice since there were no differences in the level of injury due to warm ischemic injury based on the H&E staining, Suzuki’s histological grading of liver IRI, and the levels of serum AST and ALT between HO-1–Tgfl/fl, LysM-Cre–/–, and C57BL/6 mice (Supplemental Figure 7). All experimental and control mice were 8- to 12-week-old males, housed in the UCLA animal facility under specific pathogen–free conditions. All animals received human care according to the criteria outlined in the Guide for the Care and Use of Laboratory Animals prepared by the National Academy of Sciences and published by the NIH (NIH publication 86-23, revised 1985).
Liver IRI model.
A mouse model of partial (75%) warm hepatic IRI was used, as described previously (32). Briefly, mice were anesthetized, injected with heparin (100 U/kg), and an atraumatic clip was used to interrupt the hepatic artery and portal venous blood supply to the left/middle liver lobes. After 90 minutes of ischemia, the clamp was removed and mice were sacrificed at 6 hours of reperfusion, the peak time of hepatocellular damage in this model. Blood was collected from the inferior vena cava and organs were harvested upon euthanasia.
Serum biochemistry.
Levels of ALT and AST were measured in serum by IDEXX Laboratories, which served as indicators of hepatocellular injury.
Liver histology.
Formalin-fixed, paraffin-embedded liver sections (5 μm) were stained with H&E as previously reported (19). The severity of liver IRI was assessed blindly and graded according to Suzuki’s criteria on a scale from 0 to 4. No necrosis, congestion, or centrolobular ballooning is given a score of 0, while severe congestion and greater than 60% lobular necrosis is given a value of 4 (17).
Immunofluorescence.
Liver-infiltrating inflammatory cells (macrophages and neutrophils) were detected using rat monoclonal CD11b antibody or rat anti–mouse CD68 antibody and rat anti–mouse Ly6G antibody, respectively. Liver biopsy expression of CD80 and CD206 were detected using mouse anti-CD80 antibody and mouse anti-CD206 antibody, respectively. Immunofluorescence signals were visualized with secondary antibodies: Alexa Fluor 488 IgG and Alexa Fluor 594 IgG (Molecular Probes). Positive cells were counted blindly in 10 HPFs/section (×400).
Isolation and culture of AMs, PMs, and BMDMs.
AMs were isolated as described previously (33) with minor modifications. Briefly, mice were euthanized and their tracheas were exposed. An 18-gauge needle attached to a 3-ml syringe was inserted into the trachea to flush the lungs multiple times using 1.5 ml of cold phosphate-buffered saline (PBS) with 0.5 mM ethylenediaminetetraacetic acid (EDTA), which was immediately placed on ice after collection, and then plated in 6-well plates that were incubated. PMs were harvested as described previously (34). Briefly, 10 ml of PBS was injected into the mouse peritoneal cavity with a 21-gauge needle (1-inch length). The retrieved peritoneal lavage was first placed on ice after collection and then plated in 6-well plates. Cells were washed with PBS 3 times after either a 1-hour incubation (for mRNA analysis) or an overnight incubation (for Western blot analysis and fluorescence microscopy). Bone marrow cells from mHO-1–KO, mHO-1–Tg, and their respective control mice were harvested, and cultured as previously described to generate BMDMs (23). On the seventh day, cells were counted and replated. After 24 hours, cells were treated with either LPS (100 ng/ml) for 6 hours or IL-4 (10 ng/ml) for 24 hours.
Live cell fluorescence microscopy.
Cells were examined under a light and fluorescence microscope (Carl Zeiss Cell Observer Z.1 R) within 30 minutes. Nearly all adhered cells (macrophages) exhibited red fluorescence, indicating effective deletion of HO-1 (Figure 1B). Images were taken with a ×10 eyepiece plus ×20 objective, for a total of ×200 magnification with the phase I channel for phase-contrast light microscopic imaging, paired with the Cy3 channel with filter sets of 538–563 nm excitation/570–640 nm emission combination for dsRED fluorescence.
Quantitative RT-PCR analysis.
RNA extraction was done with a Qiagen RNeasy Mini Kit. Probe-based real-time qPCR was used to characterize mouse tissue Hmox1 mRNA expression in mHO-1–KO as well as total HO-1 gene expression in mHO-1–Tg mice and their respective controls. Probe-based real-time qPCR was performed using the Roche LightCycler 480 as described previously (31). The primers and corresponding Roche universal probes are listed in Supplemental Table 2. In detail, human HMOX1 FP-101 and human HMOX1 RP-101 with Roche universal probe 101 were used to detect human HMOX1 mRNA expression in mHO-1–Tg mice, with no cross-detection of mouse Hmox1 mRNA. A pair of primers (Uni HO1 F49/134 and Uni HO1 R49/134-short) that amplify both human and mouse HO-1 cDNA sequences were used to detect total HO-1 expression in mHO-1–Tg mice (Supplemental Table 2). A SYBR Green–based qPCR method was used to assess gene expression in BMDMs treated with LPS and IL-4, mouse liver tissues following IRI, and human liver biopsies. Primers for this purpose are listed in Supplemental Table 3. SYBR Green–based qPCR was performed using a DNA Engine with Chromo 4 Detector (MJ Research) as described previously (35). The expression of the target gene was normalized to β-actin (Roche universal probe–based method) and the hypoxanthine guanine phosphoribosyltransferase gene (HPRT) (SYBR Green–based), respectively. Values are expressed as relative fold induction.
Clinical liver transplant study and sample collection.
Liver biopsy samples were collected from 21 adult primary OLT recipients, as described previously (20). In brief, subjects were recruited between May 10, 2013 and April 6, 2015. Routine standard-of-care and immunosuppressive therapy were administered as specified by UCLA liver transplant protocols. All donor organs were procured from donation after brain death with standardized techniques, perfused with and stored in cold University of Wisconsin solution (ViaSpan; Bristol-Meyers Squibb Pharma). Recipient venous blood was collected prior to the transplant and at postoperative day 1. Liver function was evaluated with standard-of-care tests, including serum ALT, AST, and total bilirubin. Protocol Tru-Cut needle biopsies (Bx) were obtained intraoperatively from the left lobe approximately 2 hours after portal reperfusion (prior to surgical closing of the abdomen) and were snap-frozen. mRNA levels for HO-1 and the macrophage M1 (CXCL10, CD80, IL-1β, and MCP1) and M2 (ARG1 and CD163) polarization markers were assessed by real-time qPCR using the primers shown in Supplemental Table 3. The demographic data and clinical parameters of the recipients have been presented by Nakamura et al. (20).
Statistics.
All data are expressed as the mean ± SEM (scatter dot blot), except for human gene expression (Figure 7) where data are presented as Tukey box-and-whisker plots: whiskers are inner fences reaching 1.5 times the interquartile range and boxes represent the interquartile ranges, dots indicate outlying values, and lines represent median values for each gene expression level. For data comparisons between 2 groups, we used a 2-tailed Mann-Whitney U test. For data comparisons among 3 or more groups, we used 1-way analysis of variance (ANOVA) with Tukey’s multiple-comparisons post hoc test. Spearman’s correlations were used to analyze associations between HO-1 expression and other inflammatory gene expression in the human liver transplant biopsies. Analyses were performed with GraphPad Prism 6 software. Differences were considered statistically significant at P < 0.05 (*P < 0.05, **P < 0.01, ***P < 0.001, and ****P < 0.0001).
Study approval.
The present studies were reviewed and approved by the UCLA Animal Research Committee (ARC 1999-094; mouse) and Institutional Review Board (IRB 13-000143; human), Los Angeles, California. Subjects provided informed consent prior to their participation in the study.
Author contributions
Performance of the large majority of experiments, data acquisition, and data analyses were done by MZ and KN. Acquisition of some in vitro experimental data, and surgical procedures were performed by SK, HH, and TF. Genetically engineered mice were primarily developed by MZ, AOL, KWG, and SB with the assistance of MB and DS. Writing of the manuscript was done by MZ and JAA. Experimental designs and overall direction of the experimental work were led by JAA and JWKW. Funding was obtained by JAA and JWKW. Critical review of the manuscript was done by all authors.
Supplementary Material
Acknowledgments
We are grateful to Tuan Nguyen for his assistance with mouse genotyping as well as Takahiro Ito, Damla Oncel, and Antony Aziz for their assistance with clinical liver biopsy studies. We also thank Srinivasa Reddy for providing the LysM-Cre–Tg mice, and Masayuki Yamamoto for sharing the cloning strategy employed in the generation of HO-1 floxed mice (27) and his logistical support in establishing a breeding colony for those mice at UCLA. This work was supported by the National Institute of Environmental Health Sciences (NIEHS), ONES R01 award ES016959 and R56 ES016959-06 (to JAA), Training Grant in Molecular Toxicology T32ES015457 (to MB), NIH grant K01 DK103931 (to SB), and the National Institute of Diabetes and Digestive and Kidney Diseases (NIDDK), R01 DK062357, DK107533, and DK102110 (to JWKW).
Version 1. 10/04/2018
Electronic publication
Funding Statement
(JAA)
(JAA)
(MB)
(SB)
(JWKW)
Footnotes
Conflict of interest: The authors have declared that no conflict of interest exists.
Reference information: JCI Insight. 2018;3(19):e120596. https://doi.org/10.1172/jci.insight.120596.
Contributor Information
Min Zhang, Email: minxinzh@ucla.edu.
Kojiro Nakamura, Email: kojiro@kuhp.kyoto-u.ac.jp.
Shoichi Kageyama, Email: jinbay@kuhp.kyoto-u.ac.jp.
Ke Wei Gong, Email: Kewei@ucla.edu.
May Bhetraratana, Email: mbhe@g.ucla.edu.
Takehiro Fujii, Email: aitake1101@gmail.com.
Dawoud Sulaiman, Email: dsulaiman@g.ucla.edu.
Hirofumi Hirao, Email: sti.hirao@gmail.com.
Subhashini Bolisetty, Email: sbolisetty@uabmc.edu.
Jerzy W. Kupiec-Weglinski, Email: jkupiec@mednet.ucla.edu.
References
- 1.Abraham NG, Junge JM, Drummond GS. Translational significance of heme oxygenase in obesity and metabolic syndrome. Trends Pharmacol Sci. 2016;37(1):17–36. doi: 10.1016/j.tips.2015.09.003. [DOI] [PMC free article] [PubMed] [Google Scholar]
- 2.Araujo JA, Zhang M, Yin F. Heme oxygenase-1, oxidation, inflammation, and atherosclerosis. Front Pharmacol. 2012;3:119. doi: 10.3389/fphar.2012.00119. [DOI] [PMC free article] [PubMed] [Google Scholar]
- 3.Orozco LD, et al. Heme oxygenase-1 expression in macrophages plays a beneficial role in atherosclerosis. Circ Res. 2007;100(12):1703–1711. doi: 10.1161/CIRCRESAHA.107.151720. [DOI] [PubMed] [Google Scholar]
- 4.Yet SF, et al. Absence of heme oxygenase-1 exacerbates atherosclerotic lesion formation and vascular remodeling. FASEB J. 2003;17(12):1759–1761. doi: 10.1096/fj.03-0187fje. [DOI] [PubMed] [Google Scholar]
- 5.Araujo JA, et al. Systemic rather than local heme oxygenase-1 overexpression improves cardiac allograft outcomes in a new transgenic mouse. J Immunol. 2003;171(3):1572–1580. doi: 10.4049/jimmunol.171.3.1572. [DOI] [PubMed] [Google Scholar]
- 6.Katori M, Busuttil RW, Kupiec-Weglinski JW. Heme oxygenase-1 system in organ transplantation. Transplantation. 2002;74(7):905–912. doi: 10.1097/00007890-200210150-00001. [DOI] [PubMed] [Google Scholar]
- 7.Jais A, et al. Heme oxygenase-1 drives metaflammation and insulin resistance in mouse and man. Cell. 2014;158(1):25–40. doi: 10.1016/j.cell.2014.04.043. [DOI] [PMC free article] [PubMed] [Google Scholar]
- 8.Weis N, Weigert A, von Knethen A, Brüne B. Heme oxygenase-1 contributes to an alternative macrophage activation profile induced by apoptotic cell supernatants. Mol Biol Cell. 2009;20(5):1280–1288. doi: 10.1091/mbc.e08-10-1005. [DOI] [PMC free article] [PubMed] [Google Scholar]
- 9.Naito Y, Takagi T, Higashimura Y. Heme oxygenase-1 and anti-inflammatory M2 macrophages. Arch Biochem Biophys. 2014;564:83–88. doi: 10.1016/j.abb.2014.09.005. [DOI] [PubMed] [Google Scholar]
- 10.Sun YY, Li XF, Meng XM, Huang C, Zhang L, Li J. Macrophage phenotype in liver injury and repair. Scand J Immunol. 2017;85(3):166–174. doi: 10.1111/sji.12468. [DOI] [PubMed] [Google Scholar]
- 11.Cheng L, Xing H, Mao X, Li L, Li X, Li Q. Lipocalin-2 promotes M1 macrophages polarization in a mouse cardiac ischaemia-reperfusion injury model. Scand J Immunol. 2015;81(1):31–38. doi: 10.1111/sji.12245. [DOI] [PubMed] [Google Scholar]
- 12.Lee S, et al. Distinct macrophage phenotypes contribute to kidney injury and repair. J Am Soc Nephrol. 2011;22(2):317–326. doi: 10.1681/ASN.2009060615. [DOI] [PMC free article] [PubMed] [Google Scholar]
- 13.Kang JW, Lee SM. Resolvin D1 protects the liver from ischemia/reperfusion injury by enhancing M2 macrophage polarization and efferocytosis. Biochim Biophys Acta. 2016;1861(9 Pt A):1025–1035. doi: 10.1016/j.bbalip.2016.06.002. [DOI] [PubMed] [Google Scholar]
- 14.Li Y, Ma D, Wang Z, Yang J. MicroRNA-155 deficiency in Kupffer cells ameliorates liver ischemia-reperfusion injury in mice. Transplantation. 2017;101(7):1600–1608. doi: 10.1097/TP.0000000000001765. [DOI] [PubMed] [Google Scholar]
- 15.Kadl A, et al. Identification of a novel macrophage phenotype that develops in response to atherogenic phospholipids via Nrf2. Circ Res. 2010;107(6):737–746. doi: 10.1161/CIRCRESAHA.109.215715. [DOI] [PMC free article] [PubMed] [Google Scholar]
- 16.Boyle JJ, et al. Heme induces heme oxygenase 1 via Nrf2: role in the homeostatic macrophage response to intraplaque hemorrhage. Arterioscler Thromb Vasc Biol. 2011;31(11):2685–2691. doi: 10.1161/ATVBAHA.111.225813. [DOI] [PubMed] [Google Scholar]
- 17.Suzuki S, Toledo-Pereyra LH, Rodriguez FJ, Cejalvo D. Neutrophil infiltration as an important factor in liver ischemia and reperfusion injury. Modulating effects of FK506 and cyclosporine. Transplantation. 1993;55(6):1265–1272. doi: 10.1097/00007890-199306000-00011. [DOI] [PubMed] [Google Scholar]
- 18.Fondevila C, et al. The membrane attack complex (C5b-9) in liver cold ischemia and reperfusion injury. Liver Transpl. 2008;14(8):1133–1141. doi: 10.1002/lt.21496. [DOI] [PMC free article] [PubMed] [Google Scholar]
- 19.Tsuchihashi S, Livhits M, Zhai Y, Busuttil RW, Araujo JA, Kupiec-Weglinski JW. Basal rather than induced heme oxygenase-1 levels are crucial in the antioxidant cytoprotection. J Immunol. 2006;177(7):4749–4757. doi: 10.4049/jimmunol.177.7.4749. [DOI] [PubMed] [Google Scholar]
- 20.Nakamura K, et al. Macrophage heme oxygenase-1-SIRT1-p53 axis regulates sterile inflammation in liver ischemia-reperfusion injury. J Hepatol. 2017;67(6):1232–1242. doi: 10.1016/j.jhep.2017.08.010. [DOI] [PMC free article] [PubMed] [Google Scholar]
- 21.Yue S, Zhou H, Wang X, Busuttil RW, Kupiec-Weglinski JW, Zhai Y. Prolonged ischemia triggers necrotic depletion of tissue-resident macrophages to facilitate inflammatory immune activation in liver ischemia reperfusion injury. J Immunol. 2017;198(9):3588–3595. doi: 10.4049/jimmunol.1601428. [DOI] [PMC free article] [PubMed] [Google Scholar]
- 22.Devey L, et al. Tissue-resident macrophages protect the liver from ischemia reperfusion injury via a heme oxygenase-1-dependent mechanism. Mol Ther. 2009;17(1):65–72. doi: 10.1038/mt.2008.237. [DOI] [PMC free article] [PubMed] [Google Scholar]
- 23.Huang J, et al. Adoptive transfer of heme oxygenase-1 (HO-1)-modified macrophages rescues the nuclear factor erythroid 2-related factor (Nrf2) antiinflammatory phenotype in liver ischemia/reperfusion injury. Mol Med. 2014;20:448–455. doi: 10.2119/molmed.2014.00103. [DOI] [PMC free article] [PubMed] [Google Scholar]
- 24.Hull TD, et al. Heme oxygenase-1 regulates myeloid cell trafficking in AKI. J Am Soc Nephrol. 2015;26(9):2139–2151. doi: 10.1681/ASN.2014080770. [DOI] [PMC free article] [PubMed] [Google Scholar]
- 25.Rossi M, et al. Specific expression of heme oxygenase-1 by myeloid cells modulates renal ischemia-reperfusion injury. Sci Rep. 2017;7(1):197. doi: 10.1038/s41598-017-00220-w. [DOI] [PMC free article] [PubMed] [Google Scholar]
- 26.Shen XD, et al. Native macrophages genetically modified to express heme oxygenase 1 protect rat liver transplants from ischemia/reperfusion injury. Liver Transpl. 2011;17(2):201–210. doi: 10.1002/lt.22214. [DOI] [PMC free article] [PubMed] [Google Scholar]
- 27.Mamiya T, et al. Hepatocyte-specific deletion of heme oxygenase-1 disrupts redox homeostasis in basal and oxidative environments. Tohoku J Exp Med. 2008;216(4):331–339. doi: 10.1620/tjem.216.331. [DOI] [PubMed] [Google Scholar]
- 28.Clausen BE, Burkhardt C, Reith W, Renkawitz R, Förster I. Conditional gene targeting in macrophages and granulocytes using LysMcre mice. Transgenic Res. 1999;8(4):265–277. doi: 10.1023/A:1008942828960. [DOI] [PubMed] [Google Scholar]
- 29.Narasimha AJ, et al. Absence of myeloid COX-2 attenuates acute inflammation but does not influence development of atherosclerosis in apolipoprotein E null mice. Arterioscler Thromb Vasc Biol. 2010;30(2):260–268. doi: 10.1161/ATVBAHA.109.198762. [DOI] [PMC free article] [PubMed] [Google Scholar]
- 30.Hull TD, et al. Heme oxygenase-1 expression protects the heart from acute injury caused by inducible Cre recombinase. Lab Invest. 2013;93(8):868–879. doi: 10.1038/labinvest.2013.74. [DOI] [PMC free article] [PubMed] [Google Scholar]
- 31.Yin F, et al. Diesel exhaust induces systemic lipid peroxidation and development of dysfunctional pro-oxidant and pro-inflammatory high-density lipoprotein. Arterioscler Thromb Vasc Biol. 2013;33(6):1153–1161. doi: 10.1161/ATVBAHA.112.300552. [DOI] [PubMed] [Google Scholar]
- 32.Shen XD, et al. CD154-CD40 T-cell costimulation pathway is required in the mechanism of hepatic ischemia/reperfusion injury, and its blockade facilitates and depends on heme oxygenase-1 mediated cytoprotection. Transplantation. 2002;74(3):315–319. doi: 10.1097/00007890-200208150-00005. [DOI] [PubMed] [Google Scholar]
- 33.Zhang X, Goncalves R, Mosser DM. The isolation and characterization of murine macrophages. Curr Protoc Immunol. 2008;Chapter 14:Unit 14.1. doi: 10.1002/0471142735.im1401s83. [DOI] [PMC free article] [PubMed] [Google Scholar]
- 34.Barajas B, et al. NF-E2-related factor 2 promotes atherosclerosis by effects on plasma lipoproteins and cholesterol transport that overshadow antioxidant protection. Arterioscler Thromb Vasc Biol. 2011;31(1):58–66. doi: 10.1161/ATVBAHA.110.210906. [DOI] [PMC free article] [PubMed] [Google Scholar]
- 35.Kamo N, et al. ASC/caspase-1/IL-1β signaling triggers inflammatory responses by promoting HMGB1 induction in liver ischemia/reperfusion injury. Hepatology. 2013;58(1):351–362. doi: 10.1002/hep.26320. [DOI] [PMC free article] [PubMed] [Google Scholar]
Associated Data
This section collects any data citations, data availability statements, or supplementary materials included in this article.


