Abstract
A one-step dual flow immunochromatographic assay (DICGA), based on a competitive format, was developed for simultaneous quantification of ochratoxin A (OTA) and zearalenone (ZEN) in corn, wheat, and feed samples. The limit of detection for OTA was 0.32 ng/ml with a detection range of 0.53‒12.16 ng/ml, while for ZEN it was 0.58 ng/ml with a detection range of 1.06‒39.72 ng/ml. The recovery rates in corn, wheat, and feed samples ranged from 77.3% to 106.3% with the coefficient of variation lower than 15%. Naturally contaminated corn, wheat, and feed samples were analyzed using both DICGA and liquid chromatography-tandem mass spectrometry (LC-MS/MS) and the correlation between the two methods was evaluated using a regression analysis. The DICGA method shows great potential for simple, rapid, sensitive, and cost-effective quantitative detection of OTA and ZEN in food safety control.
Keywords: Immunochromatographic assay, Gold nanoparticles, Ochratoxin A, Zearalenone, Quantification
1. Introduction
Mycotoxins are toxic secondary metabolites produced by fungi of various genera such as Aspergillus, Fusarium, and Penicillium (Liu DW et al., 2016). Ochratoxin A (OTA) and zearalenone (ZEN) are often found in corn, wheat, and cereal products (Alshannaq and Yu, 2017; Lee and Ryu, 2017). ZEN, an estrogenic and carcinogenic mycotoxin produced by some Fusarium species (Pierron et al., 2016; Yang et al., 2017), can cause severe damage to the reproductive system of humans and animals (Long et al., 2016). OTA, produced by fungi of the Aspergillus and Penicillium families, is one of the most abundant and toxic members of ochratoxins (Torović, 2018). It has nephrotoxic, hepatotoxic, teratogenic, and immunotoxic properties. Previous studies suggest that ZEN, OTA, and other mycotoxins may coexist in a single product and hence could synergize the toxicity (Yan et al., 2015; Cheat et al., 2016). To guarantee food safety, the European Union has established the provisional maximum tolerable levels of 5 and 100 μg/kg in unprocessed cereals for OTA and ZEN, respectively (Yang et al., 2012; Majdinasab et al., 2015).
Chromatographic methods, such as thin-layer chromatography (de Lima Rocha et al., 2017), liquid chromatography-tandem mass spectrometry (LC-MS/MS) (Bernhardt et al., 2016; Sun et al., 2017) and high-performance liquid chromatography (HPLC) (Asghar et al., 2016), are often used for detection of multiple mycotoxins in food or feed samples. Although these technologies produce sensitive and reliable results, the complex preparatory steps, expensive equipment, or time-consuming procedures make such assays unsuitable for on-site detection. High throughput immunoassays such as microarray-based methods (Schmidt-Heydt and Geisen, 2007), multiplex flow cytometric immunoassay (Bienenmann-Ploum et al., 2013), and antibody immunochip have proven to be excellent methods for multi-component analysis (Wang et al., 2012). However, the need for special instruments and skilled technicians restricts the extensive use of these methods.
Occurrence of multiple mycotoxins in food and feed has encouraged the need for rapid and cost-effective methods for simultaneous detection. In recent years, studies have focused on gold nanoparticles (GNPs)-based immunochromatographic assay (ICGA) for mycotoxin detection (Wang et al., 2016; Sun et al., 2017; Urusov et al., 2017). ICGA is a rapid method that can be used onsite at low cost for determination of mycotoxins because GNPs are visible, and the results can be observed with the naked eye or with a portable densitometric analyzer.
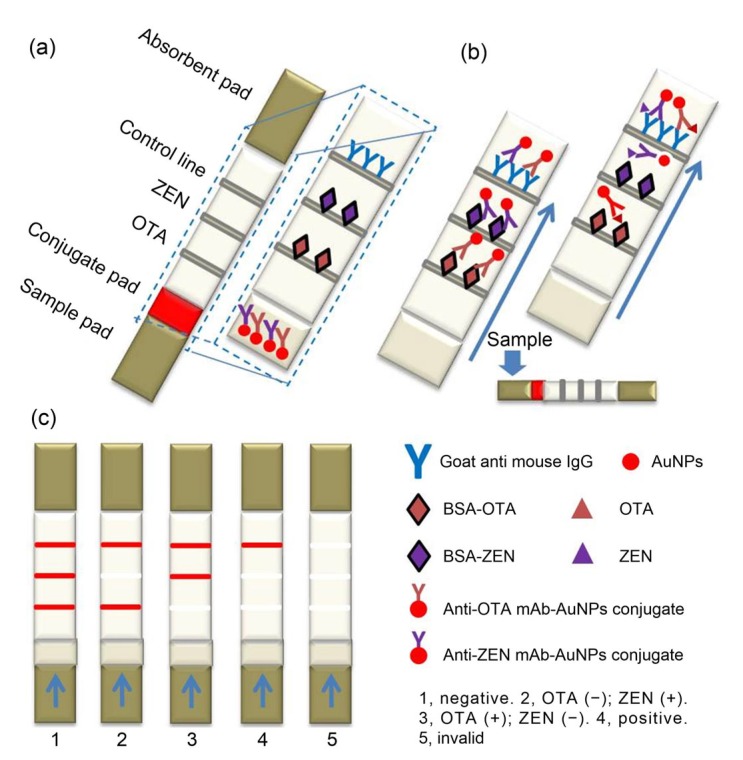
We developed a dual immunochromatographic assay (DICGA) for rapid quantitative detection of OTA and ZEN in agro-products. The composition and schematic diagram of the DICGA are shown in Fig. 1. The nitrocellulose (NC) membrane of the DICGA strips was coated with OTA-ovalbumin (OVA), ZEN-bovine serum albumin (BSA), and goat anti-mouse IgG as the OTA test line, ZEN test line, and control line, respectively. Monoclonal antibodies against OTA or ZEN were labeled with colloidal GNPs, and the conjugates were sprayed onto the conjugate pad. Quantization was obtained by interpolating into a calibration curve, the densitometric read-outs being obtained by a portable test strip reader. Parallel analysis of corn, wheat, and feed samples showed a good correlation between this DICGA and LC-MS/MS.
Fig. 1.
Schematic illustrations of the DICGA strip format (a), immunoassay procedure for negative or positive samples (b), and readouts of test results (c)
2. Materials and methods
2.1. Materials
OTA, ZEN, BSA, OVA, tetrachloroauric (III) acid, N,N'-dicyclohexylcarbodiimide (DCC), carboxymethoxylamine hemihydrochloride (CMO), and N-hydroxy-succinimide (NHS) were purchased from Sigma Chemical Co. (St. Louis, MO, USA). Monoclonal antibodies against OTA and ZEN were prepared in our lab. Different types of NC membranes (Millipore 180, PALL VividTM170, Sartorius UniSart CN140, YN120B, YNHS120B, and YNHS140B), glass fiber, polyester film, and absorbent pads were purchased from Aowei Biotech (Hangzhou, China). Goat anti-mouse IgG antibody (used in DICGA) was purchased from Jiening Biotech (Shanghai, China). Other reagents of analytical grade were purchased from Sinopharm Chemical Reagent Co. Ltd. (Shanghai, China). OTA-free and ZEN-free samples (as confirmed by LC-MS/MS) as well as naturally contaminated corn, wheat, and feed samples were provided by the Zhejiang Entry Exit Inspection and Quarantine Bureau.
2.2. Equipment
The following equipment was used: Spectra Max M2 micro-plate reader (Molecular Devices, Sunnyvale, CA, USA), NanoDrop 1000 ultraviolet spectrophotometer (Thermo Scientific, Waltham, MA, USA), XYZ3060 Dispensing Platform, LM4000 Batch Laminator and CM4000 Guillotine Cutter (BioDot, Irvine, USA), Milli-Q ultrapure water purification system (Millipore, MA, USA), and portable test strip reader (Aowei, Zhejiang, China).
2.3. Synthesis of OTA and ZEN conjugates
Conjugates of OTA (OTA-BSA and OTA-OVA) were made as suggested in previous studies (Kawamura et al., 1989; Zhang et al., 2015a). OTA was dissolved in anhydrous tetrahydrofuran, and then NHS and DCC were added followed by gentle shaking at room temperature (RT). The reaction mixture was centrifuged, and the supernatant was dried and then dissolved in dimethyl sulfoxide (DMSO). BSA was dissolved in 0.13 mol/L phosphate-buffered saline (PBS; pH 8.0). Activated OTA was added dropwise to the BSA solution. The reaction was allowed to proceed by vigorous shaking at RT and then dialyzed extensively against 0.01 mol/L PBS (pH 7.4). The OTA-OVA conjugate was also prepared in a similar manner.
ZEN conjugates (ZEN-BSA and ZEN-OVA) were prepared as recommended (Gendloff et al., 1986; Zhang et al., 2015b). Zearalenone-6'-carboxyme-thyloxime (ZEN-O) was synthesized by ZEN and CMO. The reaction mixture was vacuum-dried and dissolved in distilled water (pH 8.0). After three partitions with benzene, free ZEN was removed. The reaction mixture in the aqueous phase was then precipitated by addition of HCl (pH 3.0) and extracted four times with ethyl acetate. The extract was vacuum-dried. The residue was dissolved in anhydrous tetrahydrofuran and added to DCC and NHS. After shaking gently at RT, sodium bicarbonate buffer containing BSA was added gently and stirred for 30 min. Finally, the solution was centrifuged to discard the precipitates and the supernatant was dialyzed against 0.01 mol/L PBS (pH 7.4). The same method was used to prepare ZEN-OVA conjugate.
Enzyme-linked immunosorbent assay (ELISA) was used to confirm the conjugates by the standard procedure (Liu R et al., 2016; Song et al., 2017). OTA-BSA (OTA-OVA) or ZEN-BSA (ZEN-OVA) was immobilized on polystyrene 96-well plates and then the coated antigens were probed with their specific monoclonal antibody, followed by the addition of goat anti-rabbit IgG-horseradish peroxidase (HRP) to each well. Color development was achieved by the addition of the substrate 3,3',5,5'-tetramethylbenzidine (TMB). Stop solution (2 mol/L H2SO4) was added and the absorbance was read at 450 nm. BSA and OVA were also immobilized as a negative control.
2.4. Preparation of gold nanoparticles
Colloidal GNPs were prepared by the sodium citrate method as described previously (Frens, 1973; Liu et al., 2017) with slight modifications. Tetrachloroauric (III) acid (100 ml, 0.1 g/L) was heated with stirring until boiling. Then, 1.000, 0.750, and 0.375 ml of 0.02 g/ml sodium citrate solutions were added quickly to prepare GNPs with different diameters. The mixture was heated for 5 min and cooled to RT. Prepared GNPs were characterized by naked eyes and transmission electron microscopy (TEM).
2.5. Preparation of gold nanoparticle-labeled monoclonal antibodies
GNP-labeled monoclonal antibodies (GNP-mAbs) were prepared and the pH of the GNP solutions and monoclonal antibody concentrations were adjusted individually (Wu et al., 2010; Wang et al., 2013b). A total of 2 ml of 10 mmol/L borate buffer (BB, pH 7.4) containing mAb-OTA (9.6 μg/ml) or mAb-ZEN (4.2 μg/ml) was added dropwise to the GNP solution (at optimum pH 8.0 for mAb-OTA labeling and pH 7.2 for mAb-ZEN labeling) under gentle stirring. The mixture was stirred for 45 min at RT. Then, 2 ml of 0.1 g/ml BSA was added and stirred for another 45 min. The product was centrifuged at 1500g for 15 min. The supernatant was collected and centrifuged at 12 000g for 30 min. The resulting pellet (GNP-labeled mAb-OTA or GNP-labeled mAb-ZEN) was washed three times and resuspended in 2 ml of 2 mmol/L BB (pH 7.4) containing 0.01 g/ml BSA, 0.06 g/ml sucrose, 0.2% poly(ethylene glycol) 2000 (PEG 20000) and 0.5 g/L sodium azide.
2.6. Preparation of DICGA strips for simultaneous detection of OTA and ZEN
The goat anti-mouse IgG antibody and two conjugated antigens were sprayed onto the NC membrane using the BioDot XYZ3060 Platform. The antigen conjugates were sprayed as test lines and the goat anti-mouse antibody as control line (Fig. 1). The distance between the lines was 4 mm. The NC membranes were dried at 37 °C for 1 h and stored in a desiccator to prevent dampening. The glass fiber, including the conjugate and sample pads, was pretreated with blocking buffer and stored at 4 °C after freeze-dehydration. The two diluted GNP-mAbs were mixed, applied to the treated conjugate pad at a proper spray rate, and dried with the vacuum freeze drier. To assemble the test strip, the NC membrane, conjugate pad, sample pad, and absorbent pad were laminated and pasted onto the polyvinyl chloride (PVC) baseplate. The assembled backing was divided into strips and installed in the dipstick shell.
2,7. Optimization of the DICGA test
Analytical performance of the DICGA strips is affected by various parameters, such as the diameters of the GNPs, types of materials (including NC membrane, conjugate pad, and sample pad), kinds of buffers, and concentrations of immunoreagents (Li et al., 2013).
Monoclonal antibodies were labeled with GNPs of different diameters. The stability and detection sensitivity of these GNP-labeled antibodies were evaluated. Six types of NC membrane, three types of conjugated pad (SB06, SB08, and 6613), and two types of sample pad (SB06 and SB08) were also tested.
Blocking buffers for the conjugate and sample pads were evaluated to assess their effects on monoclonal antibodies (mAb-OTA and mAb-ZEN) and analytes (OTA and ZEN). The buffers for antigen or antibody coating and sample pad pretreatment as well as for dilution and storage of GNP-labeled antibodies were optimized. Types of components and their concentrations in the buffers were adjusted by assessing the stability of GNP-labeled antibodies and detecting the effect. Dilution ratios (1:3, 1:5, 1:7, and 1:9) of the sample extracts were also investigated to decrease matrix interference.
Concentrations of the immunoreagents were optimized with ELISA using the checkerboard design. The following considerations were taken into account: time period (<20 min), complete release of the GNP-labeled antibodies from the conjugate pad to minimize the background color (clarity of the lines), high sensitivity, and minimum consumption of immunoreagents.
2.8. Sample preparation
The OTA-and ZEN-free samples (of corn, wheat, and feed) were ground and dried by overnight incubation in a 60 °C incubator. The sample was then spiked by dropwise addition of OTA and ZEN standard solutions, mixed thoroughly, and allowed to stand at RT overnight. The concentrations used for spiking the samples were 20, 40, 80 μg/kg for OTA and 50, 100, 200 μg/kg for ZEN.
For DICGA testing, the spiked sample (5.0 g each) was extracted with 25 ml methanol/water (7:3, v/v) at RT. The sample was vortexed for 10 min and centrifuged at 2500g for 5 min. The mixture was filtered through glass-fiber filter paper and the filtrate diluted with 50 mmol/L PBS (pH 7.4) containing 0.05% Tween 20 (PBST).
2.9. Test procedure, calibration curves, and limit of detection
A series of OTA or ZEN standard solutions were prepared in PBS (50 mmol/L). The standard solutions (50 μl each) were added to the sample pads. The densitometric read-out was obtained by the portable reader device after reaction (15 min). Concentrations of OTA or ZEN in the samples were interpolated from the calibration curves (intensity of test lines versus log concentrations of OTA or ZEN in the standard solutions), which were run simultaneously in triplicate. The spiked samples were tested three times in one day and repeated three times on different days. The food and feed samples were simultaneously analyzed by DICGA and LC-MS/MS as described below. Correlation between the results of DICGA and LC-MS/MS was examined using linear regression (Microsoft Excel 2016).
2.10. LC-MS/MS analysis
The samples were ground and dried overnight in a 60 °C incubator before extraction. Each sample (10 g) was extracted with a solvent mixture (40 ml, acetonitrile/water/acetic acid, 79:20:1, v/v/v) by shaking on a horizontal shaker for 60 min at RT. The extract was left standing for 10 min and centrifuged at 2500g for 20 min. The supernatant was then mixed with an equal volume of a solvent mixture (acetonitrile/water/acetic acid, 20:79:1, v/v/v), and passed through a 0.22-μm filter before being injected into the columns of the LC-MS/MS instrument. Quantitative LC-MS/MS results were analyzed using Analyst software (AB SCIEX, Framingham, MA, USA).
3. Results
3.1. Identification of the conjugates and gold nanoparticles
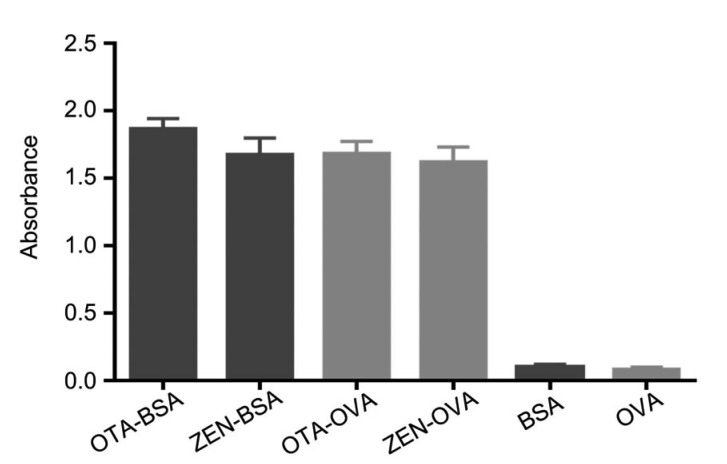
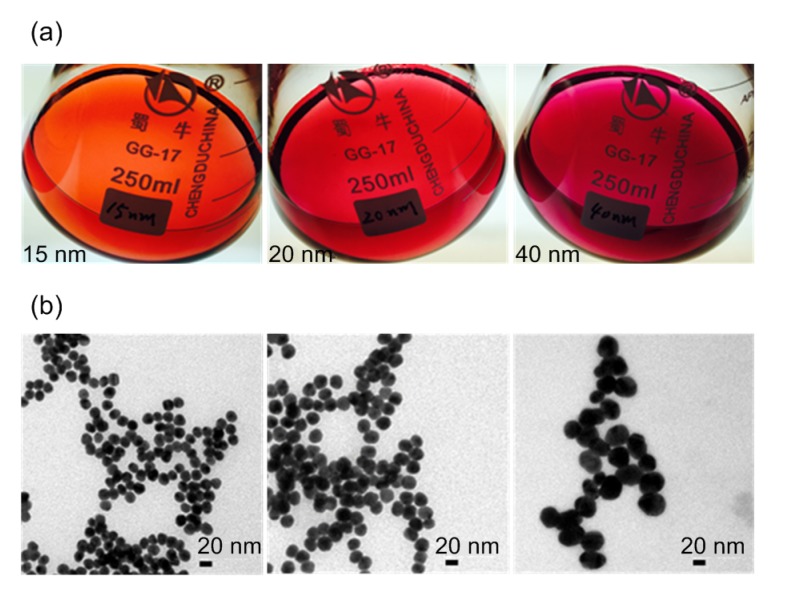
OTA and ZEN conjugates (OTA-BSA, OTA-OVA, ZEN-BSA, and ZEN-OVA) were evaluated using the monoclonal antibodies 2D8 and 2C9 by indirect ELISA (Fig. 2). High ratios of the absorbance values of all the conjugates to negative control (>20) at the optical density at 450 nm (OD450) indicated that the conjugates could be detected by their specific monoclonal antibody while the control remained at basal absorbance level. These results suggested successful antigen conjugation. GNPs with different diameters (15, 20, and 40 nm) were prepared. The GNP solution was transparent and homogenous as shown in Fig. 3.
Fig. 2.
Absorbance of the OTA and ZEN conjugates by indirect ELISA using their specific monoclonal antibodies
Data are expressed as mean±standard deviation (n=3)
Fig. 3.
Colloidal solution of various-diameter gold nanoparticles (left to right: 15, 20, 40 nm)
(a) Visualization by naked eye; (b) Images from transmission electron microscope
3.2. Optimization of the DICGA
Monoclonal antibodies labeled with 40 nm-GNPs were almost as sensitive as 20 nm-GNPs (detection limits of OTA and ZEN were 0.32 and 0.58 ng/ml, respectively), and more sensitive than the 15 nm-GNPs (detection limits of OTA and ZEN were 1.53 and 1.79 ng/ml, respectively). Moreover, 40 nm-GNPs labeled antibodies were more stable when stored at 4 °C (the 40 nm-GNPs-labeled antibodies were stable at one month while the 20 nm-GNPs were stable for two weeks only). Overall, 40 nm-GNPs had the best performance in terms of detection limits and stability.
Different materials can affect the sensitivity, test time, and stability of the strips. The NC membrane Sartorius UniSart CN 140 produced the highest sensitivity in 15‒20 min without any background color. The conjugate pad 6613 performed well in protecting and releasing the GNP-labeled antibodies. The sample pad SB08 is better in holding a larger volume of solution thus increasing color intensity of the test strip.
The sample and conjugate pads were made of glass fiber and pretreated with blocking buffer before applying the reagents. In this study, PBS (0.01 mol/L, pH 7.4) containing 0.02 g/ml OVA, 0.02 g/ml sucrose, and 0.2 g/L NaN3 was chosen as the optimal blocking buffer for pretreatment of the sample and conjugate pads.
The intensity of test lines, stability, and release rate of the mixtures (GNP-antibodies and sample extract), all related to the sensitivity of the DICGA method, also could be markedly affected by the types of buffers and concentrations of their components. In this detection method, BB (50 mmol/L, pH 8.0) containing 0.05 g/ml trehalose, 0.01 g/ml OVA, and 0.2 g/L NaN3 was used in storage, dilution, and conjugation of GNP-labeled antibodies.
Combinations of OTA-BSA/OTA-OVA and ZEN-BSA/ZEN-OVA were evaluated to increase the sensitivity for simultaneous detection of OTA and ZEN, respectively. We observed that OTA-OVA and ZEN-BSA had lower cut-off limits than OTA-BSA and ZEN-OVA under the same conditions. Concentrations of the immunoreagents (the coating antigens and GNP-labeled antibodies) were evaluated using checkerboard titration in ELISA. The results showed that the optimum ratio of the GNP-labeled mAb-OTA and GNPs-labeled mAb-ZEN was 1:4 (v/v) to generate similar intensity of the two test lines. Optimum concentrations of the coating antigen were 0.3 mg/ml for OTA-OVA and 0.1 mg/ml for ZEN-BSA. Optimal conditions of the test strips are shown in Table S1 and optimum concentrations of additives in the quantitative DICGA are shown in Table S2.
3.3. Evaluation of the DICGA
3.3.1 Specificity
The specificity of the DICGA test strips is of great importance and was evaluated for simultaneous detection of multiple mycotoxins in mixtures. Cross-reactivity was calculated as percent inhibition using the formula: half maximal inhibitory concentration (IC50) of OTA (ZEN)/IC50 of other mycotoxins×100% (Zhang et al., 2015a). Using the optimized DICGA method, the cross-reactivities with the OTA analogues (OTB and OTC) were 6.7% and 11.6%, respectively; with ZEN analogues (α-zearalanol, zearalanone, α-zearalenol, β-zearalenol, and β-zearalanol), they were 18.6%, 13.7%, 7.2%, 2.9%, and 1.3%, respectively (Table 1).
Table 1.
Specificity of the dual flow immunochromatographic assay
| Mycotoxin | IC50 (ng/ml) | Cross-reactivity (%) |
| OTA | 2.63 | 100.0 |
| OTB | 39.25 | 6.7 |
| OTC | 22.67 | 11.6 |
| ZEN | 6.49 | 100.0 |
| α-Zearalanol | 34.89 | 18.6 |
| Zearalanone | 47.37 | 13.7 |
| α-Zearalenol | 90.14 | 7.2 |
| β-Zearalenol | 223.79 | 2.9 |
| β-Zearalanol | 499.23 | 1.3 |
| FB1 | ND | <0.01* |
| AFB1 | ND | <0.01 |
| DON | ND | <0.01 |
OTA: ochratoxin A; OTB: ochratoxin B; OTC: ochratoxin C; ZEN: zearalenone; FB1: fumonisin B1; AFB1: aflatoxin B1; DON: deoxynivalenol; ND: not detectable.
Cross-reactivity at less than 0.01%
Despite the high structural similarity between ZEN (OTA) and its analogues, the obtained degree of cross-reactivity (in this method) was relatively low and is acceptable as compared to other reports (Burkin et al., 2002; Burmistrova et al., 2009; Wang et al., 2013a; Sun et al., 2014; Zhang et al., 2018). No cross-reactivity (<0.01%) was observed with other mycotoxins which usually occur together in cereal and feed samples, including fumonisin B1 (FB1), aflatoxin B1 (AFB1), and deoxynivalenol (DON). These were consistent with the results of our previous studies on the specificity of these two monoclonal antibodies (Zhang et al., 2015a, 2015b). Therefore, this new test strip has good specificity and could be applied for simultaneous detection of OTA and ZEN.
3.3.2 Calibration curves, sensitivity, and matrix interference of DICGA
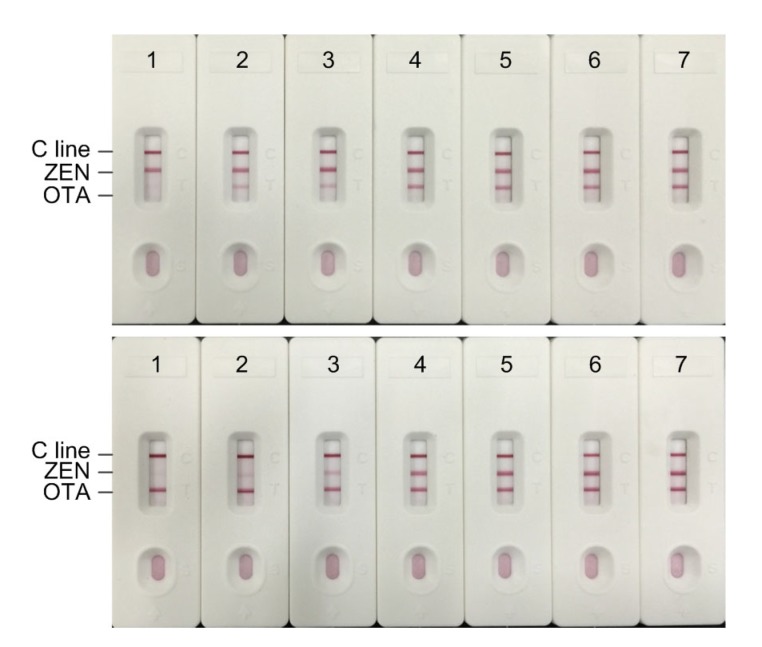
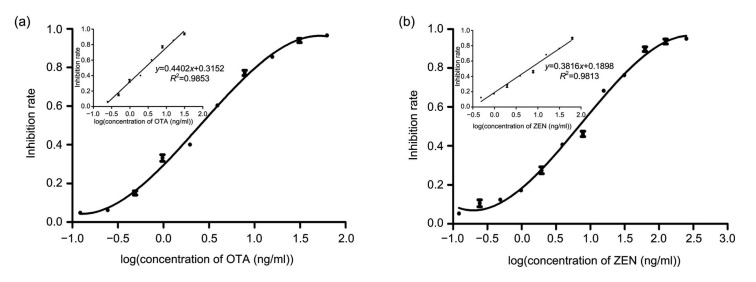
Fig. 4 shows the typical signals of different concentrations of OTA and ZEN standards which were captured by the strip reader. The digital results were used to determine the calibration curves of OTA and ZEN (Fig. 5). A linear range of detection was calculated as the concentration of OTA or ZEN leading to 20%‒80% inhibition (Wang et al., 2013a). The limit of detection was defined as the unique average concentration corresponding to three standard deviations from the average signals of OTA or ZEN-free samples (n=5) (Chun et al., 2009). The linear equation for OTA was y=0.4402x+0.3152 (R 2=0.9853). The linear range for detection of OTA was 0.53‒12.16 ng/ml. The detection limit was 0.32 ng/ml. For ZEN, the linear equation was y=0.3816x+0.1898 (R 2=0.9813) and the detection range was 1.06‒ 39.72 ng/ml with the detection limit of 0.58 ng/ml.
Fig. 4.
Visual observation of the results of DICGA strips for OTA (top) or ZEN (bottom) standard solution
The concentrations of OTA (top) from 1 to 7: 25, 15, 5, 2.5, 1.25, 0.625, and 0 ng/ml, and those of ZEN (bottom) from 1 to 7: 50, 25, 15, 5, 2.5, 1.25, and 0 ng/ml
Fig. 5.
Tri-parametric curve fitting of log concentrations of OTA (a) and ZEN (b) vs. inhibition rate in the DICGA method
The inserts are the calibration curves for quantification of OTA or ZEN. Data are expressed as mean±standard deviation (n=3)
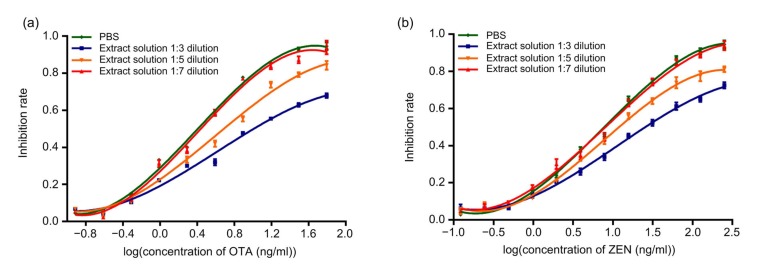
In this detection assay, methanol/water (7/3, v/v) was used as the extraction solution, and OTA and ZEN calibration curves were generated in different dilutions of extract solution prepared in PBS. Under the identical experimental conditions used in DICGA, we suggest that 1:7 dilution is enough to minimize the matrix effect because its inhibition curve closely matched the curve of the PBS control, indicating that the matrix effect was minimized (Fig. 6). This dilution was used for recovery test and sample detection.
Fig. 6.
Matrix interferences of extract solution spiked with OTA (a) and ZEN (b) diluted in different ratios with PBS as measured by DICGA
Data are expressed as mean±standard deviation (n=3)
3.3.3 Recovery study
Different concentrations of OTA-and ZEN-spiked corn, wheat, and feed samples were analyzed using the DICGA. The recovery rates using this DICGA ranged from 77.3% to 106.3% with a coefficient of variation lower than 15%, indicating that the method has good precision and reproducibility (Table 2).
Table 2.
Recovery and coefficient of variances of samples spiked with three levels of OTA and ZEN
| Sample | Spiked (μg/kg) |
Detected (μg/kg) |
Intra-assaya RSD (%) |
Inter-assayb RSD (%) |
Recovery rate (%) |
|||||
| OTA | ZEN | OTA | ZEN | OTA | ZEN | OTA | ZEN | OTA | ZEN | |
| Corn | 20 | 50 | 17.33 | 43.76 | 7.4 | 6.1 | 8.5 | 9.4 | 86.7 | 87.5 |
| 40 | 100 | 32.46 | 106.31 | 7.2 | 7.6 | 9.3 | 8.6 | 81.2 | 106.3 | |
| 80 | 200 | 67.13 | 181.35 | 6.9 | 7.3 | 8.2 | 8.7 | 83.9 | 90.7 | |
| Wheat | 20 | 50 | 18.27 | 46.13 | 8.1 | 8.3 | 10.6 | 9.1 | 91.4 | 92.3 |
| 40 | 100 | 30.92 | 87.15 | 7.8 | 8.9 | 9.2 | 9.8 | 77.3 | 87.2 | |
| 80 | 200 | 67.73 | 173.85 | 8.5 | 7.1 | 8.4 | 9.3 | 84.7 | 86.9 | |
| Feedstuff | 20 | 50 | 16.57 | 41.17 | 8.7 | 7.9 | 8.2 | 8.9 | 82.9 | 82.3 |
| 40 | 100 | 32.69 | 94.07 | 8.3 | 6.8 | 9.5 | 10.1 | 81.7 | 94.1 | |
| 80 | 200 | 73.21 | 183.62 | 7.9 | 8.4 | 8.9 | 9.7 | 91.5 | 91.8 | |
Intra-assay variation was determined by three separate tests of each spiked level on the same day.
Inter-assay variation was from three separate tests every other day. RSD: relative standard deviation
3.3.4 Detection in food and feed samples
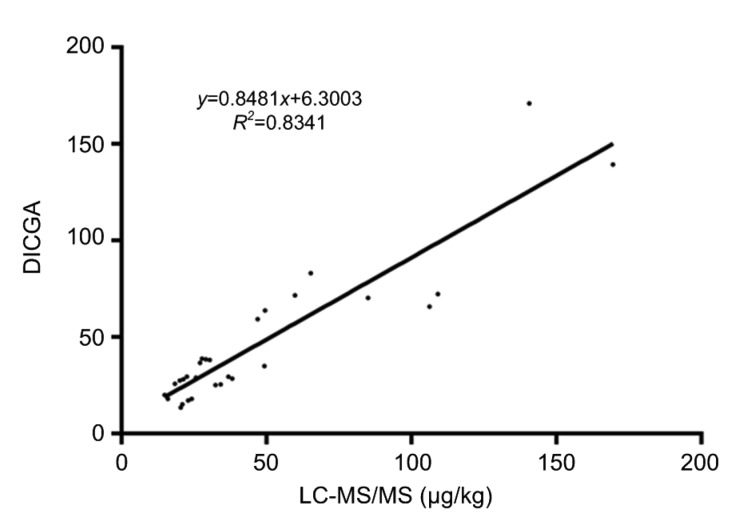
Of the 56 corn, wheat and feed samples tested by both DICGA and LC-MS/MS, 14 (5 for corn, 4 for wheat, and 5 for feed) tested positive for OTA and 16 (5 for corn, 5 for wheat, and 6 for feed) positive for ZEN (Table 3). The others were negative for both mycotoxins by both methods (data not shown). Regression analysis of the quantitative data of these positive samples indicated that the two methods were in good agreement (Fig. 7).
Table 3.
Comparison between DICGA and LC-MS/MS for quantification of OTA and ZEN in corn, wheat, and feed samples
| Sample | DICGA (μg/kg) |
LC-MS/MS (μg/kg) |
||
| OTA | ZEN | OTA | ZEN | |
| Corn 1 | 19.99±2.21 | 14.87±0.11 | ||
| Corn 2 | 72.91±4.18 | 109.14±0.06 | ||
| Corn 3 | 70.22±3.43 | 85.03±0.29 | ||
| Corn 4 | 25.71±2.24 | 32.36±0.14 | ||
| Corn 5 | 28.43±3.02 | 38.19±0.21 | ||
| Corn 6 | 17.12±0.75 | 22.94±0.02 | ||
| Corn 7 | 28.95±2.51 | 25.57±0.01 | ||
| Corn 8 | 28.15±1.68 | 21.25±0.11 | ||
| Corn 9 | 13.34±1.16 | 20.42±0.07 | ||
| Corn 13 | 83.05±6.38 | 65.23±0.11 | ||
| Wheat 1 | 15.12±0.95 | 20.99±1.01 | ||
| Wheat 2 | 34.92±1.18 | 49.24±0.12 | ||
| Wheat 3 | 38.41±3.27 | 29.07±0.16 | ||
| Wheat 4 | 139.47±8.91 | 169.66±0.11 | ||
| Wheat 5 | 38.74±3.24 | 27.71±0.03 | ||
| Wheat 6 | 25.41±2.29 | 34.21±0.19 | ||
| Wheat 7 | 63.77±5.24 | 38.21±1.88 | 49.55±0.04 | 29.14±0.11 |
| Wheat 12 | 17.84±1.78 | 24.19±0.44 | ||
| Feed 1 | 29.49±2.97 | 36.86±0.09 | ||
| Feed 3 | 27.42±0.87 | 20.01±0.01 | ||
| Feed 5 | 71.54±3.04 | 59.88±0.03 | ||
| Feed 7 | 59.31±2.71 | 65.79±6.65 | 46.92±0.02 | 106.27±1.02 |
| Feed 8 | 25.13±1.48 | 32.36±0.14 | ||
| Feed 9 | 29.37±2.02 | 22.46±0.15 | ||
| Feed 10 | 171.12±9.74 | 140.75±0.51 | ||
| Feed 11 | 38.11±4.47 | 30.34±2.19 | ||
| Feed 12 | 36.62±1.27 | 27.03±0.31 | ||
| Feed 13 | 17.92±1.71 | 15.97±0.01 | ||
Data are expressed as mean±standard deviation (n=3)
Fig. 7.
Correlation of quantitative data of OTA and ZEN in corn, wheat, and feed samples obtained by DICGA and LC-MS/MS
4. Discussion
A one-step DICGA, as developed in this study, offers simultaneous and sensitive detection of OTA and ZEN. Two antigens specific to individual mycotoxins are immobilized as test lines, thus enabling the detection of two types of mycotoxins on one single test strip within 20 min. Quantization of the assay is obtained by using a portable strip color intensity reader.
The results of this study show that 40 nm colloidal GNPs are superior in terms of their stability, detection limits, and performance. This is consistent with previous reports (Molinelli et al., 2009; Shim et al., 2009b). Buffer used in pretreatment is important in determining the stability and dissolution properties of the GNP-labeled antibodies. One of the compounds in the pretreatment buffer (blocking buffer) is protein. Previous reports (Perry et al., 2003; Majdinasab et al., 2015) suggested that OTA can bind to serum proteins, especially serum albumin, with different affinities to albumins from different species. In this study, blocking buffer with BSA or OVA was evaluated to achieve the optimal performance. Our results showed that the OVA and BSA interacted differently with OTA. When BSA was used, the OTA test line showed a weak pink band even with high concentration of OTA, indicating that the strip exhibited low sensitivity. However, when OVA was used, the test line was clear and the test strip for detection of OTA showed high sensitivity. A blocking buffer containing either BSA or OVA had no effect on the performance of the test strip for ZEN. Earlier studies (Shim et al., 2009b; Wang et al., 2013b) reported the use of sucrose as a protectant to the GNP-labeled antibodies in solution. Therefore, different concentrations of OVA and sucrose in pretreatment buffer were also evaluated in this study. PBS (0.01 mol/L, pH 7.4) containing 0.02 g/ml OVA, 0.02 g/ml sucrose, and 0.2 g/L NaN3 was chosen as the optimal blocking buffer for pretreatment of the sample and conjugate pads.
The sensitivity of the DICGA method also depends on various factors such as the intensity of test lines, stability, and release rate of the mixtures (GNP-antibodies and sample extract). To improve this sensitivity, we also evaluated the types of buffers and concentrations of their components. In earlier reports (Kolosova et al., 2007; Guo et al., 2009; Molinelli et al., 2009; Shim et al., 2009b; Byzova et al., 2010; Song et al., 2011), the buffers used were mainly 10 to 50 mmol/L PBS or BB of pH 7.4 to 9.0. Trehalose and blocking protein are also usually included. Previously, it was indicated that the BB was more suitable than PBS (Wang et al., 2013b). We used 50 mmol/L BB at pH 8.0 and containing 0.05 g/ml trehalose in our experiments.
Concentrations of the coating antigens (OTA-OVA and ZEN-BSA) and GNP-labeled antibodies were optimized to balance the appearance of the clear pink color and cut-off limits of the two test lines. Clarity of the lines, along with appearance of pink color on the test lines for negative samples, optimum cut-off limits and minimum use of immunoreagents were all taken into consideration. High background color may appear when the GNP-labeled antibodies are not released completely within 20 min from the conjugate pad.
The detection limit for OTA (ZEN) of this DICGA is lower than those of previously reported single ICGAs (Cho et al., 2005; Shim et al., 2009a; Anfossi et al., 2012; Luo et al., 2013; Sun et al., 2014; Ji et al., 2017). Compared with multi-components ICGAs (Shim et al., 2009b; Huang et al., 2012; Li et al., 2013; Wang et al., 2013b; Sun et al., 2016), detection ranges or sensitivities of this method are also superior. The comparative results are shown in Table S3. Highly sensitive ICGAs for the detection of OTA have been established by other researchers (Majdinasab et al., 2015; Zhang et al., 2018), but for the detection of co-existing mycotoxins in cereal and feedstuff samples, multiple quantitative test assays, such as the DICGA described herein, will be more efficient at satisfying the need of detection. As compared to quantitative ELISA, this assay is easy to operate and less expensive, and the results can be obtained in a short time (20 min).
In summary, this method possesses good accuracy and reproducibility, and has good agreement with LC-MS/MS. It is suitable for rapid detection of OTA and ZEN in corn, wheat, and feed samples. Further work is currently being undertaken to integrate more than two targets on a single strip. The results, if successful, will demonstrate a powerful tool for monitoring mycotoxins and other small molecules in food and the environment. This study serves as a reliable basis for devising test kits to detect other multiple mycotoxins as well as low-weight analytes in food or feed samples to protect human and animal health.
List of electronic supplementary materials
Optimal conditions of the dual flow immunochromatographic assay
Buffer types, optimum buffers, and optimum concentrations of additives in the dual flow immunochromatographic assay
Comparison of results of gold nanoparticles-based immunochromatographic assay published in the past
Footnotes
Project supported by the Natural Science Foundation of Zhejiang Province (No. LQ17C170002), the Talent-Start Project of Zhejiang A&F University (No. 2016FR025), the Key Research and Development Project Funds of Zhejiang Provincial Science and Technology Department (No. 2018C02041), and the National High-Tech R&D Program (863) of China (No. 2012AA101602)
Electronic supplementary materials: The online version of this article (https://doi.org/10.1631/jzus.B1800085) contains supplementary materials, which are available to authorized users
Compliance with ethics guidelines: Xian ZHANG, Ke HE, Yun FANG, Tong CAO, Narayan PAUDYAL, Xiao-feng ZHANG, Hou-hui SONG, Xiao-liang LI, and Wei-huan FANG declare that they have no conflict of interest.
This article does not contain any studies with human or animal subjects performed by any of the authors.
References
- 1.Alshannaq A, Yu JH. Occurrence, toxicity, and analysis of major mycotoxins in food. Int J Environ Res Public Health. 2017;14(6):632. doi: 10.3390/ijerph14060632. [DOI] [PMC free article] [PubMed] [Google Scholar]
- 2.Anfossi L, Giovannoli C, Giraudi G, et al. A lateral flow immunoassay for the rapid detection of ochratoxin A in wine and grape must. J Agric Food Chem. 2012;60(46):11491–11497. doi: 10.1021/jf3031666. [DOI] [PubMed] [Google Scholar]
- 3.Asghar MA, Iqbal J, Ahmed A, et al. Development and validation of a high-performance liquid chromatography method with post-column derivatization for the detection of aflatoxins in cereals and grains. Toxicol Ind Health. 2016;32(6):1122–1134. doi: 10.1177/0748233714547732. [DOI] [PubMed] [Google Scholar]
- 4.Bernhardt K, Valenta H, Kersten S, et al. Determination of T-2 toxin, HT-2 toxin, and three other type A trichothecenes in layer feed by high-performance liquid chromatography-tandem mass spectrometry (LC-MS/MS)– comparison of two sample preparation methods. Mycotoxin Res. 2016;32(2):89–97. doi: 10.1007/s12550-016-0244-z. [DOI] [PubMed] [Google Scholar]
- 5.Bienenmann-Ploum ME, Vincent U, Campbell K, et al. Single-laboratory validation of a multiplex flow cytometric immunoassay for the simultaneous detection of coccidiostats in eggs and feed. Anal Bioanal Chem. 2013;405(29):9571–9577. doi: 10.1007/s00216-013-7362-7. [DOI] [PubMed] [Google Scholar]
- 6.Burkin AA, Kononenko GP, Soboleva NA. Group-specific antibodies against zearalenone and its metabolites and synthetic analogs. Appl Biochem Microbiol. 2002;38(2):169–176. doi: 10.1023/A:1014318818469. [DOI] [PubMed] [Google Scholar]
- 7.Burmistrova NA, Goryacheva IY, Basova EY, et al. Application of a new anti-zearalenone monoclonal antibody in different immunoassay formats. Anal Bioanal Chem. 2009;395(5):1301–1307. doi: 10.1007/s00216-009-2913-7. [DOI] [PubMed] [Google Scholar]
- 8.Byzova NA, Zvereva EA, Zherdev AV, et al. Rapid pretreatment-free immunochromatographic assay of chloramphenicol in milk. Talanta. 2010;81(3):843–848. doi: 10.1016/j.talanta.2010.01.025. [DOI] [PubMed] [Google Scholar]
- 9.Cheat S, Pinton P, Cossalter AM, et al. The mycotoxins deoxynivalenol and nivalenol show in vivo synergism on jejunum enterocytes apoptosis. Food Chem Toxicol. 2016;87:45–54. doi: 10.1016/j.fct.2015.11.019. [DOI] [PubMed] [Google Scholar]
- 10.Cho YJ, Lee DH, Kim DO, et al. Production of a monoclonal antibody against ochratoxin A and its application to immunochromatographic assay. J Agric Food Chem. 2005;53(22):8447–8451. doi: 10.1021/jf051681q. [DOI] [PubMed] [Google Scholar]
- 11.Chun HS, Choi EH, Chang HJ, et al. A fluorescence polarization immunoassay for the detection of zearalenone in corn. Anal Chim Acta. 2009;639(1-2):83–89. doi: 10.1016/j.aca.2009.02.048. [DOI] [PubMed] [Google Scholar]
- 12.de Lima Rocha DF, dos Santos Oliveira M, Furlong EB, et al. Evaluation of the TLC quantification method and occurrence of deoxynivalenol in wheat flour of southern Brazil. Food Addit Contam Part A. 2017;34(12):2220–2229. doi: 10.1080/19440049.2017.1364872. [DOI] [PubMed] [Google Scholar]
- 13.Frens G. Controlled nucleation for the regulation of the particle size in monodisperse gold suspensions. Nat Phys Sci. 1973;241(105):20–22. doi: 10.1038/physci241020a0. [DOI] [Google Scholar]
- 14.Gendloff EH, Casale WL, Ram BP, et al. Hapten-protein conjugates prepared by the mixed anhydride method: cross-reactive antibodies in heterologous antisera. J Immunol Methods. 1986;92(1):15–20. doi: 10.1016/0022-1759(86)90497-7. [DOI] [PubMed] [Google Scholar]
- 15.Guo YR, Liu SY, Gui WJ, et al. Gold immunochromatographic assay for simultaneous detection of carbofuran and triazophos in water samples. Anal Biochem. 2009;389(1):32–39. doi: 10.1016/j.ab.2009.03.020. [DOI] [PubMed] [Google Scholar]
- 16.Huang ZB, Xu Y, Li LS, et al. Development of an immunochromatographic strip test for the rapid simultaneous detection of deoxynivalenol and zearalenone in wheat and maize. Food Control. 2012;28(1):7–12. doi: 10.1016/j.foodcont.2012.04.035. [DOI] [Google Scholar]
- 17.Ji F, Mokoena MP, Zhao HY, et al. Development of an immunochromatographic strip test for the rapid detection of zearalenone in wheat from Jiangsu province, China. PLoS ONE. 2017;12(5):e0175282. doi: 10.1371/journal.pone.0175282. [DOI] [PMC free article] [PubMed] [Google Scholar]
- 18.Kawamura O, Sato S, Kajii H, et al. A sensitive enzyme-linked immunosorbent assay of ochratoxin A based on monoclonal antibodies. Toxicon. 1989;27(8):887–897. doi: 10.1016/0041-0101(89)90100-1. [DOI] [PubMed] [Google Scholar]
- 19.Kolosova AY, de Saeger S, Sibanda L, et al. Development of a colloidal gold-based lateral-flow immunoassay for the rapid simultaneous detection of zearalenone and deoxynivalenol. Anal Bioanal Chem. 2007;389(7-8):2103–2107. doi: 10.1007/s00216-007-1642-z. [DOI] [PubMed] [Google Scholar]
- 20.Lee HJ, Ryu D. Worldwide occurrence of mycotoxins in cereals and cereal-derived food products: public health perspectives of their co-occurrence. J Agric Food Chem. 2017;65(33):7034–7051. doi: 10.1021/acs.jafc.6b04847. [DOI] [PubMed] [Google Scholar]
- 21.Li X, Li PW, Zhang Q, et al. Multi-component immunochromatographic assay for simultaneous detection of aflatoxin B1, ochratoxin A and zearalenone in agro-food. Biosens Bioelectron. 2013;49:426–432. doi: 10.1016/j.bios.2013.05.039. [DOI] [PubMed] [Google Scholar]
- 22.Liu DW, Liu HY, Zhang HB, et al. Potential natural exposure of endangered red-crowned crane (Grus japonensis) to mycotoxins aflatoxin B1, deoxynivalenol, zearalenone, T-2 toxin, and ochratoxin A. J Zhejiang Univ-Sci B (Biomed & Biotechnol) 2016;17(2):158–168. doi: 10.1631/jzus.B1500211. [DOI] [PMC free article] [PubMed] [Google Scholar]
- 23.Liu H, Xiu Y, Xu Y, et al. Development of a colloidal gold immunochromatographic assay (GICA) for the rapid detection of Spiroplasma eriocheiris in commercially exploited crustaceans from China. J Fish Dis. 2017;40(12):1839–1847. doi: 10.1111/jfd.12657. [DOI] [PubMed] [Google Scholar]
- 24.Liu R, Liu Y, Lan MJ, et al. Evaluation of a water-soluble adjuvant for the development of monoclonal antibodies against small-molecule compounds. J Zhejiang Univ-Sci B (Biomed & Biotechnol) 2016;17(4):282–293. doi: 10.1631/jzus.B1500278. [DOI] [Google Scholar]
- 25.Long M, Yang SH, Wang Y, et al. The protective effect of selenium on chronic zearalenone-induced reproductive system damage in male mice. Molecules. 2016;21(12):1687. doi: 10.3390/molecules21121687. [DOI] [PMC free article] [PubMed] [Google Scholar]
- 26.Luo ME, Tang Y, Xiang JJ, et al. Preparation of anti-zearalenone monoclonal antibody and preliminary establishment of colloidal gold immunochromatographic assay for zearalenone. Chin J Cell Mol Immunol. 2013;29(7):729–733. doi: 10.13423/j.cnki.cjcmi.006852. (in Chinese) [DOI] [PubMed] [Google Scholar]
- 27.Majdinasab M, Sheikh-Zeinoddin M, Soleimanian-Zad S, et al. Ultrasensitive and quantitative gold nanoparticle-based immunochromatographic assay for detection of ochratoxin A in agro-products. J Chromatogr B. 2015;974:147–154. doi: 10.1016/j.jchromb.2014.10.034. [DOI] [PubMed] [Google Scholar]
- 28.Molinelli A, Grossalber K, Krska R. A rapid lateral flow test for the determination of total type B fumonisins in maize. Anal Bioanal Chem. 2009;395(5):1309–1316. doi: 10.1007/s00216-009-3082-4. [DOI] [PubMed] [Google Scholar]
- 29.Perry JL, Christensen T, Goldsmith MR, et al. Binding of ochratoxin A to human serum albumin stabilized by a protein-ligand ion pair. J Phys Chem B. 2003;107(31):7884–7888. doi: 10.1021/jp034783x. [DOI] [Google Scholar]
- 30.Pierron A, Alassane-Kpembi I, Oswald IP. Impact of mycotoxin on immune response and consequences for pig health. Anim Nutr. 2016;2(2):63–68. doi: 10.1016/j.aninu.2016.03.001. [DOI] [PMC free article] [PubMed] [Google Scholar]
- 31.Schmidt-Heydt M, Geisen R. A microarray for monitoring the production of mycotoxins in food. Int J Food Microbiol. 2007;117(2):131–140. doi: 10.1016/j.ijfoodmicro.2007.01.014. [DOI] [PubMed] [Google Scholar]
- 32.Shim WB, Kim KY, Chung DH. Development and validation of a gold nanoparticle immunochromatographic assay (ICG) for the detection of zearalenone. J Agric Food Chem. 2009;57(10):4035–4041. doi: 10.1021/jf900075h. [DOI] [PubMed] [Google Scholar]
- 33.Shim WB, Dzantiev BB, Eremin SA, et al. One-step simultaneous immunochromatographic strip test for multianalysis of ochratoxin a and zearalenone. J Microbiol Biotechnol. 2009;19(1):83–92. [PubMed] [Google Scholar]
- 34.Song CM, Liu QT, Zhi AM, et al. Development of a lateral flow colloidal gold immunoassay strip for the rapid detection of olaquindox residues. J Agric Food Chem. 2011;59(17):9319–9326. doi: 10.1021/jf202213m. [DOI] [PubMed] [Google Scholar]
- 35.Song G, Wu JY, Xie Y, et al. Monoclonal antibody-based serological assays for detection of Potato virus S in potato plants. J Zhejiang Univ-Sci B (Biomed & Biotechnol) 2017;18(12):1075–1082. doi: 10.1631/jzus.B1600561. [DOI] [PMC free article] [PubMed] [Google Scholar]
- 36.Sun SJ, Xie J, Peng T, et al. Broad-spectrum immunoaffinity cleanup for the determination of aflatoxins B1, B2, G1, G2, M1, M2 in Ophiocordyceps sinensis and its pharmaceutical preparations by ultra performance liquid chromatography tandem mass spectrometry. J Chromatogr B. 2017;1068-1069:112–118. doi: 10.1016/j.jchromb.2017.10.013. [DOI] [PubMed] [Google Scholar]
- 37.Sun YB, Hu XF, Zhang Y, et al. Development of an immunochromatographic strip test for the rapid detection of zearalenone in corn. J Agric Food Chem. 2014;62(46):11116–11121. doi: 10.1021/jf503092j. [DOI] [PubMed] [Google Scholar]
- 38.Sun YN, Xing GX, Yang JF, et al. Development of an immunochromatographic test strip for simultaneous qualitative and quantitative detection of ochratoxin A and zearalenone in cereal. J Sci Food Agric. 2016;96(11):3673–3678. doi: 10.1002/jsfa.7550. [DOI] [PubMed] [Google Scholar]
- 39.Torović L. Aflatoxins and ochratoxin A in flour: a survey of the Serbian retail market. Food Addit Contam Part B Surveill. 2018;11(1):26–32. doi: 10.1080/19393210.2017.1391335. [DOI] [PubMed] [Google Scholar]
- 40.Urusov AE, Petrakova AV, Gubaydullina MK, et al. High-sensitivity immunochromatographic assay for fumonisin B1 based on indirect antibody labeling. Biotechnol Lett. 2017;39(5):751–758. doi: 10.1007/s10529-017-2294-5. [DOI] [PubMed] [Google Scholar]
- 41.Wang XC, Fan HX, Fan MX, et al. A sensitive immunochromatographic assay using colloidal gold-antibody probe for rapid detection of fumonisin B1 in corn. Food Addit Contam Part A. 2016;33(9):1435–1443. doi: 10.1080/19440049.2016.1213429. [DOI] [PubMed] [Google Scholar]
- 42.Wang Y, Liu N, Ning BN, et al. Simultaneous and rapid detection of six different mycotoxins using an immunochip. Biosens Bioelectron. 2012;34(1):44–50. doi: 10.1016/j.bios.2011.12.057. [DOI] [PubMed] [Google Scholar]
- 43.Wang YK, Yan YX, Ji WH, et al. Novel chemiluminescence immunoassay for the determination of zearalenone in food samples using gold nanoparticles labeled with streptavidin-horseradish peroxidase. J Agric Food Chem. 2013;61(18):4250–4256. doi: 10.1021/jf400731j. [DOI] [PubMed] [Google Scholar]
- 44.Wang YK, Yan YX, Ji WH, et al. Rapid simultaneous quantification of zearalenone and fumonisin B1 in corn and wheat by lateral flow dual immunoassay. J Agric Food Chem. 2013;61(21):5031–5036. doi: 10.1021/jf400803q. [DOI] [PubMed] [Google Scholar]
- 45.Wu JX, Zhang SE, Zhou XP. Monoclonal antibody-based ELISA and colloidal gold-based immunochromatographic assay for streptomycin residue detection in milk and swine urine. J Zhejiang Univ-Sci B (Biomed & Biotechnol) 2010;11(1):52–60. doi: 10.1631/jzus.B0900215. [DOI] [PMC free article] [PubMed] [Google Scholar]
- 46.Yan QH, Zhou JX, Li HZ, et al. Coexistence of and interaction relationships between an aflatoxin-producing fungus and a bacterium. Fungal Biol. 2015;119(7):605–614. doi: 10.1016/j.funbio.2015.03.006. [DOI] [PubMed] [Google Scholar]
- 47.Yang C, Lates V, Prieto-Simón B, et al. Aptamer-DNAzyme hairpins for biosensing of ochratoxin A. Biosens Bioelectron. 2012;32(1):208–212. doi: 10.1016/j.bios.2011.12.011. [DOI] [PubMed] [Google Scholar]
- 48.Yang SP, Zhang HY, Sun FF, et al. Metabolic profile of zearalenone in liver microsomes from different species and its in vivo metabolism in rats and chickens using ultra high-pressure liquid chromatography-quadrupole/time-of-flight mass spectrometry. J Agric Food Chem. 2017;65(51):11292–11303. doi: 10.1021/acs.jafc.7b04663. [DOI] [PubMed] [Google Scholar]
- 49.Zhang MY, Yan LZ, Huang Q, et al. Highly sensitive simultaneous detection of major ochratoxins by an immunochromatographic assay. Food Control. 2018;84:215–220. doi: 10.1016/j.foodcont.2017.07.035. [DOI] [Google Scholar]
- 50.Zhang X, Sun MJ, Kang Y, et al. Identification of a high-affinity monoclonal antibody against ochratoxin A and its application in enzyme-linked immunosorbent assay. Toxicon. 2015;106:89–96. doi: 10.1016/j.toxicon.2015.09.028. [DOI] [PubMed] [Google Scholar]
- 51.Zhang X, Wang X, Sun MJ, et al. A magnetic nanoparticle based enzyme-linked immunosorbent assay for sensitive quantification of zearalenone in cereal and feed samples. Toxins. 2015;7(10):4216–4231. doi: 10.3390/toxins7104216. [DOI] [PMC free article] [PubMed] [Google Scholar]
Associated Data
This section collects any data citations, data availability statements, or supplementary materials included in this article.
Supplementary Materials
Optimal conditions of the dual flow immunochromatographic assay
Buffer types, optimum buffers, and optimum concentrations of additives in the dual flow immunochromatographic assay
Comparison of results of gold nanoparticles-based immunochromatographic assay published in the past


