Abstract
TGF-β signals through a receptor complex composed of 2 type I and 2 type II (TGF-βRII) subunits. We investigated the role of macrophage TGF-β signaling in fibrosis after AKI in mice with selective monocyte/macrophage TGF-βRII deletion (macrophage TGF-βRII–/– mice). Four weeks after injury, renal TGF-β1 expression and fibrosis were higher in WT mice than macrophage TGF-βRII–/– mice, which had decreased renal macrophages. The in vitro chemotactic response to f-Met-Leu-Phe was comparable between bone marrow–derived monocytes (BMMs) from WT and macrophage TGF-βRII–/– mice, but TGF-βRII–/– BMMs did not respond to TGF-β. We then implanted Matrigel plugs suffused with either f-Met-Leu-Phe or TGF-β1 into WT or macrophage TGF-βRII–/– mice. After 6 days, f-Met-Leu-Phe induced similar macrophage infiltration into the Matrigel plugs of WT and macrophage TGF-βRII–/– mice, but TGF-β induced infiltration only in WT mice. We further determined the number of labeled WT or TGF-βRII–/– BMMs infiltrating into WT kidneys 20 days after ischemic injury. There were more labeled WT BMMs than TGF-βRII–/– BMMs. Therefore, macrophage TGF-βRII deletion protects against the development of tubulointerstitial fibrosis following severe ischemic renal injury. Chemoattraction of macrophages to the injured kidney through a TGF-β/TGF-βRII axis is a heretofore undescribed mechanism by which TGF-β can mediate renal fibrosis during progressive renal injury.
Keywords: Nephrology
Keywords: Chemokines, Fibrosis, Macrophages
TGF-ß is a potent chemoattractant, and renal TGF-ß induces macrophage infiltration into kidneys after severe ischemic injury, which mediates development of tubulointerstitial fibrosis.
Introduction
There is increasing evidence that incomplete recovery from episodes of acute kidney injury (AKI) can predispose patients to the development of chronic tubulointerstitial fibrosis (1–3). Previous studies by us and others have shown an important role for renal macrophages in recovery from experimentally induced AKI (4–9). Conversely, there is also increasing evidence for a role for macrophages in the development of fibrosis after AKI. There are 2 potential mechanisms by which macrophages may be involved in promoting fibrosis, either due to persistence of an inflammatory (“M1”) phenotype or to incomplete termination of the resolution phase promoted by a tissue reparative (“M2”) phenotype. In both cases, renal macrophages may play a key role, either with defects in their ability to limit ongoing inflammation or with persistence of activated profibrotic macrophages in the later stages of recovery.
TGF-β is recognized as a central mediator of renal tubulointerstitial fibrosis. However, a recent study found that deletion of myeloid TGF-β1 did not prevent fibrosis after severe renal ischemia/reperfusion or obstructive injury (10), suggesting a role for increased TGF-β1 from nonmyeloid cells. TGF-β signals through a receptor complex composed of 2 type I and 2 type II transmembrane subunits, and monocytes and macrophages express TGF-β receptors. No previous study to our knowledge has determined the effect of TGF-β receptor signaling on macrophages during recovery from acute injury to the kidney. In the current studies, we have deleted type II TGF-β receptors (TGF-βRII) selectively in myeloid cells to investigate the potential role of TGF-β receptor signaling in macrophages on the development of fibrosis following severe ischemic injury.
Results
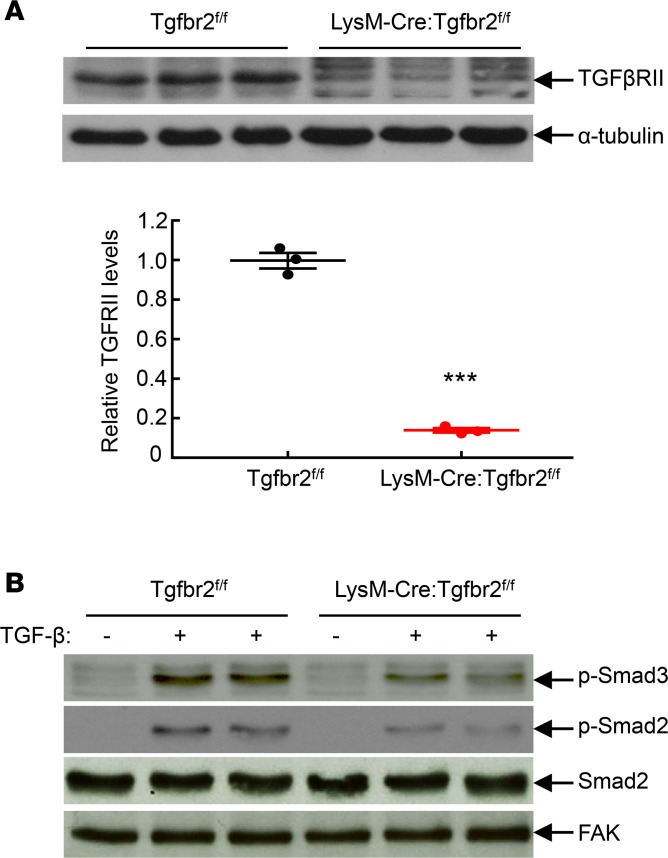
To delete TGF-βRII from macrophages, we crossed Tgfbr2fl/fl mice with transgenic mice expressing either CD11b-Cre Tgfbr2fl/fl or LysM-Cre Tgfbr2fl/fl. Compared to control WT mice (Tgfbr2fl/fl), control CD11b-Cre Tgfbr2fl/fl and control LysM-Cre Tgfbr2fl/fl mice had similar behavior, body weight, histology, kidney function (blood urea nitrogen [BUN] and albuminuria) and hematopoiesis, as indicated in Supplemental Figures 1–4 (supplemental material available online with this article; https://doi.org/10.1172/jci.insight.123563DS1). Unless otherwise indicated, we confirmed our findings in both strains, and therefore mice with selective macrophage deletion of TGF-βRII are designated as macrophage TGF-βRII–/– mice. To confirm the efficiency of macrophage TGF-βRII deletion, peritoneal macrophages were harvested from Tgfbr2fl/fl (WT) mice and LysM-Cre Tgfbr2fl/fl mice, which were injected intraperitoneally with 3 ml of sterile thioglycollate (3% w/v) for 3 days. Isolated intraperitoneal macrophages were used for immunoblotting. As indicated in Figure 1A, TGF-βRII protein levels were markedly reduced in TGF-βRII–/– macrophages compared with WT macrophages. In addition, macrophages were seeded into 6 well plates and stimulated with recombinant TGF-β (2 ng/ml) for 30 minutes. As indicated in Figure 1B, TGF-β administration led to activation of TGF-β signaling in WT macrophages, as indicated by increases in levels of phospho-Smad2 and phospho-Smad3, which were markedly inhibited in TGF-βRII–/– macrophages. Therefore, TGF-βRII was efficiently deleted in macrophage TGF-βRII–/– mice.
Figure 1. Confirmation of macrophage TGF-βRII deletion.
Peritoneal macrophages from Tgfbr2fl/fl (WT) and LysM-Cre Tgfbr2fl/fl (macrophage TGF-βRII–/–; MφTGF-βRII–/–) mice 3 days after peritoneal thioglycollate administration were used. (A) TGF-βRII levels were markedly lower in TGF-βRII–/– macrophages than in WT macrophages. ***P < 0.001, n = 3 in each group. Data were expressed as mean ± SEM. (B) Macrophages were stimulated with 2 ng/ml recombinant TGF-β for 30 minutes. TGF-βRII deletion led to decreases in TGF-β–stimulated phosphorylation of Smad2 and Smad3, an indication of TGF-βRII deficiency. p-Smad3, phospho-Smad3; p-Smad2, phospho-Smad2; FAK, focal adhesion kinase.
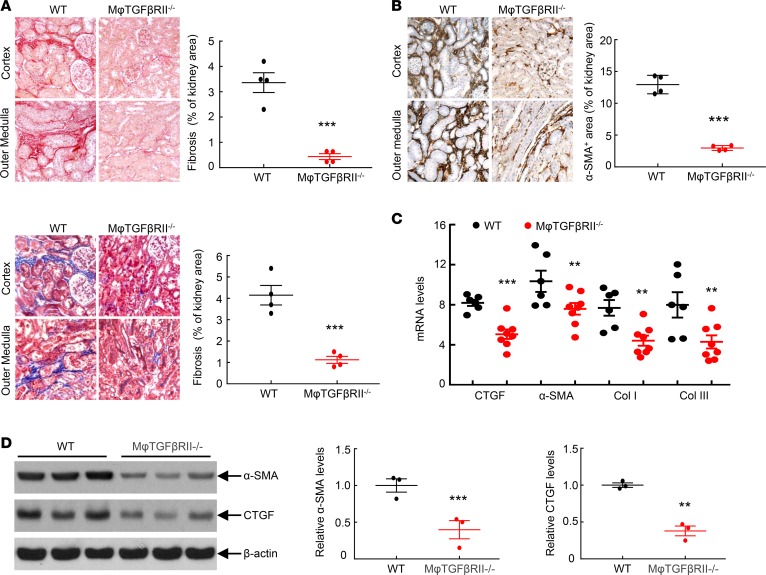
Macrophage TGF-βRII–/– mice had no differences in acute functional recovery from ischemia-reperfusion (I/R) injury, as indicated by similar recovery patterns of both serum creatinine and BUN as well as similar Kim-1 mRNA levels 7 days after AKI (Supplemental Figures 5 and 6). However, at 4 weeks after the initial severe ischemic injury, there were increased tubular dilation and immune cell infiltration in kidneys of WT mice, while the injury was minimal in kidneys of macrophage TGF-βRII–/– mice (Supplemental Figure 7). Macrophage TGF-βRII deletion led to decreased interstitial fibrosis, as indicated by significant reduction of both Sirius red and Masson’s trichrome staining (Figure 2A) as well as by marked decreases in renal mRNA and protein levels of the profibrotic and fibrotic markers, α-smooth muscle actin (α-SMA, a marker of myofibroblasts), connective tissue growth factor (CTGF), and collagens I and III (Figure 2, B–D, and Supplemental Figure 8).
Figure 2. Macrophage TGF-βRII deletion decreased renal fibrosis after I/R injury.
Mice were studied 4 weeks after severe I/R injury. (A) CD11b-Cre Tgfbr2fl/fl (macrophage TGF-βRII–/–) mice had decreased renal fibrosis as indicated by Sirius red staining and Masson’s trichrome staining. ***P < 0.001, n = 4 in each group. (B) Macrophage TGF-βRII deletion led to decreased renal protein levels of α-SMA, a marker of myofibroblasts. ***P < 0.001, n = 4 in each group. (C) Macrophage TGF-βRII deletion led to decreases in mRNA levels of profibrotic and fibrotic CTGF, collagens I and III (Col I and Col III), and α-SMA. **P < 0.01, ***P < 0.001. n = 6 in Tgfbr2fl/fl (WT) mice, and n = 8 in macrophage TGF-βRII–/– mice. (D) Macrophage TGF-βRII deletion led to decreases in protein levels of profibrotic α-SMA and CTGF. **P < 0.01, ***P < 0.001; n = 3 in each group. Original magnification: ×160 in all.
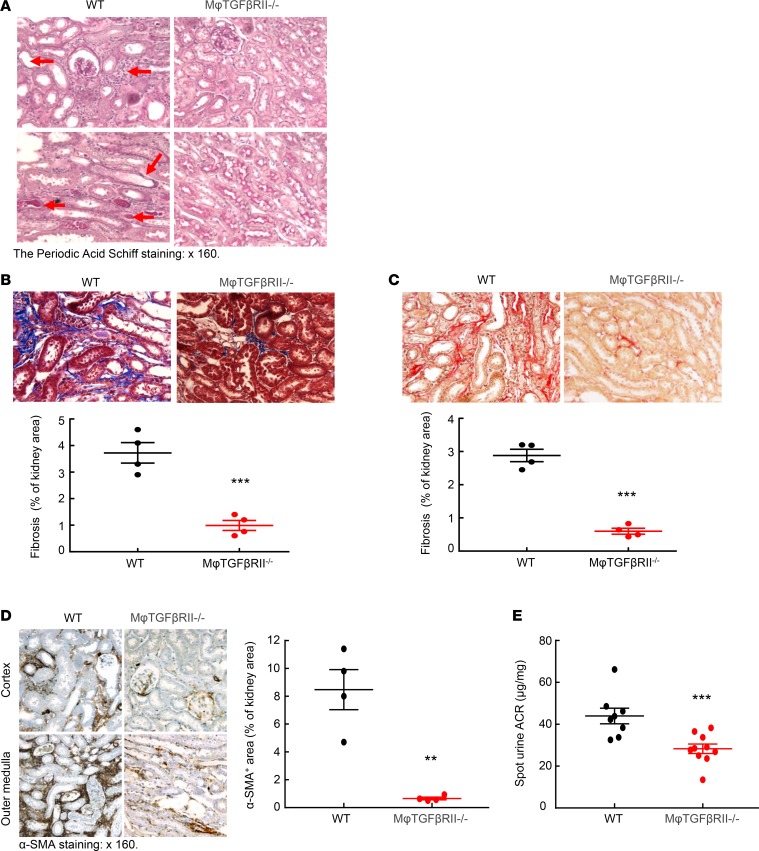
We also used a more severe AKI model with reliable fibrosis following injury, indicated as “AKI/chronic kidney disease,” (AKI/CKD) as described in the Methods section (11). In this model, although BUN increased in both WT and macrophage TGF-βRII–/– mice after uninephrectomy compared to normal controls, no difference of BUN was appreciated between WT and macrophage TGF-βRII–/– mice (Supplemental Figure 4). In this AKI/CKD fibrotic model, kidneys of WT mice exhibited histological kidney injury, as indicated by tubular dilation and distal tubular protein casts, and these parameters were all diminished in the kidneys of macrophage TGF-βRII–/– mice (Figure 3A). There was also less kidney fibrosis, as indicated by both Sirius red and Masson’s trichrome staining (Figure 3, B and C) and decreased expression of profibrotic factors, CTGF, and α-SMA (Figure 3D and Supplemental Figure 9). Macrophage TGF-βRII–/– mice also had relative preservation of kidney function, as indicated by lower urinary albumin excretion (Figure 3E).
Figure 3. Macrophage TGF-βRII deletion decreased renal fibrosis in an AKI/CKD model.
(A) At the end of the AKI/CKD procedure, renal tubular dilation, immune cell infiltration, tubular atrophy, and distal protein casts (arrowheads) seen in Tgfbr2fl/fl (WT) mice were minimal in CD11b-Cre Tgfbr2fl/fl (macrophage TGF-βRII–/–) mice. (B and C) Macrophage TGF-βRII deletion led to decreased renal fibrosis as indicated by (B) Masson’s trichrome staining and (C) Sirius red staining. ***P < 0.001, n = 4 in each group. (D) Macrophage TGF-βRII deletion led to decreased protein expression levels of α-SMA. ***P < 0.001, n = 4 in each group. (E) Urinary albumin excretion was lower in macrophage TGF-βRII–/– mice than in WT mice. ***P < 0.001, n = 8 in WT group; n = 10 in macrophage TGF-βRII–/– group. ACR, albumin/creatinine ratio. Original magnification: ×160 in all.
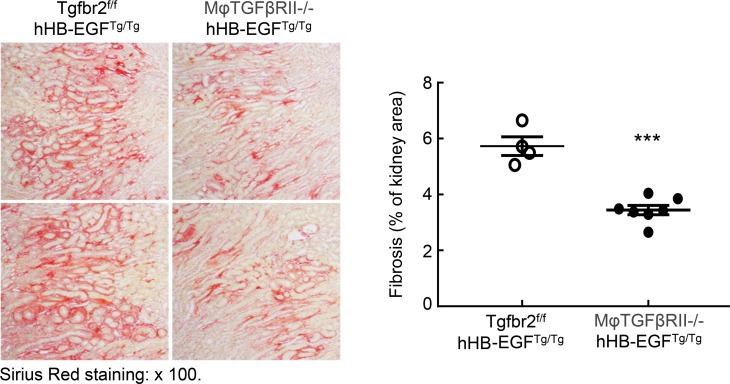
We have previously described a model of spontaneous tubulointerstitial fibrosis resulting from the selective overexpression of the EGFR ligand, heparin-binding EGF-like growth factor (HB-EGF), in renal proximal tubules (hHB-EGFTg/Tg) (12). These mice have augmented interstitial myofibroblast accumulation and progressive increases in interstitial extracellular matrix deposition. To investigate the role of macrophage TGF-βRII in the development of renal fibrosis in this model, we generated Tgfbr2fl/fl hHB-EGFTg/Tg mice and CD11b-Cre Tgfbr2fl/fl hHB-EGFTg/Tg (macrophage TGF-βRII–/– hHB-EGFTg/Tg) mice. In this model, macrophage TGF-βRII deletion also led to significantly decreased renal interstitial fibrosis, as indicated by Sirius red and Masson’s trichrome staining and quantification (Figure 4 and Supplemental Figure 10). Therefore, macrophage TGF-βRII deletion led to decreases in renal fibrosis in 3 different models of fibrosis.
Figure 4. Macrophage TGF-βRII deletion inhibited the development of renal tubulointerstitial injury in hHB-EGFTg/Tg mice.
Male, 4-month-old Tgfbr2fl/fl hHB-EGFTg/Tg and CD11b-Cre Tgfbr2fl/fl hHB-EGFTg/Tg (macrophage TGF-βRII–/–) mice were used. Macrophage TGF-βRII deletion led to significant decreases in renal fibrosis, as indicated by quantitative Sirius red staining. ***P < 0.001. n = 4 in hHB-EGFTg/Tg mice, and n = 7 in macrophage TGF-βRII–/– mice. Original magnification: ×100.
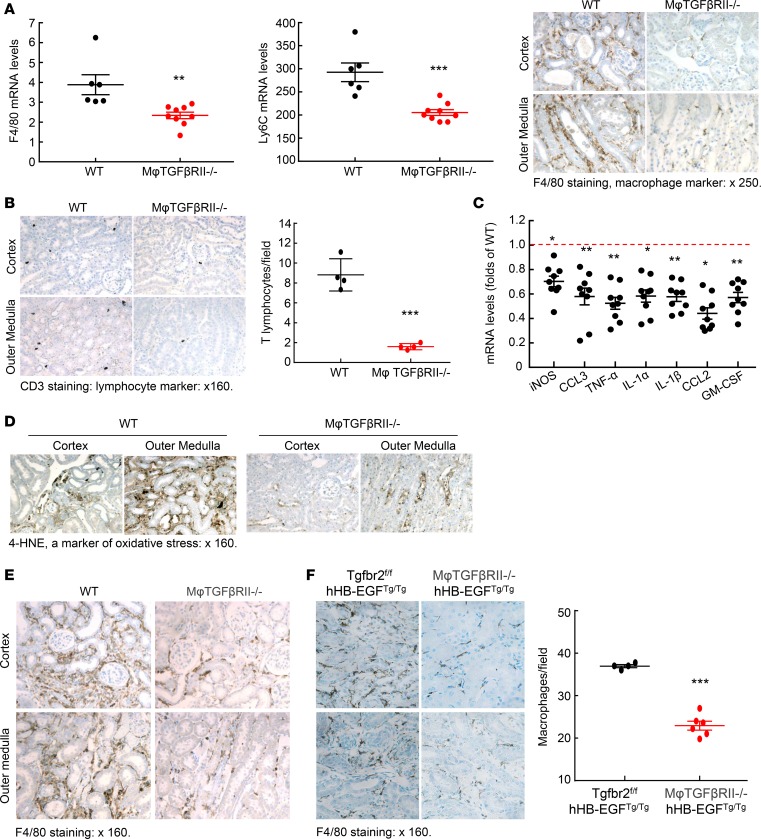
Increased immune cell infiltration accompanies kidney injury (13, 14). Increased macrophages produce proinflammatory cytokines/chemokines, which worsen kidney injury and promote fibrosis. As indicated in Figure 5A, kidney mRNA levels of F4/80 and Ly6C, 2 markers of macrophages, were markedly lower in the macrophage TGF-βRII–/– mice than in WT mice at 4 weeks after ischemic injury. F4/80 immunostaining confirmed markedly decreased macrophage density in macrophage TGF-βRII–/– mice (Figure 5A). Both mRNA and protein levels of mannose receptor (CD206), a marker of profibrotic M2 macrophages, were also significantly lower in the kidneys of macrophage TGF-βRII–/– mice (Supplemental Figure 11). In addition, the mRNA levels of CD209 (a marker of M2a) and CD150 (a marker of M2c) were decreased (Supplemental Figure 11). There was a concomitant decrease in T cell infiltration, indicated by CD3 immunostaining (Figure 5B), in association with decreased renal proinflammatory cytokines/chemokines, including iNOS, CCL3, TNF-α, IL-1α, IL-1β, CCL2, and granulocyte macrophage colony-stimulating factor (Figure 5C). However, renal levels of proinflammatory cytokines/chemokines were similar between WT mice and macrophage TGF-βRII–/– mice 8 days after uninephrectomy (Supplemental Figure 12). There was also a reduction in renal oxidative stress, as indicated by weaker 4-hydroxynonenal (4-HNE) staining (Figure 5D). In kidneys of WT mice with AKI/CKD, there also were increases in macrophages as well as increased T cell infiltration and increased oxidative stress, and all these parameters were attenuated in kidneys of macrophage TGF-βRII–/– mice (Figure 5E and Supplemental Figures 13 and 14). Similarly, there was also decreased macrophage density in the macrophage TGF-βRII–/– hHB-EGFTg/Tg mice (Figure 5F). Therefore, a common feature of all 3 models of renal tubulointerstitial fibrosis was that selective deletion of TGF-βRII in the monocyte/macrophage population resulted in a decrease in total renal macrophages.
Figure 5. Macrophage TGF-βRII deletion decreased renal macrophage proinflammatory marker expression in different renal fibrotic models.
(A) CD11b-Cre Tgfbr2fl/fl (macrophage TGF-βRII–/–) mice had decreased mRNA levels of both F4/80 and Ly6C, 2 markers of macrophages, 4 weeks after severe I/R injury. ***P < 0.001, n = 6 in WT group; n = 9 in macrophage TGF-βRII–/– group. F4/80-positive macrophages were decreased in macrophage TGF-βRII–/– mice. (B) Macrophage TGF-βRII deletion also led to decreases in renal T lymphocyte infiltration as indicated by quantitative CD3 staining, a marker of T lymphocytes. ***P < 0.001. n = 4 in each group. (C) Kidneys of macrophage TGF-βRII–/– mice had decreased proinflammatory cytokines/chemokines. *P < 0.05, **P < 0.01. n = 6 in WT group, and n = 9 in macrophage TGF-βRII–/– group. (D) Kidneys of macrophage TGF-βRII–/– mice had lower oxidative stress as indicated by 4-HNE staining. (E and F) Macrophage TGF-βRII deletion also led to decreased renal macrophage density (E) in the AKI/CKD model and (F) in the hHB-EGFTg/Tg model. ***P < 0.001, n = 4 in Tgfbr2fl/fl hHB-EGFTg/Tg group; n = 6 in CD11b-Cre Tgfbr2fl/fl hHB-EGFTg/Tg (macrophage TGF-βRII–/– hHB-EGFTg/Tg) group. Original magnification: ×250 in (A) and ×160 in all others.
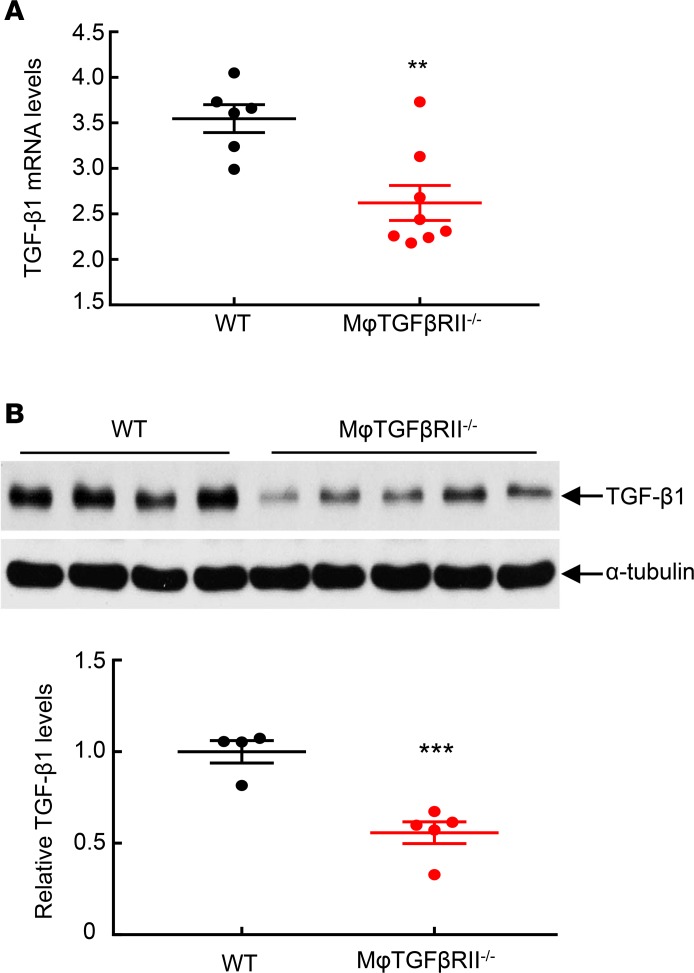
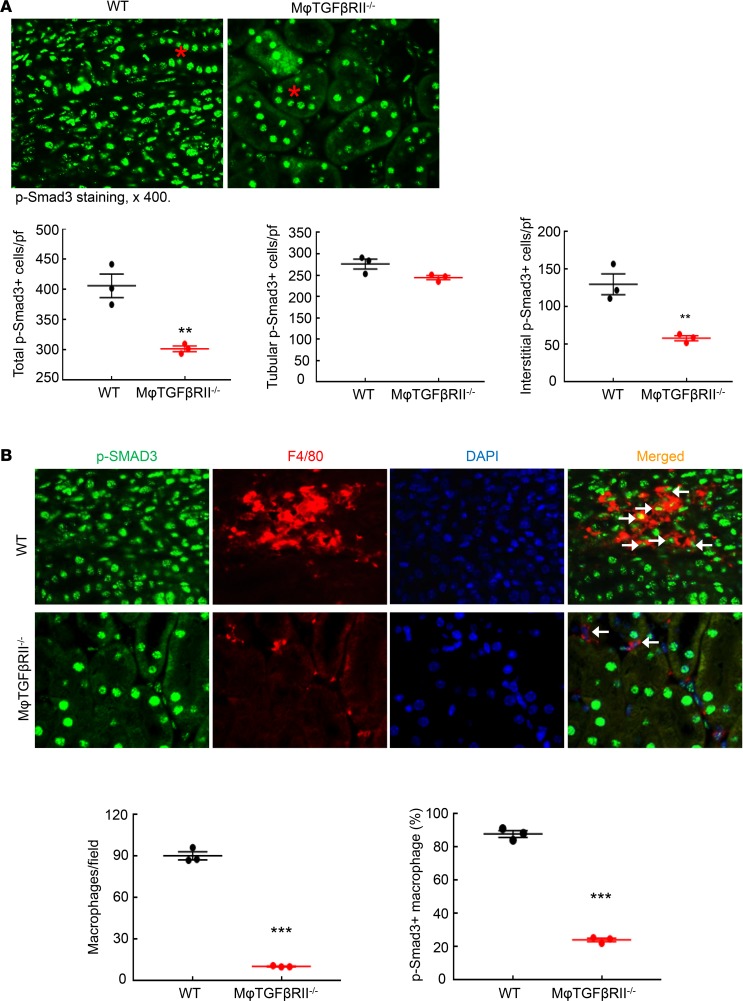
TGF-β is a central mediator of renal fibrosis. At 4 weeks after renal ischemic injury, both mRNA and protein levels of renal TGF-β1 were significantly higher in WT compared with macrophage TGF-βRII–/– mice (Figure 6). In addition, renal TGF-β2 protein levels were significantly higher in WT compared with macrophage TGF-βRII–/– mice (Supplemental Figure 15). Phosphorylation of Smad3, an indicator of activation of TGF-β signaling, was markedly decreased in macrophage TGF-βRII–/– compared with WT mice (Figure 7A). Tubular phospho-Smad3–positive cells were comparable between WT and macrophage TGF-βRII–/– mice while interstitial phospho-Smad3–positive cells were much lower in macrophage TGF-βRII–/– mice than in WT mice (Figure 7A). Simultaneous immunofluorescent staining with phospho-Smad3 and F4/80, a marker of macrophages, confirmed decreased macrophage numbers in macrophage TGF-βRII–/– compared with WT mice (10.41 ± 0.25 versus 90.33 ± 2.94 macrophages/field of WT mice; P < 0.001; n = 3 in each group). In WT mice, most renal macrophages were phospho-Smad3 positive, while only a small proportion of macrophages were phospho-Smad3 positive in macrophage TGF-βRII–/– mice (percentage of phospho-Smad3-positive macrophages: 87.87 ± 2.04 versus 24.09 ± 1.06; P < 0.001; n = 3 in each group) (Figure 7B).
Figure 6. Macrophage TGF-βRII deletion led to decreased renal TGF-β1 expression after I/R injury.
Mice were studied 4 weeks after severe I/R injury. (A) Renal TGF-β1 mRNA levels were significantly lower in CD11b-Cre Tgfbr2fl/fl (macrophage TGF-βRII–/–) mice than in Tgfbr2fl/fl (WT) mice. **P < 0.01, n = 6 in WT group; n = 8 in macrophage TGF-βRII–/– group. (B) Renal TGF-β1 protein levels were lower in macrophage TGF-βRII–/– mice than in WT mice. ***P < 0.001, n = WT group; n = 5 in macrophage TGF-βRII–/– group.
Figure 7. Macrophage TGF-βRII deletion led to selective inhibition of TGF-β signaling in macrophages after I/R injury.
Mice were studied 4 weeks after severe I/R injury. (A) CD11b-Cre Tgfbr2fl/fl (macrophage TGF-βRII–/–) mice had fewer total p-Smad3-positive cells due to decreased interstitial p-Smad3-positive cells but not tubular p-Smad3-positive cells. Asterisk: tubule. **P < 0.01, n = 3 in each group. (B) p-Smad3 and F4/80 double immunofluorescent staining determined decreased renal macrophages as well as decreased macrophage TGF-β signaling in macrophage TGF-βRII–/– mice. Arrowheads: double-positive cells. ***P < 0.001, n = 3 in each group. Original magnification: ×400.
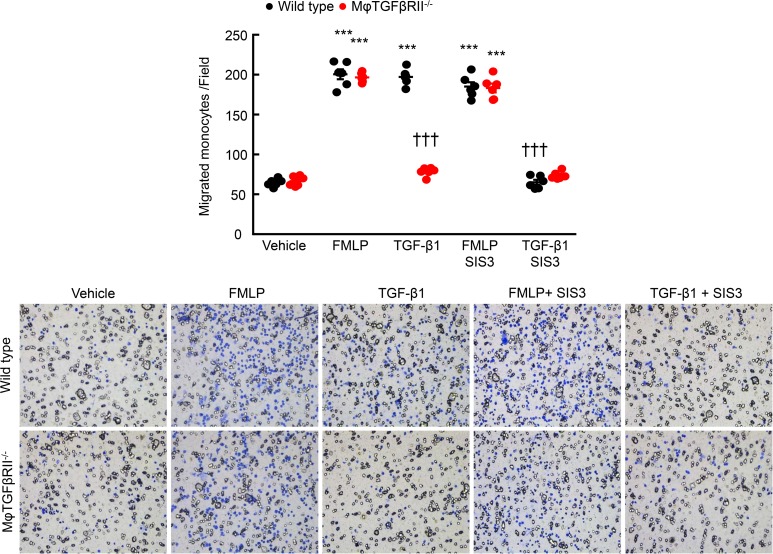
Because TGF-β has been reported to be a chemoattractant (15), we determined whether deletion of TGF-βRII would alter macrophage chemotaxis. The in vitro chemotactic response to a known chemotaxin, f-Met-Leu-Phe, was not different between isolated bone marrow–derived monocytes (BMMs) from WT and CD11b-Cre Tgfbr2fl/fl mice (Figure 8). However, although TGF-β was a potent chemoattractant to WT BMMs, TGF-βRII–/– BMMs did not respond (Figure 8). Of note, the Smad3 inhibitor, SIS3, significantly inhibited the chemotactic response to TGF-β in WT monocytes but had minimal effect in TGF-βRII–/– monocytes (Figure 8).
Figure 8. TGF-βRII deletion impaired TGF-β1–mediated monocyte migration in vitro.
BMMs were isolated from Tgfbr2fl/fl (WT) mice and CD11b-Cre Tgfbr2fl/fl (macrophage TGF-βRII–/–) mice and used for migration assays. f-Met-Leu-Phe (FMLP, 250 μM) induced similar migration for both WT and TGF-βRII–/– monocytes. Although TGF-β1 (10 ng/ml) induced migration in WT monocytes, which was blocked by SIS3, a Smad3 inhibitor, it had no effect on TGF-βRII–/– monocytes. ***P < 0.001 versus vehicle group; †††P < 0.001 versus TGF-β1–treated WT group. n = 6 in each group.
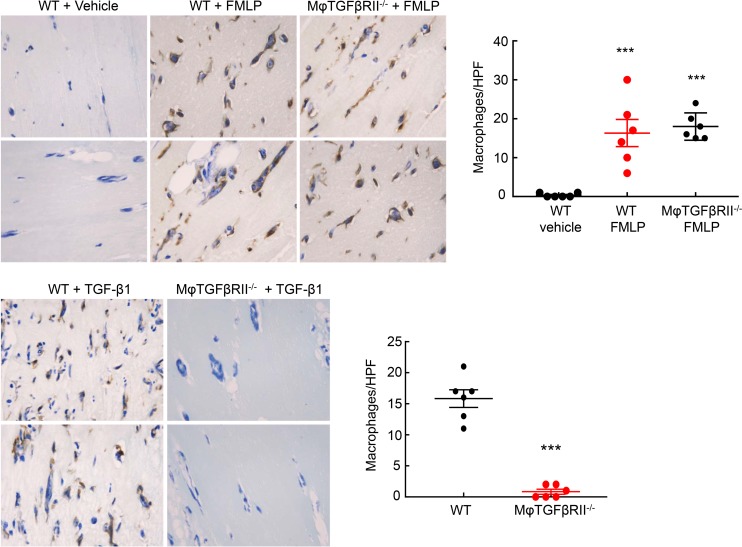
To confirm these findings in an in vivo setting, we performed an in vivo chemotaxis assay using Matrigel plugs. Matrigel was suffused with vehicle (water), f-Met-Leu-Phe (250 μM), or TGF-β1 (1 μg/ml) and then injected subcutaneously into the subscapular regions of Tgfbr2fl/fl mice or LysM-Cre Tgfbr2fl/fl mice. After 6 days, there was minimal macrophage infiltration into the vehicle-treated Matrigel plugs in both WT and macrophage TGF-βRII–/– mice, while f-Met-Leu-Phe induced significant and comparable increases in macrophage infiltration into the Matrigel plugs of both WT and macrophage TGF-βRII–/– groups (F4/80-positive cells/high-power field [HPF]: vehicle: 0.33 ± 0.21; WT f-Met-Leu-Phe: 16.33 ± 3.47, P < 0.001 versus vehicle; macrophage TGF-βRII–/– f-Met-Leu-Phe: 18.00 ± 1.43, P < 0.001 versus vehicle but not significant versus WT f-Met-Leu-Phe, n = 6 in each group) (Figure 9A). In contrast, while TGF-β also led to significant macrophage infiltration into the Matrigel plugs in the WT mice, it induced only rare infiltrating macrophages into the plugs of macrophage TGF-βRII–/– mice (F4/80-positive cells/HPF: 15.83 ± 1.42 versus 0.83 ± 0.40 versus P < 0.001, n = 6 in each group) (Figure 9B). Therefore, TGF-βRII in macrophages was essential for TGF-β–induced chemotaxis in vivo.
Figure 9. TGF-βRII deletion impaired TGF-β1–mediated in vivo macrophage chemotaxis.
Matrigels suffused with vehicle (water), FMLP (250 μM), or TGF-β1 (1 μg/ml) were injected subcutaneously into subscapular regions of Tgfbr2fl/fl (WT) mice or LysM-Cre Tgfbr2fl/fl (macrophage TGF-βRII–/–) mice for 6 days. FMLP induced similar macrophage infiltration in WT and macrophage TGF-βRII–/– mice. ***P < 0.001 versus vehicle group, n = 6 in each group. TGF-β1–mediated macrophage chemotaxis was diminished in macrophage TGF-βRII–/– mice. ***P < 0.001 versus WT group, n = 6 in each group.
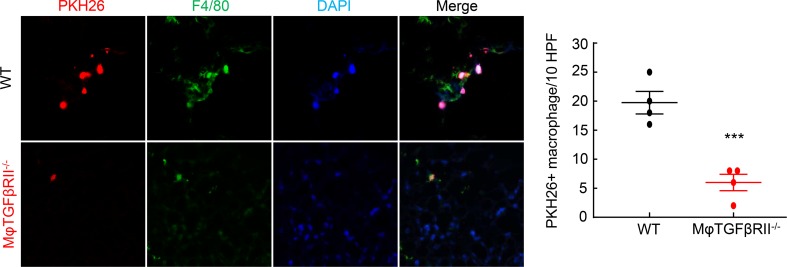
To determine the potential role of macrophage TGF-βRII expression in macrophage migration in response to kidney injury, we obtained BMMs from either WT or macrophage TGF-βRII–/– mice and labeled them with the monocyte tracking dye PKH26. We then injected 5 × 10⁶ PKH26-labeled cells into mice that had undergone AKI/CKD (10 days after uninephrectomy) and determined the number of PKH26:F4/80 double-positive cells in the kidney 3 days later. As indicated in Figure 10, there were significantly more double-labeled WT cells than macrophage TGF-βRII–/–double-positive cells in the AKI/CKD kidneys (PKH26:F4/80 double-positive cells per 10 HPF: 19.25 ± 1.11 versus 6.25 ± 1.18, P < 0.001, n = 4 in each group).
Figure 10. TGF-βRII deletion impaired TGF-β1–mediated macrophage migration into kidneys following injury.
BMMs were isolated from Tgfbr2fl/fl (WT) mice and CD11b-Cre Tgfbr2fl/fl (macrophage TGF-βRII–/–) mice, labeled with the monocyte tracking dye PKH26, and injected into WT mice that had undergone AKI/CKD 18 days previously, and labeled cells in the kidneys were measured 3 days later. The number of renal-infiltrated, PKH26:F4/80-double-positive cells was significantly lower in mice receiving TGF-βRII–/– monocytes than in mice receiving WT monocytes. ***P < 0.001, n = 4 in each group. Original magnification: ×600.
Discussion
The present studies determined that selective deletion of the type II TGF-β receptor in macrophages ameliorated tubulointerstitial fibrosis resulting from severe acute ischemic renal injury. Decreased fibrosis was accompanied by marked decreases in expression of myofibroblasts, oxidative stress, and cytokines that mediate fibrosis. These results were similar in 2 complementary models of fibrosis following AKI as well as a model of spontaneous tubulointerstitial fibrosis driven by proximal tubule overexpression of HB-EGF and were consistently seen with 2 different Cre drivers of macrophage TGF-βRII deletion (CD11b-Cre and LysM-Cre). The striking finding was that this relative protection was correlated with a decreased total number of renal macrophages rather than alterations in macrophage phenotype per se (data not shown) and indicate a heretofore undescribed role, to our knowledge, for the increased renal expression of TGF-β during progressive fibrotic injury to serve as a potent chemoattractant for macrophage recruitment to the kidney.
Previous studies by us and others have indicated an important role for macrophages with an M2, or “reparative,” phenotype in recovery from acute ischemic injury (4–7). It is well recognized in other tissues that for macrophages, these M2 macrophages can be a “two-edged sword,” essential for adequate tissue repair but also a potential mediator of fibrosis and scarring (16), but their role in mediation of renal fibrosis resulting from severe AKI has not been previously explored in detail to our knowledge.
Because M2 macrophages produce TGF-β, it has been postulated that a mechanism for postischemic renal fibrosis was to serve as a major source of this profibrotic cytokine. However, studies from the Cantley group determined that selective deletion of TGF-β1 in macrophages did not alter development of fibrosis after either ischemic injury or unilateral ureteral obstruction (10). We have previously reported that following macrophage deletion with clodronate, progressive increases in TGF-β1 expression in renal tissue accompanied the incomplete recovery from acute tubular injury and development of progressive tubulointerstitial fibrosis (7), consistent with previous studies demonstrating increased TGF-β production from tubule epithelia with partial dedifferentiation and with or after cell cycle arrest in G2/M (17) as well as from myofibroblasts (18). In this regard, we could detect marked TGF-β1 immunostaining in proximal tubules of WT mice at 4 weeks in the AKI/CKD model, with decreased immunostaining in the macrophage TGF-βRII–/–mice, while expression of TGF-β1 mRNA in macrophages isolated from the injured kidneys was not different (data not shown).
TGF-β is a potent chemoattractant for circulating monocytes at femtomolar concentrations (15). Our in vitro and in vivo studies indicated that deletion of TGF-βRII in monocytes/macrophages selectively impaired their chemotaxis in response to TGF-β1. Migration in response to a well-described chemoattractant, f-Met-Leu-Phe, was not different between WT and CD11b-Cre Tgfbr2fl/fl monocytes, nor were there any differences in response to fetal bovine serum (data not shown), ruling out any global defect in migration in monocytes with TGF-βRII deletion. However, although TGF-β1 was an effective chemoattractant for WT monocytes, it did not induce significant chemotaxis in CD11b-Cre Tgfbr2fl/fl monocytes. We found a similar selective migratory defect in response to TGF-β1 in vivo in CD11b-Cre Tgfbr2fl/fl mice. Furthermore, there was markedly decreased homing to the injured kidney of labeled monocytes from macrophage TGF-βRII–/– mice compared with monocytes from WT mice.
Aside from TGF-β, there are numerous other potential cytokines derived from macrophages that may mediate progressive tubulointerstitial fibrosis in mouse kidneys, including osteopontin, components of hedgehog signaling, and FIZZ1/RELM-α. Of note, FIZZ1, a well-described M2 marker in mouse macrophages, is a secreted glycoprotein. Recent studies in lung tissue have suggested that FIZZ1 can activate jagged-1/notch signaling in pulmonary fibroblasts (19) and can induce fibroblasts to increase collagen crosslinks by upregulating lysyl hydroxylase 2 (20). In addition, there is evidence that fibrocytes derived from bone marrow monocytes (21, 22) are mediators of renal fibrosis (23, 24).
Of note, the role of TGF-β signaling in different renal cell types is complicated in response to different types of kidney injury. Inhibition of TGF-β signaling in both endothelial cells and proximal tubular cells has been reported to attenuate kidney injury and development of fibrosis (25, 26). On the other hand, TGF-β signaling inhibition in the collecting duct exacerbates fibrosis (27), while TGF-β signaling inhibition in matrix-producing interstitial cells does not significantly affect renal fibrosis in either unilateral ureteral obstruction or aristolochic acid renal injury models (28). In addition, partial epithelial-mesenchymal transition may be involved in TGF-β–signaling mediated fibrosis.
In summary, selective deletion of macrophage TGF-βRII protects against the development of tubulointerstitial fibrosis following severe ischemic renal injury. Given that renal TGF-β expression was greater in the WT kidneys 4 weeks after ischemic injury and the observed decrease in renal macrophages and impaired macrophage chemotactic response to TGF-β in mice with macrophage deletion of TGF-βRII, we propose that induction of renal macrophage migration is a previously underappreciated mechanism by which TGF-β can mediate renal fibrosis during progressive renal injury.
Methods
Animals.
All animal experiments were performed in accordance with the guidelines of and with the approval of the Institutional Animal Care and Use Committee of Vanderbilt University. Tgfbr2fl/fl mice were crossed with either CD11b-Cre– or LysM-Cre–transgenic mice (all on C57BL/6 backgrounds) to produce mice with selective deletion of TGF-βRII in monocytes/macrophages. CD11b-Cre mice with transgene integration in the Y chromosome were generated in Vacher’s laboratory (29, 30). Unless otherwise indicated in the text, all injury models were repeated in both models of TGF-βRII deletion. Only male mice were used for the experiments.
AKI models.
I/R injury was performed as previously described (7). Briefly, the animal was uninephrectomized, immediately followed by unilateral I/R with renal pedicle clamping for 31 minutes.
AKI/CKD models.
The AKI/CKD fibrotic model was performed as previously described (11). Briefly, the unilateral renal pedicle was clamped for 31 minutes, and the other kidney was left in place. After 8 days, the uninjured kidney was removed. This model produced consistent and marked tubulointerstitial fibrosis by 28 days after the initial insult.
hHB-EGFTg/Tg tubulointerstitial fibrotic model.
hHB-EGFTg/Tg mice develop spontaneous tubulointerstitial fibrosis due to selective overexpression of the EGFR ligand, HB-EGF, in renal proximal tubules (31). We crossed hHB-EGFTg/Tg with Tgfbr2fl/fl mice and CD11b-Cre mice (all on C57BL/6 backgrounds) to generate Tgfbr2fl/fl hHB-EGFTg/Tg mice and CD11b-Cre Tgfbr2fl/fl hHB-EGFTg/Tg (macrophage TGF-βRII–/– hHB-EGFTg/Tg) mice.
Measurement of serum BUN and creatinine and urinary albumin excretion.
BUN was measured using a urea assay kit (BioAssay Systems), and serum creatinine was measured using a previously described HPLC method (32). Spot urine was individually collected in a 96-well chamber. Urinary albumin and creatinine excretion was determined using Albuwell-M kits (Exocell Inc). Albuminuria was expressed as the ratio of urinary albumin (μg/ml) to creatinine (mg/ml).
Isolation of BMMs.
Tgfbr2fl/fl mice and CD11b-Cre Tgfbr2fl/fl mice were anesthetized with isoflurane and sacrificed by cervical dislocation, and then femurs, tibias, and humeri were dissected. The shafts were flushed using a syringe and a 26-gauge needle with RPMI1640 supplemented with 100 U/ml penicillin, 100 μg/ml streptomycin, 10 U/ml heparin, and 0.2% fetal bone serum (FBS). The cell suspension was passed through a 40-μm strainer and centrifuged, and the pellet was resuspended in 3 ml red blood cell lysis buffer and incubated for 10 minutes on ice. After centrifugation, the pellet was resuspended with 10 ml Dulbecco’s PBS containing 0.5% FBS, followed by monocyte isolation using a monocyte isolation kit for mice (Miltenyi Biotec, 130-100-629).
In vitro monocyte migration assay.
We used a modification of a protocol assessing migration through transwells (33). Freshly isolated BMMs (75,000 cells) were seeded in the top chamber of a 24-well PET membrane (8-μm pore size) with or without 1 hour of pretreatment with 5 μM Smad inhibitor SIS3 (Calbiochem CAS 1009104-85-1). Cells translocated to the lower chamber in response to exposure in the lower chamber of vehicle, 250 μM FMLP (F3506, Sigma-Aldrich), or recombinant TGF-β (10 ng/ml) for 3 hours. Cells in the upper chamber were removed with a cotton swab, and the filters were fixed with 70% ethanol and stained with 0.2% crystal violet. Filters were photographed on a Leica DMi1 microscope and total cell number was counted.
In vivo monocyte migration assay.
We used modifications of a method described by Serrati et al (34). Two groups of animals were used: Tgfbr2fl/fl mice and LysM-Cre Tgfbr2fl/fl mice. All equipment and reagents were chilled on ice before use. The back of the mouse was shaved and sterilized, and a 24-gauge needle was inserted subcutaneously. On each side of the back, a wide subcutaneous pocket was formed by swaying the needlepoint right and left. The Corning Matrigel matrix (0.5 ml, 354243, Corning Incorporated, Life Sciences) suffused with FMLP (250 μM) was injected into the right pocket and matrix suffused with TGF-β1 (1 μg/ml) into the left pocket. A clump was visible on each side after the injection. Six days after injection, the mice were perfused as described previously (35); the matrigel clumps and their attached skin and muscle layer were dissected, embedded in paraffin, sectioned at 4-μm thickness, and stained with F4/80 (marker of macrophages).
Monocyte migration into kidney injury assay.
PKH26 labeling of BMMs was performed as previously described (7). PKH26 red fluorescent cell linker kit for phagocytic cell labeling (Sigma-Aldrich) was used to label BMMs following the manufacturer’s protocol. Each mouse received 2 million PKH26-labeled BMMs via retro-orbital injection 10 days after uninephrectomy in the AKI/CKD model. Three days later, animals were sacrificed, cryosections were prepared, and monocyte infiltration into injured kidney was evaluated by counting the PKH26 (red) and F4/80 (green) double-positive cells with a Nikon TE300 fluorescence microscope.
Isolation of peritoneal macrophages.
Mice were injected intraperitoneally with 3 ml of sterile thioglycollate medium (3% w/v of an autoclaved stock prepared from dehydrated thioglycollate medium and sterile saline water) (Sigma-Aldrich). Three days later, ice-cold PBS with 3% FBS was injected into the peritoneal cavity. Peritoneal fluid was harvested and centrifuged, and pellets were resuspended in RPMI1640 medium supplemented with 100 U/ml penicillin, 100 μg/ml streptomycin, 10 U/ml heparin, and 10% FBS and seeded in a 10-cm dish for 3 hours. After washing 3 times with culture medium, the cells were used for study.
Masson’s trichrome staining, Sirius red staining, and periodic acid-Schiff staining.
They were all performed according to the protocols provided by the manufacturer (Sigma-Aldrich).
Antibodies.
Rat anti-mouse F4/80 (MCA497R, a marker of macrophages) and CD3 (MCA1477, a marker of T lymphocytes) were purchased from AbD Serotec (now Bio-Rad); mouse anti–mannose receptor (CD206, MAB25341) and mouse anti–4-HNE (a marker of oxidative stress, 198960) were from R&D Systems; rabbit anti–TGF-βRII (SC-400) and goat anti-human CTGF (SC-14939) were from Santa Cruz Biotechnology; rabbit anti-human Smad2 (600-401-A59), phospho-Smad2 (600-401-K09S), and phospho-Smad3 (600-401-919) as well as rabbit anti-murine collagen type I (600-401-103-01) were from Rockland Immunochemicals; mouse anti–α-SMA (A5228, a marker of myofibroblasts) was from Sigma-Aldrich; and rabbit anti–TGF-β1 (NBP1-80289) and mouse anti–TGF-β2 (Mab612-SP) were from Novus Biologicals.
RNA isolation and quantitative reverse transcription PCR.
Total renal RNAs were isolated using TRIzol reagents (Invitrogen). Quantitative reverse transcription PCR was performed using TaqMan real-time PCR assay (7900HT; Applied Biosystems). The Master Mix and all gene probes were also purchased from Applied Biosystems. The probes used in the experiments included mouse S18 (Mm02601778), collagen I (Col1a1, Mm00801666), collagen III (col3a1, Mm01254476), α-SMA (acta2, Mm01546133), CTGF (Mm01192932), TGF-β (Mm00441726), F4/80 (Emr1, Mm00802529), Ly6C2 (Mm03009946), CD3 (Cd3d, Mm00442746), mannose receptor (Mrc1, Mm01329362), CD209 (Cd209a, a marker of M2a, Mm00460067), CD150 (Slamf1, a marker of M2c, Mm00443316), iNOS (Mm00440502), TNF-α (Mm99999068), IL-1α (Mm00439621), IL-1β (Mm00434228), CCL2 (MCP-1, Mm00441242), CCL3 (Mm00441258), and GM-CSF (csf2, Mm01290062).
Immunofluorescence/immunohistochemistry staining.
The animals were anesthetized with Nembutal (70 mg/kg, i.p.) and exsanguinated with heparinized saline (2U/ml heparin in 0.9% NaCl) to minimize coagulation through a transcardial aortic cannula. The kidney was immersed overnight for immunohistochemical and immunofluorescent staining with FPAS (3.7% formaldehyde, 10 μM sodium metaperiodate, 40 μM phosphate buffer, and 1% acetic acid), which provides excellent preservation of tissue structure and antigenicity of mRNA (35). The fixed kidney was dehydrated through a graded series of ethanols, embedded in paraffin, sectioned (4 μm), and mounted on glass slides. Immunostaining, quantitative image analysis, and immunofluorescent staining were carried out as in previous reports (36, 37).
Quantitative image analysis.
Based on the distinctive density and color of immunoreactivity and Masson’s trichrome staining and Sirius red staining in video images, the number, size, and position of stained cells were quantified using the BIOQUANT true-color windows system (R&M Biometrics, Inc) equipped with digital stage encoders that allow high-magnification images to be mapped to global coordinates throughout the whole section. Sections from 6 regions of each kidney were analyzed, and the positive area versus area of interest ratio was used as data from 1 animal sample.
Immunoblotting.
Kidney samples were homogenized with a buffer containing 10 μM Tris·HCl (pH 7.4), 50 μM NaCl, 2 μM EGTA, 2 μM EDTA, 0.5% Nonidet P-40, 0.1% SDS, 100 μM Na3VO4, 100 μM NaF, 0.5% sodium deoxycholate, 10 μM sodium pyrophosphate, 1 μM PMSF, 10 μg/ml aprotinin, and 10 μg/ml leupeptin. The homogenate was centrifuged at 15,000 × g for 20 minutes at 4°C. An aliquot of supernatant was taken for protein measurement with a BCA protein assay kit (Thermo Fisher Scientific). Immunoblotting was described in a recent report (38).
Micrography.
Bright field images from a Leitz Orthoplan microscope with DVC digital RGB video camera were digitized and saved as computer files. Contrast and color level adjustments (Adobe Photoshop) were performed for the entire image; in essence, no region- or object-specific editing or enhancements were performed.
Statistics.
All values are presented as means, with error bars representing ± SEM. Two-tailed Student’s t test, 2-way ANOVA, and Bonferroni’s t test were used for statistical analysis. A P value less than 0.05 was considered significant.
Study approval.
All animal experiments were performed with the approval of and in accordance with the guidelines of the Institutional Animal Care and Use Committee of Vanderbilt University.
Author contributions
SC, JMO, YL, YW, AN, SW, XF, KS, GNJ, SNK, LG, MZZ, and RCH performed the studies. MZZ and RCH wrote the manuscript.
Supplementary Material
Acknowledgments
This work was supported by the NIH, National Institute of Diabetes and Digestive and Kidney Diseases (DK051265 to MZZ and RCH, DK062794 to RCH, DK095785 to MZZ and RCH, and DK108968 to LG), by the Vanderbilt O’Brien Kidney Center DK114809 (to RCH, MZZ, and LG), by funds from the U.S. Department of Veterans Affairs (to RCH) and by an American Heart Association Postdoctoral Fellowship Award to SNK.
Version 1. 11/02/2018
Electronic publication
Footnotes
Conflict of interest: The authors have declared that no conflict of interest exists.
License: Copyright 2018, American Society for Clinical Investigation.
Reference information: JCI Insight. 2018;3(21):e123563. https://doi.org/10.1172/jci.insight.123563.
Contributor Information
Sungjin Chung, Email: chungs@catholic.ac.kr.
Yan Li, Email: yan.li.1@vanderbilt.edu.
Yinqiu Wang, Email: yinqiu.wang@vanderbilt.edu.
Aolei Niu, Email: aolei.niu@vanderbilt.edu.
Suwan Wang, Email: suwan.wang@Vanderbilt.Edu.
Xiaofeng Fan, Email: xiaofeng.fan@vanderbilt.edu.
Kensuke Sasaki, Email: kensuke.sasaki@vumc.org.
Guan-Nan Jin, Email: guan-nan.jin@vumc.org.
Stellor Nlandu Khodo, Email: stellor.nlandu.khodo@vanderbilt.edu.
Ming-Zhi Zhang, Email: ming-zhi.zhang@vanderbilt.edu.
References
- 1.Ponte B, Felipe C, Muriel A, Tenorio MT, Liaño F. Long-term functional evolution after an acute kidney injury: a 10-year study. Nephrol Dial Transplant. 2008;23(12):3859–3866. doi: 10.1093/ndt/gfn398. [DOI] [PubMed] [Google Scholar]
- 2.Hörbelt M, et al. Acute and chronic microvascular alterations in a mouse model of ischemic acute kidney injury. Am J Physiol Renal Physiol. 2007;293(3):F688–F695. doi: 10.1152/ajprenal.00452.2006. [DOI] [PubMed] [Google Scholar]
- 3.Lo LJ, et al. Dialysis-requiring acute renal failure increases the risk of progressive chronic kidney disease. Kidney Int. 2009;76(8):893–899. doi: 10.1038/ki.2009.289. [DOI] [PMC free article] [PubMed] [Google Scholar]
- 4.Zhang MZ, et al. IL-4/IL-13-mediated polarization of renal macrophages/dendritic cells to an M2a phenotype is essential for recovery from acute kidney injury. Kidney Int. 2017;91(2):375–386. doi: 10.1016/j.kint.2016.08.020. [DOI] [PMC free article] [PubMed] [Google Scholar]
- 5.Wang Y, et al. Proximal tubule-derived colony stimulating factor-1 mediates polarization of renal macrophages and dendritic cells, and recovery in acute kidney injury. Kidney Int. 2015;88(6):1274–1282. doi: 10.1038/ki.2015.295. [DOI] [PMC free article] [PubMed] [Google Scholar]
- 6.Lee S, et al. Distinct macrophage phenotypes contribute to kidney injury and repair. J Am Soc Nephrol. 2011;22(2):317–326. doi: 10.1681/ASN.2009060615. [DOI] [PMC free article] [PubMed] [Google Scholar]
- 7.Zhang MZ, et al. CSF-1 signaling mediates recovery from acute kidney injury. J Clin Invest. 2012;122(12):4519–4532. doi: 10.1172/JCI60363. [DOI] [PMC free article] [PubMed] [Google Scholar]
- 8.Day YJ, Huang L, Ye H, Linden J, Okusa MD. Renal ischemia-reperfusion injury and adenosine 2A receptor-mediated tissue protection: role of macrophages. Am J Physiol Renal Physiol. 2005;288(4):F722–F731. doi: 10.1152/ajprenal.00378.2004. [DOI] [PubMed] [Google Scholar]
- 9.Huen SC, Cantley LG. Macrophages in renal injury and repair. Annu Rev Physiol. 2017;79:449–469. doi: 10.1146/annurev-physiol-022516-034219. [DOI] [PubMed] [Google Scholar]
- 10.Huen SC, Moeckel GW, Cantley LG. Macrophage-specific deletion of transforming growth factor-β1 does not prevent renal fibrosis after severe ischemia-reperfusion or obstructive injury. Am J Physiol Renal Physiol. 2013;305(4):F477–F484. doi: 10.1152/ajprenal.00624.2012. [DOI] [PMC free article] [PubMed] [Google Scholar]
- 11.Skrypnyk NI, Harris RC, de Caestecker MP. Ischemia-reperfusion model of acute kidney injury and post injury fibrosis in mice. J Vis Exp. 2013;(78) doi: 10.3791/50495. [DOI] [PMC free article] [PubMed] [Google Scholar]
- 12.Overstreet JM, et al. Selective activation of epidermal growth factor receptor in renal proximal tubule induces tubulointerstitial fibrosis. FASEB J. 2017;31(10):4407–4421. doi: 10.1096/fj.201601359RR. [DOI] [PMC free article] [PubMed] [Google Scholar]
- 13.Wang X, et al. Macrophage cyclooxygenase-2 protects against development of diabetic nephropathy. Diabetes. 2017;66(2):494–504. doi: 10.2337/db16-0773. [DOI] [PMC free article] [PubMed] [Google Scholar]
- 14.Bolisetty S, et al. Macrophage and epithelial cell H-ferritin expression regulates renal inflammation. Kidney Int. 2015;88(1):95–108. doi: 10.1038/ki.2015.102. [DOI] [PMC free article] [PubMed] [Google Scholar]
- 15.Ashcroft GS, et al. Mice lacking Smad3 show accelerated wound healing and an impaired local inflammatory response. Nat Cell Biol. 1999;1(5):260–266. doi: 10.1038/12971. [DOI] [PubMed] [Google Scholar]
- 16.Eming SA, Wynn TA, Martin P. Inflammation and metabolism in tissue repair and regeneration. Science. 2017;356(6342):1026–1030. doi: 10.1126/science.aam7928. [DOI] [PubMed] [Google Scholar]
- 17.Yang L, Besschetnova TY, Brooks CR, Shah JV, Bonventre JV. Epithelial cell cycle arrest in G2/M mediates kidney fibrosis after injury. Nat Med. 2010;16(5):535–543. doi: 10.1038/nm.2144. [DOI] [PMC free article] [PubMed] [Google Scholar]
- 18.Meng XM, Nikolic-Paterson DJ, Lan HY. TGF-β: the master regulator of fibrosis. Nat Rev Nephrol. 2016;12(6):325–338. doi: 10.1038/nrneph.2016.48. [DOI] [PubMed] [Google Scholar]
- 19.Liu T, et al. Notch1 signaling in FIZZ1 induction of myofibroblast differentiation. Am J Pathol. 2009;174(5):1745–1755. doi: 10.2353/ajpath.2009.080618. [DOI] [PMC free article] [PubMed] [Google Scholar]
- 20.Knipper JA, et al. Interleukin-4 receptor α signaling in myeloid cells controls collagen fibril assembly in skin repair. Immunity. 2015;43(4):803–816. doi: 10.1016/j.immuni.2015.09.005. [DOI] [PMC free article] [PubMed] [Google Scholar]
- 21.Niedermeier M, et al. CD4+ T cells control the differentiation of Gr1+ monocytes into fibrocytes. Proc Natl Acad Sci U S A. 2009;106(42):17892–17897. doi: 10.1073/pnas.0906070106. [DOI] [PMC free article] [PubMed] [Google Scholar]
- 22.Reilkoff RA, Bucala R, Herzog EL. Fibrocytes: emerging effector cells in chronic inflammation. Nat Rev Immunol. 2011;11(6):427–435. doi: 10.1038/nri2990. [DOI] [PMC free article] [PubMed] [Google Scholar]
- 23.LeBleu VS, et al. Origin and function of myofibroblasts in kidney fibrosis. Nat Med. 2013;19(8):1047–1053. doi: 10.1038/nm.3218. [DOI] [PMC free article] [PubMed] [Google Scholar]
- 24.Buchtler S, et al. Cellular origin and functional relevance of collagen I production in the kidney. J Am Soc Nephrol. 2018;29(7):1859–1873. doi: 10.1681/ASN.2018020138. [DOI] [PMC free article] [PubMed] [Google Scholar]
- 25.Gewin L, et al. Deleting the TGF-β receptor attenuates acute proximal tubule injury. J Am Soc Nephrol. 2012;23(12):2001–2011. doi: 10.1681/ASN.2012020139. [DOI] [PMC free article] [PubMed] [Google Scholar]
- 26.Xavier S, et al. Curtailing endothelial TGF-β signaling is sufficient to reduce endothelial-mesenchymal transition and fibrosis in CKD. J Am Soc Nephrol. 2015;26(4):817–829. doi: 10.1681/ASN.2013101137. [DOI] [PMC free article] [PubMed] [Google Scholar]
- 27.Gewin L, et al. TGF-beta receptor deletion in the renal collecting system exacerbates fibrosis. J Am Soc Nephrol. 2010;21(8):1334–1343. doi: 10.1681/ASN.2010020147. [DOI] [PMC free article] [PubMed] [Google Scholar]
- 28.Neelisetty S, et al. Renal fibrosis is not reduced by blocking transforming growth factor-β signaling in matrix-producing interstitial cells. Kidney Int. 2015;88(3):503–514. doi: 10.1038/ki.2015.51. [DOI] [PMC free article] [PubMed] [Google Scholar]
- 29.Ferron M, Vacher J. Targeted expression of Cre recombinase in macrophages and osteoclasts in transgenic mice. Genesis. 2005;41(3):138–145. doi: 10.1002/gene.20108. [DOI] [PubMed] [Google Scholar]
- 30.Chang J, et al. Prostaglandin E receptor 4 (EP4) promotes colonic tumorigenesis. Oncotarget. 2015;6(32):33500–33511. doi: 10.18632/oncotarget.5589. [DOI] [PMC free article] [PubMed] [Google Scholar]
- 31.Overstreet JM, et al. Selective activation of epidermal growth factor receptor in renal proximal tubule induces tubulointerstitial fibrosis. FASEB J. 2017;31(10):4407–4421. doi: 10.1096/fj.201601359RR. [DOI] [PMC free article] [PubMed] [Google Scholar]
- 32.Zhao HJ, et al. Endothelial nitric oxide synthase deficiency produces accelerated nephropathy in diabetic mice. J Am Soc Nephrol. 2006;17(10):2664–2669. doi: 10.1681/ASN.2006070798. [DOI] [PMC free article] [PubMed] [Google Scholar]
- 33.Green TD, et al. Directed migration of mouse macrophages in vitro involves myristoylated alanine-rich C-kinase substrate (MARCKS) protein. J Leukoc Biol. 2012;92(3):633–639. doi: 10.1189/jlb.1211604. [DOI] [PMC free article] [PubMed] [Google Scholar]
- 34.Serratì S, et al. TGF-β1 antagonistic peptides inhibit TGFbeta1-dependent angiogenesis. Biochem Pharmacol. 2009;77(5):813–825. doi: 10.1016/j.bcp.2008.10.036. [DOI] [PubMed] [Google Scholar]
- 35.Zhang MZ, Wang JL, Cheng HF, Harris RC, McKanna JA. Cyclooxygenase-2 in rat nephron development. Am J Physiol. 1997;273(6 Pt 2):F994–1002. doi: 10.1152/ajprenal.1997.273.6.F994. [DOI] [PubMed] [Google Scholar]
- 36.Zhang MZ, Wang Y, Paueksakon P, Harris RC. Epidermal growth factor receptor inhibition slows progression of diabetic nephropathy in association with a decrease in endoplasmic reticulum stress and an increase in autophagy. Diabetes. 2014;63(6):2063–2072. doi: 10.2337/db13-1279. [DOI] [PMC free article] [PubMed] [Google Scholar]
- 37.Zhang MZ, et al. Inhibition of cyclooxygenase-2 in hematopoietic cells results in salt-sensitive hypertension. J Clin Invest. 2015;125(11):4281–4294. doi: 10.1172/JCI81550. [DOI] [PMC free article] [PubMed] [Google Scholar]
- 38.Zhang MZ, et al. Role of epoxyeicosatrienoic acids (EETs) in mediation of dopamine’s effects in the kidney. Am J Physiol Renal Physiol. 2013;305(12):F1680–F1686. doi: 10.1152/ajprenal.00409.2013. [DOI] [PMC free article] [PubMed] [Google Scholar]
Associated Data
This section collects any data citations, data availability statements, or supplementary materials included in this article.


