

Summary
We apply stable isotope tracing, mass-spectrometry-based untargeted metabolomics, to reveal the biochemical space labeled by 13C-substrates in bone-marrow-derived macrophages. At the pathway level, classically (lipopolysaccharide [LPS]-polarized, M1) and alternatively (interleukin [IL]-4-polarized, M2) polarized macrophages were 13C-labeled with surprising concordance. Total pools of uridine diphosphate N-acetylglucosamine (UDP-GlcNAc), an intermediate in the hexosamine biosynthetic pathway, were equally abundant in LPS- and IL-4-polarized macrophages. Informatic scrutiny of 13C-isotopologues revealed that LPS-polarized macrophages leverage the pentose phosphate pathway to generate UDP-GlcNAc, whereas IL-4-polarized macrophages rely on intact glucose and mitochondrial metabolism of glucose carbon. Labeling from [13C]glucose is competed by unlabeled fatty acids and acetoacetate, underscoring the broad roles for substrate metabolism beyond energy conversion. Finally, the LPS-polarized macrophage metabolite itaconate is imported into IL-4-polarized macrophages, in which it reprograms [13C]glucose metabolism. Thus, use of fully unsupervised isotope tracing metabolomics in macrophages reveals polarization-state-specific metabolic pathway connectivity, substrate competition, and metabolite allocation among cellular compartments.
Subject Areas: Components of the Immune System, Immunology, Metabolomics
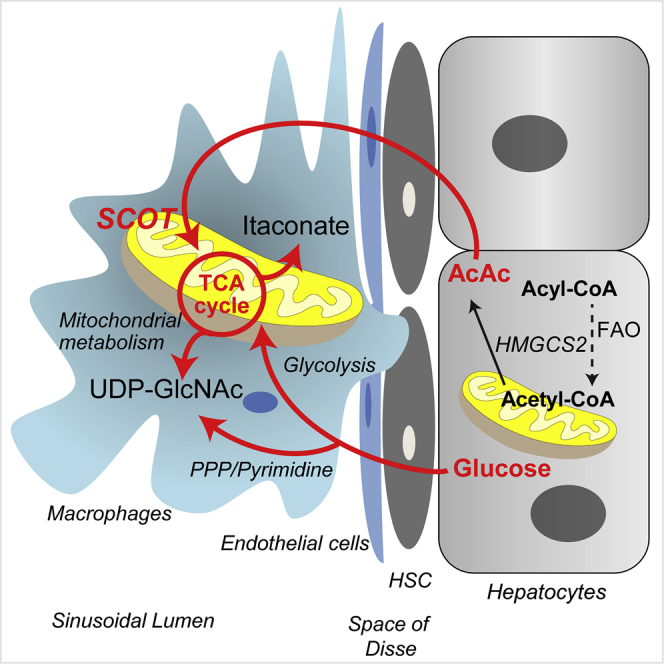
Graphical Abstract
Highlights
-
•
Classically and alternatively polarized macrophages leverage hexosamine biosynthesis
-
•
Multiple carbon sources support hexosamine and itaconate biosynthesis
-
•
Intracellular metabolic compartmentation varies with macrophage polarization
-
•
Itaconate is imported into alternatively polarized macrophages
Components of the Immune System; Immunology; Metabolomics
Introduction
Macrophages participate in both the innate and adaptive immune systems to maintain tissue homeostasis, monitor and modulate the microenvironment via surface receptors, and coordinate other immune cell functions via cytokine signaling (Geeraerts et al., 2017, Kim et al., 2016). Although an oversimplification of the temporal plasticity and diversity of macrophage function, the M1/M2 paradigm of macrophage polarization characterizes different macrophage populations. Classically polarized (lipopolysaccharide [LPS]-polarized, M1) macrophages are triggered by toll-like receptor ligands, e.g., bacterial LPS, to induce a cascade promoting proinflammatory gene expression (e.g., Il1b, Il6, Tnfa, Nos2) (Tur et al., 2017). Alternatively polarized (interleukin [IL]-4-polarized, M2) macrophages are triggered by IL-4 or IL-13 and express arginase 1 (Arg1) to support in post-inflammatory wound healing response (Martinez and Gordon, 2014). In addition to signaling cascades, metabolic signatures are also cardinal elements of macrophage polarization states (Artyomov et al., 2016, Geeraerts et al., 2017) and emerge as an integral part of their polarization states, affecting and actively communicating with the signaling cascades. Classically polarized macrophages rely on glycolysis, activate the pentose phosphate pathway (PPP), support pyruvate influx into the first span of the tricarboxylic acid (TCA, Krebs) cycle via pyruvate dehydrogenase (PDH), and produce reactive oxygen species (ROS) (Martinez and Gordon, 2014, Meiser et al., 2016). A fragmented TCA cycle supports the decarboxylation of cis-aconitate to itaconate (Michelucci et al., 2013, Strelko et al., 2011) and activation of mitochondrial citrate carrier shunt to sustain cytosolic lipid biosynthesis (Feingold et al., 2012, Infantino et al., 2013). Anaplerotic entry of glutamine into the TCA cycle, as well as inhibition of succinate dehydrogenase by itaconate, increases the succinate pool in LPS-polarized cells, which together with ROS stabilizes the transcription factor HIF-1α to promote pro-inflammatory and glycolytic gene expression (Cordes et al., 2016, Lampropoulou et al., 2016; Mills et al., 2016, Tannahill et al., 2013). In contrast, IL-4-polarized macrophages rely on oxidative phosphorylation sustained by fatty acid β-oxidation or glutamine metabolism (Jha et al., 2015), suppress glycolysis and the PPP, and direct arginine to produce L-ornithine, L-proline, and polyamines, the building blocks of collagen (Geeraerts et al., 2017). More recent work highlights the controversies in substrate utilization of differentially polarized macrophages and indicates the need to reassess the traditional view. For example, β-oxidation of fatty acids in IL-4-polarized macrophages may be dispensable for the M2 phenotype (Divakaruni et al., 2018, Gonzalez-Hurtado et al., 2017, Nomura et al., 2016, Van den Bossche and van der Windt, 2018), whereas glucose metabolism may be essential only when fatty acid oxidation is impaired (Huang et al., 2016, Wang et al., 2018). Other metabolites such as α-ketoglutarate can also influence metabolic/epigenetic responses in both LPS- and IL-4-polarized phenotypes (Liu et al., 2017), and although uridine diphosphate N-acetylglucosamine (UDP-GlcNAc), an intermediate in the hexosamine biosynthetic pathway (HBP), has been reported to reflect the M2 state (Jha et al., 2015), it is also enriched in LPS-polarized macrophages (Fei et al., 2016).
The power of liquid chromatography (LC)-high-resolution mass spectrometry (MS)-based untargeted metabolomics to identify and quantify small molecules tightly connected with cell phenotypes has been recently reviewed (Cho et al., 2014, Guijas et al., 2018). The functionality of untargeted metabolomics can be further extended by the addition of stable isotope-labeled substrates, whose labeled atoms can be tracked as metabolic substrates are metabolized in various pathways into downstream products. Most studies rely on alterations in static metabolite pools revealed by (un)targeted metabolomics approaches, or analyze metabolic targets of stable isotopically labeled substrates in a supervised fashion, confirming known pathway activity or quantifying metabolic fluxes (Jang et al., 2018, Zamboni et al., 2015). A more recent approach is to track variations in both total pool sizes and isotopically labeled isotopologues (identical compounds containing different numbers of stable isotope labels incorporated) globally and in a fully unbiased fashion, giving an opportunity to uncover shifts in pathway utilization and with higher resolution than either static or targeted approaches (Weindl et al., 2015). The power of high-mass-accuracy untargeted metabolomics to track stable isotopes supports such screens for unanticipated substrate utilization and reveals differential penetration of label, supporting both discovery and hypothesis-generating observations.
Here, we apply the X13CMS bioinformatics (Huang et al., 2014) platform to characterize the shifts in substrate utilization during macrophage polarization by LPS or IL-4. Our data reveal differences in intracellular compartmentalization of substrate utilization that vary with polarization state. The HBP and itaconate biosynthesis are representative pathways, disclosing unrecognized specificities in M1 versus M2 macrophages. Detailed surveillance of distinct 13C-labeled substrates revealed that multiple substrates co-opt the same pathways, but utilization is influenced by macrophage polarization state. Finally, our data reveal that the itaconate product of LPS-polarized macrophages is able to reprogram the metabolism of non-inflammatory macrophages. These observations underscore the utility of measuring metabolic states in a high-resolution and unbiased manner and refine our insights into the metabolic behavior of polarized macrophages.
Results
Classically and Alternatively Polarized Macrophages Both Exploit the Hexosamine Biosynthetic Pathway through Unique Metabolic Nodes in Distinct Cellular Compartments
To study the metabolic fates of glucose in macrophages, we cultured primary bone-marrow-derived macrophages (BMDMs) harvested from C57BL/6 mice and first confirmed their phenotypic responses to stimulants of the classical (LPS) and alternative (IL-4) polarization phenotypes (Puchalska et al., 2018). We then used high-mass-accuracy LC/MS untargeted metabolomics to analyze extracts from polarized cells exposed to 10 mM [U-13C6]glucose and analyzed the data using X13CMS (Huang et al., 2014). This fully unsupervised approach reveals differences in stable isotopically labeled substrate fate across the metabolome. Out of 8,715 features (ordered pairs of m/z and chromatographic retention time that correspond to putative metabolites), X13CMS identified 270, 374, and 321 13C-labeled isotopologue groups in control, LPS-, and IL-4-polarized BMDMs, respectively (Table S1). The molecular identity of a subset of these features was assigned by matching MS/MS of standard compounds eluted at same retention time using the same chromatography method (Figure S1A; also see Transparent Methods). Accentuated 13C-labeling of glycolytic and PPP intermediates (PPP, also known as the hexose monophosphate shunt) in LPS-polarized macrophages validated this isotope tracing untargeted metabolomics (ITUM) method (Figure S1B) (Geeraerts et al., 2017).
We next performed an unsupervised analysis of the numbers of carbons incorporated from [13C]glucose into the metabolome covered by our detection pipeline. Interestingly, when normalized to natural abundance carbon signals (1.1% of all carbon in the environment is 13C, depicted as a blue line), all macrophage states exhibited substantially increased numbers of M+3, M+5, M+6, and M+12 isotopologues, indicating transit through three-carbon glycolytic intermediates, intact glucose, or glucose-derived five-carbon sugars (possibly from the PPP; Figure 1A). Therefore, we filtered the list of shared features between LPS- and IL-4-polarized macrophages with significant differences in [13C]glucose incorporation (any isotopologue difference >0.1 with p value < 0.05) (Table S2). Putative identifications of 89 shared and differentially labeled features were assigned using a combination of (1) the PIUMet tool for network integration of untargeted metabolomics data (Pirhaji et al., 2016), (2) molecular formulas and structures capable of generating the observed number of carbon labels in a biological context, and (3) predicted retention time based on chemical similarity to standard compounds (Figure S1A, Tables S1 and S2). From 89 differentially labeled features, 29 putative metabolites were identified. Although the largest number of M+3 isotopologues accumulated in LPS-polarized macrophages (Figure 1A), putative lysophosphatidylethanolamine (LysoPE, 20:5 and 22:5) species exhibited ∼50% increased abundance of the M+3 isotopologue in IL-4-polarized macrophages (Figures S2, S3A, and S3B), corresponding to the diversion of [13C]glucose-derived glycerone phosphate intermediate into glycerophospolipid metabolism (Figure S2). Five of the 29 metabolites putatively identified and labeled by [13C]glucose contained pyrimidine backbone, corresponding to either UDP or CDP moieties in their structures (Figures 1B–1D, S3C, and S3D). The M+6 isotopologue of these compounds represents incorporation of intact [U-13C6]glucose and was especially rich in UDP-Glc (Figures 1B and 1E) or UDP-GlcNAc (Figures 1D and 1E) compounds in IL-4-polarized macrophages. The M+5 isotopologue was upregulated in LPS-polarized macrophages and represents integration of ribose from PPP (in UMP [Figures 1C and 1E], UDP [Figures 1E and S3C], or CDP-ethanolamine [Figures 1E and S3D]). For more complex molecules like UDP-Glc or UDP-GlcNAc, the M+11 isotopologue reflects incorporation of intact [U-13C6]glucose with [13C]glucose-derived ribose (from PPP), and the M+8 and M+13 isotopologues add two carbons from a glycolytic-pyruvate-derived acetyl group (Figures 1D and 1E). Robust labeling of intermediates in the pyrimidine metabolic pathway (UDP-Glc, UMP, and UDP) and labeling of UDP-GlcNAc reveals convergence of the cytosolic PPP and HBP in macrophages (Figure 1E). Intriguingly, incorporation of a [13C]glucose-derived acetyl group (through pyruvate decarboxylation, condensation to form citrate in the mitochondria, and subsequent tricarboxylate efflux from mitochondria) into UDP-GlcNAc strongly suggests an integration of mitochondrial metabolism to the otherwise cytoplasmic HBP. Thus the HBP is engaged in both LPS- and IL-4-polarized macrophages, but integration and connectivity among cellular compartments is specific to the polarization state, providing insights and extending previous reports of HBP enlistment in either LPS- or IL-4-polarized macrophages (Fei et al., 2016, Jha et al., 2015).
Figure 1.

Classically and Alternatively Polarized Macrophages Both Exploit the Hexosamine Biosynthetic Pathway but Differentially Integrate Cytosolic and Mitochondrial Metabolism
(A–D) (A) 10 mM [U-13C6]glucose labeling of primary glycolytic intermediates (M+3), intact glucose (M+6, M+12), or glucose-derived sugars (M+5) in unpolarized (control), LPS-polarized (25 ng/mL), or IL-4-polarized (25 ng/mL) wild-type (WT) bone-marrow-derived macrophages (BMDMs) after 24 hr of exposure. 10 mM [U-13C6]glucose labeling of (B) UDP-Glc, (C) UMP, and (D) UDP-GlcNAc in LPS- or IL-4-polarized WT BMDMs after 24 hr of stimulation (n = 4/group).
(E) Labeling map with molecular structures of UDP-Glc, UMP, and UDP-GlcNAc depicting integration of the pentose phosphate pathway (PPP, orange dots), mitochondrial metabolism (gray dots), and pyrimidine pathway into hexosamine biosynthetic pathway (HBP, purple dots).
P, phosphate; Glc, glucose; CIC/ACLY, citrate carrier/ATP citrate lyase; PDH, pyruvate dehydrogenase; CS, citrate synthase. Data expressed as the mean ± standard error of the mean (SEM). Significant differences determined by multiple Student's t test with Holm-Sidak correction when compared with control. *p < 0.05; **p < 0.01; ***p < 0.001; ****p < 0.0001; *****p < 0.00001, as indicated.
Isotopologue Analysis Reveals Efflux of TCA Cycle Intermediates into Itaconate, GABA, and 2-Hydroxyglutarate in IL-4-Polarized Macrophages
Among the ∼500 features labeled, [13C]glucose robustly labeled TCA cycle intermediates (Puchalska et al., 2018). A reference isotopologue enrichment scheme (Figure 2A) depicts labeling of TCA cycle and TCA-cycle-derived intermediates by [U-13C6]glucose, through the first TCA cycle turn, via citrate synthase, pyruvate carboxylase, or both together. The total labeled pool of citrate was similar in all macrophage stimulation states, whereas the labeled pools of glutamate and malate were diminished up to 30% in LPS-polarized macrophages compared with control and IL-4-polarized cells (Figure S4A). The M+2 isotopologue of citrate was increased by ∼60% in LPS-polarized macrophages, suggesting incorporation of glucose-derived two-carbon acetyl groups into the TCA cycle at first turn and its subsequent efflux (Figures 2A and S4B). Indeed, LPS-polarized macrophages utilize citrate for itaconate biosynthesis and also export citrate via the ATP citrate lyase (ACLY)-catalyzed shuttle to produce lipids in the cytosol (Feingold et al., 2012, Infantino et al., 2013, Strelko et al., 2011). Itaconate is an inhibitor of the microbial glyoxylate shunt enzyme isocitrate lyase, and in mammalian immune cells it is derived from the TCA cycle through the decarboxylation of cis-aconitic acid by aconitate decarboxylase (CAD), the product of the immune-responsive 1 (Irg1) gene (Cordes et al., 2015, O'Neill, 2015). The decarboxylation of aconitate by CAD yields the M+1 itaconate isotopologue in LPS-polarized macrophages (Figures 2A and 2B). Contribution of label from [13C]glucose to the M+4 isotopologue of itaconate arises from anaplerotic entry of [13C]pyruvate into the TCA cycle or through a second turn of the TCA cycle, which was suppressed selectively in LPS-polarized macrophages (Figures 2A and 2B). We also observed increased abundance of the M+3 and M+4 isotopologues of glutamate (a reporter of the TCA cycle intermediate α-ketoglutarate) and malate in IL-4-polarized macrophages versus control and LPS-polarized macrophages, suggesting the retention of [13C]acetyl-CoA in the TCA cycle to support the canonical oxidative metabolism in IL-4-polarized macrophages (Figures 2A, S4C, and S4D). Furthermore, as observed for glutamate and malate, M+4 isotopologues of features corresponding to gamma-aminobutyric acid (GABA) and 2-hydroxyglutaric acid (2-HG) were selectively increased in IL-4-polarized macrophages, suggesting alternate sites of efflux for TCA cycle intermediates in IL-4-polarized macrophages that are downstream of those in LPS-polarized macrophages (Figures 2A, 2C, and 2D). The efflux of these metabolites in unpolarized and LPS-polarized macrophages is much less pronounced, as indicated by the increased unlabeled fraction of total metabolite pools, when compared with IL-4-polarized macrophages.
Figure 2.

Macrophage Efflux of TCA Cycle Intermediates into Itaconate, GABA, and 2-Hydroxyglutarate
(A–D) (A) A reference isotopologue enrichment scheme depicting labeling of TCA cycle and TCA-cycle-derived intermediates by [U-13C6]glucose (Glc), through the first TCA cycle turn, via citrate synthase (CS, possibility a [black dots]), pyruvate carboxylase (PC, possibility b [orange dots]), or both together (possibility c). Subsequent rows in this scheme illustrate isotopologues obtained from second and third TCA cycle turns only from the citrate synthase incorporation (i.e., derived from CS, possibility a). Gray dots represent 12C. Light orange and green arrow paths depict efflux of the TCA cycle primarily in LPS- and IL-4-polarized macrophages, respectively. 10 mM [U-13C6]glucose labeling of (B) itaconate, (C) gamma-aminobutyric acid (GABA), and (D) 2-hydroxyglutaric acid in unpolarized (control), LPS-polarized (25 ng/mL), or IL-4-polarized (25 ng/mL) WT BMDMs after 24 hr of exposure (n > 5/group). Data expressed as the mean ± standard error of the mean (SEM). PDH, pyruvate dehydrogenase; CAD, cis-aconitate decarboxylase. Significant differences determined by multiple Student's t test with Holm-Sidak correction when compared with control. *p < 0.05, **p < 0.01, ***p < 0.001, *****p < 0.00001, as indicated.
UDP-GlcNAc and itaconate are key metabolites of interest in macrophage biology. Tandem MS (MS/MS) confirmed their putative assignments (Figures S4E and S4F), with the caveat that the methods we used do not distinguish between UDP-galactose and UDP-glucose (Figure S4G; also see Transparent Methods). However, the addition of extracellular GlcNAc to the culture medium significantly increased the molar abundance linked to the m/z of the UDP-GlcNAc signal, indicating that a significant portion of this pool corresponds to UDP-GlcNAc (Figures S2 and 3A). Further support that these signals correspond to UDP-GlcNAc come from corresponding isotopologue labeling of a known product downstream of UDP-GlcNAc, N-acetylneuraminic acid (a sialic acid) (Puchalska et al., 2018). The consequences of increased flux through HBP on macrophage function may be manifested in part through downstream O-GlcNAcylation of target proteins. LPS-polarized macrophages exhibit a 4-fold increase in total protein O-GlcNAcylation on western blot (Figure 3B); a 3-fold induction of Gfpt1 mRNA, which encodes the glutamine:fructose-6-phosphate-aminotransferase enzyme (GFAT) that catalyzes the fate-committing HBP reaction (Figures S2 and 3C); and a ∼60% increase in the molar abundance of the total UDP-GlcNAc pool 24 hr after stimulation (Figure 3D). Intriguingly, whereas the molar abundance of the total UDP-GlcNAc pool in IL-4-polarized macrophages was comparable to that in LPS-polarized macrophages, unlike in LPS-polarized macrophages, Gfpt1 and total protein O-GlcNAcylation were not increased over baseline in IL-4-polarized macrophages (Figures 3B–3D). These results strongly suggest that the HBP is leveraged for distinct purposes in LPS-polarized versus IL-4-polarized macrophages, and indeed IL-4-polarized macrophages may allocate HBP products toward glycosaminoglycan (GAG) metabolism (Puchalska et al., 2018). Thus both destinations of metabolic pathway output and the signature biochemical routes taken to support metabolite production are tightly coupled. The latter requires fully unsupervised and high-resolution isotopologue analysis to reveal, heretofore not performed in polarized macrophages.
Figure 3.

UDP-GlcNAc and Itaconate Biosynthesis Are Increased Primarily in Inflammatory Macrophages
(A) Ion counts of intracellular UDP-GlcNAc from extracts of 1.5 × 10⁶ unpolarized macrophages treated with indicated concentrations of GlcNAc (0–20 mM) (n = 4/group).
(B) Immunoblot for O-GlcNAcylation (normalized to actin) in unpolarized (control), LPS-polarized (25 ng/mL) or IL-4-polarized (25 ng/mL) WT BMDMs after 6, 24, and 48 hr of exposure. WB, western blot.
(C and E) Transcript abundances of (C) Gfpt1 and (E) Irg1 genes, which encode the enzymes that catalyze the fate-committing HBP and itaconate biosynthesis reactions in unpolarized or LPS- or IL-4-polarized WT BMDMs after 24 hr of exposure (n = 4/group for Gfpt1; n = 3/group for Irg1). Gfpt1 encodes the glutamine:fructose-6-phosphate-aminotransferase enzyme, whereas Irg1 encodes cis-aconitate decarboxylase.
(D and F) Total pools of (D) UDP-GlcNAc (including UDP-GalNAc) and (F) itaconate normalized to the total amount of proteins (mg) in unpolarized or LPS- or IL-4-polarized WT BMDMs after 24 hr of exposure (n = 4/group).
Data expressed as the mean ± standard error of the mean (SEM). Significant differences determined by one-way ANOVA. **p < 0.01, ***p < 0.001, ****p < 0.0001, as indicated.
Although the total labeled pool of citrate was similar in all macrophage stimulation states (Figure S4A), analysis of itaconate, glutamate, and malate isotopologues (Figures 2B, S4C, and S4D) in macrophages revealed diversion of the citrate pool to itaconate, selectively in the LPS-polarized state. Accordingly, and in agreement with previous reports, Irg1 mRNA abundance and molar abundance of the total itaconate pool increased ∼200- and ∼500-fold, respectively, in LPS-polarized macrophages compared with control or IL-4-polarized cells (Figures 3E and 3F). The detection of itaconate synthesis in unpolarized and IL-4-polarized macrophages underscores the sensitivity of an ITUM approach and confirms metabolic plasticity in differentially polarized macrophages.
Multiple Carbon Sources Support the Hexosamine Biosynthetic Pathway and Itaconate Biosynthesis
Much of the work to date on macrophage metabolism has focused on common substrates such as glucose and fatty acids. Ketone bodies represent a significant alternative energy source for cells in both glucose-deficient and glucose-replete states (Puchalska and Crawford, 2017). To determine whether itaconate synthesis and the HBP participate in the metabolic network accessed by ketone bodies, and whether this participation was polarization state specific, we treated control and polarized BMDMs with 1 mM [U-13C4]acetoacetate (AcAc) in the presence of 10 mM unlabeled glucose. AcAc is a ketone body that is terminally oxidized in the TCA cycle after activation by the mitochondrial enzyme succinyl-CoA:oxoacid transferase (SCOT, encoded by gene Oxct1), which is absolutely required for the mitochondrial conversion of AcAc to acetyl-CoA. SCOT is expressed in all non-hepatocytes, including macrophages (Puchalska and Crawford, 2017). [13C]AcAc robustly labeled intracellular itaconate (M+1 isotopologue) in LPS-polarized macrophages (Figures 4A and 4B) similarly to [13C]glucose (Figure 2B). Labeling of UDP-GlcNAc from [13C]AcAc can be deduced from the molecular structure of UDP-GlcNAc and its biosynthetic pathway (Figure 1E, gray dots; Figure S2). For incorporation into the HBP, mitochondrial [13C]acetyl-CoA is exported to the cytosol as [13C]citrate, where it is converted back to [13C]acetyl-CoA by ACLY, and subsequently condensed with glucosamine-6-phosphate (generated via the catalytic action of GFAT) to ultimately produce the M+2 UDP-GlcNAc isotopologue (Figures 1E, S2, and 4C). In all three conditions, [13C]AcAc predominantly labeled the M+2 isotopologue of UDP-GlcNAc after 6 hr, and more robustly after 24 hr (Figures 4C and 4D). [13C]-labeling of mitochondrial itaconate biosynthesis by [13C]AcAc was completely abolished in both LPS- and IL-4-polarized SCOT knockout (KO) BMDMs (Figure 4E), underscoring the obligate role of mitochondrial metabolism in itaconate synthesis (SCOT KO macrophages exhibited normal signatures of LPS and IL-4 polarizations and metabolize glucose normally (Puchalska et al., 2018)). However, SCOT KO macrophages treated with [13C]AcAc still supported the M+2 isotopologue of UDP-GlcNAc (Figure 4F), suggesting the contribution of cytosolic AcAc-derived acetyl-CoA to UDP-GlcNAc synthesis. Indeed, AcAc can also directly generate a cytosolic pool of acetyl-CoA through an ATP-dependent reaction catalyzed by acetoacetyl-CoA synthetase (AACS), an enzyme whose gene is significantly more induced in SCOT KO BMDMs than in wild-type (WT) BMDMs (Figures 5A and S5A) (Puchalska et al., 2018). Intriguingly, Gfpt1 and Irg1 gene expression and molar abundances of both UDP-GlcNAc and itaconate pools were not affected by loss of SCOT or by the presence of AcAc, which indicates functional redundancy of the metabolic network in polarized macrophages (Figures S5B–S5E). Nonetheless, the loss of mitochondrial AcAc oxidation has phenotypic consequences, likely through alteration of GAG metabolism, in a model of tissue macrophage activity in response to high-fat diet stress (Puchalska et al., 2018).
Figure 4.

The Ketone Body AcAc Labels the Hexosamine Biosynthetic Pathway and Itaconate Biosynthesis
(A–F) Labeling of itaconate (A, B, and E) and UDP-GlcNAc (C, D, and F) with 1 mM [U-13C4]acetoacetate (AcAc) in unpolarized (control), LPS-polarized (25 ng/mL), or IL-4-polarized (25 ng/mL) WT (A–D) and SCOT KO (E and F) BMDMs after 6 hr (A, C, E, and F) or 24 hr (B and D) of exposure (n > 6/group for itaconate; n > 4/group for UDP-GlcNAc; n > 3/group for SCOT KO). Data expressed as the mean ± standard error of the mean (SEM). Significant differences determined by multiple Student's t test with Holm-Sidak correction when compared with control. *p < 0.05, **p < 0.01, ***p < 0.001, ****p < 0.0001, *****p < 0.00001, as indicated.
Figure 5.

Coordination of Metabolic Pathways across Cellular Compartments Depends on Substrate and Macrophage Polarization State
(A–G) (A) Labeling map depicting integration of mitochondrial ketone body AcAc metabolism with UDP-GlcNAc and itaconate biosynthesis. Competition between 10 mM [U-13C6]glucose-derived labeling with unlabeled 1 mM AcAc or 0.5 mM octanoate (Oct) among (B and C) individual UDP-GlcNAc or itaconate isotopologues (n > 6/group) or (D and E) total labeled pools of representative TCA cycle intermediates (a subset of data shown in E also were utilized in Puchalska et al. (2018)) (n > 6/group) in (B and D) LPS-polarized (25 ng/mL) or (C and E) IL-4-polarized (25 ng/mL) wild-type (WT) bone-marrow-derived macrophages (BMDMs) after 24 hr of exposure. Competition between 10 mM [U-13C6]glucose-derived labeling and 1 mM unlabeled AcAc of (F) itaconate or (G) UDP-GlcNAc in (F) LPS- or (G) IL-4-polarized WT or SCOT KO BMDMs after 24 hr of exposure (n = 4/group; a portion of the BMDM WT data utilized from Figures 5B and 5C). ACLY, ATP citrate lyase; PDH, pyruvate dehydrogenase; ACO, aconitate hydratase; CAD, cis-aconitate decarboxylase; AACS, acetoacetyl-CoA synthetase; SCOT, succinyl-CoA:oxoacid A transferase. Data expressed as the mean ± standard error of the mean (SEM). Significant differences determined by multiple Student's t test with Holm-Sidak correction when compared with control. *p < 0.05, **p < 0.01, ***p < 0.001, ****p < 0.0001, *****p < 0.00001, as indicated.
Coordination of Metabolic Pathways across Cellular Compartments Varies by Both Substrate and Macrophage Polarization State
Because tissue macrophages are simultaneously exposed to multiple carbon sources, we assessed which substrates are preferentially directed toward the HBP and itaconate synthesis. The contribution of 10 mM [U-13C6]glucose to these pathways was quantified in the presence or absence of unlabeled 1 mM AcAc or unlabeled 0.5 mM octanoate, a fatty acid that enters mitochondria for oxidation independently of carnitine palmitoyltransferase (McGarry and Foster, 1980). Because mitochondrial acetyl-CoA decreases glucose-derived pyruvate entry into the TCA cycle by inhibiting PDH (Cooper et al., 1975), we expected to observe less incorporation of [13C]glucose-derived acetyl-CoA if AcAc or octanoate compete for the mitochondrial acetyl-CoA pool (Figure 5A). Indeed, total [13C]glucose labeling of TCA intermediates, UDP-GlcNAc, and itaconate in both LPS- and IL-4-polarized macrophages was significantly diminished by unlabeled AcAc or octanoate (Figure 5B–E and Table S3). Decreased [13C]glucose-derived labeling of selected metabolites by unlabeled AcAc was similar in both polarization states, with the exception of the M+1 isotopologue of itaconate in IL-4-polarized macrophages (Figure 5B, 5C). However, competition by unlabeled AcAc of the higher-order M+4 isotopologue of itaconate (generated through a combination of anaplerosis from 13C-glucose-derived pyruvate and further turns of the TCA cycle) was evident in IL-4-polarized macrophages (Figure 5C). In IL-4, but in not LPS-polarized macrophages, unlabeled octanoate decreased 13C-labeling of TCA cycle intermediates to a greater extent than unlabeled AcAc (on average ∼30% greater reduction of incorporation of the 13C-label) (Figures 5D and 5E), which is consistent with the prime utilization of fatty acids by IL-4-polarized macrophages. Taken together, these observations suggest differential pathway engagement and exchange of metabolites between mitochondrial and cytosolic compartments in macrophages exposed to different substrates and polarization stimuli. These results also reveal effective competition and more avid oxidation of AcAc or octanoate over glucose and highlight the differences in various fuel selection.
SCOT KO macrophages revealed that mitochondrial conversion of AcAc to acetyl-CoA was necessary to contribute to itaconate synthesis, but not the HBP (Figures 4A, 4C, 4E, and 4F). To quantify the extent to which SCOT influences AcAc-derived acetyl-CoA competition with 13C-labeling from [13C]glucose, we examined the isotopologue distribution of UDP-GlcNAc and itaconate in the presence or absence of unlabeled 1 mM AcAc in SCOT WT or SCOT KO BMDMs polarized with LPS or IL-4. Deviation in the symmetry of the labeling represents the influence of mitochondrial SCOT metabolism on [13C]glucose labeling of these metabolites (Figures 5F, 5G, S5F, and S5G; and Table S3). In both polarization states, [13C]glucose-derived labeling of itaconate was identical between WT and SCOT KO BMDMs, but competition between [13C]glucose and unlabeled AcAc for contribution to itaconate was completely abolished in SCOT KO macrophages (Figures 5F and S5F). In IL-4-polarized macrophages, even in the absence of unlabeled AcAc, 13C-labeling from [13C]glucose of UDP-GlcNAc exhibited subtle but statistically significant differences between WT and SCOT KO BMDMs (M+6 and M+8, p ≤ 0.001), suggesting that the loss of SCOT may affect glucose utilization in the HBP (Figure 5G). The contribution of unlabeled AcAc to UDP-GlcNAc was statistically significant, but only partially diminished in the absence of SCOT, yielding significant changes in the M+8 and M+13 isotopologues (Figures 5G and S5G). Intriguingly, total molar pool sizes of both UDP-GlcNAc and itaconate remained normal in SCOT KO BMDMs (Figures S5D and S5E). This observation suggests pathway-specific compensation from competing substrates and metabolic pathways, e.g., through AACS-mediated cytoplasmic activation of AcAc, supporting acetyl-CoA formation for UDP-GlcNAc, but not for itaconate. On the other hand, glucose-derived acetyl-CoA, all of which is generated in mitochondria via pyruvate decarboxylation, contributes to both UDP-GlcNAc and itaconate.
Itaconate Is Transported into IL-4-Polarized Macrophages Where It Alters Glucose Metabolism
Although our data confirmed that itaconate is primarily an LPS-polarized metabolite, it also suggests small but significant efflux from the TCA cycle toward itaconate biosynthesis in unpolarized and IL-4-polarized macrophages. Itaconate is secreted by LPS-polarized macrophages to inhibit microbial isocitrate lyase, and its potential effects on neighboring brown adipose cells has been recently suggested (Shen et al., 2017, Strelko et al., 2011). Since macrophages exert certain level of plasticity, where LPS-polarized macrophages can mature into IL-4-polarized macrophages upon changes in the microenvironment conditions (Italiani et al., 2014), we tested the impact of [13C]glucose utilization in unpolarized, LPS-polarized, and IL-4-polarized macrophages cultured in the presence of 0.25 mM itaconate in the culture medium. Itaconate is imported into brown adipocytes (Shen et al., 2017), whereas direct transport of itaconate into macrophages has been controversial. Intracellular extracts derived from extensively washed unpolarized and IL-4-polarized macrophages cultured for 24 hr in the presence of 0.25 mM itaconate each exhibited >30-fold increases in the total ion counts corresponding to itaconate (Figure 6A), indicating robust uptake of the metabolite. In contrast, the total ion count of itaconate in intracellular extracts of LPS-polarized macrophages cultured in the presence of 0.25 mM itaconate increased only by 10%. To determine whether this much smaller increase was a result of decreased import or diminished endogenous itaconate synthesis, we leveraged the isotopologue labeling pattern of endogenously produced itaconate, generated from [13C]glucose, in the presence of unlabeled 0.25 mM exogenous itaconate. Indeed, intracellular extracts from unpolarized and IL-4-polarized macrophages both exhibited nearly 3-fold dilution of the predominantly M+1 itaconate isotopologue produced from [13C]glucose (Figures 6B and S6A), suggesting extensive competition from exogenous itaconate in these conditions. However, intracellular extracts from LPS-polarized macrophages exhibited only 20% dilution of the M+1 itaconate isotopologue, suggesting limited import of exogenous itaconate and limited inhibition of endogenous itaconate synthesis in LPS-polarized macrophages by exogenous itaconate (Figure 6C). Taken together, extracellular itaconate is imported into macrophages down a concentration gradient.
Figure 6.

Itaconate Is Transported into Alternatively Polarized Macrophages Where It Alters Glucose Metabolism
(A–C) (A) Total ion counts of intracellular itaconate (ITA) in unpolarized (control), LPS-polarized (25 ng/mL), or IL-4-polarized (25 ng/mL) WT BMDMs after 24 hr of exposure with or without the addition of 0.25 mM of exogenous itaconate (n = 4/group). 10 mM [U-13C6]glucose-derived labeling of itaconate in the presence or absence of unlabeled 0.25 mM itaconate in (B) IL-4- and (C) LPS-polarized WT BMDMs after 24 hr of exposure (n = 4/group).
(D) Venn diagram depicting changes in the numbers of features labeled by 10 mM [U-13C6]glucose in the presence (versus absence) of 0.25 mM exogenous unlabeled itaconate in unpolarized and LPS- and IL-4-polarized WT BMDMs after 24 hr of exposure (n = 4/group).
(E–G) (E) 10 mM [U-13C6]glucose-derived labeling of citrate in LPS- and IL-4-polarized WT BMDMs in the presence or absence of 0.25 mM exogenous unlabeled itaconate after 24 hr of exposure (n = 4/group). Total ion counts of (F) citrate and (G) succinate in unpolarized or LPS- or IL-4-polarized WT BMDMs after 24 hr of exposure with or without the addition of 0.25 mM exogenous itaconate (n = 4/group).
Data expressed as the mean ± standard error of the mean (SEM). Significant differences determined by Student's t test or multiple Student's t test with Holm-Sidak correction when compared to control. *p < 0.05, **p < 0.01, ***p < 0.001, ****p < 0.0001, *****p < 0.00001, as indicated.
To determine if extracellular itaconate influences the metabolic profile of the importing cells, we analyzed the fates of 10 mM [13C]glucose in the presence or absence of 0.25 mM extracellular itaconate (Figure 6D). Putative identifications for 9, 5, or 17 of the 24, 21, or 60 total isotopologue groups competed by unlabeled itaconate in unpolarized, LPS-polarized, and IL-4-polarized macrophages, respectively, were assigned using PIUMet (Table S4). IL-4-polarized macrophages exhibited the largest number (44, compared with 11 or 12 in unpolarized and LPS-polarized macrophages, respectively) of [13C]glucose-labeled features whose labeling pattern was changed by the presence of exogenous unlabeled itaconate (Figure 6D). Among the affected metabolites were LysoPE species, detected in unpolarized [(16:0); (20:4); (22:4)] and LPS-polarized macrophages, and arachidonic acid/nicotinamide ribonucleotide, citric acid, and UDP-GlcNAc, detected in IL-4-polarized macrophages (Table S4). Total labeling of UDP-GlcNAc increased slightly (18%) in the presence of extracellular itaconate in IL-4-polarized macrophages (Figure S6B), whereas the M+2 citrate isotopologue was increased 18% and the unlabeled isotopologue decreased 24% (Figure 6E). Because (1) labeling of second-span TCA cycle intermediates, including malate, was not affected (Figure S6C); (2) succinate and citrate pool sizes were not altered (Figures 6F and 6G); and (3) 13C-labeling of lactate was not affected (Figure S6D), neither glycolysis nor pyruvate decarboxylation was influenced by extracellular itaconate, although citrate efflux from mitochondria was stimulated. Taken together, these data suggest that extracellular itaconate can be imported into macrophages that do not actively synthesize it, influencing their metabolism. Nonetheless, we did not observe evidence of succinate dehydrogenase inhibition in importing cells, as has been attributed to endogenous itaconate in classically polarized macrophages (Cordes et al., 2016, Lampropoulou et al., 2016).
Discussion
Differentially polarized macrophages reveal distinct metabolic signatures that cohesively integrate their functions (Artyomov et al., 2016, Geeraerts et al., 2017, Kelly and O'Neill, 2015, Martinez and Gordon, 2014). The data presented herein reveal substrate- and polarization-state-dependent mechanisms through which glucose and ketone body metabolisms are interwoven within and between cellular compartments. Applying a multi-substrate 13C-ITUM pipeline enabled (1) unbiased determination of the chemical space penetrated by labeled substrates in an unsupervised mode (also see Puchalska et al. (2018)) and (2) based on inferences conferred by 13C-labeled isotopologues, further insight into variations in relative contributions of convergent metabolic pathways. These observations provide a foundation for determining how macrophages integrate metabolic pathways such as the PPP, pyrimidine metabolism, HBP, the TCA cycle, and lipid metabolism in different polarization states. The biosynthesis of some metabolites, such as itaconate, occurred uniquely in macrophage mitochondria, whereas other metabolites integrated mitochondrial and cytosolic nodes into biosynthetic pathways in a polarization-state-specific manner. Genetic interruption of one orchestrated metabolic pathway in macrophage metabolism led to adaptations in cross talk between mitochondria and cytosol. Substrates competing for contribution to the same metabolic pathway are allocated differentially, and in a polarization-state-specific manner, and macrophages are remarkably resilient by retaining a core metabolome, even when access to a substrate was interrupted. Finally, our results reveal a potentially paracrine metabolic role for the LPS-polarized macrophage metabolite itaconate on neighboring cells that do not synthesize it.
The most commonly applied metabolomics approaches are label-free targeted and untargeted metabolomics technologies that survey for variations in the “snapshot” abundance of total metabolite pools. Although these approaches are powerful, they do not reveal direct insight into metabolic reaction rates, or how metabolic pathways are connected. Fluctuations in static metabolite abundances may remain normal or minimally changed, despite considerable changes in reaction rates and/or pathway orchestration. However, emerging approaches that integrate constraint-based modeling of metabolic flux, e.g., flux balance analysis, and static metabolomics datasets are emerging and will increase data harvest from metabolomics datasets (Bordbar et al., 2017).
The use of stable isotope labels has traditionally been applied to targeted approaches that allow reaction rate calculations either using steady-state or non-stationary kinetic analyses, quantifying metabolic flux measured in mol · min−1· unit biomass−1 (Jazmin and Young, 2013, Zamboni et al., 2015). Stable isotopically labeled “‘fluxomics” approaches attempt to quantify broader substrate-product rate relationships across the metabolome (Weindl et al., 2016). Newer pipelines that integrate stable isotope labels with untargeted metabolomics also allow model-free analysis supporting metabolome-wide, discovery-based, and hypothesis-generating observations, where the penetration of the stable isotope (e.g., 13C) into the metabolome is quantified in an unsupervised manner without the calculation of metabolic flux (Zamboni, 2011). Indeed in metabolic pathways, particularly those outside of the central carbon metabolism, differential penetration of 13C-label into the metabolite pool is independent of changes in flux, while unique insight can be gained from metabolome-wide fractional enrichments of specific isotopologues, revealing (1) specificity of relative contributions from converging pathways, (2) in vivo functional connectivity of metabolic pathways, and (3) compensatory mechanisms triggered under disruptive conditions (Weindl et al., 2015). Stable isotope-assisted untargeted metabolomics approaches commonly reveal markedly divergent chemical features, compared with label-free approaches (Huang et al., 2014). This is a key distinction, because “untargeted” labeling approaches commonly first generate static untargeted metabolomics datasets to uncover metabolites with varying pool sizes across conditions that then drive a secondary targeted analysis of labeling from an isotopically enriched substrate. This pipeline describes a previous approach taken in alternatively polarized macrophages (Jha et al., 2015). Instead the experiments presented here track label in a fully unsupervised manner, metabolome wide, revealing insight into pathways that do not require altered intermediate pool sizes. Furthermore, unique insights conferred by the ITUM pipeline were evident by comparing competition between substrates such as glucose, AcAc, or octanoate contribution to numerous pathways, including the TCA cycle, the HBP, and itaconate biosynthesis. These shifts would not have been visible through label-free targeted or untargeted approaches.
It is likely that the diversity of substrates presented, and the capacity to metabolize them, influences both canonical signaling and metabolic pathways in both classically and alternatively polarized macrophages. Indeed, substrate selection and metabolism may confer greater influence on anabolic pathways and provide a repertoire of covalent modifiers that coordinate downstream signaling processes (Puchalska and Crawford, 2017, Schoors et al., 2015, Wong et al., 2017). For example, untargeted analysis of features labeled by [13C]glucose revealed possible efflux from the TCA cycle from α-ketoglutarate (M+4 isotopologue) to GABA and 2-HG, especially in alternatively polarized macrophages. GABA is produced by the glutamate decarboxylases (GAD65 or GAD67) from glutamate (Jin et al., 2013). Although GABA primarily serves as a central nervous system neurotransmitter, macrophages also express GAD65 (Bhat et al., 2010). The production of 2-HG from the TCA cycle usually occurs from isocitrate via isocitrate dehydrogenase 1 or 2 (producing D-2-HG) mutants or by lactate dehydrogenase A (producing L-2-HG) or malate dehydrogenase during hypoxia (Intlekofer et al., 2017). Both 2-HG enantiomers inhibit a large family of α-ketoglutarate-dependent enzymes that modulate chromatin, hypoxia-inducible factors, extracellular matrix, and DNA repair (Losman and Kaelin, 2013). Although labeling of these putative metabolites requires follow-up, only a fully unsupervised analysis raises attention to these metabolites.
In our studies, despite equimolar abundances of the UDP-GlcNAc pool in LPS and IL-4-polarized macrophages, Gfpt1 gene expression, the magnitude of O-glycosylation, and the magnitude of [13C]glucose labeling of downstream intermediates all supported greater HBP biosynthetic activity in LPS-polarized macrophages, suggesting a lower rate of UDP-GlcNAc turnover in IL-4-polarized macrophages (Baudoin and Issad, 2015, Wang et al., 2016). Our findings in this and a companion study (Puchalska et al., 2018) support a significant role of the HBP in both polarization states, to be distinguished from independent studies, suggesting that this pathway was most relevant in either LPS- or IL-4-polarized macrophages (Fei et al., 2016, Jha et al., 2015). It is also important to note that UDP-galactose and UDP-glucose can be interconverted through the Leloir pathway, and the m/z signal we detected cannot be distinguished by the methods we employed. UDP-GlcNAc alone is an intermediate in the HBP, supporting N- and O-linked glycosylations, whereas both UDP-GalNAc and UDP-GlcNAc are substrates for O-linked glycosylation, and for the synthesis of GAGs, disaccharide polymers of variably sulfated amino sugars (e.g., GlcNAc or GalNAc) conjugated with either a uronic sugar or galactose. GAG metabolism could be central to alternatively polarized macrophage function, where mitochondrial ketone metabolism is essential, and particularly important in the coordination of the fibrotic response (Puchalska et al., 2018). ITUM revealed that GAG metabolism is altered in IL-4-polarized macrophages incompetent to convert AcAc to acetyl-CoA in mitochondria, and thus future studies are needed to interrogate prospective exchange of intermediates between the HBP and the Leloir pathway, and how this might influence GAG anabolism in macrophages.
Itaconate is an endogenous signaling molecule with a myriad of targets (Murphy and O'Neill, 2018). Recent observations indicate roles of itaconate metabolism in vitamin B12 inactivation, activation of NRF2 anti-inflammatory transcription factor, and inhibition of succinate dehydrogenase activity by itaconate secretion in LPS-polarized macrophages (Bambouskova et al., 2018, Cordes et al., 2016, Mills et al., 2016, Mills et al., 2018, Shen et al., 2017). Our observations incorporating exogenous 0.25 mM itaconate in the culture medium of primary BMDMs support the possibility that itaconate may be exchanged among cells, and clearly demonstrate import of itaconate into primary macrophages. Shen et al. demonstrated itaconate (1–2 mM) import into adipocytes; Nair et al. demonstrated an effect of exogenous itaconate on macrophage gene expression without testing whether or not it was imported; and Cordes and colleagues tested a minimum of 5 mM itaconate in RAW 264.7 macrophages (Cordes et al., 2016, Nair et al., 2018, Shen et al., 2017). However, the question of macrophage import of exogenous itaconate has persisted, as investigators have employed “membrane-permeable” itaconate derivatives, including 4-octyl itaconate (Mills et al., 2018) or dimethyl-itaconate (Bambouskova et al., 2018, Lampropoulou et al., 2016). The use of itaconate chemical derivatives to mimic itaconate cellular import, metabolism, and signaling raises concern for (1) off-target effects of the derivative that are independent of itaconate or its natural fates and (2) whether the derivatives actually mimic itaconate. Indeed, dimethyl itaconate may not be metabolized to itaconate (ElAzzouny et al., 2017). Although we observed that exogenous 0.25 mM itaconate was imported into BMDMs, we did not observe succinate accumulation in these recipient cells, or biochemical evidence that supported succinate dehydrogenase inhibition, possibly due to the low concentration of exogenous itaconate utilized in our experiments. Nonetheless, our results raise the possibility that itaconate may be exchanged among macrophages, or LPS-polarized macrophages, and any neighboring cell that does not produce significant itaconate quantities, influencing both substrate metabolism and signaling in the recipient cell, a notion supported by altered fates of [13C]glucose in IL-4-polarized macrophages cultured in the presence of exogenous itaconate.
The role of substrate selection in macrophage polarization remains of unresolved significance. The preference to oxidize octanoate over glucose in IL-4-polarized macrophages confirms higher engagement of fatty acid oxidation in alternatively polarized macrophages (Vats et al., 2006), although macrophages unable to oxidize long-chain fatty acids exhibit no impairment in the execution of the IL-4 macrophage program, and adapt through use of alternative substrates (Divakaruni et al., 2018, Gonzalez-Hurtado et al., 2017, Nomura et al., 2016, Van den Bossche and van der Windt, 2018). The collective findings presented here, and in Puchalska et al. (2018) reveal the ability of macrophages to enlist the ketone body AcAc in the execution of its metabolic functions. Ketone bodies are commonly considered to be of relevance only in carbohydrate-restricted states, although they play metabolic and signaling roles in carbohydrate-replete conditions (Puchalska and Crawford, 2017). It is likely that the loss of mitochondrial conversion of AcAc to acetyl-CoA via SCOT KO has no impact on bioenergetic homeostasis in the IL-4-polarized macrophages, a polarization state in which SCOT is specifically induced at the transcriptional level (Puchalska et al., 2018). Nonetheless, as in cardiac myocytes lacking SCOT, alternatively polarized macrophages lacking SCOT simply switch to other available substrates to support bioenergetic requirements (Schugar et al., 2014). The impact of losing SCOT is instead observed through impaired procession of AcAc metabolites into downstream pathways, as livers of mice whose macrophages lack SCOT exhibit an accelerated fibrogenic phenotype that is linked to impairments in GAG metabolism.
Limitation of Study
ITUM, using high-resolution mass spectrometry, provides a powerful platform for quantifying (1) differential penetration of label into the metabolome of cells or tissues from varying conditions; (2) substrate competition across the metabolome, and its variance among conditions; and (3) via isotopologue analysis, differential configuration of pathway connectivity. ITUM does not reveal biochemical reaction or biomass synthesis rates, and thus differential fractional enrichment may not reflect variation in metabolic flux. In addition, the consequences of imported itaconate on macrophage metabolism and signaling will need comparison to the effects of endogenously produced itaconate, and to those of exogenous itaconate adducts that are commonly administered in an attempt to increase intracellular itaconate concentrations.
Methods
All methods can be found in the accompanying Transparent Methods supplemental file.
Acknowledgments
The authors thank Alisa Nelson for helpful discussions, J. Matthew Gandy and Matthew Longo for assistance with mouse husbandry, Laura Kyro for graphics expertise, and Peter Phelan for guidance on primary macrophage isolation and culture. This work was supported in part by grants from the NIH (DK091538, CA235482, ES028365, and OD024624).
Author Contributions
Conceptualization, P.P., X. Huang, and P.A.C.; Methodology, P.P., X. Huang, S.M., G.J.P., and P.A.C.; Investigation, P.P., X. Huang, S.M.; Resources, P.A.C.; Writing – Original Draft, P.P. and P.A.C.; Writing – Review & Editing, all authors; Visualization, P.P., X. Huang, and P.A.C.; Supervision, X. Han, G.J.P. and P.A.C.; Funding Acquisition, P.A.C.
Declaration of Interests
The authors declare no conflict of interest.
Published: November 30, 2018
Footnotes
Supplemental Information includes Transparent Methods, six figures, and four tables and can be found with this article online at https://doi.org/10.1016/j.isci.2018.10.029.
Supplemental Information
Putative feature identifications, for those that could be assigned through PIUMET, are provided at the side. See Huang et al. (2014) for term definition and Pirhaji et al. (2016) for PIUMET method.
Putative feature identifications, for those that could be assigned through PIUMET, are provided at the side. See Huang et al. (2014) for term definition and Pirhaji et al. (2016) for PIUMET method.
Putative feature identifications, for those that could be assigned through PIUMET, are provided at the side. See Huang et al. (2014) for term definition and Pirhaji et al. (2016) for PIUMET method.
References
- Artyomov M.N., Sergushichev A., Schilling J.D. Integrating immunometabolism and macrophage diversity. Semin. Immunol. 2016;28:417–424. doi: 10.1016/j.smim.2016.10.004. [DOI] [PMC free article] [PubMed] [Google Scholar]
- Bambouskova M., Gorvel L., Lampropoulou V., Sergushichev A., Loginicheva E., Johnson K., Korenfeld D., Mathyer M.E., Kim H., Huang L.H. Electrophilic properties of itaconate and derivatives regulate the IkappaBzeta-ATF3 inflammatory axis. Nature. 2018;556:501–504. doi: 10.1038/s41586-018-0052-z. [DOI] [PMC free article] [PubMed] [Google Scholar]
- Baudoin L., Issad T. O-GlcNAcylation and inflammation: a vast territory to explore. Front. Endocrinol. (Lausanne) 2015;5:235. doi: 10.3389/fendo.2014.00235. [DOI] [PMC free article] [PubMed] [Google Scholar]
- Bhat R., Axtell R., Mitra A., Miranda M., Lock C., Tsien R.W., Steinman L. Inhibitory role for GABA in autoimmune inflammation. Proc. Natl. Acad. Sci. U S A. 2010;107:2580–2585. doi: 10.1073/pnas.0915139107. [DOI] [PMC free article] [PubMed] [Google Scholar]
- Bordbar A., Yurkovich J.T., Paglia G., Rolfsson O., Sigurjonsson O.E., Palsson B.O. Elucidating dynamic metabolic physiology through network integration of quantitative time-course metabolomics. Sci. Rep. 2017;7:46249. doi: 10.1038/srep46249. [DOI] [PMC free article] [PubMed] [Google Scholar]
- Cho K., Mahieu N.G., Johnson S.L., Patti G.J. After the feature presentation: technologies bridging untargeted metabolomics and biology. Curr. Opin. Biotechnol. 2014;28:143–148. doi: 10.1016/j.copbio.2014.04.006. [DOI] [PMC free article] [PubMed] [Google Scholar]
- Cooper R.H., Randle P.J., Denton R.M. Stimulation of phosphorylation and inactivation of pyruvate dehydrogenase by physiological inhibitors of the pyruvate dehydrogenase reaction. Nature. 1975;257:808–809. doi: 10.1038/257808a0. [DOI] [PubMed] [Google Scholar]
- Cordes T., Michelucci A., Hiller K. Itaconic acid: the surprising role of an industrial compound as a mammalian antimicrobial metabolite. Annu. Rev. Nutr. 2015;35:451–473. doi: 10.1146/annurev-nutr-071714-034243. [DOI] [PubMed] [Google Scholar]
- Cordes T., Wallace M., Michelucci A., Divakaruni A.S., Sapcariu S.C., Sousa C., Koseki H., Cabrales P., Murphy A.N., Hiller K., Metallo C.M. immunoresponsive gene 1 and itaconate inhibit succinate dehydrogenase to modulate intracellular succinate levels. J. Biol. Chem. 2016;291:14274–14284. doi: 10.1074/jbc.M115.685792. [DOI] [PMC free article] [PubMed] [Google Scholar]
- Divakaruni A.S., Hsieh W.Y., Minarrieta L., Duong T.N., Kim K.K.O., Desousa B.R., Andreyev A.Y., Bowman C.E., Caradonna K., Dranka B.P. Etomoxir inhibits macrophage polarization by disrupting CoA homeostasis. Cell Metab. 2018;28:490–503.e7. doi: 10.1016/j.cmet.2018.06.001. [DOI] [PMC free article] [PubMed] [Google Scholar]
- ElAzzouny M., Tom C.T.M.B., Evans C.R., Olson L.L., Tanga M.J., Gallagher K.A., Martin B.R., Burant C.F. Dimethyl itaconate is not metabolized into itaconate intracellularly. J. Biol. Chem. 2017;292:4766–4769. doi: 10.1074/jbc.C117.775270. [DOI] [PMC free article] [PubMed] [Google Scholar]
- Fei F., Lee K.M., McCarry B.E., Bowdish D.M. Age-associated metabolic dysregulation in bone marrow-derived macrophages stimulated with lipopolysaccharide. Sci. Rep. 2016;6:22637. doi: 10.1038/srep22637. [DOI] [PMC free article] [PubMed] [Google Scholar]
- Feingold K.R., Shigenaga J.K., Kazemi M.R., McDonald C.M., Patzek S.M., Cross A.S., Moser A., Grunfeld C. Mechanisms of triglyceride accumulation in activated macrophages. J. Leukoc. Biol. 2012;92:829–839. doi: 10.1189/jlb.1111537. [DOI] [PMC free article] [PubMed] [Google Scholar]
- Geeraerts X., Bolli E., Fendt S.M., Van Ginderachter J.A. Macrophage metabolism as therapeutic target for cancer, atherosclerosis, and obesity. Front. Immunol. 2017;8:289. doi: 10.3389/fimmu.2017.00289. [DOI] [PMC free article] [PubMed] [Google Scholar]
- Gonzalez-Hurtado E., Lee J., Choi J., Selen Alpergin E.S., Collins S.L., Horton M.R., Wolfgang M.J. The loss of macrophage fatty acid oxidation does not potentiate systemic metabolic dysfunction. Am. J. Physiol. Endocrinol. Metab. 2017;312:E381–E393. doi: 10.1152/ajpendo.00408.2016. [DOI] [PMC free article] [PubMed] [Google Scholar]
- Guijas C., Montenegro-Burke J.R., Warth B., Spilker M.E., Siuzdak G. Metabolomics activity screening for identifying metabolites that modulate phenotype. Nat. Biotechnol. 2018;36:316–320. doi: 10.1038/nbt.4101. [DOI] [PMC free article] [PubMed] [Google Scholar]
- Huang S.C., Smith A.M., Everts B., Colonna M., Pearce E.L., Schilling J.D., Pearce E.J. Metabolic reprogramming mediated by the mTORC2-irf4 signaling axis is essential for macrophage alternative activation. Immunity. 2016;45:817–830. doi: 10.1016/j.immuni.2016.09.016. [DOI] [PMC free article] [PubMed] [Google Scholar]
- Huang X., Chen Y.J., Cho K., Nikolskiy I., Crawford P.A., Patti G.J. X13CMS: global tracking of isotopic labels in untargeted metabolomics. Anal. Chem. 2014;86:1632–1639. doi: 10.1021/ac403384n. [DOI] [PMC free article] [PubMed] [Google Scholar]
- Infantino V., Iacobazzi V., Palmieri F., Menga A. ATP-citrate lyase is essential for macrophage inflammatory response. Biochem. Biophys. Res. Commun. 2013;440:105–111. doi: 10.1016/j.bbrc.2013.09.037. [DOI] [PubMed] [Google Scholar]
- Intlekofer A.M., Wang B., Liu H., Shah H., Carmona-Fontaine C., Rustenburg A.S., Salah S., Gunner M.R., Chodera J.D., Cross J.R., Thompson C.B. L-2-Hydroxyglutarate production arises from noncanonical enzyme function at acidic pH. Nat. Chem. Biol. 2017;13:494–500. doi: 10.1038/nchembio.2307. [DOI] [PMC free article] [PubMed] [Google Scholar]
- Italiani P., Mazza E.M., Lucchesi D., Cifola I., Gemelli C., Grande A., Battaglia C., Bicciato S., Boraschi D. Transcriptomic profiling of the development of the inflammatory response in human monocytes in vitro. PLoS One. 2014;9:e87680. doi: 10.1371/journal.pone.0087680. [DOI] [PMC free article] [PubMed] [Google Scholar]
- Jang C., Chen L., Rabinowitz J.D. Metabolomics and isotope tracing. Cell. 2018;173:822–837. doi: 10.1016/j.cell.2018.03.055. [DOI] [PMC free article] [PubMed] [Google Scholar]
- Jazmin L.J., Young J.D. Isotopically nonstationary 13C metabolic flux analysis. Methods Mol. Biol. 2013;985:367–390. doi: 10.1007/978-1-62703-299-5_18. [DOI] [PubMed] [Google Scholar]
- Jha A., Huang S., Sergushichev A., Lampropoulou V., Ivanova Y., Loginicheva E., Chmielewski K., Stewart K., Ashall J., Everts B. Network integration of parallel metabolic and transcriptional data reveals metabolic modules that regulate macrophage polarization. Immunity. 2015;42:419–430. doi: 10.1016/j.immuni.2015.02.005. [DOI] [PubMed] [Google Scholar]
- Jin Z., Mendu S.K., Birnir B. GABA is an effective immunomodulatory molecule. Amino Acids. 2013;45:87–94. doi: 10.1007/s00726-011-1193-7. [DOI] [PMC free article] [PubMed] [Google Scholar]
- Kelly B., O'Neill L.A. Metabolic reprogramming in macrophages and dendritic cells in innate immunity. Cell Res. 2015;25:771–784. doi: 10.1038/cr.2015.68. [DOI] [PMC free article] [PubMed] [Google Scholar]
- Kim K., Zhang N., Choi K., Randolph G. Homegrown macrophages. Immunity. 2016;45:468–470. doi: 10.1016/j.immuni.2016.09.006. [DOI] [PubMed] [Google Scholar]
- Lampropoulou V., Sergushichev A., Bambouskova M., Nair S., Vincent E., Loginicheva E., Cervantes-Barragan L., Ma X., Huang S., Griss T. Itaconate links inhibition of succinate dehydrogenase with macrophage metabolic remodeling and regulation of inflammation. Cell Metab. 2016;24:158–166. doi: 10.1016/j.cmet.2016.06.004. [DOI] [PMC free article] [PubMed] [Google Scholar]
- Liu P.S., Wang H., Li X., Chao T., Teav T., Christen S., Di Conza G., Cheng W.C., Chou C.H., Vavakova M. Alpha-Ketoglutarate orchestrates macrophage activation through metabolic and epigenetic reprogramming. Nat. Immunol. 2017;18:985–994. doi: 10.1038/ni.3796. [DOI] [PubMed] [Google Scholar]
- Losman J.A., Kaelin W.G., Jr. What a difference a hydroxyl makes: mutant IDH, (R)-2-hydroxyglutarate, and cancer. Genes Dev. 2013;27:836–852. doi: 10.1101/gad.217406.113. [DOI] [PMC free article] [PubMed] [Google Scholar]
- Martinez F.O., Gordon S. The M1 and M2 paradigm of macrophage activation: time for reassessment. F1000Prime Rep. 2014;6:13. doi: 10.12703/P6-13. [DOI] [PMC free article] [PubMed] [Google Scholar]
- McGarry J.D., Foster D.W. Regulation of hepatic fatty acid oxidation and ketone body production. Annu. Rev. Biochem. 1980;49:395–420. doi: 10.1146/annurev.bi.49.070180.002143. [DOI] [PubMed] [Google Scholar]
- Meiser J., Krämer L., Sapcariu S.C., Battello N., Ghelfi J., D'Herouel A.F., Skupin A., Hiller K. Pro-inflammatory macrophages sustain pyruvate oxidation through pyruvate dehydrogenase for the synthesis of itaconate and to enable cytokine expression. J. Biol. Chem. 2016;291:3932–3946. doi: 10.1074/jbc.M115.676817. [DOI] [PMC free article] [PubMed] [Google Scholar]
- Michelucci A., Cordes T., Ghelfi J., Pailot A., Reiling N., Goldmann O., Binz T., Wegner A., Tallam A., Rausell A. Immune-responsive gene 1 protein links metabolism to immunity by catalyzing itaconic acid production. Proc. Natl. Acad. Sci. U S A. 2013;110:7820–7825. doi: 10.1073/pnas.1218599110. [DOI] [PMC free article] [PubMed] [Google Scholar]
- Mills E.L., Kelly B., Logan A., Costa A.S.H., Varma M., Bryant C.E., Tourlomousis P., Dabritz J.H.M., Gottlieb E., Latorre I. Succinate dehydrogenase supports metabolic repurposing of mitochondria to drive inflammatory macrophages. Cell. 2016;167:457–470.e13. doi: 10.1016/j.cell.2016.08.064. [DOI] [PMC free article] [PubMed] [Google Scholar]
- Mills E.L., Ryan D.G., Prag H.A., Dikovskaya D., Menon D., Zaslona Z., Jedrychowski M.P., Costa A.S.H., Higgins M., Hams E. Itaconate is an anti-inflammatory metabolite that activates Nrf2 via alkylation of KEAP1. Nature. 2018;556:113–117. doi: 10.1038/nature25986. [DOI] [PMC free article] [PubMed] [Google Scholar]
- Murphy M.P., O'Neill L.A.J. Krebs cycle reimagined: the emerging roles of succinate and itaconate as signal transducers. Cell. 2018;174:780–784. doi: 10.1016/j.cell.2018.07.030. [DOI] [PubMed] [Google Scholar]
- Nair S., Huynh J.P., Lampropoulou V., Loginicheva E., Esaulova E., Gounder A.P., Boon A.C.M., Schwarzkopf E.A., Bradstreet T.R., Edelson B.T. Irg1 expression in myeloid cells prevents immunopathology during M. tuberculosis infection. J. Exp. Med. 2018;215:1035–1045. doi: 10.1084/jem.20180118. [DOI] [PMC free article] [PubMed] [Google Scholar]
- Nomura M., Liu J., Rovira I.I., Gonzalez-Hurtado E., Lee J., Wolfgang M.J., Finkel T. Fatty acid oxidation in macrophage polarization. Nat. Immunol. 2016;17:216–217. doi: 10.1038/ni.3366. [DOI] [PMC free article] [PubMed] [Google Scholar]
- O'Neill L.A. A broken krebs cycle in macrophages. Immunity. 2015;42:393–394. doi: 10.1016/j.immuni.2015.02.017. [DOI] [PubMed] [Google Scholar]
- Pirhaji L., Milani P., Leidl M., Curran T., Avila-Pacheco J., Clish C.B., White F.M., Saghatelian A., Fraenkel E. Revealing disease-associated pathways by network integration of untargeted metabolomics. Nat. Methods. 2016;13:770–776. doi: 10.1038/nmeth.3940. [DOI] [PMC free article] [PubMed] [Google Scholar]
- Puchalska P., Martin S.E., Huang X., Lengfeld J., Graham M., Daniel B., Nagy L., Han X., Patti G., Crawford P.A. Hepatocyte-macrophage acetoacetate shuttle protects against tissue fibrosis. Cell Metab. 2018 doi: 10.1016/j.cmet.2018.10.015. [DOI] [PMC free article] [PubMed] [Google Scholar]
- Puchalska P., Crawford P.A. Multi-dimensional roles of ketone bodies in fuel metabolism, signaling, and therapeutics. Cell Metab. 2017;25:262–284. doi: 10.1016/j.cmet.2016.12.022. [DOI] [PMC free article] [PubMed] [Google Scholar]
- Schoors S., Bruning U., Missiaen R., Queiroz K.C., Borgers G., Elia I., Zecchin A., Cantelmo A.R., Christen S., Goveia J. Fatty acid carbon is essential for dNTP synthesis in endothelial cells. Nature. 2015;520:192–197. doi: 10.1038/nature14362. [DOI] [PMC free article] [PubMed] [Google Scholar]
- Schugar R.C., Moll A.R., André d’Avignon D., Weinheimer C.J., Kovacs A., Crawford P.A. Cardiomyocyte-specific deficiency of ketone body metabolism promotes accelerated pathological remodeling. Mol. Metab. 2014;3:754–769. doi: 10.1016/j.molmet.2014.07.010. [DOI] [PMC free article] [PubMed] [Google Scholar]
- Shen H., Campanello G.C., Flicker D., Grabarek Z., Hu J., Luo C., Banerjee R., Mootha V.K. The human knockout gene CLYBL connects itaconate to vitamin B12. Cell. 2017;171:771–782.e11. doi: 10.1016/j.cell.2017.09.051. [DOI] [PMC free article] [PubMed] [Google Scholar]
- Strelko C.L., Lu W., Dufort F.J., Seyfried T.N., Chiles T.C., Rabinowitz J.D., Roberts M.F. Itaconic acid is a mammalian metabolite induced during macrophage activation. J. Am. Chem. Soc. 2011;133:16386–16389. doi: 10.1021/ja2070889. [DOI] [PMC free article] [PubMed] [Google Scholar]
- Tannahill G.M., Curtis A.M., Adamik J., Palsson-McDermott E.M., McGettrick A.F., Goel G., Frezza C., Bernard N.J., Kelly B., Foley N.H. Succinate is an inflammatory signal that induces IL-1beta through HIF-1alpha. Nature. 2013;496:238–242. doi: 10.1038/nature11986. [DOI] [PMC free article] [PubMed] [Google Scholar]
- Tur J., Vico T., Lloberas J., Zorzano A., Celada A. Chapter One - Macrophages and mitochondria: a critical interplay between metabolism, signaling, and the functional activity. Adv. Immunol. 2017;133:1–36. doi: 10.1016/bs.ai.2016.12.001. [DOI] [PubMed] [Google Scholar]
- Van den Bossche J., van der Windt G.J.W. Fatty acid oxidation in macrophages and T cells: time for reassessment? Cell Metab. 2018;28:538–540. doi: 10.1016/j.cmet.2018.09.018. [DOI] [PubMed] [Google Scholar]
- Vats D., Mukundan L., Odegaard J.I., Zhang L., Smith K.L., Morel C.R., Greaves D.R., Murray P.J., Chawla A. Oxidative metabolism and PGC-1β attenuate macrophage-mediated inflammation. Cell Metab. 2006;4:13–24. doi: 10.1016/j.cmet.2006.05.011. [DOI] [PMC free article] [PubMed] [Google Scholar]
- Wang F., Zhang S., Vuckovic I., Jeon R., Lerman A., Folmes C.D., Dzeja P.P., Herrmann J. Glycolytic stimulation is not a requirement for M2 macrophage differentiation. Cell Metab. 2018;28:463–475.e4. doi: 10.1016/j.cmet.2018.08.012. [DOI] [PMC free article] [PubMed] [Google Scholar]
- Wang X., Yuan Z.F., Fan J., Karch K.R., Ball L.E., Denu J.M., Garcia B.A. A novel quantitative mass spectrometry platform for determining protein O-GlcNAcylation dynamics. Mol. Cell. Proteomics. 2016;15:2462–2475. doi: 10.1074/mcp.O115.049627. [DOI] [PMC free article] [PubMed] [Google Scholar]
- Weindl D., Cordes T., Battello N., Sapcariu S.C., Dong X., Wegner A., Hiller K. Bridging the gap between non-targeted stable isotope labeling and metabolic flux analysis. Cancer Metab. 2016;4:10. doi: 10.1186/s40170-016-0150-z. [DOI] [PMC free article] [PubMed] [Google Scholar]
- Weindl D., Wegner A., Hiller K. Metabolome-wide analysis of stable isotope labeling-is it worth the effort? Front. Physiol. 2015;6:344. doi: 10.3389/fphys.2015.00344. [DOI] [PMC free article] [PubMed] [Google Scholar]
- Wong B.W., Wang X., Zecchin A., Thienpont B., Cornelissen I., Kalucka J., Garcia-Caballero M., Missiaen R., Huang H., Bruning U. The role of fatty acid beta-oxidation in lymphangiogenesis. Nature. 2017;542:49–54. doi: 10.1038/nature21028. [DOI] [PubMed] [Google Scholar]
- Zamboni N., Saghatelian A., Patti G.J. Defining the metabolome: size, flux, and regulation. Mol. Cell. 2015;58:699–706. doi: 10.1016/j.molcel.2015.04.021. [DOI] [PMC free article] [PubMed] [Google Scholar]
- Zamboni N. 13C metabolic flux analysis in complex systems. Curr. Opin. Biotechnol. 2011;22:103–108. doi: 10.1016/j.copbio.2010.08.009. [DOI] [PubMed] [Google Scholar]
Associated Data
This section collects any data citations, data availability statements, or supplementary materials included in this article.
Supplementary Materials
Putative feature identifications, for those that could be assigned through PIUMET, are provided at the side. See Huang et al. (2014) for term definition and Pirhaji et al. (2016) for PIUMET method.
Putative feature identifications, for those that could be assigned through PIUMET, are provided at the side. See Huang et al. (2014) for term definition and Pirhaji et al. (2016) for PIUMET method.
Putative feature identifications, for those that could be assigned through PIUMET, are provided at the side. See Huang et al. (2014) for term definition and Pirhaji et al. (2016) for PIUMET method.