

Abstract
Summary
MolArt fills the gap between sequence and structure visualization by providing a light-weight, interactive environment enabling exploration of sequence annotations in the context of available experimental or predicted protein structures. Provided a UniProt ID, MolArt downloads and displays sequence annotations, sequence-structure mapping and relevant structures. The sequence and structure views are interlinked, enabling sequence annotations being color overlaid over the mapped structures, thus providing an enhanced understanding and interpretation of the available molecular data.
Availability and implementation
MolArt is released under the Apache 2 license and is available at https://github.com/davidhoksza/MolArt. The project web page https://davidhoksza.github.io/MolArt/ features examples and applications of the tool.
1 Introduction
The number of available protein structures on one side, and the amount of sequence-related information (sequence annotations) on the other, grow constantly. This is an opportunity for integrated visual analytics approaches, where sequence features can be combined with structure visualization for better understanding of complex molecular data. This is possible due to integration efforts offering easy access to various sources of sequence, structure and annotation information through so called application programming interfaces—APIs (Nightingale et al., 2017). Tools utilizing those APIs can access a wide range of resources to enable advanced interpretation through rich, browser-based display of the combined data. Moreover, recent advances in web technologies enabled easy integration of such tools into users’ own web sites in the form of plugins, or development of derived tools. One of examples is ProtVista (Watkins et al., 2017), UniProt’s component for graphical representation of protein sequence features. Other tools, like LiteMol (Sehnal et al., 2017) or NGL viewer (Rose and Hildebrand, 2015), are employed for structure visualization by PDBe and RCSB PDB. The next intuitive step in the integration efforts is to combine the sequence and structure visualization into a common environment. Such effort has not been made yet, with the exception of the recently introduced web server 3DBIONOTES (Segura et al., 2017), which, however, is a stand-alone solution and not a reusable component.
Here, we introduce MolArt, a new JavaScript tool and library for visualization of sequence-related annotations over available experimental or predicted structures. MolArt is built over the ProtVista plugin for sequence and annotations visualization, and uses the LiteMol plugin for structure display. Both tools provide JavaScript-based interfaces to enable data manipulation and handling various types of events. MolArt delivers an integrated environment with sequence and structure visualization capabilities of both of the tools and uses public APIs providing sequence-structure mapping. It is implemented as a library which can be easily used in a web page or become a part of a third-party tool.
2 Data retrieval and visualization
MolArt is purely a client-side application, thus all data to be visualized, namely sequence annotations, sequence-structure mapping and the corresponding structures, are downloaded on the fly. To do so, MolArt (i) utilizes ProtVista to obtain sequence annotations, either default or user provided, (ii) retrieves the sequence via UniProt website REST API, (iii) obtains the sequence-structure mapping from SIFTS (Velankar et al., 2012) via the PDBe REST API or from Swiss Model Repository (SMR) API (Bienert et al., 2017) and (iv) downloads and displays the structures via LiteMol. As for the sequence-structure mapping, MolArt first checks the existence of available experimental structures for given UniProt ID in PDBe. If no structures are available, SMR is queried for available predicted models. In case no model is available, MolArt falls back to sequence-only view and its functionality is then identical to that of ProtVista, or rather its modified version—see the MolArt’s repository for changes. The obtained sequence-structure mapping comprises not only the list of structures, but also the mapping of amino acid positions, because the structures do not necessarily represent the whole length of the sequence. With the mapping of positions, a structure can be matched to the sequence and visualized as an annotation track in ProtVista; all structure annotation tracks are then assembled into the first annotation group and visible to the user.
The obtained data are visualized using MolArt’s responsive display, which features two resizable panels linking sequence (ProtVista, Fig. 1, left) and structure data (LiteMol, Fig. 1, right). Selecting a structure in the ProtVista’s structure annotation category instructs LiteMol to download and display the corresponding structure in LiteMol. The mapped part of the structure is highlighted by surface visualization with adjustable transparency level. The sequence and structure panels are interlinked, so hovering over the sequence highlights the respective amino acid in the structure and vice-versa. Similarly, the sequence annotations can color the corresponding parts of the active mapped structure simply by clicking on them. Moreover, all annotations in a track or category can be overlaid together enabling, for example, visualization of all post-translation modifications or binding regions. Variation data can be overlaid the same way as standard annotations, but one can also select only mutations of given type (e.g. mutations to given amino acids or loss-of-function mutations) or histogram of variations. This allows to see frequently mutated positions directly on the structure.
Fig. 1.
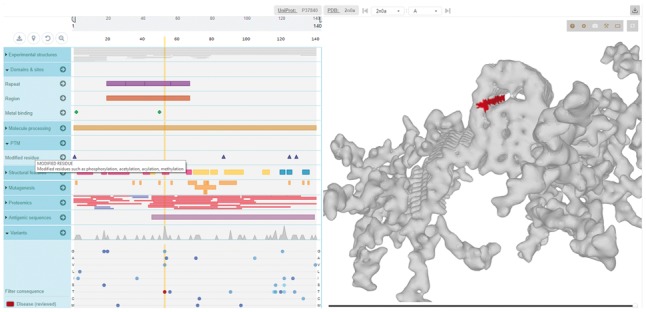
MolArt displays in the left panel the molecule’s sequence, relevant annotations (including variation data) and list of available structures (either experimental or predicted) for given molecule. The right panel shows selected 3D structure over which any of the sequence annotations can be color-overlaid. The above example displays Alpha-synuclein (UniProt ID P37840), a protein which accumulates in the brain cells of Parkinson's disease patients. One of the corresponding structures in PDB (ID 2n0a) shows the fibril structures of the protein. We can overlay the individual disease-related mutations to see that the mutations happen at positions which ensure stability of the structure and their disruption thus lead with high probability to adverse effects
Although the web environment is the appropriate choice for integrating a wide range of data sources and their interactive exploration, more advanced structure analysis might require a specialized environment. If that is the case, MolArt allows to extract all the annotations and their mapping into a single Python file to be later imported by PyMOL.
3 Summary
MolArt fills the gap between sequence and structure visualization by providing an integrated and interactive web experience where sequence annotations can be readily overlaid over the available protein structures. The tool provides a way to explore both sequence and structure features enabling life scientist to benefit from the wealth of molecular data existing in various databases, hopefully leading to a more streamlined biological hypothesis generation.
MolArt’s code including all its dependencies is bundled into a single JavaScript file making it easy to embed into any web site. The project web page shows examples of its usage, including application for querying UniProt or implementation of MolArt in the MINERVA framework (Gawron et al., 2016), notably providing gene-structure mapping for Parkinson’s disease map (Fujita et al., 2014), see pdmap.uni.lu.
MolArt is provided as open source with the source code and documentation available at https://github.com/davidhoksza/MolArt.
Conflict of Interest: none declared.
References
- Bienert S. et al. (2017) The SWISS-MODEL Repository—new features and functionality,Nucleic Acids Res., 45, D313–D319. [DOI] [PMC free article] [PubMed] [Google Scholar]
- Fujita K.A. et al. (2014) Integrating pathways of Parkinson’s disease in a molecular interaction map,Mol. Neurobiol., 49, 88–102. [DOI] [PMC free article] [PubMed] [Google Scholar]
- Gawron P. et al. (2016) MINERVA—a platform for visualization and curation of molecular interaction networks, NPJ Syst. Biol. Appl., 2, 16020. [DOI] [PMC free article] [PubMed] [Google Scholar]
- Nightingale A. et al. (2017) The Proteins API: accessing key integrated protein and genome information, Nucleic Acids Res., 45, W539–W544. [DOI] [PMC free article] [PubMed] [Google Scholar]
- Rose A.S., Hildebrand P.W. (2015) NGL Viewer: a web application for molecular visualization, Nucleic Acids Res., 43, W576–W579. [DOI] [PMC free article] [PubMed] [Google Scholar]
- Segura J. et al. (2017) 3DBIONOTES v2.0: a web server for the automatic annotation of macromolecular structures, Bioinformatics. 33, 3655–3657. [DOI] [PMC free article] [PubMed] [Google Scholar]
- Sehnal D. et al. (2017) LiteMol suite: interactive web-based visualization of large-scale macromolecular structure data. Nat. Methods, 14, 1121–1122. [DOI] [PubMed] [Google Scholar]
- Velankar S. et al. (2012) SIFTS: structure Integration with Function, Taxonomy and Sequences resource, Nucleic Acids Res., 41, D483–D489. [DOI] [PMC free article] [PubMed] [Google Scholar]
- Watkins X. et al. (2017) ProtVista: visualization of protein sequence annotations, Bioinformatics, 33, 2040–2041. [DOI] [PMC free article] [PubMed] [Google Scholar]