Abstract
N-Glycan analysis is routinely performed for biotherapeutic protein characterization. A recently introduced N-glycan analysis kit using RapiFluor-MS (RFMS) labeling provides time savings over reductive amination labeling methods while also providing enhanced fluorescence (FLR) and mass spectrometry (MS) responses. This article demonstrates the semiautomation of this kit using an Andrew Alliance pipetting robot that promises further gains in productivity. This robotic platform uses standard manual pipettors and an optically guided arm to facilitate the automation of manual procedures. The manual RFMS protocol includes two heating and cooling steps during protein denaturation and de-N-glycosylation. However, the current Andrew Alliance automated platform cannot move reaction tubes to and from different heating blocks. As a result, samples prepared using the automated procedure remain in a computer-controlled Peltier effect heating block, requiring reoptimization of denaturation and de-N-glycosylation temperatures. Using hydrophilic interaction liquid chromatography to monitor the RFMS-labeled glycan profiles, the authors demonstrated the reproducibility of the automated protocol with percent relative standard deviations (RSDs) of 9%–19% for the total area and 0.8%–20% for the relative areas of major and minor glycoforms. Overall, the automated platform presented here proves to be a convenient and reliable solution for N-glycan preparation and analysis.
Keywords: automation, semiautomation, N-glycan analysis, UPLC
Introduction
Throughout all stages of biopharmaceutical drug development processes, it is important to monitor product consistency. N-Glycans are routinely monitored as a critical quality attribute (CQA) as they are a measure of manufacturing condition uniformity as well as product efficacy and safety.1–3 Glycosylation is one of the most common posttranslational modifications appearing on an estimated 50% of all proteins as either O-linked or N-linked glycans and is often found on recombinant proteins intended for use as therapeutic agents.4 Glycans are naturally structurally heterogeneous with a variety of lower-level glycoforms demonstrating undesirable consequences for biopharmaceutical products.5 This article focuses on the preparation and analysis of N-linked glycans using a semiautomated pipetting robot.
Recently, the novel RapiFluor-MS (RFMS) labeling reagent ( Fig. 1 ) was introduced and has been previously demonstrated by our laboratory to offer rapidly released N-glycan labeling along with high-sensitivity fluorescence (FLR) and electrospray ionization–mass spectrometry (ESI-MS) detection.1 To prepare N-glycans for labeling, they are first denatured using an acid-labile anionic surfactant and subsequently de-N-glycosylated using peptide-N-glycosidase F (PNGase F).1,6 In order to bypass the lengthy reductive amination process required for traditional N-glycan labels, the RFMS molecule uses a N-hydroxysuccinimide (NHS) carbamate rapid tagging group, which forms a highly stable urea linkage with released N-glycans. This labeling reaction takes place in less than 5 min, a vast improvement over the multiple hours typically required for this process. The final step of the workflow is the purification and enrichment of the RFMS-labeled glycans through hydrophilic interaction liquid chromatography (HILIC) using a microelution, amino-propyl sorbent with slight ion exchange properties. This procedure, when compared with other N-glycan labeling methods, reduces preparation time from multiple hours or days to less than 1 h.7 This workflow offers variable volume (VV) and quality control (QC) options to extend the capabilities of the researcher.8 The VV protocol allows the user to account for a wider range of starting concentrations in their protein samples since a water addition step at the start of the protocol can be modified to account for variations in sample concentrations. The QC protocol is a modification of the VV protocol in that reagent concentrations used during denaturation, de-N-glycosylation, and labeling have been adapted to allow pipetting volumes of 10 µL for improved pipetting accuracy. The streamlined workflow and ease of use presented by this kit were ideal for semiautomation, with the aim to further increase the productivity of researchers by reducing their time spent on sample preparation.
Figure 1.
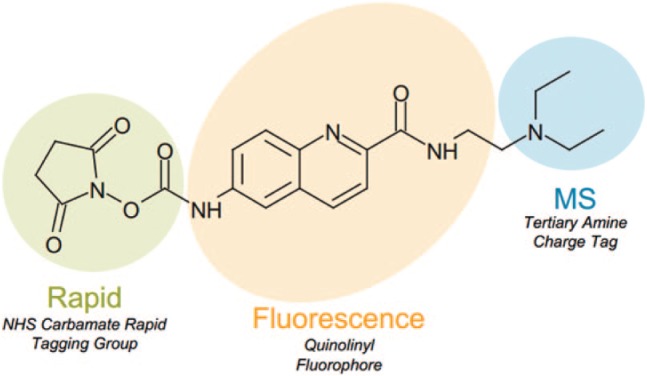
Structure of the RFMS molecule used for rapid N-glycan labeling.
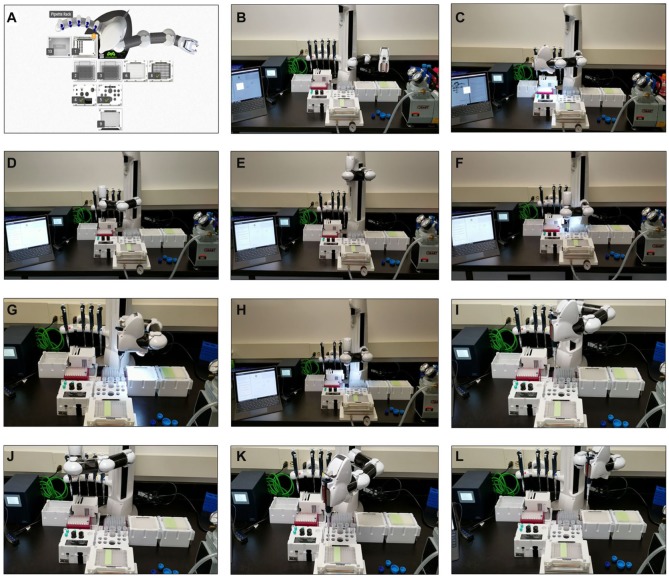
During the process development of biopharmaceutical products, researchers may be required to screen hundreds of samples to find those that fit the required glycan profile. This process can be time-consuming and monotonous, requiring complete user focus to ensure reproducible results time after time. This is one example of an industrial area that could benefit greatly through adaptation of a semiautomated solution.9 The Andrew Alliance pipetting robot (Geneva, Switzerland) offers a benchtop solution for the rapid labeling and cleanup of released N-glycans for between 8 and 24 samples ( Fig. 2 ). Its compact and modular design allows the user to quickly switch between protocols if running different conditions, while relieving them of monotonous pipetting, freeing then to pursue other tasks.10 In this article, the process of transferring the GlycoWorks with RFMS workflow to the Andrew Alliance automation platform is investigated in detail. First, optimization of the protocol for time and temperature requirements is achieved. Then, comparison of the automated solution to the manually performed protocols is performed.
Figure 2.
The Andrew robot as it moves through the protocol. The user is required to set up the workbench area as shown in the Andrew Lab protocol (A). The Andrew robot then moves from its starting position (B) and begins scanning unique codes on each Domino with a camera located under the “hand” (C). Once it has been confirmed that each Domino is in the correct location, the Andrew robot then picks up the appropriate pipette (D), sets the pipette to the correct volume (E), measures the exact location of the bottom of the pipette (F), picks up a pipette tip (G), and measures the exact location of the pipette tip so that it can accurately draw and dispense liquids at a predetermined height (H). The Andrew robot is now ready to begin pipetting, and for each step it draws liquid from a destination (I) and dispenses it into the correct location. For the GlycoWorks automated protocol, the three dispensing locations are the Inheco heating and cooling block, where denaturation, de-N-glycosylation, and labeling occur (J); the µElution plate located in the vacuum manifold, where sample is bound, cleaned, and eluted (K); and the sample collection tubes, which are placed in an empty µPlate Domino following sample elution off of the µElution plate and subsequently diluted (L). There are three user actions during the procedure: following the reactions in J, the user must turn on the vacuum for the steps in K; following cleanup, the user must turn off the vacuum to replace the waste tray with sample collection tubes and then turn the vacuum back on; and following elution in K, the user must turn the vacuum off to remove the sample tubes and place them in the empty Domino in L.
Materials and Methods
Reconstitution of Protein Samples
For QC and VV protocols, all protein samples were reconstituted in water from a Milli-Q Purification System from Millipore (Bedford, MA) and made to final concentrations of 1.5 and 2 mg/mL, respectively. Murine immunoglobulin G1 (IgG1) was made from Intact mAb Mass Check Standard (Waters Corporation, Milford, MA). Ribonuclease B (RNAse B) was purchased from Sigma-Aldrich (St. Louis, MO). Cetuximab (ERBITUX) was purchased commercially.
N-Glycan Labeling
VV protocol sample denaturation, de-N-glycosylation, labeling with RFMS, and purification were performed in accordance with the Waters Corporation “GlycoWorks RapiFluor-MS N-Glycan Kit Care and Use Manual” (p/n 715004793). Modifications for the QC protocol were made in accordance with a procedure previously described.8
GlycoWorks Protocol Automation
All steps of the GlycoWorks with RFMS protocol were automated using the Andrew Lab software from Andrew Alliance being run on a Microsoft Surface Pro 4 laptop (Redmond, WA). The Andrew pipetting robot was equipped with a standard set of Gilson Classic pipettes (Middleton, WI). Reaction steps (denaturation, de-N-glycosylation, and labeling) were performed in an Inheco CPAC Ultraflat HT 2-TEC heating and cooling block controlled by an Inheco Single TEC Control unit (Martinsried, Germany).
GlycoWorks with RFMS protocol steps are detailed in conjunction with images of the robot performing the protocol steps in Figure 2 .
During temperature optimization, the following temperature tests were performed (denaturation temperature [°C]/de-N-glycosylation temperature [°C]): 60/40, 75/40, 90/40, 60/50, 70/50, 75/50, 80/50, 90/50, 60/60, 75/60, and 90/60. For each test, proteins were prepared in duplicate for both the QC and VV protocols.
HILIC-FLR of Labeled N-Glycans
Labeled N-glycans were analyzed via HILIC-FLR with a Waters ACQUITY UPLC H-Class Bio system (Milford, MA). Separations were performed using an ACQUITY UPLC Glycan BEH Amide column (130 Å, 1.7 µm, 2.1 × 150 mm; Waters Corporation). By using a column temperature of 60 °C, over the course of 35 min, a gradient starting at 25% 50 mM ammonium formate in Milli-Q water at pH 4.4 (mobile phase A, 10× mobile phase concentrate was used; Waters Corporation) and 75% pure acetonitrile (ACN) (mobile phase B, liquid chromatography (LC)–MS grade; Fisher Scientific, Hampton, NH) was shifted to 46/54 A/B at a flow rate of 0.4 mL/min. While switching the flow rate to 0.2 mL/min, the gradient shifted to 100/0 A/B for 1.5 min and was held for 3 min as a column wash step. For the next 3.6 min, the flow rate was held at 0.2 mL/min while the gradient returned to the starting mobile phase conditions of 25/75 A/B, after which the flow rate was increased to 0.4 mL/min over a period of 4.5 min. The column was then reequilibrated for 7.4 min under these conditions for a total run time of 55 min. Ten microliters of sample was injected per run using a stainless steel needle. All wash lines (sample manager wash, sample manager purge, and seal wash) used 70/30 ACN/water. Eluting N-glycans were detected via FLR (excitation 265 nm, emission 425 nm) with a 20 Hz sampling rate.
Glycan Identification
Glycan peaks were identified based on retention time comparisons to Waters RFMS-labeled reference standards: RapiFluor-MS Glycan Performance Test Standard (720005349), RapiFluor-MS High Mannose Test Standard (720005531), and RapiFluor-MS Sialylated Glycan Performance Test Standard (720005778). In addition, the glycan profile for cetuximab was visually compared with previously published results.11
Results and Discussion
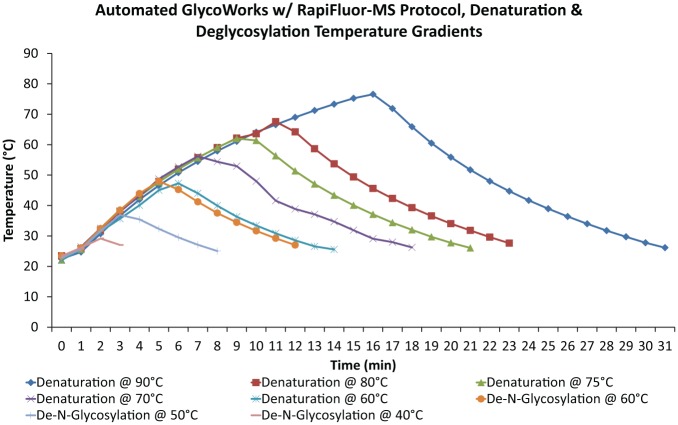
Development of the GlycoWorks RFMS procedures on the Andrew Alliance pipetting robot presented several hurdles. First and foremost, the current robotic platform is incapable of transferring reaction tubes from one location to another. While manually performing the protocol, the user must transfer tubes into and out of heating blocks set at 90 and 50 °C for denaturation and de-N-glycosylation of the protein. In an effort to eliminate the need to have a user intervention during these steps, the automation platform was outfitted with a computer-controlled Peltier effect heating block. Manual denaturation requires 3 min of heating with a 3 min cooldown at room temperature, while manual de-N-glycosylation requires 5 min of heating with another 3 min cooldown. The time required to reach these temperatures on the Peltier effect heating block from room temperature is significantly longer than the required incubation times ( Fig. 3 ).
Figure 3.
Temperature gradients for denaturation and de-N-glycosylation during the automated protocol. Data labels are in the following format: denaturation temperature (°C)/de-N-glycosylation temperature (°C).
The temperatures in Figure 3 were measured using a probe placed directly in a reaction tube containing approximately the same amount of Milli-Q water as would be present during the denaturation and de-N-glycosylation heating steps. It is clear that the temperature programmed for the Peltier effect heating block is not equivalent to that of the sample, as high temperature peaks are significantly lower than the target. It is also important to note the total time difference between heating and cooling to the target temperatures ( Table 1 ). Automated heating to 90 °C takes a full 25 min more than manual heating, exposing samples to elevated temperatures for much longer. As samples are held uncapped in the Peltier Domino, evaporation of sample becomes a concern. The total time for automated de-N-glycosylation is in line with the manual timing. However, the optimal temperature for PNGase F activity is 50 °C and the automated platform falls short of this mark by more than 10 °C during this step ( Fig. 3 ).12 The timing between the de-N-glycosylation and RFMS labeling steps is of particular concern in this procedure. Previous data have shown that the glycosylamine released by PNGase F readily converts to a reducing-end sugar with a half-life of approximately 2 h at 50 °C.13 As a result, an extended delay between the enzymatic release of the glycosylamine and the labeling step will decrease the glycan yield. In order to ensure that the semiautomated procedure produces results comparable to those of the manual version, a systematic reoptimization of the denaturation and de-N-glycosylation steps was performed to determine heating temperatures that would produce optimally labeled N-glycan yields while minimizing sample preparation time.
Table 1.
Heating and Cooling Times of the Two Temperature-Sensitive Steps in the GlycoWorks Protocol (Denaturation and De-N-Glycosylation) during the Manual and Automated Protocols.
| Manual |
Automated |
||||||||
|---|---|---|---|---|---|---|---|---|---|
| Heating Time (min) | Cooling Time (min) | Total Time (min) | Heating Time (min) | Cooling Time (min) | Total Time (min) | Heating Time Difference (Automated – Manual) | Cooling Time Difference (Automated – Manual) | Total Time Difference (min) | |
| Denaturation at 90 °C | 3 | 3 | 6 | 16 | 15 | 31 | 13 | 12 | 25 |
| De-N-glycosylation at 50 °C | 5 | 3 | 8 | 3 | 5 | 8 | −2 | 2 | 0 |
During the manual protocol, the user has two heating blocks preset to the desired temperatures, allowing them to drop the samples in and take them out at the allotted times. The automated protocol, however, requires that the samples stay in a Peltier effect heating block at room temperature throughout the reactions. This block then heats to the desired temperature and cools back down to room temperature.
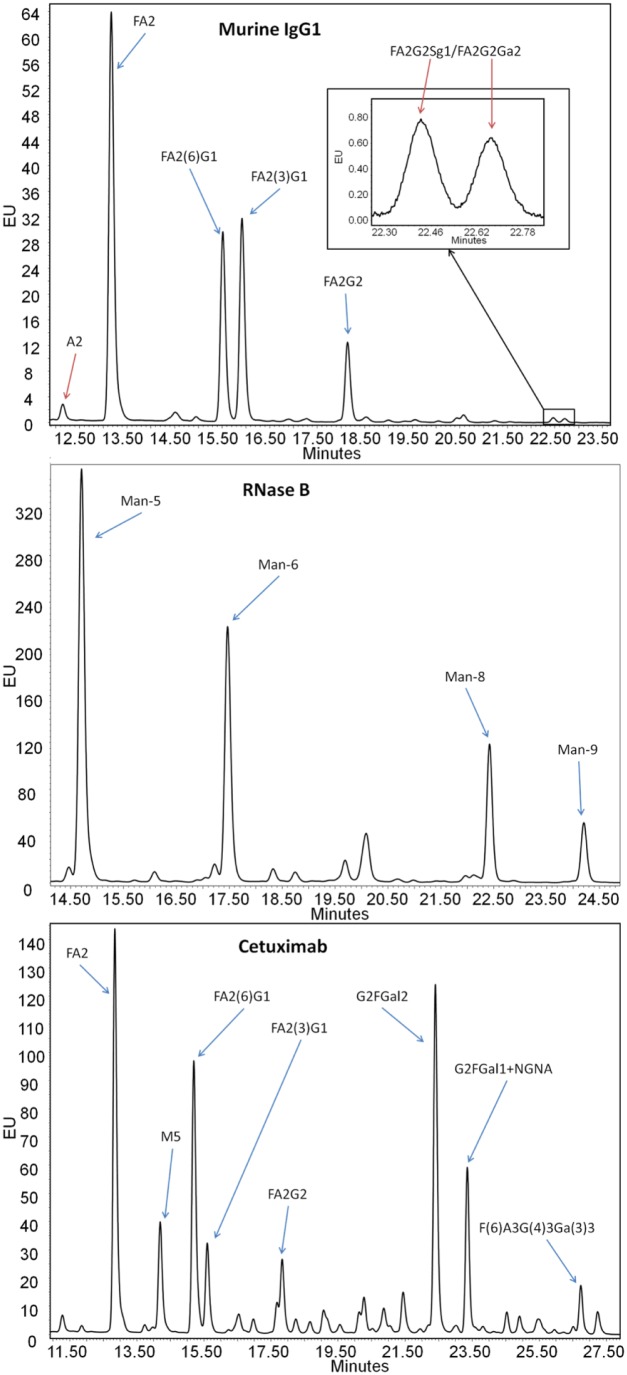
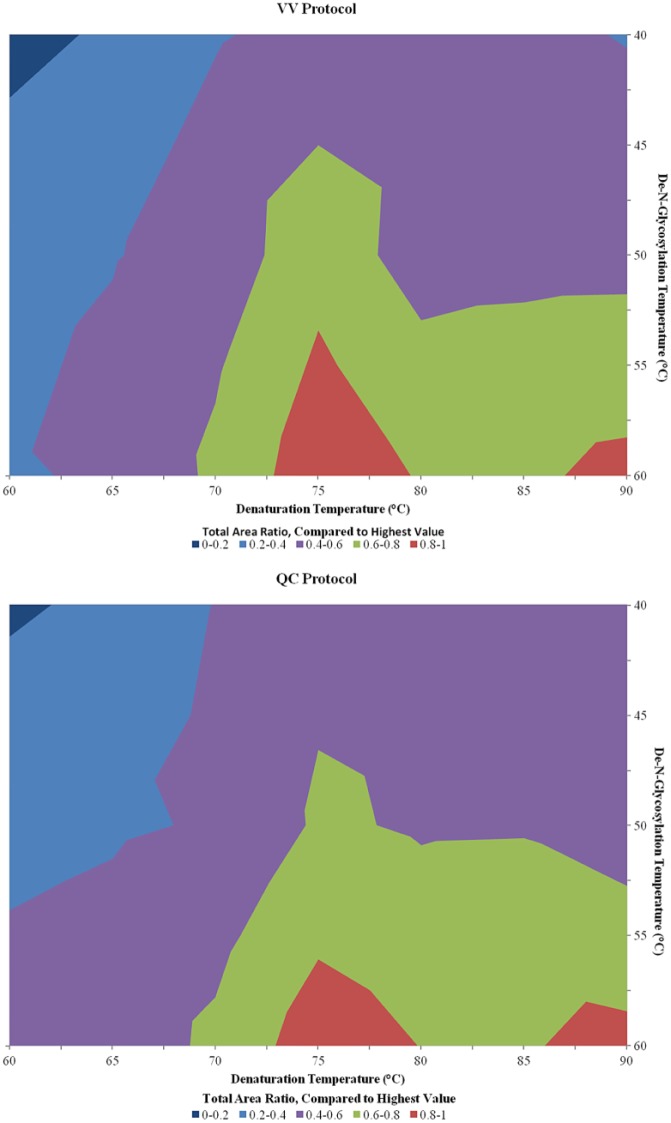
Three proteins were chosen for their N-glycosylation profiles as test samples for the optimization of the two heating steps. A murine IgG1 monoclonal antibody (mAb) with two total N-glycosylation sites in the Fc domain (one per chain) and a glycan profile common to conventional therapeutic mAbs was used. A more complex mAb, cetuximab, which in addition to Fc N-glycosylation also contains N-glycosylation sites in the Fab domain of the protein, for a total of four glycosylation sites per molecule (not common among mAbs), was used. Finally, RNase B was chosen for its single site of high mannose glycosylation. For each protein, several prominent glycoforms were selected from the N-glycan profile for routine monitoring of total and relative areas of their LC-FLR peaks ( Fig. 4 ). Denaturation and de-N-glycosylation temperatures were systematically increased from 60 to 90 °C for denaturation and from 40 to 60 °C for de-N-glycosylation using both the QC and VV RFMS procedures. To determine the optimal denaturation and PNGase F glycan digestion temperature settings, the total areas for all peaks monitored for the murine IgG, RNase B, and cetuximab were summed together and the resulting total area counts for all conditions were assembled into contour maps ( Fig. 5 ).
Figure 4.
Representative HILIC-FLR chromatograms for each of the three proteins used during temperature optimization, with N-glycans used for analysis labeled. The blue arrows designate N-glycan peaks monitored during temperature optimization. The red arrows indicate additional low-abundance peaks used during validation.
Figure 5.
Contour charts showing the summed total area of all monitored N-glycans under differing denaturation and de-N-glycosylation temperatures. The total areas for all N-glycans monitored (Fig. 4) were summed for each temperature test. Sums were converted into a ratio in comparison with the largest observed value. Data from the three proteins used were averaged together for the contour charts. Data points for temperature tests not performed (see list in Materials and Methods) were generated by averaging the surrounding data points. Sixteen total samples were generated simultaneously for each test, eight using the QC method and eight using the VV method (two each for cetuximab, RNase B, and murine IgG1), with three exceptions. Only one sample was generated for cetuximab using the VV method during the 90/40 (denaturation temperature [°C]/de-N-glycosylation temperature [°C]) and 80/50 tests, and only one RNase B sample during the QC method of the 80/50 test, bringing the sample count to seven.
The contour maps in Figure 5 help to elucidate the optimal temperatures needed for each heating step in the automated protocol. Taken together, maps of the VV and QC protocols give comparable optimal ranges at 75 °C for denaturation and 55 °C for de-N-glycosylation. It should be noted that temperatures above 60 °C were not evaluated for de-N-glycosylation due to the manufacturer’s guide for the enzyme.12 However, each protein tested showed slightly different optimal ranges, as can be expected from molecules with complex structures (see Suppl. Figs. S1 and S2). Overall, with the increased time requirement for the denaturation and de-N-glycosylation processes, the total preparation time using the optimized automated protocols ranged from 1 to 3 h, depending on the number of samples. This is an increase over the manually performed protocol by a significant amount. However, a scientist only needs to be present during the three user interactions designed into the protocol ( Fig. 2 ).
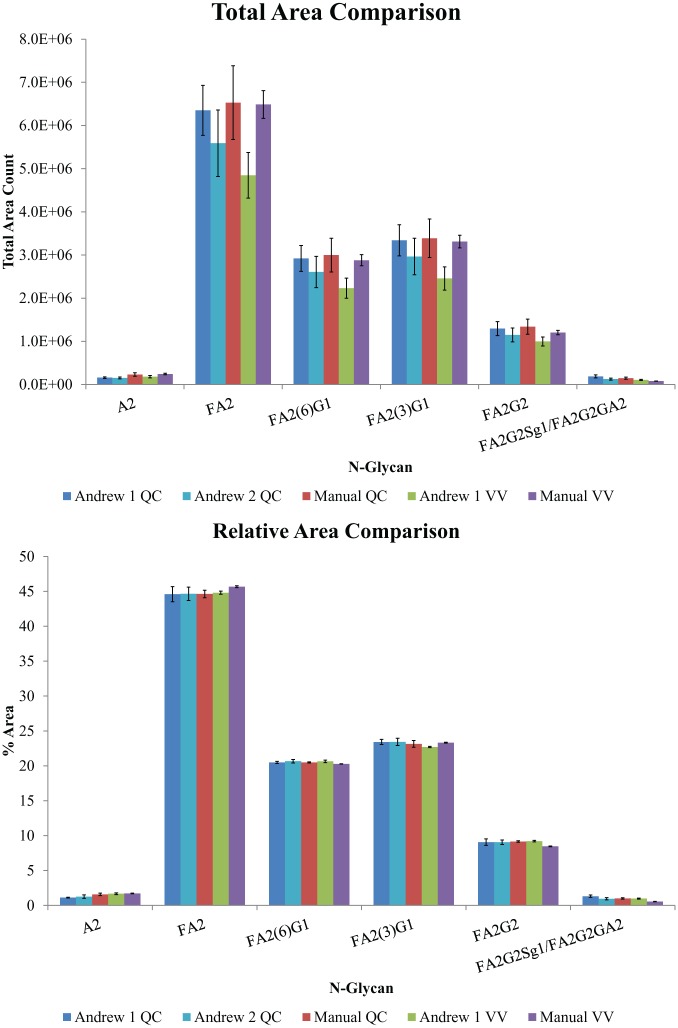
Following protocol optimization, verification of the automated protocol as being fit for purpose was performed. Only murine IgG1 was used for this process, and as such, denaturation and de-N-glycosylation temperatures of 75 and 55 °C were selected as they fall inside of the optimal range for this protein. The overarching objective of this study was to ensure that the automated protocol performs similarly to the same protocol performed manually in terms of N-glycan release and labeling, as well as to check the reproducibility of the protocol. Six N-glycan peaks from the LC-FLR chromatographic profile of murine IgG1 were chosen to monitor the total and relative areas for comparison between samples in the same preparation, and for comparison between preparations ( Fig. 4 ). The total and relative (the percentage each individual peak contributes to the total) areas for all selected peaks were determined along with their relative standard deviations (RSDs). Additionally, N-glycan recovery and percent areas were compared with those of the manual protocol (using the original denaturation and de-N-glycosylation temperatures). This process was repeated for both protocol versions. Finally, the QC protocol was tested on a second Andrew Alliance pipetting robot ( Fig. 6 , Table 2 ).
Figure 6.
Bar charts of validation testing data showing the total area of the six monitored murine IgG1 N-glycans (A) and relative (%) area of the same six monitored murine IgG1 N-glycans (B) for the VV and QC protocols. The N counts for the automated VV, manual VV, automated QC, automated QC with the new Andrew unit, and manual QC are 48, 6, 52, 40, and 23. N-Glycans are in elution order from left to right.
Table 2.
Total and Relative Area Numbers Generated during the Validation Process Using Both Protocol Versions, Including the Average Difference of Each Method from the Manual Method.
| Total and Relative Areas Measured during Validation |
||||||||||
|---|---|---|---|---|---|---|---|---|---|---|
| Total Area (microV*second) |
Relative Area (%) |
|||||||||
| QC |
VV |
QC |
VV |
|||||||
| N-Glycan | Andrew 1 (N = 52) | Andrew 2 (N = 40) | Manual (N = 23) | Andrew 1 (N = 48) | Manual (N = 6) | Andrew 1 (N = 52) | Andrew 2 (N = 40) | Manual (N = 23) | Andrew 1 (N = 48) | Manual (N = 6) |
| A2 | 159,358.77 | 150,642.29 | 231,777.00 | 181,610.26 | 243,364.58 | 1.12 | 1.26 | 1.58 | 1.67 | 1.71 |
| FA2 | 6,349,848.92 | 5,590,096.71 | 6,529,769.00 | 4,846,368.22 | 6,486,709.83 | 44.60 | 44.65 | 44.62 | 44.80 | 45.68 |
| FA2G1a | 2,921,047.82 | 2,607,333.65 | 2,998,212.28 | 2,231,314.23 | 2,878,339.67 | 20.49 | 20.66 | 20.49 | 20.64 | 20.27 |
| FA2G1b | 3,340,285.09 | 2,964,714.69 | 3,387,556.09 | 2,455,016.26 | 3,310,405.25 | 23.42 | 23.43 | 23.15 | 22.70 | 23.31 |
| FA2G2 | 1,293,861.37 | 1,149,093.61 | 1,339,268.13 | 996,007.11 | 1,202,646.08 | 9.06 | 9.06 | 9.15 | 9.21 | 8.47 |
| FA2G2Sg1/FA2G2Ga2 | 188,310.49 | 123,978.16 | 147,138.54 | 105,859.73 | 78,596.92 | 1.32 | 0.95 | 1.01 | 0.98 | 0.55 |
| Average difference from manual | 11.6% | 17.5% | 25.1% | 10.5% | 4.9% | 15.7% | ||||
The total area counts compared in Figure 6A indicate that the overall recoveries of the labeled N-linked glycans were relatively consistent compared with the manual preparations. The largest average difference (25%) was observed between the automated VV and manual VV procedures. This is a direct result of the limitations in pipetting the small volumes (1.2 or 2.4 µL) required for this procedure due to the pipette tip length and reaction vial dimensions of the kit. Figure 6B confirms that the automated VV procedure is not comparable to that of the manual VV, with the two methods producing the largest difference in relative areas as well (15.7%) ( Table 2 ). The total recovery of the automated QC procedure compared well to the QC procedure performed manually, with average differences of 11.6% and 17.5% for the two separate robots evaluated, and is therefore the recommended procedure for this sample preparation. In comparing the QC automated and manual results, the average differences for relative abundance with the two robots were 10.5% and 4.9%, with the largest difference in terms of relative abundance (20.2%) observed for the FA2G2Sg1/FA2G2Ga2 glycan of low (~1%) relative abundance. The most practical performance characteristic for this method is the precision of the relative abundance data, as changes in these values can be indicative of product efficacy and consistency of the manufacturing process. The RSD results for these data sets are given in Table 3 . The RSD values for the QC automated sample sets ranged from a low of 0.8% for the high-abundance N-glycan form FA2(6)G1 (abundance of 20.5%) to a high of 20.2% for the low-abundance A2 (1.3% abundance) form.
Table 3.
Relative Standard Deviations of the Validation Data Displayed in Figure 6 as Bar Graphs.
| Relative Standard Deviation (%) |
||||||||||
|---|---|---|---|---|---|---|---|---|---|---|
| Total Area |
Relative Area |
|||||||||
| QC |
VV |
QC |
VV |
|||||||
| N-Glycan | Andrew 1 (N = 52) | Andrew 2 (N = 40) | Manual (N = 23) | Andrew 1 (N = 48) | Manual (N = 6) | Andrew 1 (N = 52) | Andrew 2 (N = 40) | Manual (N = 23) | Andrew 1 (N = 48) | Manual (N = 6) |
| A2 | 11.57 | 14.19 | 17.41 | 15.84 | 6.55 | 5.49 | 20.20 | 11.41 | 7.09 | 2.15 |
| FA2 | 9.13 | 13.78 | 13.08 | 10.90 | 4.93 | 2.44 | 2.16 | 1.20 | 0.51 | 0.30 |
| FA2G1a | 10.24 | 13.86 | 13.05 | 10.47 | 4.49 | 0.76 | 1.23 | 0.41 | 0.87 | 0.19 |
| FA2G1b | 10.77 | 14.20 | 13.11 | 10.93 | 4.40 | 1.56 | 2.22 | 2.04 | 0.43 | 0.27 |
| FA2G2 | 12.61 | 14.00 | 13.09 | 10.41 | 4.17 | 5.10 | 3.60 | 1.15 | 1.27 | 0.64 |
| FA2G2Sg1/FA2G2Ga2 | 18.16 | 18.57 | 15.90 | 12.33 | 3.68 | 13.17 | 17.28 | 9.70 | 6.88 | 3.20 |
| Average | 12.08 | 14.77 | 14.27 | 11.81 | 4.70 | 4.75 | 7.78 | 4.32 | 2.84 | 1.12 |
Statistical analysis using a 95% confidence interval was performed on the mean overall glycan recovery of the two automated methods compared with the same method performed manually ( Table 4 ). The total recoveries of the six monitored glycans were summed and averaged over all samples for the method type. This analysis confirms that the VV method is not suitable for semiautomation of the RFMS labeling protocol as the overall glycan recovery is not statistically comparable to that of the manual method. The automated QC method as a whole was analyzed against the manual QC method, and the mean overall glycan recovery was found to be statistically comparable to that of the manual method.
Table 4.
Statistical Analysis of the Validation Data with a 95% Confidence Interval Using Both VV and QC Methods.15
|
t-Test Statistical Analysis Using a 95% Confidence Interval | |||
|---|---|---|---|
| QC Method (Pooled N = 117) |
VV Method (Pooled N = 54) |
||
|
t-Value Target |
t-Value Achieved |
t-Value Target |
t-Value Achieved |
| 1.96 | 1.84 | 2.01 | 6.91 |
t values were calculated using total glycan recovery. The total areas for all six monitored glycans were summed for each sample. The total recoveries were then averaged over all samples for the given method (automated QC, manual QC, automated VV, and manual VV).
Conclusion
Overall, semiautomation of the GlycoWorks RFMS procedure using an Andrew Alliance pipetting robot was successful. Reoptimization of the denaturation and de-N-glycosylation temperatures resulted in changing of the target temperatures to 75 and 55 °C. In the performance evaluation of the automated procedure, it was determined that the VV methodology was not appropriate for automation on this platform due to its significantly lower total glycan recoveries. It should be noted that while the total recoveries were significantly lower for the automated VV procedure, the relative abundance glycan data were reasonably accurate and precise due to the robustness of the procedure.13 Although the automated solution increases the overall sample preparation time, it can increase the overall laboratory efficiency and relieve the analyst of repetitive pipetting tasks while also producing relative abundance results comparable to those of the manually performed protocol when using the QC version. Although not demonstrated in this work, the Andrew Alliance platform greatly simplifies the process of normalizing the concentrations of samples to meet the demands of the RFMS procedure.10
Further optimization and improvement of the protocols presented here are ongoing. Efforts have been made to further reduce the need for user interaction during the protocol by automating the vacuum pump control. This requires the user to be present only twice, to move the sample collection tubes into and out of the vacuum manifold for the solid-phase extraction elution step. Other automated systems for the preparation of N-glycans have been proposed.14 However, the automated platform used here, combined with the ease of RFMS labeling, provides a cost-effective benchtop solution for medium- to low-throughput laboratories while providing a robust and reliable method of monitoring N-glycans.
Supplemental Material
Supplemental material, DS_TECH762384 for Automated Preparation of MS-Sensitive Fluorescently Labeled N-Glycans with a Commercial Pipetting Robot by Corey E. Reed, Jennifer Fournier, Nikolaos Vamvoukas and Stephan M. Koza in SLAS Technology
Acknowledgments
The authors wish to thank Giorgio Horak, Scott Roler, and Evan Sorel from Andrew Alliance for providing the Andrew Alliance pipetting robot, developing custom GlycoWorks Dominos for the workbench, supporting protocol development, and providing service to the Andrew unit when needed. The authors would also like to thank Philip Lambert for his insights into automation of the protocol, as well as Erin Chambers and Weibin Chen for supporting this project.
Footnotes
Supplementary material is available online with this article.
Declaration of Conflicting Interests: The authors disclosed the following potential conflicts of interest with respect to the research, authorship, and/or publication of this article: All authors are employees of Waters Corporation or Andrew Alliance. Waters Corporation manufactures the GlycoWorks with RFMS kits and liquid chromatography systems used in the research presented here. Andrew Alliance manufactures the Andrew pipetting robot used in this research. The authors declared no other potential conflicts of interest with respect to the research, authorship, and/or publication of this article.
Funding: The authors received no financial support for the research, authorship, and/or publication of this article.
References
- 1. Lauber M. A., Brousmiche D. W., Hua Z., et al. Rapid Preparation of Released N-Glycans for HILIC Analysis Using a Novel Fluorescence and MS-Active Labeling Reagent. Waters Corporation: Milford, MA, 2015. [DOI] [PubMed] [Google Scholar]
- 2. Fournier J. A Review of Glycan Analysis Requirements. Biopharm Int. 2015, 28, 32–37. [Google Scholar]
- 3. Dahodwala H., Sharfstein S. T. Biosimilars: Imitation Games. ACS Med. Chem. Lett. 2017, 8, 690–693. [DOI] [PMC free article] [PubMed] [Google Scholar]
- 4. Sun X., Tao L., Yi L., et al. N-Glycans Released from Glycoproteins Using a Commercial Kit and Comprehensively Analyzed with a Hypothetical Database. J. Pharm. Anal. 2017, 7, 87–94. [DOI] [PMC free article] [PubMed] [Google Scholar]
- 5. Beck A., Sanglier-Cianférani S., Van Dorsselaer A. Biosimilar, Biobetter, and Next Generation Antibody Characterization by Mass Spectrometry. Anal. Chem. 2012, 84, 4637–4646. [DOI] [PubMed] [Google Scholar]
- 6. Yu Y.-Q., Gilar M., Lee P. J., et al. Enzyme-Friendly, Mass Spectrometry-Compatible Surfactant for In-Solution Enzymatic Digestion of Proteins. Anal. Chem. 2003, 75, 6023–6028. [DOI] [PubMed] [Google Scholar]
- 7. Lauber M. A., Yu Y.-Q., Brousmiche D. W., et al. Rapid Preparation of Released N-Glycans for HILIC Analysis Using a Labeling Reagent That Facilitates Sensitive Fluorescence and ESI-MS Detection. Anal. Chem. 2015, 87, 5401–5409. [DOI] [PubMed] [Google Scholar]
- 8. Koza S. M., McCall S. A., Lauber M. A., et al. Quality Control and Automation Friendly GlycoWorks RapiFluor-MS N-Glycan Sample Preparation. Waters Corporation: Milford, MA, 2016. [Google Scholar]
- 9. Prabhu G. R. D., Urban P. L. The Dawn of Unmanned Analytical Laboratories. Trends Analyt. Chem. 2017, 88, 41–52. [Google Scholar]
- 10. Ngo Q. A. Simple and Automatic Normalization of Sample Concentrations. In Normalization of Sample Concentrations by Andrew Lab and the Pipetting Robot Andrew. Geneva, Switzerland: Andrew Alliance; p 4. [Google Scholar]
- 11. Lauber M. A., Koza S. M. Mapping IgG Subunit Glycoforms Using HILIC and a Wide-Pore Amide Stationary Phase. Waters Corporation: Milford, MA, 2015. [Google Scholar]
- 12. New England Biolabs Inc. Rapid PNGase F. https://www.neb.com/products/p0710-rapid-pngase-f (accessed Sept 13, 2017).
- 13. Lauber M. A., Morris M. F., Brousmiche D. W., et al. Robustness of RapiFluor-MS N-Glycan Sample Preparations and Glycan BEH Amide HILIC Chromatographic Separations. Waters Corporation: Milford, MA, 2015. [Google Scholar]
- 14. Szigeti M., Lew C., Roby K., et al. Fully Automated Sample Preparation for Ultrafast N-Glycosylation Analysis of Antibody Therapeutics. J. Lab. Autom. 2016, 21, 281–286. [DOI] [PubMed] [Google Scholar]
- 15. Anand C. Statistics for Analytical Chemistry Second Edition by JC Miller and JN Miller. pp 227. Prentice Hall, Englewood Cliffs, NJ. 1992 ISBN 0-13-845421-3. Biochem. Mol. Biol. Educ. 1994, 22, 59. [Google Scholar]
Associated Data
This section collects any data citations, data availability statements, or supplementary materials included in this article.
Supplementary Materials
Supplemental material, DS_TECH762384 for Automated Preparation of MS-Sensitive Fluorescently Labeled N-Glycans with a Commercial Pipetting Robot by Corey E. Reed, Jennifer Fournier, Nikolaos Vamvoukas and Stephan M. Koza in SLAS Technology


