

Abstract
Background and purpose:
To predict treatment response and survival of NSCLC patients receiving stereotactic body radiation therapy (SBRT), we develop an unsupervised machine learning method for stratifying patients and extracting meta-features simultaneously based on imaging data.
Material and methods:
This study was performed based on an 18F-FDG-PET dataset of 100 consecutive patients who were treated with SBRT for early stage NSCLC. Each patient’s tumor was characterized by 722 radiomic features. An unsupervised two-way clustering method was used to identify groups of patients and radiomic features simultaneously. The groups of patients were compared in terms of survival and freedom from nodal failure. Meta-features were computed for building survival models to predict survival and free of nodal failure.
Results:
Differences were found between 2 groups of patients when the patients were clustered into 3 groups in terms of both survival (p = 0.003) and freedom from nodal failure (p = 0.038). Average concordance measures for predicting survival and nodal failure were 0.640 ± 0.029 and 0.664 ± 0.063 respectively, better than those obtained by prediction models built upon clinical variables (p < 0.04).
Conclusions:
The evaluation results demonstrate that our method allows us to stratify patients and predict survival and freedom from nodal failure with better performance than current alternative methods.
Keywords: Unsupervised machine learning, Radiomics, Non-small cell lung cancer, Stereotactic body radiation therapy
Recent years have witnessed a phenomenal growth of radiomic studies of lung cancer for the prediction of treatment responses, patient stratification, and prognosis based on radiological imaging data [1–4]. Particularly, radiomic features extracted from CT images have demonstrated promising performance for the prediction of overall survival and disease free survival in patients with non-small cell lung cancer (NSCLC) [5–10]. Promising performance of radiomic features for predicting distant metastasis has been demonstrated in lung adenocarcinoma patients [11] and early stage NSCLC patients [12]. Several studies have demonstrated that radiomic features extracted from CT images are associated with tumor recurrence in NSCLC patients after stereotactic body radiation therapy (SBRT) [13], and they are also capable of predicting the pathological response in patients after neoadjuvant chemoradiation [14]. 18F-FDG PET/CT imaging data have also been adopted to predict clinical endpoints, such as overall/disease-free survival [15], local/distant recurrence [16], and distant metastasis [17]. Radiomic features are associated with epidermal growth factor receptor mutation status in lung adenocarcinomas [18], and the biological basis of radiomic features have also been explored in the view of molecular pathways in lung cancer [19]. Moreover, the combination of radiomic features and genetic biomarkers could boost the prediction performance for predicting tumor recurrence in stage I NSCLC patients [20].
Regardless of the differences in these radiomic lung cancer studies in imaging modality and clinical problems, all of them adopt a radiomics framework consisting of feature extraction, feature selection/dimensionality reduction, and prediction modeling [21–25]. It is common in radiomic studies to extract a large number of imaging features in order to increase discriminative power of radiomic features. Feature selection or dimensionality reduction techniques are typically used to alleviate the difficulties with dimensionality (small sample size and large feature dimensionality) and improve the prediction performance [26–28]. Most feature selection techniques are designed in a supervised setting to identify discriminative features by optimizing performance of prediction models based on validation datasets and are, therefore, prone to overfitting training data in small sample size studies. On the other hand, feature dimensionality reduction techniques, such as principal component analysis (PCA) [29], learn a new feature representation to characterize original features in a lower dimension feature space in an unsupervised setting. However, the low-dimension representation is not necessarily informative for building prediction models, as no relevant guidance is utilized in both the feature extraction and feature dimensionality reduction.
To narrow the gap between the supervised feature selection and unsupervised dimensionality reduction procedures, we introduce an unsupervised two-way clustering analysis method [30] for reducing feature dimensionality and learning meta-features by simultaneously identifying sub-clusters of samples and radiomic features [31]. Particularly, the sub-clusters of the features capture covariations among high dimensional features to generate a low-dimension representation, and the sub-clusters of samples facilitate characterization of samples with different feature patterns and in turn serve as weak supervision that could lead to more informative feature dimensionality reduction for capturing differences of feature patterns between sub-clusters of samples.
Methods and materials
Dataset
This study was performed based on a longitudinal 18F-FDG-PET/CT dataset of 100 consecutive patients who were treated with SBRT for early stage (T1a, T1b, and T2a) NSCLC under approval from the institutional review board. The patients were examined on a PET/CT scanner of Phillips Gemini TF TOF 16 (Phillips Medical Systems, Amsterdam, Netherlands) at the department of Radiology, hospital of University of Pennsylvania. For CT images, slice thickness was 4 mm; matrix size was 512 × 512 with PixelSpacing of 1.1719 × 1.1719 mm2. For PET images, slice thickness was 4 mm; matrix size was 144 × 144 with PixelSpacing of 4 × 4 mm2. The PET data were reconstructed using ordered subset expectation maximization (OSEM) reconstruction and were attenuation-corrected using the CT data.
All patients had a solid component of their NSCLC tumor. Although, all these patients were treated uniformly (12.5 Gy × 4 fractions or 10 Gy × 5 fractions), they had different primary tumor outcomes. More details of the dataset are illustrated in Table 1. We focused on overall survival and freedom from nodal failure as the clinical endpoints in this study, as only a small proportion of the patients had local failure and metastasis.
Table 1.
Characteristics of patients in this study.
| Age (years) | 70.6 ± 11.8 |
| Sex (M/F) | 48%/52% |
| Current or former smoker | 96% |
| Deceased | 39% |
| Nodal failure | 17% |
| Local failure | 7% |
| Metastasis | 9% |
| T stage (T1a/T1b/T2a) | 59%/30%/11% |
| Histology (adenocarcinoma/squamous cell carcinoma/poorly differentiated/no tissue diagnosis) | 22%/29%/9%/40% |
| Mean tumor size ±SD, cm | 1.99 ± 0.87 |
Prediction modeling with unsupervised learning of radiomic features
Our method consists of 3 steps, as illustrated in Fig. 1. Radiomic features are first extracted from the solid component of each patient’s NSCLC tumor, and the features of all patients are formulated as a data matrix X ∊ RN×F, where N is the number of patients and F is the number of radiomic features of each patient. Then, an unsupervised two-way clustering method is applied to the data matrix to simultaneously clustering the patients and the features into sub-clusters, yielding patient stratification labels and the low-dimension feature representations. Finally, clinical outcome analyses of patients at both group and individual subject levels were performed.
Fig. 1.
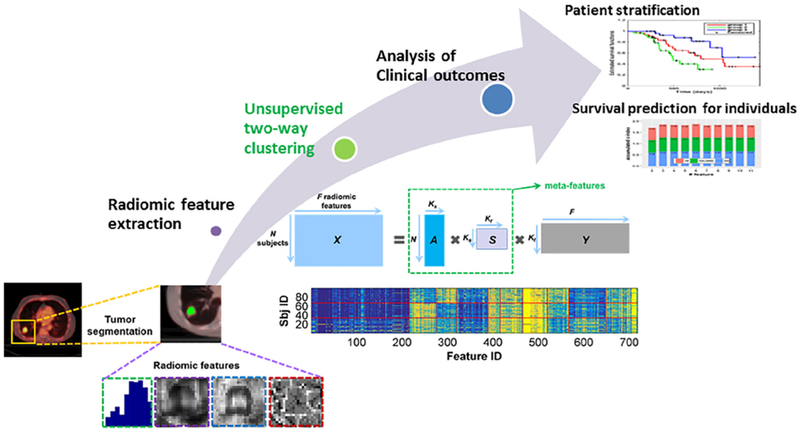
Prediction modeling with unsupervised learning of radiomic features, including radiomic feature extraction, unsupervised two-way clustering for meta-feature extraction, and clinical outcome analyses of patients at both group and individual subject levels.
Radiomic feature extraction
For each patient, the solid component of NSCLC tumor was delineated using CaPTk software [32]. Specifically, candidate tumor regions were detected automatically using a random walk based image segmentation method based on its PET and CT images [33–35], the primary solid component was then identified by one experienced radiologist, and finally the segmentation result was further checked visually and modified manually if necessary.
Radiomic features of the tumor were extracted from the standardized uptake value (SUV) map of the PET scan for each patient [36]. In particular, 11 morphologic features were extracted from the tumor region. Moreover, 79 texture features of the tumor region were extracted from the SUV map and their counterparts after wavelet decomposition (8 maps), respectively, including the first order features, gray level co-occurrence matrix features, gray level size zone matrix features, and gray level run length matrix features, all the features used and their definitions are provided Table S1 in the supplementary material. In total, 722 radiomic features of the tumor were extracted for each subject. As suggested for PET imaging data based analysis [37], we adopted the fixed bin size strategy for the gray-level discretization with the bin size set to 0.2. The mean number of gray levels for all the patients was 31.68, with a standard deviation of 25.11, reflecting the fact that tumors of different patients had varied SUV ranges [37]. The feature extraction was carried out in the 3D space and 26-connected neighborhood was adopted.
Supplementary data associated with this article can be found, in the online version, at https://doi.org/10.1016/j.radonc.2018.06.025.
We also used an alternative gray-level discretization scheme (Max-Lloyd algorithm [38]) to extract radiomic features in order to evaluate if the prediction performance is robust to the gray-level discretization schemes (presented in the supplemental material).
Unsupervised two-way clustering
To simultaneously clustering the patients and the radiomic features into sub-clusters, we implemented the unsupervised two-way clustering procedure using a matrix tri-factorization technique [30]. Given the feature matrix X ∊ RN×F, where N is the number of patients and F is the number of radiomic features, the matrix tri-factorization decomposes X into three low-rank matrices A, S, and Y, by optimizing the approximation error
where I is an identify matrix. As illustrated in Fig. 1, the low-rank matrix encodes the membership of Ks sub-clusters of patients, matrix encodes the membership of Kf subclusters of features, matrix encodes scales of different data points as well as interactions between A and Y, and Ks and Kf are two parameters set prior to the unsupervised two-way clustering.
The optimization problem was solved using an alternative optimization strategy [30]. Once the decomposition results were obtained, the low-dimension meta-features were calculated as M = AS, which were utilized to build prediction models for predicting clinical outcomes.
Patient stratification and prediction of survival and free of nodal failure
Based on the clustering results of patients and the meta-features obtained from the unsupervised two-way clustering, patient stratification and prediction of overall survival and freedom from nodal failure were carried out.
For assessing patient stratification performance of the two-way clustering method, Kaplan–Meier estimation [39] was adopted to estimate a survival function for each group of patients with respect to survival and freedom from nodal failure, and group differences were examined using Log-rank test [40].
We set the number of sub-clusters regarding patients Ks to 2 and 3 respectively, with an assumption that 2 sub-clusters of patients might stratify patients into groups with low and high risks with respect to mortality and nodal failure, whereas 3 sub-clusters might stratify them into groups with low, medium, and high risks. The number of meta-feature was set to 10, determined using a cross-validation strategy based on its performance for survival prediction. More details are provided in the supplemental material.
For predicting each patient’s risk of mortality and nodal failure, the meta-features extracted for each patient were used to build prediction models using 3 different survival modeling techniques, including Cox proportional hazard regression (Cox regression) [30], Cox regression with LASSO (Cox_lasso) [31], and random survival forests (RSF) [32]. Particularly, the Cox regression method is a standard survival modeling technique. Both the Cox regression and Cox_lasso methods are semi-parametric models, but the latter could select informative features during the model training. The RSF method is fully non-parametric, capable of selecting informative features. Different parameter settings for Ks and Kf of the two-way clustering method were adopted to investigate the associations between prediction performance and the parameters. Specifically, Ks was set to 2, 3, and 4 respectively, and Kf varied from 2 to 11 with an increment of 1, which was a reasonable range for the present study with 100 patients [41,42]. All the prediction models were trained and evaluated under the same 3-fold crossvalidation setting, and concordance index (c-index) was adopted to evaluate the prediction performance. The cross-validation procedure was repeated 100 times, and the average performance (mean and standard deviation of c-index) was reported. Prediction models were built using R packages survival, glmnet, and randomForestSRC. The Cox_lasso method’s sparsity parameter was determined automatically using a nested 3-fold cross-validation. For the RSF model, 500 decision trees were adopted and the minimum leaf size of the tree was set to 5.
The proposed method was compared with alternative techniques. Particularly, for evaluating the patient stratification performance, our method was compared with K-means clustering for clustering the patients based on 722 radiomic features with the same setting. For evaluating feature dimensionality performance, our method was compared with PCA that was adopted to obtain low-dimension feature representations for building survival prediction models. The prediction performance of PCA features was estimated using the same cross-validation procedure as described above.
To build prediction models with parameters automatically determined based on training data, a nested 5-fold crossvalidation was adopted to determine the parameters by searching parameter combinations (Ks ∊ (2, 3, 4) and Kf ∊ [5, 11]). For the PCA-based feature extraction, the optimal number of features was identified in [5,11] in the same way. Prediction models were also built upon clinical variables, including age, body mass index (BMI), race, sex, smoking status, T stage, tumor size, forced expiratory volume 1 (FEV1), FEV1/FVC (forced vital capacity), and histology, for predicting the risk of mortality and nodal failure at the individual subject level. A 3-fold cross-validation was adopted to evaluate all the methods, and the cross-validation was also repeated 100 times, with the mean prediction performance reported.
The prediction models built upon different features were compared in terms of their prediction performance using Wilcoxon signed-rank test [43].
Experimental results
Patient stratification
Fig. 2 shows results of the Kaplan-Meier estimations regarding survival and freedom from nodal failure for different patient groups. When the patients were stratified into 2 groups, the differences between them in terms of survival and freedom from nodal failure were not statistically significant as revealed by Log-rank test, although differences between the Kaplan-Meier plots of the two groups were subjectively visible. When the patients were stratified into 3 groups, the groups with low (green curve) and high (blue curve) risks of mortality were significantly different in their survival (p = 0.003), and they were also different in terms of freedom from nodal failure (p = 0.038), as shown in Fig. 2 top and bottom right respectively. The group (red curve) in-between had a medium risk in terms of both mortality and nodal failure. Overall, these results demonstrated that the two-way clustering could help stratify patients with different clinical endpoints. The two-way clustering result regarding the original radiomic features is illustrated in Fig. S1 in the supplementary material.
Fig. 2.
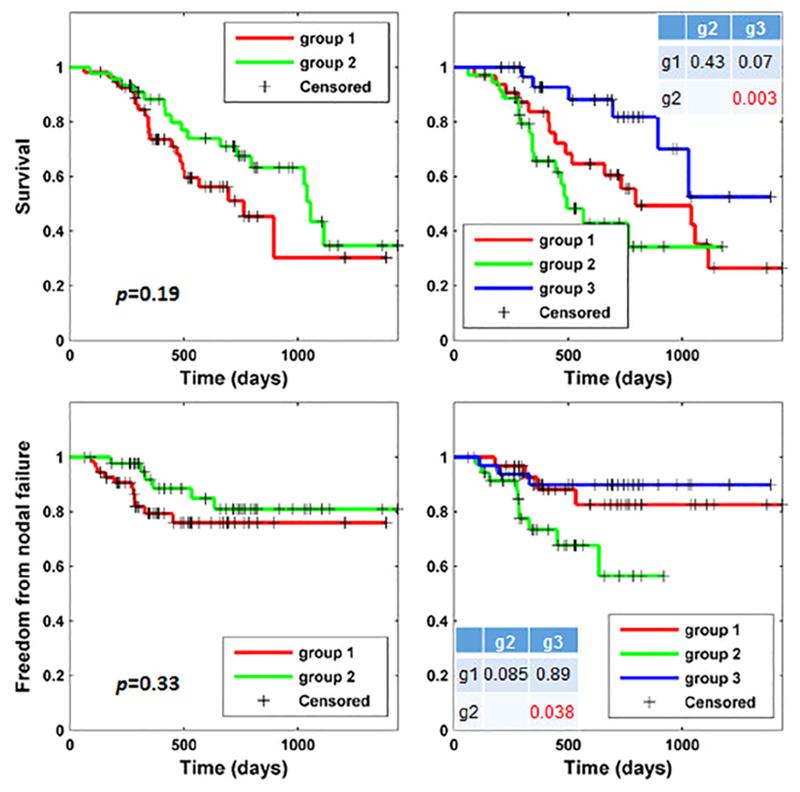
Kaplan–Meier plots of groups of patients stratified by the unsupervised two-way clustering method regarding overall survival (top) and freedom from nodal failure (bottom) with settings of 2 groups (left) and 3 groups (right). Group differences were examined using Log-rank tests. Tables in the right plots show p values between group 1 (g1), group 2 (g2), and group 3 (g3) with respect to survival (top) and freedom from nodal failure (bottom), respectively.
Fig. 3 shows patient stratification results obtained by applying K-means to the original radiomic features. Similar to the results obtained by the two-way clustering method, no significant group difference was found when the patients were stratified into 2 groups. When the patients were clustered into 3 groups, a marginal difference was observed between two groups in terms of survival (p = 0.041). However, they were not different in terms of freedom from nodal failure. These results indicate that the K-means clustering did not perform as good as the two-way clustering method for patient stratification in terms of both survival and freedom from nodal failure.
Fig. 3.
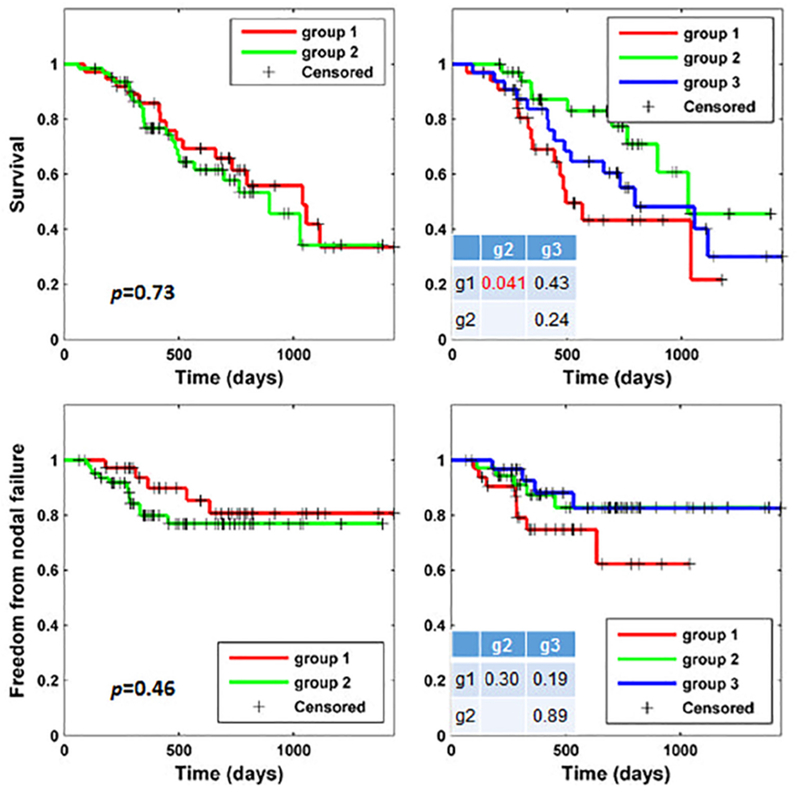
Kaplan–Meier plots of groups of patients stratified by the K-means clustering method regarding overall survival (top) and freedom from nodal failure (bottom) with settings of 2 groups (left) and 3 groups (right)). Group differences were examined using Log-rank tests. Tables in the right plots show p values between group 1 (g1), group 2 (g2), and group 3 (g3) with respect to survival (top) and freedom from nodal failure (bottom), respectively. No correspondence between the group IDs shown in Figs. 3 and 2.
Patient stratification has also been obtained according to their T stage statuses, with 3 subgroups corresponding to T1a, T1b, and T2a. No significant difference was observed between different subgroups, and Kaplan-Meier plots regarding survival and nodal failure are shown in Fig. S2 in the supplemental material.
Prediction of overall survival and freedom from nodal failure
Fig. 4 shows prediction performance obtained by different prediction models. In each plot, the x-axis refers the number of meta-features, and the y-axis refers to the c-index of the prediction models. As shown in the top row of Fig. 4, the prediction models built upon meta-features obtained by two-way clustering outperformed their PCA-based counterparts in terms of survival, especially when the number of patient groups was 3. With respect to nodal failure as shown in the bottom row of Fig. 4, the Cox_lasso and RSF models built with the proposed meta-features outperformed the corresponding PCA-based models, while the Cox model built upon PCA-based features obtained better performance.
Fig. 4.
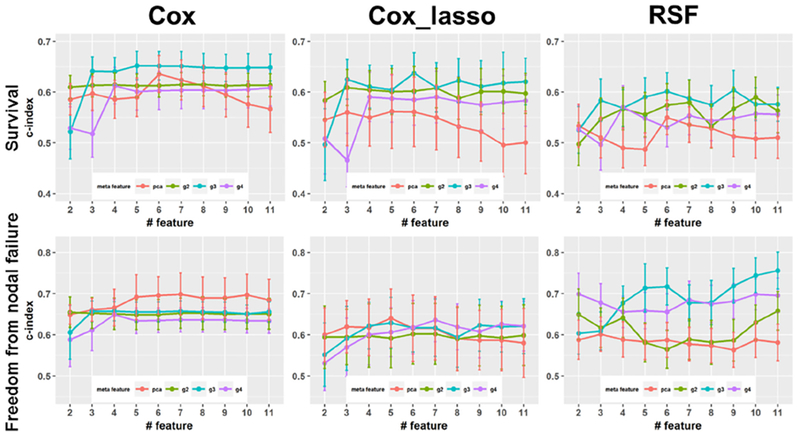
Performance of prediction models built upon meta-features extracted by the unsupervised two-way clustering and PCA with respect to survival (top row) and freedom from nodal failure (bottom row) using different prediction models. Plots of g2, g3, and g4 are results obtained with the two-way clustering based meta-features with 2, 3, and 4 groups of patients, respectively.
Fig. 5 shows different meta-features’ overall prediction performance that was calculated as the sum of the c-index measures of the Cox-regression, Cox-lasso, and RSF prediction models with different numbers of features. The results demonstrated that the proposed meta-features had better prediction performance than PCA features when the number of meta-features was greater than 3, indicating that these proposed meta-features were more informative for the prediction of survival and freedom from nodal failure.
Fig. 5.
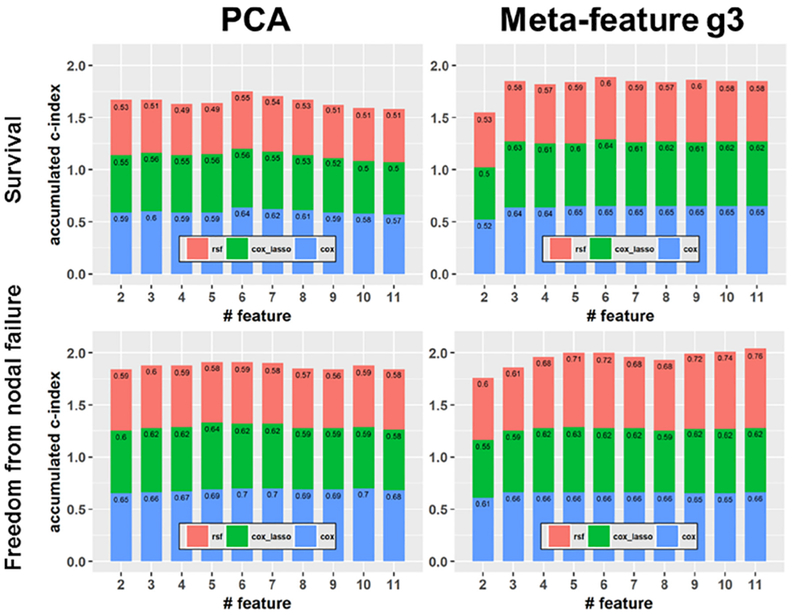
Overall prediction performance of prediction models built upon the PCA features (left) and the two-way clustering features (right) with respect to survival (top) and freedom from nodal failure (bottom).
Based on the meta-features extracted by the two-way clustering method, the c-index regarding survival obtained by Cox model, Cox_lasso model, and RSF model were 0.640 ± 0.029, 0.617 ± 0.034, and 0.552 ± 0.044 respectively. For nodal failure, the c-index were 0.637 ± 0.049, 0.607 ± 0.076, and 0.664 ± 0.063 respectively. Based on the PCA-based meta-features, the c-index regarding survival obtained by Cox model, Cox_lasso model, and RSF model were 0.605 ± 0.075, 0.541 ± 0.094, and 0.515 ± 0.062 respectively; for nodal failure the c-index were 0.660 ± 0.081, 0.592 ± 0.111, and 0.555 ± 0.071 respectively. Specifically, for predicting survival the best prediction model built upon the proposed meta-features was better than that build upon the PCA-based meta-features (p < 0.001); for predicting nodal failure the best prediction model built upon the proposed meta-features was better than that build upon the PCA-based meta-features, but without statistical significance (p = 0.328). For the RSF models, the prediction performance was not sensitive to the number of trees and leaf size adopted, prediction performance with different settings are illustrated in Fig. S3 in the supplemental material.
The prediction models built upon clinical variables had numerically worse performance. For survival prediction, c-index values obtained by the Cox model, the Cox_lasso model, and the RSF model were 0.529 ± 0.045, 0.531 ± 0.059, and 0.535 ± 0.046 respectively. For nodal failure, c-index values of these models were 0.496 ± 0.063, 0.433 ± 0.105, and 0.480 ± 0.065, respectively. All these prediction models had worse performance than their counterparts build upon the radiomic features (p < 0.04).
Prediction models were also built upon combination of clinical variables and radiomic features. For the survival prediction, c-index values obtained by the Cox_lasso, and RSF model were 0.595 ± 0.042, and 0.581 ± 0.042, respectively. For the nodal failure, c-index values of these models were 0.551 ± 0.055, and 0.617 ± 0.057, respectively. These prediction models had better prediction performance than those build upon clinical variables alone, indicating that radiomic features could provide complementary and discriminative information for the prediction.
Discussion
Radiomic analysis has been a powerful tool to investigate the associations between imaging data and clinical endpoints quantitatively. Due to high-dimensional features extracted from the imaging data, feature selection and feature dimensionality reduction is crucial to obtain robust and reliable analysis results in radiomic analysis studies, especially in those with a small sample size [21–23]. In this study, we have proposed an unsupervised two-way clustering technique to perform patient stratification and feature dimensionality reduction simultaneously, with the hypothesis that the patient stratification and feature dimensionality reduction will benefit from each other. The experiment results have demonstrated that the proposed method could achieve competitive performance compared with the conventional patient stratification and feature extraction techniques with respect to both patient stratification and prediction of patient survival and freedom from nodal failure. Compared with prediction models built upon clinical measures, the prediction models built upon radiomic features had better prediction performance. Prediction models built upon combination of clinical variables and radiomic features had better performance than those built upon clinical variable alone, but worse than those built upon radiomic features alone. One possible reason is that all the patients in the present study were at early stage (89% at T1 stage and 11% at T2 stage) and therefore the clinical variables could not provide discriminative information for the prediction. As shown in the supplementary material, the tumor volume was significantly correlated with survival (p < 0.05) and nodal failure (p < 0.0005), the SUVmax measure was not significantly correlated with survival or nodal failure (p > 0.5), and prediction models built upon the tumor volume and SUVmax measures had relatively worse prediction performance than those built upon the complex radiomic features. These results further demonstrated that more discriminative information than the tumor volume and SUVmax measures could be extracted from imaging data [44].
Radiomic features have been investigated for the prognosis in NSCLC patients in terms of different clinical endpoints [1–4]. The prognosis is typically formulated as a supervised machine learning problem and feature selection is usually adopted to improve the performance of the prognosis models. Feature selection is usually performed based on the feature’s reproducibility and discriminative power [26–28]. The reproducibility is typically calculated based on test-retest datasets, which requires datasets at multiple time points from the same subjects. While the test-retest dataset is not always available, the features with high reproducibility are not necessarily informative for prediction tasks. Features selected according to their discriminative power are typically more informative for prediction; however, it is prone to overfitting the training data, especially in studies with a small sample size. Unsupervised feature dimension reduction techniques, such as PCA, are capable of capturing associations among the original features, they are not optimized for prognosis tasks, as no information relevant to clinical endpoints is used to drive the feature extraction.
Recent studies have demonstrated that clustering patients based on their radiomic signatures could lead to clinical meaningful stratification, such as low/high mortality risk and recurrence risk [45]. This indicates that patient stratification could provide weak supervision for extracting features relevant to clinical endpoints. Inspired by this observation, we developed this unsupervised two-way clustering method to perform the patient stratification and feature dimensionality reduction (meta-feature extraction) simultaneously, with the assumption that patient stratification and meta-feature extraction could benefit from each other. While the patient stratification provides weak supervision to extract features that are potentially informative for predicting clinical endpoints, the features extracted in turn facilitate the patient stratification. The survival analysis results of the NSCLC patients in this study have demonstrated the advantages of the proposed method compared to conventional current alternatives in which the patient stratification and the meta-feature extraction are typically decoupled. For the patient stratification, the results obtained by the proposed method showed larger differences between different groups with respect to both patient survival and freedom from nodal failure than those obtained by the K-means clustering method, demonstrating benefits brought to the patient stratification by the meta-feature extraction. On the other hand, the prediction performance in terms of both survival and freedom from nodal failure also showed that the features extracted by the two-way clustering were more informative than those obtained by the PCA method across different feature dimensions and prediction model settings, demonstrating benefits of weak supervision from the patient stratification.
In the present study, we found that the patient stratification with 3 clusters showed better performance than that with 2 clusters, as demonstrated by results shown in Fig. 2. On the other hand, the 3-cluster patient stratification also yielded more informative meta-features for building prognosis models as shown in Figs. 4 and 5, indicating that it provides informative guidance for the meta-feature extraction. Increasing the number of clusters of patients to 4 did not lead to better meta-feature as shown in Fig. 4, indicating that a more complex model might capture confounding information that affected the meta-feature extraction adversely.
The quantization (discretization) of SUVs into a set of discrete values has been investigated and discussed in recent studies [37,46]. Particularly, the SUV quantization methods using a fixed number of bins and a fixed bin size in SUV unit have been compared for clinical treatment response assessment [37]. It has been demonstrated that the SUV quantization using a fixed bin size in SUV unit across tumor images could yield textural feature values that are defined on the same SUV scale, allowing for a meaningful comparison of texture between images. A variety of other SUV quantization methods have also been discussed [46]. However, no conclusion has been reached with respect to a standard method.
In the present study, we used both the SUV quantization methods with a fixed number of bins and a fixed bin size in SUV unit. When the SUV quantization method with a fixed bin size of 0.2 SUV unit was used, the mean number of gray levels for all the patients was 31.68, with a standard deviation of 25.11, reflecting the fact that tumors of different patients had varied SUV ranges. For the SUV quantization method with a fixed number of bins, two settings of 32 and 64 bins were adopted (the supplementary material). For the prediction of survival, the SUV quantization method with a fixed bin size in SUV units had led to better performance, while the SUV quantization method with a fixed number of bins had yielded better performance for the prediction of nodal failure. These results suggest that the SUV quantization methods merit further investigation.
Our study has several limitations. First, we did not include CT data in the analysis since tumors in CT scans were not well coregistered with those in PET scans after linear registration due to the respiratory motions [47]. We did not extract radiomic features from CT scan based on our current segmentation results due to relatively low spatial resolution of the CT scans after registration. The main aim of this study was to investigate and validate if the unsupervised two-way clustering could improve feature representations compared with conventional unsupervised feature dimension reduction methods. Advanced non-rigid multimodal image registration may help accurately register tumors in CT and PET scans, or tumors could be segmented for PET and CT scans separately [9,10]. The potential benefit of multimodal imaging features merits further investigation. Second, although our study included all consecutive patients treated in a very homogenous way, the sample size of our study is modest, and the method has not been validated based on external validation data. We will further validate our method based on data collected at multiple institutions.
In conclusion, we proposed an unsupervised machine leaning algorithm for simultaneous patient stratification and feature dimensionality reduction (meta-feature extraction), aiming to achieve robust performance for predicting treatment response and survival based on radiomic features. The evaluation results demonstrated that our method can achieve promising performance for distinguishing patients with different outcomes and extracting meta-features that are predictive for estimating various clinical outcomes. The proposed method is applicable to other cancer studies.
Supplementary Material
Acknowledgements
This work was supported in part by National Institutes of Health grants [grant numbers CA223358, CA189523, EB022573, DK114786, DA039215, and DA039002] and Precision Lung Radiotherapy Grant of the University of Pennsylvania.
Footnotes
Conflict of interest
The authors declare that they have no relevant financial interests.
Ethical considerations
This is an IRB approved study which has been carried out in accordance with The Code of Ethics of the World Medical Association (Declaration of Helsinki) for experiments involving humans.
References
- [1].Scrivener M, de Jong EE, van Timmeren JE, Pieters T, Ghaye B, Geets X. Radiomics applied to lung cancer: a review. Trans Cancer Res 2016;5:398–409. [Google Scholar]
- [2].Chen B, Zhang R, Gan Y, Yang L, Li W. Development and clinical application of radiomics in lung cancer. Radiat Oncol 2017;12:154. [DOI] [PMC free article] [PubMed] [Google Scholar]
- [3].Constanzo J, Wei L, Tseng H-H, Naqa IE. Radiomics in precision medicine for lung cancer. Trans Lung Cancer Res 2017;6:635–47. [DOI] [PMC free article] [PubMed] [Google Scholar]
- [4].Lee G, Lee HY, Park H, Schiebler ML, van Beek EJR, Ohno Y, et al. Radiomics and its emerging role in lung cancer research, imaging biomarkers and clinical management: State of the art. Eur J Radiol 2017;86:297–307. [DOI] [PubMed] [Google Scholar]
- [5].Hawkins SH, Korecki JN, Balagurunathan Y, Gu Y, Kumar V, Basu S, et al. Predicting outcomes of nonsmall cell lung cancer using CT image features. IEEE Access 2014;2:1418–26. [Google Scholar]
- [6].Huang Y, Liu Z, He L, Chen X, Pan D, Ma Z, et al. Radiomics signature: a potential biomarker for the prediction of disease-free survival in early-stage (I or II) non-small cell lung cancer. Radiology 2016;281:947–57. [DOI] [PubMed] [Google Scholar]
- [7].Li Q, Kim J, Balagurunathan Y, Liu Y, Latifi K, Stringfield O, et al. Imaging features from pretreatment CT scans are associated with clinical outcomes in nonsmall-cell lung cancer patients treated with stereotactic body radiotherapy. Med Phys 2017;44:4341–9. [DOI] [PMC free article] [PubMed] [Google Scholar]
- [8].Yu W, Tang C, Hobbs BP, Li X, Koay EJ, Wistuba II, et al. Development and validation of a predictive radiomics model for clinical outcomes in stage I nonsmall cell lung cancer. Int J Radiat Oncol* Biol* Phys 2017. [DOI] [PubMed] [Google Scholar]
- [9].Vaidya M, Creach KM, Frye J, Dehdashti F, Bradley JD, El Naqa I. Combined PET/CT image characteristics for radiotherapy tumor response in lung cancer. Radiother Oncol: J Eur Soc Therapeutic Radiol Oncol 2012;102:239–45. [DOI] [PubMed] [Google Scholar]
- [10].Desseroit MC, Visvikis D, Tixier F, Majdoub M, Perdrisot R, Guillevin R, et al. Development of a nomogram combining clinical staging with (18)F-FDG PET/CT image features in non-small-cell lung cancer stage I-III. Eur J Nucl Med Mol Imaging 2016;43:1477–85. [DOI] [PMC free article] [PubMed] [Google Scholar]
- [11].Coroller TP, Grossmann P, Hou Y, Rios Velazquez E, Leijenaar RT, Hermann G, et al. CT-based radiomic signature predicts distant metastasis in lung adenocarcinoma. Radiother Oncol: J Eur Soc Therapeutic Radiol Oncol 2015;114:345–50. [DOI] [PMC free article] [PubMed] [Google Scholar]
- [12].Huynh E, Coroller TP, Narayan V, Agrawal V, Hou Y, Romano J, et al. CT-based radiomic analysis of stereotactic body radiation therapy patients with lung cancer. Radiother Oncol: J Eur Soc Ther Radiol Oncol 2016;120:258–66. [DOI] [PubMed] [Google Scholar]
- [13].Li Q, Kim J, Balagurunathan Y, Qi J, Liu Y, Latifi K, et al. CT imaging features associated with recurrence in non-small cell lung cancer patients after stereotactic body radiotherapy. Radiat Oncol 2017;12:158. [DOI] [PMC free article] [PubMed] [Google Scholar]
- [14].Coroller TP, Agrawal V, Narayan V, Hou Y, Grossmann P, Lee SW, et al. Radiomic phenotype features predict pathological response in non-small cell lung cancer. Radiother Oncol: J Eur Soc Ther Radiol Oncol 2016;119:480–6. [DOI] [PMC free article] [PubMed] [Google Scholar]
- [15].Cistaro A, Quartuccio N, Mojtahedi A, Fania P, Filosso PL, Campenni A, et al. Prediction of 2 years-survival in patients with stage I and II non-small cell lung cancer utilizing (18)F-FDG PET/CT SUV quantification. Radiol Oncol 2013;47:219–23. [DOI] [PMC free article] [PubMed] [Google Scholar]
- [16].Lian C, Ruan S, Denoeux T, Jardin F, Vera P. Selecting radiomic features from FDG-PET images for cancer treatment outcome prediction. Med Image Anal 2016;32:257–68. [DOI] [PubMed] [Google Scholar]
- [17].Wu J, Aguilera T, Shultz D, Gudur M, Rubin DL, Loo BW Jr, et al. Early-stage non-small cell lung cancer: quantitative imaging characteristics of (18)F fluorodeoxyglucose PET/CT allow prediction of distant metastasis. Radiology 2016;281:270–8. [DOI] [PMC free article] [PubMed] [Google Scholar]
- [18].Liu Y, Kim J, Balagurunathan Y, Li Q, Garcia AL, Stringfield O, et al. Radiomic features are associated with EGFR mutation status in lung adenocarcinomas. Clin Lung Cancer 2016;17:441–8. e6. [DOI] [PMC free article] [PubMed] [Google Scholar]
- [19].Grossmann P, Stringfield O, El-Hachem N, Bui MM, Rios Velazquez E, Parmar C, et al. Defining the biological basis of radiomic phenotypes in lung cancer. eLife 2017;6. [DOI] [PMC free article] [PubMed] [Google Scholar]
- [20].Emaminejad N, Qian W, Guan Y, Tan M, Qiu Y, Liu H, et al. Fusion of quantitative image and genomic biomarkers to improve prognosis assessment of early stage lung cancer patients. IEEE Trans Bio-med Eng 2016;63:1034–43. [DOI] [PubMed] [Google Scholar]
- [21].Kumar V, Gu Y, Basu S, Berglund A, Eschrich SA, Schabath MB, et al. Radiomics: the process and the challenges. Magn Reson Imaging 2012;30:1234–48. [DOI] [PMC free article] [PubMed] [Google Scholar]
- [22].Lambin P, Rios-Velazquez E, Leijenaar R, Carvalho S, van Stiphout RG, Granton P, et al. Radiomics: extracting more information from medical images using advanced feature analysis. Eur J Cancer 2012;48:441–6. [DOI] [PMC free article] [PubMed] [Google Scholar]
- [23].Gillies RJ, Kinahan PE, Hricak H. Radiomics: images are more than pictures, they are data. Radiology 2015;278:563–77. [DOI] [PMC free article] [PubMed] [Google Scholar]
- [24].Zwanenburg A, Leger S, Vallières M, Löck S. Image biomarker standardisation initiative-feature definitions. arXiv preprint arXiv:161207003; 2016.
- [25].Vallieres M, Zwanenburg A, Badic B, Cheze Le Rest C, Visvikis D, Hatt M. Responsible radiomics research for faster clinical translation. J Nucl Med: Official Publ, Soc Nucl Med 2018;59:189–93. [DOI] [PMC free article] [PubMed] [Google Scholar]
- [26].Peng H, Fan Y. Direct sparsity optimization based feature selection for multiclass classification. In: Proceedings of the twenty-fifth international joint conference on artificial intelligence (IJCAI-16); 2016 p. 1918–24. [Google Scholar]
- [27].Peng H, Fan Y. Feature selection by optimizing a lower bound of conditional mutual information. Inf Sci 2017;418–419:652–67. [DOI] [PMC free article] [PubMed] [Google Scholar]
- [28].Peng H, Fan Y. A general framework for sparsity regularized feature selection via iteratively reweighted least square minimization. In: Proceedings of the thirty-first AAAI conference on artificial intelligence (AAAI-17); 2017 p. 2471–7. [Google Scholar]
- [29].Hotelling H. Analysis of a complex of statistical variables into principal components. J Educ Psychol 1933;24:417–41. [Google Scholar]
- [30].Ding C, Li T, Peng W, Park H. Orthogonal nonnegative matrix t-factorizations for clustering. In: Proceedings of the 12th ACM SIGKDD international conference on Knowledge discovery and data mining: ACM; 2006 p. 126–35. [Google Scholar]
- [31].Li H, Galperin-Aizenberg M, Pryma DA, Simone CB II, Fan Y. Unsupervised machine learning of radiomic features for predicting treatment response and survival of early-stage nonsmall cell lung cancer patients treated with stereotactic body radiation therapy. Int J Radiat Oncol Biol Phys 2017;99:S34. [DOI] [PMC free article] [PubMed] [Google Scholar]
- [32].Davatzikos C, Rathore S, Bakas S, Pati S, Bergman M, Kalarot R, et al. Cancer imaging phenomics toolkit: quantitative imaging analytics for precision diagnostics and predictive modeling of clinical outcome. J Med Imaging 2018;5:011018. [DOI] [PMC free article] [PubMed] [Google Scholar]
- [33].Grady L Random walks for image segmentation. IEEE T Pattern Anal 2006;28:1768–83. [DOI] [PubMed] [Google Scholar]
- [34].Li H, Song M, Fan Y. Segmentation of brain tumors in multi-parametric MR images via robust statistic information propagation. Berlin, Heidelberg: Springer; 2011. p. 606–17. [Google Scholar]
- [35].Li H, Fan Y. Label propagation with robust initialization for brain tumor segmentation. In: 2012 9th IEEE international symposium on biomedical imaging (ISBI); 2012 p. 1715–8. [Google Scholar]
- [36].van Griethuysen JJM, Fedorov A, Parmar C, Hosny A, Aucoin N, Narayan V, et al. Computational radiomics system to decode the radiographic phenotype. Cancer Res 2017;77:e104–7. [DOI] [PMC free article] [PubMed] [Google Scholar]
- [37].Leijenaar RT, Nalbantov G, Carvalho S, van Elmpt WJ, Troost EG, Boellaard R, et al. The effect of SUV discretization in quantitative FDG-PET Radiomics: the need for standardized methodology in tumor texture analysis. Sci Rep 2015;5:11075. [DOI] [PMC free article] [PubMed] [Google Scholar]
- [38].Vallieres M, Freeman CR, Skamene SR, El Naqa I. A radiomics model from joint FDG-PET and MRI texture features for the prediction of lung metastases in soft-tissue sarcomas of the extremities. Phys Med Biol 2015;60:5471–96. [DOI] [PubMed] [Google Scholar]
- [39].Kaplan EL, Meier P. Nonparametric-estimation from incomplete observations.J Am Stat Assoc 1958;53:457–81. [Google Scholar]
- [40].Mantel N Evaluation of survival data and two new rank order statistics arising in its consideration. Cancer Chemother Rep 1966;50:163–70. [PubMed] [Google Scholar]
- [41].Austin PC, Allignol A, Fine JP. The number of primary events per variable affects estimation of the subdistribution hazard competing risks model. J Clin Epidemiol 2017;83:75–84. [DOI] [PubMed] [Google Scholar]
- [42].Ogundimu EO, Altman DG, Collins GS. Adequate sample size for developing prediction models is not simply related to events per variable. J Clin Epidemiol 2016;76:175–82. [DOI] [PMC free article] [PubMed] [Google Scholar]
- [43].Demšar J Statistical comparisons of classifiers over multiple data sets. J Mach Learn Res 2006;7:1–30. [Google Scholar]
- [44].Fu L, Li H, Wang H, Xu B, Fan Y, Tian J. SUVmax/THKmax as a biomarker for distinguishing advanced gastric carcinoma from primary gastric lymphoma. PLoS One 2012;7:e50914. [DOI] [PMC free article] [PubMed] [Google Scholar]
- [45].Wu J, Cui Y, Sun X, Cao G, Li B, Ikeda DM, et al. Unsupervised clustering of quantitative image phenotypes reveals breast cancer subtypes with distinct prognoses and molecular pathways. Clin Cancer Res: An Official J Am Assoc Cancer Res 2017;23:3334–42. [DOI] [PMC free article] [PubMed] [Google Scholar]
- [46].Hatt M, Tixier F, Pierce L, Kinahan PE, Le Rest CC, Visvikis D. Characterization of PET/CT images using texture analysis: the past, the presenta… any future? Eur J Nucl Med Mol I 2017;44:151–65. [DOI] [PMC free article] [PubMed] [Google Scholar]
- [47].Lovinfosse P, Janvary ZL, Coucke P, Jodogne S, Bernard C, Hatt M, et al. FDG PET/CT texture analysis for predicting the outcome of lung cancer treated by stereotactic body radiation therapy. Eur J Nucl Med Mol Imaging 2016;43:1453–60. [DOI] [PubMed] [Google Scholar]
Associated Data
This section collects any data citations, data availability statements, or supplementary materials included in this article.