SUMMARY
The plant hormone strigolactones (SLs) regulate many aspects of plant physiology. In shoot branching inhibition, the SL-metabolizing α/β hydrolase D14 interacts with the F-box protein D3 to ubiquitinate and degrade the transcription repressor D53. Despite multiple modes of D14-SL interactions determined recently, how the hydrolase functions with D3 to mediate hormone-dependent D53 ubiquitination remains elusive. Here we show that D3 features a C-terminal α-helix (CTH), which can switch between two conformational states. Distinct from its engaged form, which facilitate the binding of D3 and D14 with a hydrolyzed SL intermediate, the dislodged D3 CTH can recognize unmodified D14 in an open conformation and inhibits its enzymatic activity. In an SL-dependent manner, the D3 CTH enables D14 to recruit D53, which in turn activates the hydrolase. By unraveling an unexpected structural plasticity in SCFD3-D14 ubiquitin ligase, our results suggest an intricate mechanism by which the E3 coordinates SL signaling and metabolism.
INTRODUCTION
Strigolactones (SLs) represent a class of plant hormones that regulate a variety of plant growth and developmental processes, such as shoot branching, root development, leaf senescence, and flower size1–3. SLs are also exuded by plant roots for stimulating interactions with symbiotic fungi4 and exploited by parasitic plants to time their seed germination5–8. As a group of terpenoid lactones, SLs typically comprise a butenolide ring (D ring) connected to a variable tricyclic lactone (ABC rings) via an enol-ether bridge9,10. Functional dissection of both natural and synthetic SL molecules has indicated that the C and D rings and their linkage are essential for SL activity, whereas separated ABC or D rings are inactive in plants10–13.
The perception and signal propagation of SLs are coordinated by three highly conserved components, DWARF3 (D3)/MORE AXILLARY GROWTH2 (MAX2), DWARF14 (D14), and DWARF53 (D53)/SUPPRESSOR OF MAX2 –LIKE6/7/8 (SMXL6/7/8)12,14–22. As a member of the α/β serine hydrolase superfamily, D14 not only serves as the SL receptor, but also metabolizes SLs into tricyclic ABC and D ring products, albeit at a rate much slower than most known α/β hydrolases12,13,23. D3/MAX2 encodes an F-box protein and binds Arabidopsis Skp1-like protein, ASK1, to function as a substrate receptor of an Skp1-CUL1-F-box (SCF) ubiquitin ligase complex20,24. Recent studies have shown that SCFD3/MAX2-D14 mediates shoot branching inhibition by sensing SLs and ubiquitinating D53/SMXL6–8, a key nuclear repressor that regulates distinct developmental processes and SL-signaling target genes15–17,22,25–28.
Early structural studies of SL perception focused on the binding of the hormone to isolated D14 orthologs12,13,23,29. Crystal structures of several D14 orthologs, either in their apo or ligand-bound forms, revealed a common α/β fold with a large and solvent-exposed ligand-binding pocket6,12–14,23,30. Thus, SLs were thought to be perceived by D14 orthologs in this open conformation, although possible conformational changes have also been suggested. Interestingly, a recent study of the pea (Pisum sativum) D14 ortholog, RAMOSUS3 (RMS3), suggested that the α/β-fold hydrolase is a single-turnover enzyme, which produces a covalent D-ring-enzyme complex via the catalytic histidine after substrate hydrolysis and the rapid release of the ABC-ring31. The crystal structure of rice ASK1-D3 in complex with Arabidopsis thaliana D14 further uncovered a closed conformation of D3-bound AtD14, which sequesters the covalently linked intermediate molecule (CLIM) of SL inside a small enclosed pocket32. These results raised the possibility that CLIM might represent the active form of the hormone. This proposition, however, is complicated by the identification of multiple non-hydrolyzable SL agonists6,33–35.
To better delineate the signaling competent form of D14 in the context of substrate recognition by the SCF E3 and its relationship with hormone hydrolysis, we have performed structure-function studies of the homogeneous rice D14-D3-D53 system. Our analyses have not only revealed structural plasticity in D3, but also unveiled new functional states of SCFD3-D14 that are switchable by D53 for SL hydrolysis.
RESULTS AND DISCUSSION
Structural plasticity of D3-CTH
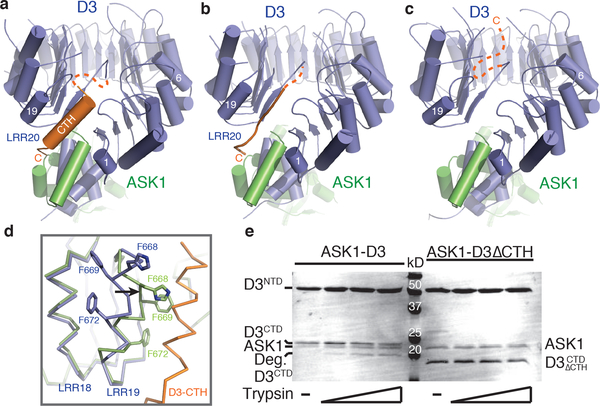
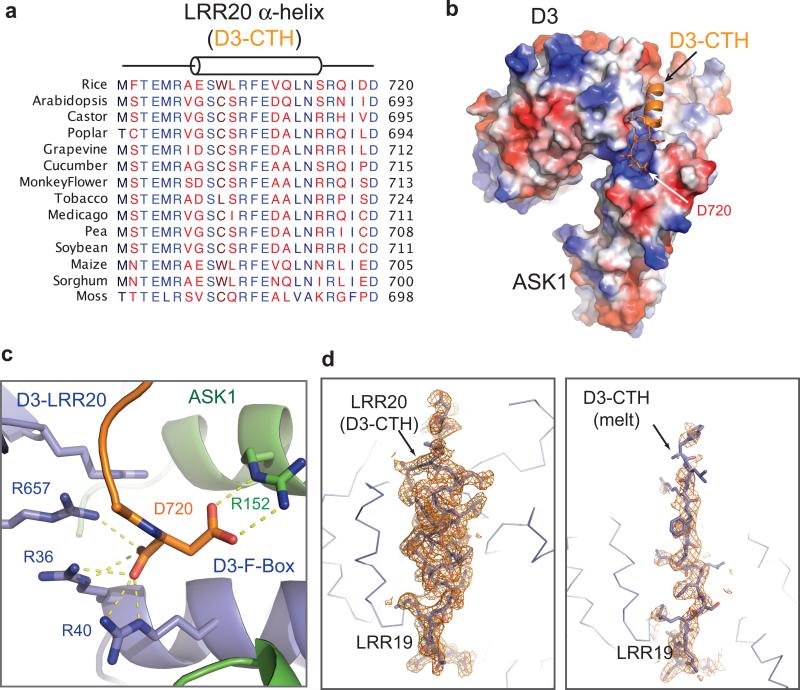
We first independently determined the crystal structure of D3 in complex with ASK1. D3 contains an N-terminal F-box motif, which forms a canonical interface with ASK1. Its C-terminal domain consists of 20 leucine-rich repeats (LRRs) and adopts a fully circularized solenoid fold with its last LRR (LRR20) making direct contacts with the three N-terminal LRRs and the C-terminal α-helix of ASK1 (Fig. 1a). Distinct from most LRR-containing F-box proteins, the extreme C-terminal residue of D3, Asp720, is strictly conserved among diverse plant species (Extended Data Fig. 1a). Its backbone and side chain carboxyl groups are simultaneously anchored to a positively charged pocket constructed by ASK1, the F-box motif, and the LRR domain of D3 (Extended Data Fig. 1b-c).
Figure 1. Structural plasticity of the D3 C-terminal 𝛂-helix.
(a-c) Overall structures of ASK1 (green) bound to D3 (blue) with its C-terminal α-helix in variable conformation. (d) Superposition of ASK1-D3 structures shown in (a) (blue) and (c) (green) focusing on LRR18–20. LRR20 (orange) is disordered in the third crystal form (c). Black arrow indicates the conformational shift of LRR19 when LRR20 is disordered. (e) Limited proteolysis of ASK1-D3 complex ± CTH (repeated thrice). The D3 protein was purified with its N-terminal and C-terminal segments (NTD & CTD) tightly associated (see Methods).
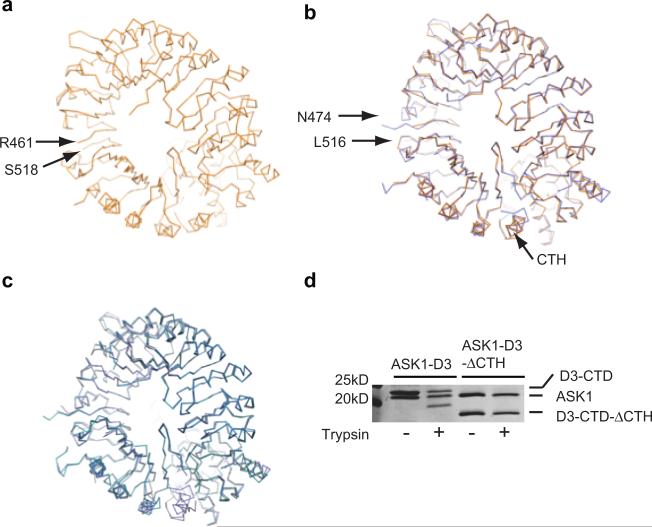
We subsequently identified a second crystal form of the D3-ASK1 complex, which was crystallized in a different space group with two copies of the complex in the asymmetric unit (Extended Data Table 1). A typical LRR consists of a β-strand, an α-helix and an intervening loop. In contrast to the first D3-ASK1 structure, the LRR20 α-helix in one copy of D3 is mostly reshaped into an extended conformation, although its C-terminal Asp720 residue remains engaged with the basic binding pocket (Fig. 1b, Extended Data Fig. 1d). Remarkably, the electron density of the LRR20 α-helix in the other copy of D3 is entirely missing, indicating that it is dislodged from the LRR domain and becomes structurally disordered (Fig. 1c). Concurrent to the remodeling of LRR20, the α-helix of the adjacent repeat, LRR19, is shifted toward the space originally occupied by LRR20 α-helix, away from LRR18 α-helix (Fig. 1d). In a similar yet non-isomorphous crystal, the electron density of the LRR20 α-helix is absent in both copies of the complex (Extended Data Table 1). Together, these structural results strongly suggest that the C-terminal α-helix (CTH) of D3 can have a dynamic topology, capable of switching between engaged and dislodged states. Using limited proteolytic digestion, we further verified that the C-terminal end of D3 is indeed more sensitive to protease cleavage than the rest of the protein (Fig. 1e, Extended Data Fig. 2–3). Its conformational plasticity, therefore, is an inherent property of the F-box protein in solution.
D3-CTH binds and inhibits D14
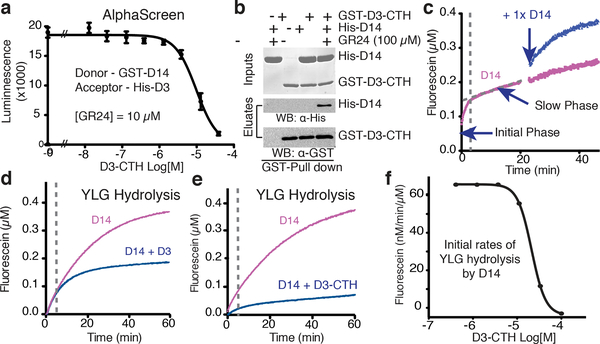
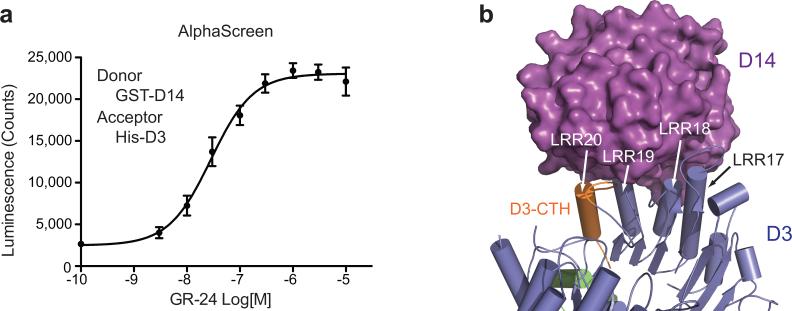
The unusual structural feature of D3-CTH prompted us to investigate its role in D3-D14 interaction. We first established a quantitative method for measuring GR24-dependent D3-D14 interaction in an AlphaScreen assay (Extended Data Fig. 4a). In a dose-dependent manner, a 28 amino acids D3-CTH peptide was able to compete with D3 for binding D14 at a saturating concentration of GR24 (Fig. 2a). When fused to GST, the same D3 sequence robustly pulled down D14 in a GR24-dependent manner (Fig. 2b), indicating that it can directly interact with the α/β hydrolyase. In the previously reported crystal structure of the AtD14-D3-ASK1 complex, D3-CTH is fully engaged with the LRR domain32. It uses its N-terminal tip and preceding loop to assist the recognition of the CLIM-bound α/β hydrolyase by three other D3 C-terminal LRRs (LRR17–19) (Extended Data Fig. 4b). Without the rest of the F-box protein, it is unlikely that our D3-CTH peptide interacts with CLIM-bound D14 in a similar manner.
Figure 2. D3-CTH binds and inhibits D14.
(a) AlphaScreen assay measuring the ability of D3-CTH peptide to compete with His-D3 for binding GST-D14 complex. 10 μM GR24 was used to ensure constant binding between D3 and D14 (mean ± s.d. of biological triplicates). (b) Pull-down assay showing direct GR24-dependent interaction between GST-D3-CTH and His-D14 (repeated thrice). (c) Biphasic kinetics of YLG hydrolysis by D14. 0.125 μM enzyme was used to better separate the initial phase from the slow linear phase (purple). An equal amount of extra enzyme was added in a second identical sample (blue) to rule out the possibility that the slow linear phase is due to substrate depletion. (d, e) Kinetics of YLG hydrolysis by D14 (0.25 μM) ± ASK1-D3 or ± D3-CTH. (f) Dose response curve of D3-CTH in inhibiting D14 enzyme activity.
D14 hydrolyzes the fluorogenic SL agonist, Yoshimulactone Green (YLG)7, with a biphasic time course characterized by a rapid initial phase followed by slow linear hydrolysis (Fig. 2c). Such a two-stage reaction has been reported for RMS3, which becomes completely inhibited by CLIM after hydrolyzing a substrate molecule31. Instead of being a single-turnover enzyme, however, D14 slowly released the D-ring under our experimental conditions and continued to hydrolyze additional substrate, as evidenced by the slow linear phase of its enzyme kinetics. Consistent with the recognition and stabilization of CLIM-bound D14 by D3-ASK1, addition of recombinant D3-ASK1 to D14 reduced its substrate hydrolysis rate in the slow linear phase without compromising the rapid initial reaction (Fig. 2d). Remarkably, an increasing amount of the isolated D3 C-terminal peptide not only blocked the slow linear hydrolysis, but also inhibited the initial reaction, i.e. the first cycle of YLG hydrolysis by D14 (Fig. 2e). Moreover, the IC50 of the D3 C-terminal peptide in inhibiting D14 and its affinity to the α/β hydrolase are in the same range (Fig. 2a, f). Taken together, these results suggest that the D3 C-terminal region, when dislodged from the LRR domain, can interact with D14 and block its enzymatic activity in a manner different from its engaged form.
Structure of a D3-CTH-D14-GR24 complex
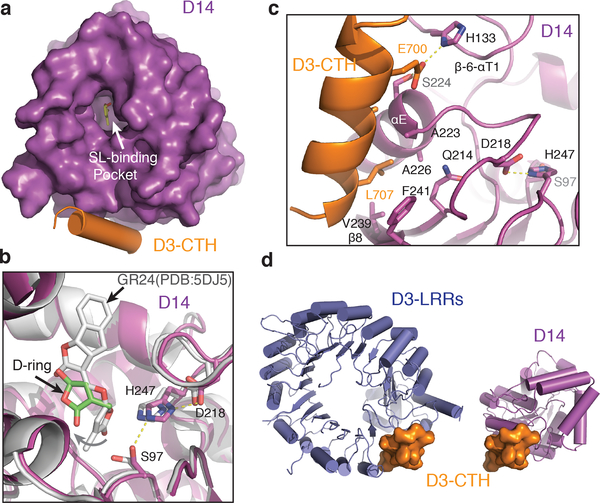
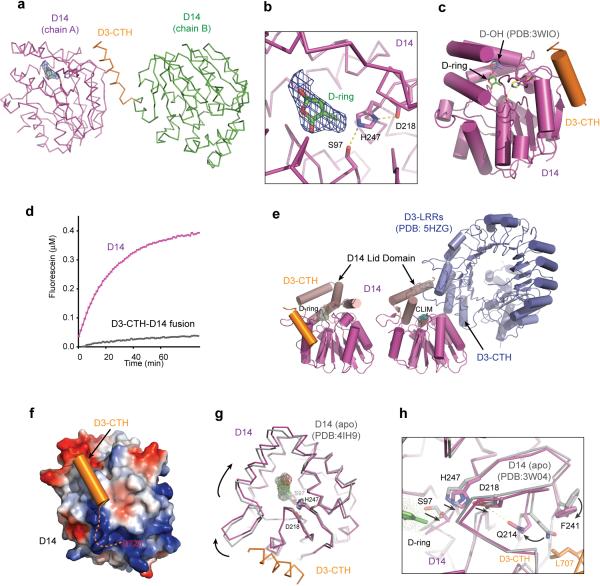
To map the binding mode of a D3 C-terminal peptide to GR24-bound D14, we crystallized and determined the structure of D14 that is N-terminally fused with a D3 C-terminal sequence in the presence of GR24. In the crystal, the D3 C-terminal sequence in one polypeptide chain acts in trans and interacts with D14 of a neighboring molecule, which contains an island of electron density near its catalytic triad (Extended Data Fig. 5a). Similar to its isolated form, D3-CTH-bound D14 adopts an open conformation, which is characterized by a solvent accessible substrate-binding pocket (Fig. 3a). The electron density inside the pocket matches the overall shape of the GR24 D-ring, although its position is different from where the GR24 degradation product, 5-hydroxy-3-methylbutenolide (D-OH), was previously found (Extended Data Fig. 5b-c)13,23. We tentatively assigned this density to the D-ring of an un-hydrolyzed hormone for several reasons. First of all, the crystallized D14 fusion polypeptide shows little enzymatic activity in hydrolyzing substrate (Extended Data Fig. 5d). Second, the electron density is extended beyond the D-ring, pointing towards the exit of the hormone-binding pocket. Third, the location of the D-ring predicts that the tricyclic ABC-rings are largely solvent exposed, which could explain their missing electron density. In comparison to the previously reported GR24-D14 structure14, the hormone is markedly removed from the catalytic center, instead of being poised for hydrolysis (Fig. 3b). Its relative position and orientation to the active site suggest that it is bound to the enzyme in a non-reactive configuration.
Figure 3. Structure of D3-CTH-D14-GR24 complex.
(a) Top view of D3-CTH (orange)-bound D14 (purple) with an open ligand-binding pocket. (b) Close-up view of the ligand-binding pocket of D3-CTH-bound D14 (magenta) superimposed with GR24-bound D14 (gray, PDB: 5DJ5). The catalytic triad of D14 are shown in sticks. A curved arrow indicates the removal of the GR24 D-ring away from the catalytic serine residue in the D3-CTH-bound D14. (c) Interface between D3-CTH (orange) and D14 (magenta) with interacting residues shown in sticks. (d) A comparison of the structural context of D3-CTH (orange) in the ASK1-D3 complex (crystal form 1, blue, left) and the D14-D3-CTH complex (magenta, right).
Upon binding to D14, the D3 CTH sequence adopts the same α-helical conformation as seen in its engaged form (Fig. 3a, 3d). Strikingly, it docks to a surface site on D14 that is opposite to where D3 binds in the AtD14-D3-ASK1 complex structure (Extended Data Fig. 5e). At one end of this interface, Glu700 clamps down the D3 α-helix to the hydrolase by making polar interactions with Ser224 and His133 on the D14 αE helix and β6-αT1 loop, respectively. At the other end, D3-CTH inserts Leu707 into a hydrophobic cleft formed between the αE helix and β8 strand of D14 (Fig. 3c). As a whole, the helical portion of the D3 C-terminal sequence buries a total of 800 Å2 surface area on D14. Interestingly, if the acidic C-terminus of D3-CTH were not fused to the N-terminus of the neighboring D14 molecule, it might be able to interact with a nearby basic D14 surface (Extended Data Fig. 5f).
Superposition analysis of free and D3-CTH-bound D14 reveals a slight rotation of the cap domain around the hormone-binding pocket, which could couple the docking of D3-CTH to the binding of the un-hydrolyzed hormone (Extended Data Fig. 5g). A closer comparison of all D14 structures also unveils a potential allosteric pathway linking D3-CTH binding to the D14 catalytic triad (Extended Data Fig. 5h). Importantly, D3-CTH uses several common residues to either bind D14 in its open conformation or engage with the rest of the LRR domain (Fig. 3d). The incompatibility of the two structures strongly suggests that D3-CTH binds D14 when it is dislodged from the LRR domain. Overall, the binding mode of the D3 C-terminal peptide to D14 reflects a functional state of SCFD3-D14 different from its CLIM-bound form.
Reactivation of D3-bound D14 by D53
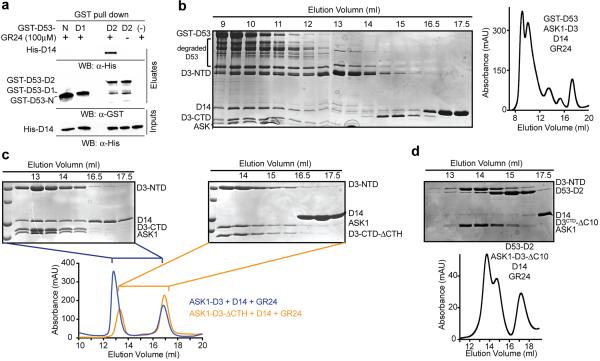
In an in vitro protein degradation system, we next reconstituted proteasome-mediated degradation of recombinant D53 with cell-free extracts prepared from Arabidopsis plant seedlings with Col-0 (Fig. 4a). In agreement with the essential role of the SCFD3/MAX2-D14 in D53 turnover, max2–1 extracts lack the D53-degrading activity, but can be rescued by addition of recombinant D3 and D14. Based on its sequence homology with the class I Clp ATPase family proteins, D53 is predicted to contain an N-terminal domain and two putative ATPase domains, D1 and D2. We purified each of these D53 domains fused to GST and found that the D53 D2 domain is solely responsible for binding D14 in a GR24-dependent manner (Extended Data Fig. 6a)16. Both full length D53 and its isolated D2 domain can form a stable complex with D14-D3-ASK1 in the presence of GR24 as detected by size exclusion chromatography (Fig. 4b, Extended Data Fig. 6b). Although previous studies have suggested that D14 and D3 can individually interact with D5315–17, we found that the D53 D2 domain becomes stably associated with D14 only in the presence of D3 and GR24. The three binding partners, therefore, assemble cooperatively into a ternary complex, which explains the degradation of recombinant D53 D2 domain by the proteasome in a MAX2 dependent manner (Fig. 4a). Together, these data pinpoint the D53 D2 domain as the functional module for hormone-induced and SCFD3-D14-catalyzed turnover.
Figure 4. Interactions among D3-CTH, D53, and D14.
(a) Time-dependent degradation of GST-D53 and GST-D53-D2 in Arabidopsis seedlings of Col-0 and max2–1 mutant extracts, and ± recombinant D14 and either D3 or D3ΔCTH. MG132: proteasome inhibitor. (b) Size-exclusion chromatography analysis of the interaction between D53-D2 and D14-GR24 ± ASK1-D3 with SDS–PAGE analysis of the elution fractions. (c) GST-pulldown assay using recombinant GST-D14 and non-tagged D53-D2 ± D3-CTH and/or GR24. (d) Kinetics of YLG hydrolysis by D14 in the presence of D3-CTH at increasing concentrations. All experiments repeated thrice.
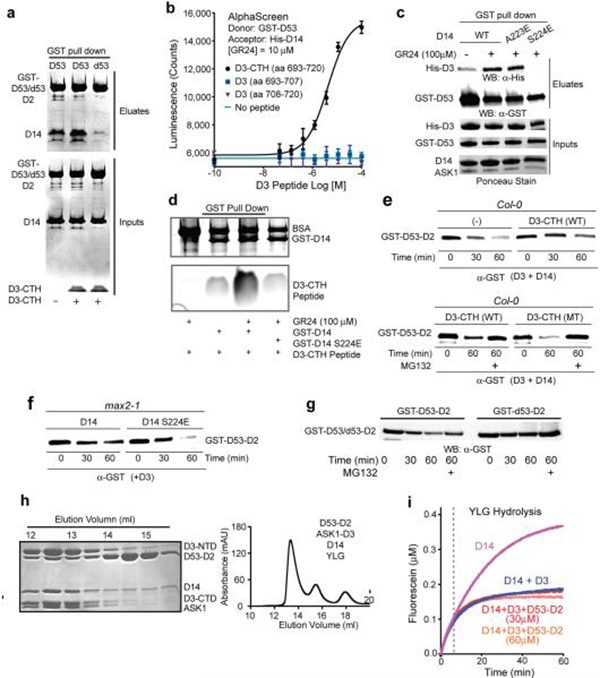
We next used the D53 D2 domain to probe the role of the D3 C-terminal region in D14-mediated substrate binding. In agreement with the ability of D3 to flip out its CTH without compromising its structural integrity, truncating the C-terminal 28 amino acids region had no detectable impact to the folding and solution behavior of D3 (Extended Data Fig. 6c). However, the C-terminally truncated D3 mutant protein could neither form a ternary complex with D14 and D53-D2 on a sizing column, nor restore the D53 degradation activity of the max2–1 extracts (Fig. 4a, Extended Data Fig. 4c, d), indicating a critical role of the D3 C-terminal region in substrate recruitment by SCFD3-D14. Remarkably, the isolated D3 C-terminal peptide was able to stimulate D14 and D53-D2 to pull down each other in the presence of GR24 (Fig. 4c, Extended Data Fig. 7a). In the more quantitative ALPHA assay, the D3 peptide, but not two shorter versions, elicited the same effect in a dose-dependent manner (Extended Data Fig. 7b). Mutation of a single D14 residue (S224E) at the interface revealed in our D3-CTH-D14 structure compromised D3-CTH-D14 binding and was sufficient to prevent GST-D53-D2 from pulling down D3 (Extended Data Fig. 7c, d). These data strongly suggest that the D3 C-terminal region helps recruit D53 when D3-CTH is liberated from the D3 LRR domain and becomes compatible for binding D14 with the canonical open conformation. The notion is further corroborated by the impaired D53 degradation observed with either the isolated D3-CTH peptide or the D14 S224E mutation in the cell-free extracts (Extended Data Fig. 7e, f). D53 was originally identified through the gain-of-function rice mutant, d53, whose gene product becomes resistant to SL-induced degradation due the loss of four amino acids in the D2 domain15,16. Accordingly, recombinant d53-D2 was unable to pull down D14 in the presence of D3-CTH and GR24 and remained stable in Col-0 cell extracts (Extended Data Fig. 7a, g). These results further support the functional relevance of the D3-CTH-mediated recruitment of D53 to SCFD3-D14.
Given the structural flexibility of D14, we next investigated the impact of substrate binding to the hydrolase activity of D14. Similar to GR24, YLG can induce complex assembly among D14, D3-ASK1, and the D53-D2 domain (Extended Data Fig. 7h). By monitoring YLG hydrolysis, we detected little change in the enzymatic kinetics of D3-ASK1-arrested D14 when the D53 D2 domain was present (Extended Data Fig. 7i). By contrast, addition of D53 robustly blocked the inhibition of the enzymatic activity of D14 by the D3 C-terminal peptide, both in the rapid initial reaction and the slow linear phase (Fig. 4d). Together with the aforementioned data, these results imply that the enzymatic activity of D14 within the SCF D3-D14 ubiquitin ligase complex is susceptible to modulation by D53 binding and such a modulatory effect is dependent on the conformational state of the CTH of the F-box protein.
SMXL7 levels are compromised by D3-CTH
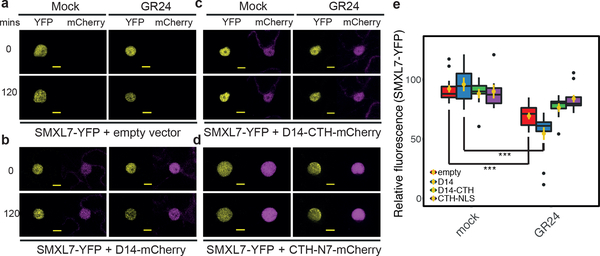
To further validate the role of D3-CTH in vivo, we expressed AtSMXL7-YFP alone or in combination with AtD14, AtD14-CTH, or CTH in tobacco epidermal cells. Despite the cross-species reactions, SMXL7 was markedly destabilized upon GR24 treatment (23% reduction, Fig. 5a, e), indicating that the endogenous tobacco SL perception machinery is sufficient to induce GR24-dependent AtSMXL7 degradation. In support of the functionality of AtD14 in tobacco epidermal cells, the above response was further accentuated in nuclei co-expressing AtD14-CTH-mCherry, reaching nearly 50% reduction in SMXL7 level at the end of incubation time (Fig. 5b, e). This enhancement effect, however, was completely eliminated and reversed to 11.8% and 6% reduction, when SMXL7-YFP was co-expressed with D14-CTH-mCherry or CTH-NLS-mCherry, respectively (Fig. 5c-e). The D3-CTH, therefore, not only prevented AtD14 from accelerating AtSMXL7 degradation, but also impaired the destabilization of AtSMXL7 by the endogenous SL signalling components in response to GR24 treatment.
Figure 5. SMXL7-GFP Stability in response to GR24 and D3-CTH expression.
(a)–(d) Representative images of SMXL7 levels in response to GR24 application in tobacco epidermal cells. Levels of SMXL7-YFP (yellow) at 0 and 120 minutes post treatment are shown for single nuclei co-expressing empty vector (a), D14-mCherry (b), D14-CTH-mCherry (c), or CTH-NLS-mCherry (d) – all displayed in magenta. bars = 10 μm. (e) Relative SMXL7 abundance at 2h post treatment comparing GR24 vs mock in cells expressing SMXL7-YFP alone or co-expressing SMXL7 and D14-mCherry, D14-CTH-mCherry or CTH-NLS-mCherry respectively. Yellow dots and bars are means ± sem (***: p < 0.001, n=7 [nuclei], two-tailed Student’s t-test, black dots: data > mean ± 3x s.d.). Coloured boxes represent central 50% of the distribution with median shown as a horizontal bar. Top and bottom vertical bars represent 75–100% and 0–25% data points, respectively. p values for empty vector, D14, D14-CTH, CTH-N7 are 1.294×10^−5, 7.188 ×10^−4, 4.401×10^−2, 3.86 ×10^−1 respectively.
A Model of SCF D3-D14 Functional States
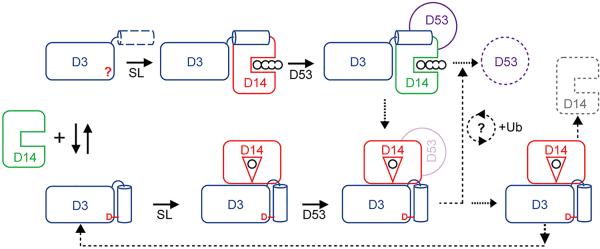
Our studies have uncovered a structural plasticity in the D3 F-box protein, which can adopt two distinct structural states by altering the topology of its CTH. With an engaged CTH, the F-box protein is structurally compatible for binding CLIM-bound D14 in its inactive closed conformation. When its CTH is unleashed from the LRR domain, D3 uses the helical structural element to capture hormone-bound D14 via a different interface. In this binding mode, the hydrolase maintains its open conformation, which allows its enzymatic activity to be tunable by the SCF E3 substrate, D53. We postulate that the plant SCF D3-D14 complex has evolved these unusual features to orchestrate SL sensing, substrate poly-ubiquitination, and hormone metabolism in a highly coordinated manner. To explain the activity of non-hydrolyzable SL agonists6,33–35, we propose that D14 perceives and transduces the hormonal signal in its open conformation, which is recognized by the D3-CTH and is competent for D53 binding (Extended Data Fig. 8, Supplementary Discussion). Before loading the SCF substrate, D3 arrests SL-bound D14 to prevent premature hydrolysis of the hormone. Hormone-dependent association of D53 with SCFD3-D14 not only triggers D53 poly-ubiquitination, but also licenses D14 to catalyze SL metabolism, which takes place while or after D53 is fully modified by a ubiquitin chain. A more detailed quantitative understanding of the timing of SL hydrolysis and poly-ubiquitin chain assembly on a substrate awaits further studies.
METHODS
Protein preparation and purification
The full-length rice D3 (O. sativa) and A. thaliana ASK1 were co-expressed as a 6xHis-2xMsb (msyB)36 fusion protein, and an untagged protein, respectively, in Hi5 suspension insect cells (denoted His-ASK1D3). The ASK1-D3 complex was isolated from the soluble cell lysate by Q Sepharose High Preformance resin (GE healthcare). 500 mM NaCl eluates were subjected to Nickel Sepharose Fast Flow (GE healthcare) and were eluted with 250 mM imidazole. To remove 6xHis-2xMsb-fusion tag, the clarified complex was cleaved at 4 °C for 16 hours by TEV (tobacco etch virus) protease, and was further purified by anion exchange and gel filtration chromatography. For crystallization and biochemical analysis purposes, the D3-expressing construct was designed to eliminate a non-conserved 40 residues disordered loop between amino acid 476–514 after affinity purification. The resulting D3 fusion protein contains an H6–2xMsb tag at the N terminus and three TEV protease sites: between the Msb tag and D3, after T476, and before L514, yielding a purified split form of D3 with D3-NTD (1–476) and CTD (514–720) stably associated (Extended Data Fig. 2 and 3). D3ΔCTH (O. sativa, residues 1–693) was co-expressed with ASK1 and purified in the same manner as full-length D3. Purified ASK1-D3 and ASK1-D3ΔCTH complexes were independently eluted as a single mono-dispersive peak off a Superdex-200 gel filtration column (GE healthcare) with an estimated molecular weight of 93 kD or 90 kDa, respectively. The D3ΔC10 construct, which lacks the C-terminal 10 amino acids, was also purified using a similar procedure. Rice D14 protein (O. sativa, residues 52–318) was expressed as a 6× His-SUMO fusion protein from the expression vector pSUMO (LifeSensors, and a gift from Dr. Eric Xu). BL21 (DE3) cells transformed with the expression plasmid were grown in LB broth at 16 °C to an OD600 of ∼1.0 and induced with 0.1 mM IPTG for 16 h. Cells were harvested, re-suspended and lysed in extract buffer (20 mM Tris, pH 8.0, 200 mM NaCl). His-SUMO-D14 was isolated from soluble cell lysate by Ni-NTA resin. The eluted His-SUMO D14 was subjected to anion-exchange and the eluted His-SUMO-D14 was cleaved overnight with SUMO protease (Ulp1, LifeSensors) at a protease/protein ratio of 1:1,000 at 4 °C. The cleaved His-SUMO tag was removed by passing through a Nickel Sepharose, and the protein was further purified by chromatography through a Superdex-200 gel filtration column in 20 mM Tris, pH 8.0, 200 mM NaCl, 2 mM DTT. Full length D53 (O. sativa) was expressed as a GST fusion protein in Hi5 suspension insect cells. D14 (O. sativa, residues 52–318), D3-CTH (O. sativa, residues 693–720), D53 N domain (D53-N, 1–181), D53 D1 domain (D53-D1, 182–406), D53 D2 domain (D53-D2, 718–1,131), and d53D2 mutant (F811T followed by 812–818 deletion as previously described15,16) were expressed as GST fusion proteins in BL21 (DE3) cells. GST-tagged proteins were isolated by glutathione sepharose (GE Healthcare) using a buffer containing 50 mM Tris-HCl, pH=7.5, 200 mM NaCl, 4% Glycerol, 5 mM DTT. Proteins were further purified by either elution with 5–8 mM glutathione (Fisher BioReagents), or on-column cleavage by TEV, followed by anion exchange and size exclusion chromatography. All proteins were concentrated by ultrafiltration to 3–10 mg/mL−1.
Crystallization, data collection and structure determination
The crystals of ASK1-D3 form 1 complex were grown at 4 °C by the hanging-drop vapor diffusion method with 1.0 μL protein complex sample mixed with an equal volume of reservoir solution containing 6.5% CP-42; 175 mM Sodium Citrate tribasic dihydrate; 87 mM HEPES sodium pH 7.5; 26% MPD. Crystals of maximal sizes were obtained and harvested after 2 weeks. The heavy atom derivative ASK1-D3 form 1 crystals were prepared by soaking the native crystals in the presence of 10 mM K2Pt(NO2)4 for 4 hours. The crystals of ASK1-D3 form 2 complex were grown at 25 °C by the hanging-drop vapor diffusion method with 1.0 μL protein complex sample mixed with an equal volume of reservoir solution containing 80 mM Tris-HCl, pH 7.0, 24% MPD, 24% PEG1000, 24% P3350; 15 mM Sodium Citrate tribasic dihydrate pH 5.6; 0.5 M 1,6-Hexanediol. The crystals of ASK1-D3 form 3 complex were grown at 25 °C by the hanging-drop vapor diffusion method with 2.0 μL protein complex sample mixed with an equal volume of reservoir solution containing 150 mM Tris-HCL, pH 7.4, 22% MPD, 22% PEG1000, 22% P3350, 15 mM Sodium Citrate tribasic dihydrate pH 5.6, 0.45 M 1,6-Hexanediol, 5 mM DTT. The crystals of D14-D3-CTH were grown at 4 °C by the hanging-drop vapor diffusion method with 1.0 μL protein complex sample mixed with an equal volume of reservoir solution containing 0.02 M amino acid mixture (Glu, Ala, Gly, Lys, and Ser); imidazole; 0.1 M MES monohydrate, pH 6.5, 40% glycerol, 20% PEG4000. The single anomalous dispersion (SAD) data set was collected near the platinum absorption edge (λ = 1.072 Å). X-ray diffraction data were integrated and scaled with HKL2000 package37. SAD was used to determine the initial phase using PHENIX38 with a 2.5 Å platinum derivative data set ASK1-D3 form 1. Initial structural models were built, refined and rebuilt using COOT39 and PHENIX. The final model was built and refined with a native data set. The crystals of ASK1-D3 form 2 and form 3 complexes were determined by molecular replacement using ASK1-D3 form 1 structure as the search model. The D14-D3-CTH structure was determined by molecular replacement using rice D14 structure (PDB: 4IH9)23 as the search model. All structural models were manually built, refined, and rebuilt with PHENIX and COOT.
AlphaScreen luminescence proximity assay
AlphaScreen assay for determining and measuring protein-protein interactions were performed using EnSpire reader (PerkinElmer). GST-tagged D53 or D14 was attached to glutathione AlphaScreen donor beads. His-tagged D14 or D3 was attached to anti-6xHis conjugated AlphaScreen acceptor beads. The donor and acceptor beads were brought into proximity by the interactions between D14, D53, and ASK1-D3 complex, which were measured with and without GR24 and/or non-tagged proteins at indicated concentrations. When excited by a laser beam of 680 nm, the donor beads emit singlet oxygen that activates thioxene derivatives in the acceptor beads, which then release photons of 520–620 nm as the binding signal. The experiments were conducted with 100–500 nM of D14 or D53 and 1 μM ASK1-D3 complex proteins in the presence of 5 μg/ml donor and acceptor beads in a buffer of 50 mM MES, pH 6.5, 150 mM NaCl, 1 mM DTT and 0.1 mg/ml Bovine Serum Albumin. The results were based on an average of three experiments with standard errors typically < 10% of the measurements. IC50 values were determined using non-linear curve fitting of graphs generated with Prism 6 (GraphPad).
YLG hydrolysis assay
Yoshimulactone Green (YLG, TCI America) hydrolysis assays were performed using 1–2 μg of recombinant proteins in a reaction buffer (50 mM MES pH 6.5, 150 mM NaCl, 1 mM DTT) at a 100 μL volume on a 96-well black plate (Greiner). The fluorescent intensity was measured by EnSpire 2300 multilabel plate reader (PerkinElmer) at excitation by 480 nm and detection by 520 nm. 96 well black ½ area plates were covered with Viewdrop III UV plate seal to prevent evaporation. Time-course experiments were performed in 10 seconds-intervals over 50–60 minutes. Fluorescent data was converted directly to fluorescein concentration using a standard curve. Data generated in Excel was transferred to Prism 6 for graphical analysis and curve fitting. In all cases where synthesized peptides (Genscript and Biomatik) were analyzed, dimethylsulfoxide (DMSO) was added in equivalent concentration into the reaction.
Size exclusion chromatography
Purified proteins (20–50 μM) were incubated with 100–200 μM GR24 (Chiralix), or equal amount of acetone as the solvent control, at 4°C for one hour in 20 mM HEPES, pH 7.0, 150 mM NaCl, 2 mM DTT. The reaction was injected onto Superdex-200 Increase 10/300 column (GE Healthcare) for analysis at a flow rate of 0.5 mL min−1. The elution fractions (0.5 ml/fraction) were resolved by SDS-PAGE and analyzed by Coomassie Brilliant Blue G-250 stain.
Limited proteolytic digestion
1 mg/ml of purified ASK1- D3 (or D3ΔCTH) was incubated at 4 °C for 12 hours with increasing amount of trypsin solution containing 0.05 mg ml−1 trypsin (Agilent) at the volume ratio of 1:3000, 1:1500, 1:750 in 40 mM Tris-HCl, pH 7.5, 1 mM DTT. The proteolysis reactions were stopped by 5-fold concentrated SDS–PAGE sample buffer immediately followed by 5 minutes boiling at 95 °C. Proteins were resolved by SDS–PAGE and Coomassie Brilliant Blue G-250 stain. The resolved bends corresponding to ASK1 and digested D3-CTD were excised and further analyzed by N-terminal sequencing (Analytical Core Facility, Tufts Medical School).
Affinity pulldown assay
Pull-down assay was preformed using ~20–40 μg of purified GST-tagged proteins as the bait and ~ 10–25 μg of either His tagged or no-tagged proteins. Reaction mixtures were incubated with GST beads (GE Healthcare) at 4 °C for 30 minutes in the reaction buffer with 40 mM Tris-HCl, pH 7, 100 mM NaCl 2 mM DTT, 0.01 % Bovine Serum Albumin. After extensive wash with a buffer containing 40 mM Tris-HCl, pH 7, 250 mM NaCl, 2 mM DTT, and 0.01% (v/v) Tween 20, the protein complexes on the beads were either eluted by 5-fold concentrated SDS–PAGE sample buffer or by 5 mM glutathione. All samples were boiled at 95 °C for 5 minutes and resolved by SDS-PAGE. Proteins were analyzed as indicated by Ponceau stain or Western blot analysis using specific polyclonal anti-GST antibody and monoclonal anti-His antibody (Sigma). In pull-down assays in the presence or absence of 20–100 μM GR24, acetone was used as solvent control. Inputs samples represent 5–10% of the total reaction.
D53 stability in a reconstituted cell-free system
Arabidopsis ecotype Columbia-0 (Col-0) wild type and max2–1 mutant seeds were surface-sterilized with 50% (v/v) bleach and 0.1% Triton X-100. After cold treatment at 4 °C for 48 h, seeds were germinated and grown on 0.5× Murashige and Skoog (MS) medium containing 0.8% agar and 1% sucrose under continuous light at 22 °C. 100 mg of 7-day-old seedling were collected and frozen in liquid nitrogen. Total proteins were extracted following grinding with native protein extraction kit (Minute™, Invent Biotechnologies) supplemented with protease inhibitor cocktail (Roche) and followed by two sequential centrifugations at 12,000 g for 10 minutes. To monitor protein degradation in cell-free system, 0.5 μg of purified GST-tagged proteins (either full-length D53, D53-D2 or d53-D2, as indicated) were incubated at 22 °C in a reaction mixture contained at final volume of 12.5 μL: 1–2 μL of plant extract supplemented with 10 μM GR24, 25 mM Tris-HCl, pH 7.4, 0.625 mM ATP, 5 mM MgCl2, 0.5 mM DTT. When indicated, the proteasome inhibitor MG132 (Calbiochem) was added in a concentration of 100 μM. Reactions were terminated at the indicated times by the addition of 5-fold concentrated sample buffer. Boiled samples were resolved via SDS-PAGE, and proteins were visualized using Western blot and polyclonal anti-GST antibodies (Sigma).
Plant growth conditions
Nicotiana benthamiana plants were grown on F2 compost (Levington Horticulture, Ipswich) pre-treated with 0.2 g L-1 Intercept (Everris Ltd, Ipswich). Glasshouse conditions as follows: 16 hours light/8h darkness, minimum irradiance 88 W m-2, shading implemented at 500 W/m2 and cooling implemented at 31 Celsius degrees or above. Humidity and temperature according to ambient conditions.
Cloning and plant transformation
All constructs were cloned using Multi-site Gateway (Invitrogen). Previously generated CaMV 35S promoter and SMXL7-YFP expression vector were used32. D14, D14-CTH and CTH-NSL sequences were synthetized and cloned into pDONR221. The mCherry and YFP fluorescent tags were cloned into the pDONR P2-P3R and all ENTRY vectors were then recombined in the relevant combinations in pH7m24GW (http://gateway.psb.ugent.be/). Agrobacterium tumefaciens strain GV3101 was transformed using standard electroporation procedure.
Agrobacterium tumefaciens-mediated transient gene expression assays in N. benthamiana
Agrobacterium tumefaciens (strain GV3101) carrying the desired T-DNA construct was grown overnight at 28°C with the appropriate antibiotics. Cells were harvested by centrifugation at 8000 g and resuspended in agro-infiltration media with 5 mM MES, 10 mM MgCl2, pH 5.6, prior to syringe infiltration into leaves of 3–4 week-old N. benthamiana plants. Bacteria carrying each construct were infiltrated at a final OD600nm of 0.4. Leaves were detached 48 hours post infiltration for confocal imaging.
Confocal microscopy
All confocal images were captured on a Leica SP8 laser scanning confocal using a W Plan-Apochromat 20× 1.0 numerical aperture objective (Zeiss, Jena, Germany). Detection wavelengths: 520–540 for SMXL7-YFP, and 600–620 for mCherry-tagged proteins. The pinhole was set to one airy unit for all nuclei. Detection gain and laser power were kept constant between t1 and t0 for intensity comparison and the same settings were used for all nuclei of the same construct combination. Laser power was adjusted across construct combinations as necessary to account for expression level differences and avoid signal saturation.
SMXL7 quantification
2 days post infiltration leaves were infiltrated with Arabidopsis thaliana Salt (ATS) with 0.1% v/v acetone for the mock or 10 μM GR24, 0.1 % v/v acetone for the treated samples. 7–13 nuclei expressing 35S:SMLX7-YFP alone or in combination with either 35S:D14-mCherry, 35:D14-CTH-mCherry or 35:CTH-NLS-mCherry were located and imaged at time 0. The same nuclei were then imaged again using identical settings after 120 minutes for each construct combination/treatment. Areas of interest were drawn around each nucleus in ImageJ version 2.0.0 and the mean signal intensity was recorded. The ratio of the means at 0 minute and 120 minutes post treatment was used to compute relative fluorescence at t1, which is expressed as percentage of SMXL7 level change. Distributions for each combination/treatment conditions were compared using a two-tailed Student’s t-test with Bonferroni correction.
Data Availability Statement
Structural coordinates and structural factors have been deposited in the Protein Data Bank under accession numbers 6BRO, 6BRP, 6BRQ, and 6BRT. Uncropped gels and blots are displayed under Supplementary Information. All other data are available from the corresponding author upon reasonable request.
Extended Data
Extended Data Figure 1. Conservation and conformation of D3 C-terminal 𝛂-helix.
(a) Sequence alignment of the C-terminal regions of 14 MAX2/D3 orthologs. Highly conserved residues are colored in blue. (b) Electrostatic potential surface map of D3 with CTH shown in cartoon representation (orange). The C-terminus aspartic acid residue, Asp720, is anchored to a positively charged pocket. (c) Close-up view of the D3 extreme C-terminal residue, Asp720, and its interacting residues in D3 and ASK1. (d) Electron densities of the D3-CTH region in two different crystal forms, adopting either a regular helical conformation (left) or an extended conformation (right).
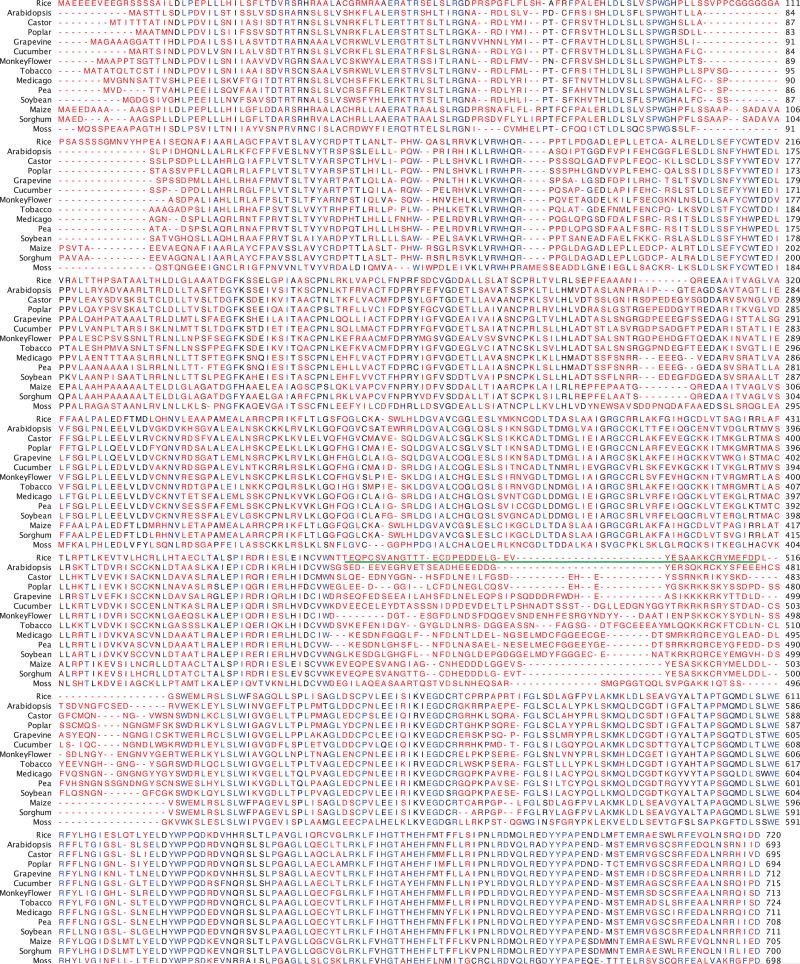
Extended Data Figure 2. Sequence alignment and analysis of selected D3/MAX2 orthologs.
D3/MAX2 orthologs are selected and aligned from rice (XP_015643693), Arabidopsis (NP_565979), Castor (XP_002428551), Poplar (XP_002320412), Grapevine (XP_003607592), Cucumber (XP_004137031), MonkeyFlower (XP_012832933), Tobacco (XP_009757168), Meidcago (XP_003607592), Pea (ABD67495), Soybean (XP_003540983), Maize (XP_020394883), Sorghum (XP_002436499), and Moss (XP_024400746). The non-conserved region designed to be truncated by TEV cleavage during recombinant D3 purification is underlined in green..
Extended Data Figure 3. Comparison of D3-ASK1 structures.
(a) Top view of ASK1-D3 crystal structure (orange) based on PDB: 5HYW. Red arrows indicate a gap in the polypeptide model. NOTE: 5HYW has a polypeptide register error ranging from amino acid 373 to 473 before the gap. (b) Superposition of ASK1-D3 determined in this study (light blue) with PDB: 5HYW. The region truncated by design ranges from N474 to L516, which are indicated by red arrows. (c) Superposition of all three crystal forms of ASK1-D3 determined in the current study. (d) Limited trypsin digestion assay of ASK1-D3 and ASK1-D3 with CTH deletion (ΔCTH). Proteins were resolved by SDS PAGE followed by Coomassie stain focusing on D3 C-terminal domain (CTD). Experiment repeated thrice.
Extended Data Figure 4. Established binding between D3 and D14.
(a) AlphaScreen assay measuring direct interaction between GST-D14 and His-D3 in response to increasing amounts of GR24 (mean ± s.d. of biological triplicates). (b) The binding interface between CLIM-bound D14 (magenta) and the D3 LRR domain (blue) (PDB: 5HZG). The last four LRRs are labeled and D3-CTH in LRR20 is colored in orange.
Extended Data Figure 5. Structural Analysis of D3-CTH-D14-GR24 complex.
(a) Packing of two D14 molecules N-terminally fused with D3-CTH. The D3-CTH region in Chain A is omitted. The GR24 D-ring (sticks) is shown together with the surround 2Fo-Fc electron density map calculated before the compound modeled in and contoured at 0.8σ. (b) A close-up view of the GR24 D-ring (sticks, green) and its electron density calculated as in (a). (c) Overall structure of D3-CTH (orange)-bound D14 (magenta) with a GR24 D-ring (sticks, green). The GR24 hydrolysis product, D-OH (sticks, cyan), revealed in the D14-D-OH structure (PDB: 3WIO) is shown based on superposition analysis. (d) Kinetics of YLG hydrolysis by free and D3-CTH-fused D14 (repeated thrice). (e) Comparison of the interface D14 (magenta and brown) makes upon binding to D3-CTH (orange) vs. ASK1-D3 (blue). The lid domain (brown) of D14 adopts open and closed conformation upon binding to D3-CTH and ASK1-D3, respectively. (f) Electrostatic potential surface map of D14 with D3-CTH (orange) bound. Dashed line indicates the otherwise free C-terminal region of D3 if D3-CTH were not fused to another copy of D14 in the crystal. (g) Conformational changes in the D14 lid domain induced by D3-CTH binding as revealed by superposition analysis between D3-CTH-bound (magenta) and apo D14 (grey, PDB: 4IH9). Arrows indicate the rotation of the D14 lid domain induced by D3-CTH (orange) relative to the catalytic triad shown in sticks. (h) Superposition analysis of D3-CTH-bound and apo D14 (PDB: 3W04) highlighting a possible allosteric pathway connecting Leu707 of D3-CTH to the catalytic triad of D14. Arrows indicate conformational changes within D14 induced by D3-CTH binding.
Extended Data Figure 6. The D3-D14-D53 complex formation is mediated by D53-D2 domain.
(a) Pull-down assay using recombinant ASK1-D3, His-D14, and GST-tagged D53-N, D53-D1 or D53-D2 domains. (b-d) Size-exclusion chromatography analyses of the interaction between: full-length GST-D53, D14-GR24 and ASK1-D3 (b), D14-GR24 and either ASK1-D3 or ASK1-D3ΔCTH (c), D14-GR24, D53D2 with ASK1-D3ΔCTH (d). All gels were resolved by SDS-PAGE and analyzed by Western blot using anti-GST and anti-HIS antibodies (as indicated under a) or Coomassie staining (b-d). All experiments (a-d) were repeated independently at least three times.
Extended Data Figure 7. D3-CTH facilitates D53-D2 binding to D14-D3.
(a) GST-pulldown assay using wither GST-D53-D2 or GST-d53-D2 mutant with non-tagged D14 in the presence or absence of D3-CTH as indicated. (b) AlphaScreen data showing the ability of D3-CTH peptide (28aa, D3693–720) to promote D53-D2-D14 interaction in a dose-dependent manner; D3693–707 (15aa) and D3708–720 (13aa) peptides did not stimulate binding. DMSO [denoted (−) peptide] serve as control (data are means ± s.d. of biological triplicates). (c) GST-pulldown using recombinant GST-D53-D2 and His-D3-ASK1 in the presence of recombinant D14-WT, D14-A223E, D14-S224E and GR24 as indicated. (d) GST pull down in the presence of D3-CTH peptide with or without GR24 and in the presence of GST-D14 WT or GST-D14 S224E. BSA was used in the assay to prevent non-specific interactions. MG132 was added as indicated. Proteins were resolved via SDS-PAGE and were visualized by Coomassie or Western-blot using anti-GST antibodies. The D3-CTH peptide contains four amino acid mutations, which were designed to disrupt the D14-D3-CTH interface: E700R, L707R, D719R, and D720R. (e, f) Degradation of GST-D53-D2 in Col-0 (e) or max2–1 (f) Arabidopsis thaliana cell-free extract system. GST-D53-D2 was resolved at the indicated time in the presence or absence of the wild type (WT) D3-CTH peptide (e, upper panel) or a mutant (MT) (e, lower panel), and in the presence of D3 and either D14 WT or S224E mutant (f). (g) Time-dependent degradation of GST-D53-D2 and GST-d53-D2 mutant in Arabidopsis seedlings of Col-0 extracts. Proteins were resolved by SDS-PAGE and analyzed by Western blot using anti-GST antibody. MG132 indicates the addition of proteasome inhibitor. (h) Size-exclusion chromatography analysis of complex formation among D53-D2, ASK1-D3, and D14 in the presence of YLG. (i) Kinetics of YLG hydrolysis by D14 in the presence of ASK1-D3 and D53-D2 at two concentrations. Gels were resolved by SDS-PAGE and analyzed by Western blot using anti-GST and anti-HIS antibodies as indicated under c, e-g. All experiments were repeated independently at least three times.
Extended Data Figure 8. A model for SL perception and signaling.
A model of the activity cycle underlying SL-induced and SCF D3-D14 mediated D53 poly-ubiquitination. D3 adopts two conformational states with a structurally variable C-terminal α-helix (left). With a dislodged CTH, D3 binds and inhibits D14 in its open conformation, until D53 is loaded (upper). D53 binding re-activates D14, which can hydrolyze SLs after or while D53 is poly-ubiquitinated. SL hydrolysis intermediate then stabilizes the closed conformation of D14, which converts D3-CTH into its engaged form. The resulting complex can ubiquitinate D14 and feed D3 back to the activity cycle (right). CLIM-bound D14 might participate in D53 poly-ubiquitination or in an alternative path (lower). It remains unknown how many SL molecules are hydrolyzed during the poly-ubiquitination of each D53 molecule.
Extended Data Table 1. Data collection and refinement statistics.
Table describing data collection, phasing, and refinement statistics of ASK1-D3 crystals in three forms and D3-CTH-D14-GR24 crystals. Values in parentheses are for the highest resolution shell.
| ASK1-D3 (form 1) |
ASK1-D3 (form 2) | ASK1-D3 (form 3) | D3-CTH-D14-GR24 | ||
|---|---|---|---|---|---|
| Native | K2Pt(NO2)4 | ||||
| Data collection | |||||
| Space group | C2 | C2 | P21 | P21 | P65 |
| Cell dimensions | |||||
| a, b, c (Å) | 233.7 79.7 153.4 | 237.4 79.8 151.7 | 79.4 130.4 94.3 | 77.9 113.3 92.8 | 183.8 183.8 153.6 |
| α, β, γ (°) | 90 128.6 90 | 90 129.7 90 | 90 99.4 90 | 90 99 90 | 90 90 120 |
| Resolution (Å) | 50.00–2.50 (2.54–2.50) | 50.00–2.50 (2.54–2.50) | 50.00–2.40 (2.49–2.40) | 50.00–3.00 (3.05–3.00) | 50.00–2.40 (2.44–2.40) |
| Rsym | 0.126 (0.403) | 0.128 (0.539) | 0.179 (0.939) | 0.129(0.658) | 0.172(0.699) |
| I/ σI | 35.5 (2.0) | 63.7 (2.0) | 26.4 (3.0) | 39(1.3) | 60.1 (2.5) |
| Completeness (%) | 98.8 (88.4) | 95.9 (71.6) | 98.9 (97.8) | 96.6 (97.8) | 100 (99.8) |
| Redundancy | 4.7 (3.6) | 8.1 (6.3) | 7.2 (5.6) | 3.7 (3.5) | 11.7(8.9) |
| Refinement | |||||
| Resolution (Å) | 2.50 | 2.40 | 3.00 | 2.40 | |
| No. reflections | 75577 | 73464 | 31050 | 115753 | |
| Rwork/Rfree (%) | 20.0/22.5 | 19.2/21.8 | 22.0/25.6 | 24.8/30.0 | |
| No. atoms | 11832 | 12231 | 10771 | 17166 | |
| Protein | 11366 | 11737 | 10771 | 16607 | |
| Ligand/ion | 0 | 0 | 0 | 8 | |
| Water | 466 | 494 | 0 | 551 | |
| B-factors | |||||
| Protein | 39.3 | 35.5 | 65.6 | 32.4 | |
| Ligand/ion | N/A | N/A | N/A | 38.6 | |
| Water | 34.9 | 31.9 | N/A | 24.1 | |
| R.m.s. deviations | |||||
| Bond lengths (Á) | 0.010 | 0.010 | 0.008 | 0.011 | |
| Bond angles (°) | 1.48 | 1.40 | 1.31 | 1.27 | |
| Ramachandran favored (%) | 97.9 | 98.5 | 96.5 | 96.0 | |
| Ramachandran allowed (%) | 2.1 | 1.5 | 3.5 | 4.0 | |
| Ramachandran outliers (%) | 0 | 0 | 0 | 0 | |
| PDB ID | 6BRO | 6BRP | 6BRQ | 6BRT | |
Supplementary Material
Acknowledgements.
We thank the beamline staff at ALS and APS for help with data collection, Jennifer Nemhauser for Arabidopsis seeds, members of the Zheng and Wenqing Xu laboratories for discussion and help. This work is dedicated to Laura Sheard and is supported by the Howard Hughes Medical Institute (N. Z.), the Gatsby Charitable Foundation (GAT3272C, O. L.), and the European Research Council (294514-EnCoDe, O. L.).
Footnotes
Author Information. Structural coordinates and structural factors have been deposited in the Protein Data Bank under accession numbers 6BRO, 6BRP, 6BRQ, and 6BRT..
Authors declare no financial interest.
References
- 1.Al-Babili S & Bouwmeester HJ Strigolactones, a novel carotenoid-derived plant hormone. Annu Rev Plant Biol 66, 161–186, doi:10.1146/annurev-arplant-043014-114759 (2015). [DOI] [PubMed] [Google Scholar]
- 2.Waters MT, Gutjahr C, Bennett T & Nelson DC Strigolactone Signaling and Evolution. Annu Rev Plant Biol 68, 291–322, doi:10.1146/annurev-arplant-042916-040925 (2017). [DOI] [PubMed] [Google Scholar]
- 3.Gomez-Roldan V et al. Strigolactone inhibition of shoot branching. Nature 455, 189–194, doi:10.1038/nature07271 (2008). [DOI] [PubMed] [Google Scholar]
- 4.Akiyama K, Matsuzaki K & Hayashi H Plant sesquiterpenes induce hyphal branching in arbuscular mycorrhizal fungi. Nature 435, 824–827, doi:10.1038/nature03608 (2005). [DOI] [PubMed] [Google Scholar]
- 5.Cook CE, Whichard LP, Turner B, Wall ME & Egley GH Germination of Witchweed (Striga lutea Lour.): Isolation and Properties of a Potent Stimulant. Science 154, 1189–1190, doi:10.1126/science.154.3753.1189 (1966). [DOI] [PubMed] [Google Scholar]
- 6.Toh S et al. Structure-function analysis identifies highly sensitive strigolactone receptors in Striga. Science 350, 203–207, doi:10.1126/science.aac9476 (2015). [DOI] [PubMed] [Google Scholar]
- 7.Tsuchiya Y et al. PARASITIC PLANTS. Probing strigolactone receptors in Striga hermonthica with fluorescence. Science 349, 864–868, doi:10.1126/science.aab3831 (2015). [DOI] [PubMed] [Google Scholar]
- 8.Conn CE et al. PLANT EVOLUTION. Convergent evolution of strigolactone perception enabled host detection in parasitic plants. Science 349, 540–543, doi:10.1126/science.aab1140 (2015). [DOI] [PubMed] [Google Scholar]
- 9.Xie X et al. Confirming stereochemical structures of strigolactones produced by rice and tobacco. Mol Plant 6, 153–163, doi:10.1093/mp/sss139 (2013). [DOI] [PMC free article] [PubMed] [Google Scholar]
- 10.Zwanenburg B, Mwakaboko AS, Reizelman A, Anilkumar G & Sethumadhavan D Structure and function of natural and synthetic signalling molecules in parasitic weed germination. Pest Manag Sci 65, 478–491, doi:10.1002/ps.1706 (2009). [DOI] [PubMed] [Google Scholar]
- 11.Akiyama K, Ogasawara S, Ito S & Hayashi H Structural requirements of strigolactones for hyphal branching in AM fungi. Plant Cell Physiol 51, 1104–1117, doi:10.1093/pcp/pcq058 (2010). [DOI] [PMC free article] [PubMed] [Google Scholar]
- 12.Hamiaux C et al. DAD2 is an alpha/beta hydrolase likely to be involved in the perception of the plant branching hormone, strigolactone. Curr Biol 22, 2032–2036, doi:10.1016/j.cub.2012.08.007 (2012). [DOI] [PubMed] [Google Scholar]
- 13.Nakamura H et al. Molecular mechanism of strigolactone perception by DWARF14. Nat Commun 4, 2613, doi:10.1038/ncomms3613 (2013). [DOI] [PubMed] [Google Scholar]
- 14.Zhao LH et al. Destabilization of strigolactone receptor DWARF14 by binding of ligand and E3-ligase signaling effector DWARF3. Cell Res 25, 1219–1236, doi:10.1038/cr.2015.122 (2015). [DOI] [PMC free article] [PubMed] [Google Scholar]
- 15.Jiang L et al. DWARF 53 acts as a repressor of strigolactone signalling in rice. Nature 504, 401–405, doi:10.1038/nature12870 (2013). [DOI] [PMC free article] [PubMed] [Google Scholar]
- 16.Zhou F et al. D14-SCF(D3)-dependent degradation of D53 regulates strigolactone signalling. Nature 504, 406–410, doi:10.1038/nature12878 (2013). [DOI] [PMC free article] [PubMed] [Google Scholar]
- 17.Wang L et al. Strigolactone Signaling in Arabidopsis Regulates Shoot Development by Targeting D53-Like SMXL Repressor Proteins for Ubiquitination and Degradation. Plant Cell 27, 3128–3142, doi:10.1105/tpc.15.00605 (2015). [DOI] [PMC free article] [PubMed] [Google Scholar]
- 18.Nelson DC et al. F-box protein MAX2 has dual roles in karrikin and strigolactone signaling in Arabidopsis thaliana. Proc Natl Acad Sci U S A 108, 8897–8902, doi:10.1073/pnas.1100987108 (2011). [DOI] [PMC free article] [PubMed] [Google Scholar]
- 19.Arite T et al. d14, a strigolactone-insensitive mutant of rice, shows an accelerated outgrowth of tillers. Plant Cell Physiol 50, 1416–1424, doi:10.1093/pcp/pcp091 (2009). [DOI] [PubMed] [Google Scholar]
- 20.Stirnberg P, Furner IJ & Ottoline Leyser HM MAX2 participates in an SCF complex which acts locally at the node to suppress shoot branching. Plant J 50, 80–94, doi:10.1111/j.1365-313X.2007.03032.x (2007). [DOI] [PubMed] [Google Scholar]
- 21.Beveridge CA & Kyozuka J New genes in the strigolactone-related shoot branching pathway. Curr Opin Plant Biol 13, 34–39, doi:10.1016/j.pbi.2009.10.003 (2010). [DOI] [PubMed] [Google Scholar]
- 22.Soundappan I et al. SMAX1-LIKE/D53 Family Members Enable Distinct MAX2-Dependent Responses to Strigolactones and Karrikins in Arabidopsis. Plant Cell 27, 3143–3159, doi:10.1105/tpc.15.00562 (2015). [DOI] [PMC free article] [PubMed] [Google Scholar]
- 23.Zhao LH et al. Crystal structures of two phytohormone signal-transducing alpha/beta hydrolases: karrikin-signaling KAI2 and strigolactone-signaling DWARF14. Cell Res 23, 436–439, doi:10.1038/cr.2013.19 (2013). [DOI] [PMC free article] [PubMed] [Google Scholar]
- 24.Zheng N & Shabek N Ubiquitin Ligases: Structure, Function, and Regulation. Annual review of biochemistry 86, 129–157, doi:10.1146/annurev-biochem-060815-014922 (2017). [DOI] [PubMed] [Google Scholar]
- 25.Liang Y, Ward S, Li P, Bennett T & Leyser O SMAX1-LIKE7 Signals from the Nucleus to Regulate Shoot Development in Arabidopsis via Partially EAR Motif-Independent Mechanisms. Plant Cell 28, 1581–1601, doi:10.1105/tpc.16.00286 (2016). [DOI] [PMC free article] [PubMed] [Google Scholar]
- 26.Song X et al. IPA1 functions as a downstream transcription factor repressed by D53 in strigolactone signaling in rice. Cell Res 27, 1128–1141, doi:10.1038/cr.2017.102 (2017). [DOI] [PMC free article] [PubMed] [Google Scholar]
- 27.Stanga JP, Smith SM, Briggs WR & Nelson DC SUPPRESSOR OF MORE AXILLARY GROWTH2 1 controls seed germination and seedling development in Arabidopsis. Plant Physiol 163, 318–330, doi:10.1104/pp.113.221259 (2013). [DOI] [PMC free article] [PubMed] [Google Scholar]
- 28.Ma H et al. A D53 repression motif induces oligomerization of TOPLESS corepressors and promotes assembly of a corepressor-nucleosome complex. Sci Adv 3, e1601217, doi:10.1126/sciadv.1601217 (2017). [DOI] [PMC free article] [PubMed] [Google Scholar]
- 29.Abe S et al. Carlactone is converted to carlactonoic acid by MAX1 in Arabidopsis and its methyl ester can directly interact with AtD14 in vitro. Proc Natl Acad Sci U S A 111, 18084–18089, doi:10.1073/pnas.1410801111 (2014). [DOI] [PMC free article] [PubMed] [Google Scholar]
- 30.Kagiyama M et al. Structures of D14 and D14L in the strigolactone and karrikin signaling pathways. Genes Cells 18, 147–160, doi:10.1111/gtc.12025 (2013). [DOI] [PubMed] [Google Scholar]
- 31.de Saint Germain A et al. An histidine covalent receptor and butenolide complex mediates strigolactone perception. Nat Chem Biol 12, 787–794, doi:10.1038/nchembio.2147 (2016). [DOI] [PMC free article] [PubMed] [Google Scholar]
- 32.Yao R et al. DWARF14 is a non-canonical hormone receptor for strigolactone. Nature 536, 469–473, doi:10.1038/nature19073 (2016). [DOI] [PubMed] [Google Scholar]
- 33.Toh S, Holbrook-Smith D, Stokes ME, Tsuchiya Y & McCourt P Detection of parasitic plant suicide germination compounds using a high-throughput Arabidopsis HTL/KAI2 strigolactone perception system. Chem Biol 21, 988–998, doi:10.1016/j.chembiol.2014.07.005 (2014). [DOI] [PubMed] [Google Scholar]
- 34.Lumba S, Subha A & McCourt P Found in Translation: Applying Lessons from Model Systems to Strigolactone Signaling in Parasitic Plants. Trends Biochem Sci 42, 556–565, doi:10.1016/j.tibs.2017.04.006 (2017). [DOI] [PubMed] [Google Scholar]
- 35.Lumba S, Bunsick M & McCourt P Chemical genetics and strigolactone perception. F1000Res 6, 975, doi:10.12688/f1000research.11379.1 (2017). [DOI] [PMC free article] [PubMed] [Google Scholar]
- 36.Su Y, Zou Z, Feng S, Zhou P & Cao L The acidity of protein fusion partners predominantly determines the efficacy to improve the solubility of the target proteins expressed in Escherichia coli. J Biotechnol 129, 373–382, doi:10.1016/j.jbiotec.2007.01.015 (2007). [DOI] [PubMed] [Google Scholar]
- 37.Otwinowski Z & Minor W Processing of X-ray diffraction data collected in oscillation mode. Methods Enzymol 276, 307–326 (1997). [DOI] [PubMed] [Google Scholar]
- 38.Adams PD et al. PHENIX: a comprehensive Python-based system for macromolecular structure solution. Acta Crystallogr D Biol Crystallogr 66, 213–221, doi:10.1107/S0907444909052925 (2010). [DOI] [PMC free article] [PubMed] [Google Scholar]
- 39.Emsley P, Lohkamp B, Scott WG & Cowtan K Features and development of Coot. Acta Crystallogr D Biol Crystallogr 66, 486–501, doi:10.1107/S0907444910007493 (2010). [DOI] [PMC free article] [PubMed] [Google Scholar]
Associated Data
This section collects any data citations, data availability statements, or supplementary materials included in this article.
Supplementary Materials
Data Availability Statement
Structural coordinates and structural factors have been deposited in the Protein Data Bank under accession numbers 6BRO, 6BRP, 6BRQ, and 6BRT. Uncropped gels and blots are displayed under Supplementary Information. All other data are available from the corresponding author upon reasonable request.


