Abstract
Bambusa textilis McClure is a traditional Chinese medicinal plant belonging to the Bambusoideae subfamily and used to treat chronic fever and infectious diseases. To investigate the bioactive compounds absorbed in the rabbit blood after oral administration of hot-water extracts from the leaves of B. textilis McClure, a validated chromatographic fingerprint method was established using LC-Q-TOF-MS. Twenty compounds in bamboo leaves and three potential bioactive compounds in rabbit plasma were detected. Of the twenty detected compounds in vitro, fifteen of which were tentatively identified either by comparing the retention time and mass spectrometry data with that of reference compounds or by reviewing the literature. Three potential bioactive compounds, including (E)-p-coumaric acid, (Z)-p-coumaric acid, and apigenin-8-C-β-D-(2"-O-α-L-rhamnosyl)-gluco-pyranoside, were detected in both the leaves of B. textilis McClure and rabbit plasma. Of the three compounds, apigenin-8-C-β-D-(2"-O-α-L-rhamnosyl)glucopyranoside was identified based on its UV, MS, and NMR spectra. This study provides helpful chemical information for further pharmacology and active mechanism research on B. textilis McClure.
Keywords: Bambusa textilis McClure, LC-Q-TOF-MS, chemical fingerprint, bioactive compounds in rabbit plasma, structure elucidation
1. Introduction
Increasing research has focused on natural active compounds extracted from medicinal plants [1,2]. Bamboo leaves have been used in traditional Chinese medicine for treating fever and detoxification for over 1,000 years. It was found that extract of bamboo leaves has multiple biological activities, such as cancer preventive [3,4], anti-free radical and anti-oxidation [5,6], and can be used as a pharmaceutical intermediate and food additive. However, the bioactive compounds in bamboo leaves are not fully known. B. textilis McClure is one of the important medicinal bamboos types in China. Therefore, some strategies have to be designed for screening of bioactive compounds from bamboo leaves [7].
Only the compounds absorbed into the blood have the probability to become effective constituents. A plasma pharmacochemistry-based approach to screening potential bioactive components has been reported on some Chinese herbs and herbal preparations, such as DangGui [8], Huang Lian Jie Du Tang [9], ChanSu [10] and Yin Chen Hao Tang [11]. Plasma pharmacochemistry-based screening methods have provided significant advantages in quickly screening in vivo and giving a high probability of hitting active compounds [11]. Plasma pharmacochemistry techniques are proven to be effective tools for bioactive compound screening in medical plants [12]. The bioactive compounds can be ascertained by analyzing compounds absorbed in the blood after oral administration.
In the present study, plasma pharmacochemistry techniques and a chromatographic fingerprint method using LC-Q-TOF-MS were performed to screen for bioactive compounds in B. textilis McClure. The potential bioactive compounds were ascertained by comparatively analyzing the chemical profiles of dosed rabbit plasma and extract of B. textilis McClure. The potential bioactive compounds were then identified based on their UV, NMR, and MS spectra.
2. Results and Discussion
2.1. HPLC Chromatograms of Plasma Samples
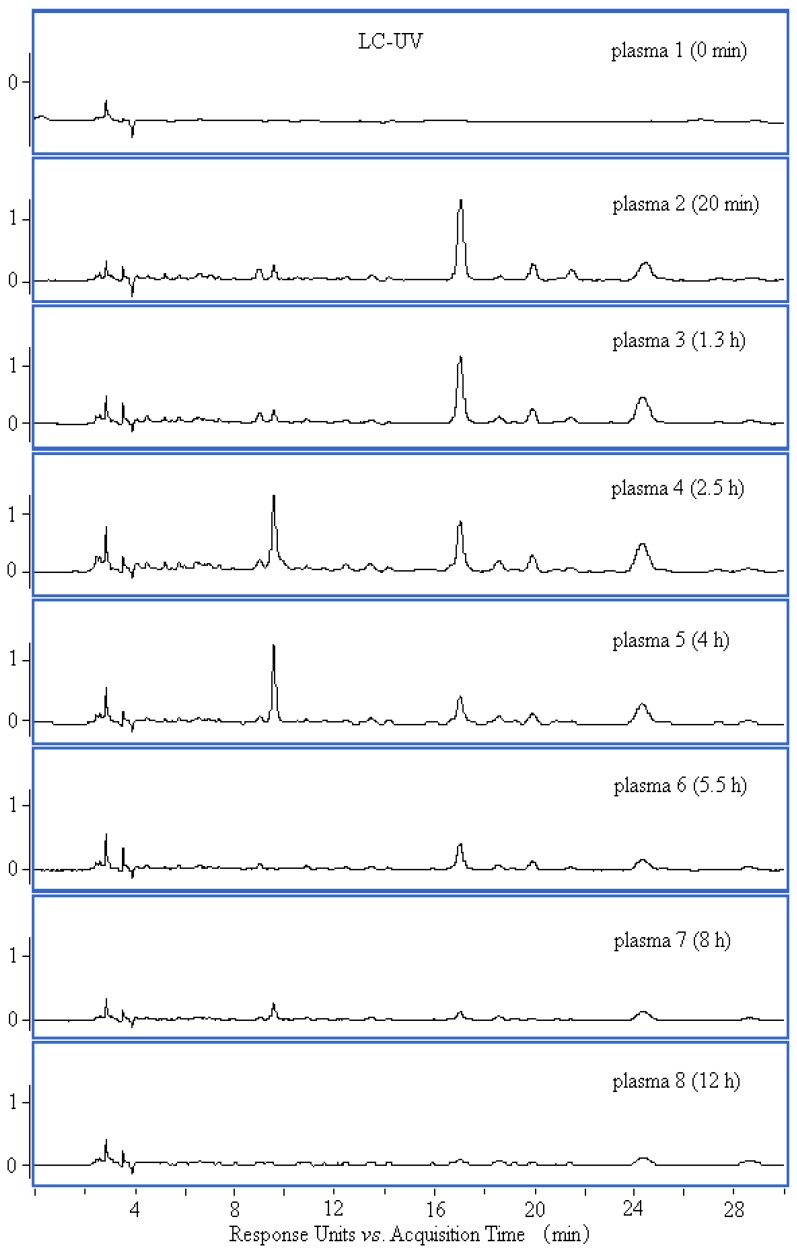
To achieve a good chromatographic resolution, chromatographic conditions were optimized. HPLC fingerprints of plasma samples collected at selected time points were obtained (Figure 1). As seen from Figure 1, a good separation of chemical constituents in plasma samples was achieved. It was found that more peaks with higher responses were detected in the chromatogram of plasma 4 at 2.5 h post-dose, whereas the chromatographic peaks of plasma 1 at 0 min pre-dose were not observed obviously at retention times from 5 min to 25 min. Thus, plasma 4 at 2.5 h post-dose was used to analyze the absorption compounds of hot-water extract from B. textilis McClure in rabbit.
2.2. Potential Bioactive Compounds Discovery
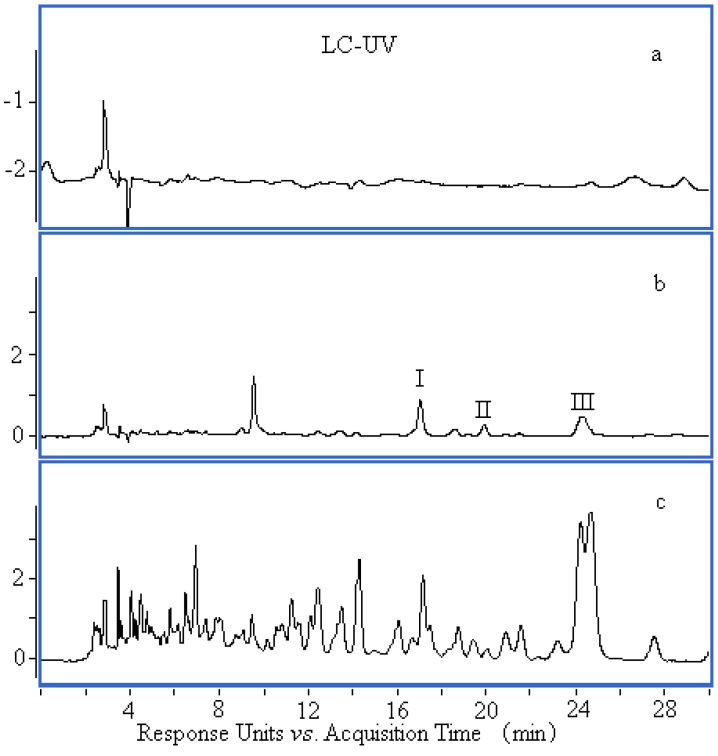
Using LC-Q-TOF-MS, we acquired chromatographic profiles of control plasma, dosed plasma(2.5 h), and extract of B. textilis McClure (Figure 2). As shown in Figure 2, there were several peaks that appeared only in dosed plasma but do not appear in the chromatogram of control plasma. These compounds were absorbed into the blood and might be potential bioactive compounds from B. textilis extract. There are the absorbed components and metabolites in rabbit plasma. Except for the metabolites, the three selected peaks were clearly detected in both the leaves of B. textilis McClure and rabbit plasma. Thus, the peaks marked as I, II, and III in Figure 2(b) may be considered as the main bioactive compounds derived from B. textilis McClure.
Figure 1.
HPLC chromatograms (330 nm) of plasma samples taken at selected time points.
Figure 2.
Chromatograms of control plasma (a), dosed plasma (b) and B. textilis extract (c).
2.3. LC-Q-TOF-MS Analysis of Hot-Water Extracts from B. textilis McClure and Plasma Sample
To validate the three proposed potential bioactive compounds derived from B. textilis McClure, both hot-water extract of B. textilis McClure and dosed plasma sample at 2.5 h were analyzed by LC-Q-TOF-MS. The MS data and the tentative identification results are shown in Table 1 and Table 2.
LC-Q-TOF-MS technology can provide accurate mass, formula, UV spectra, retention time and main fragment information. As seen from Table 1, at least fifteen compounds were tentatively identified. Of the fifteen compounds, isoorientin, orientin, isovitexin, vitexin and p-coumaric acid were confirmed by comparing their accurate mass, UV spectra and retention times with those of standard compounds. Other compounds were identified by several means, utilizing their MS and MS/MS spectra, and comparing them with the literature data [13,14]. For example, a series of fragment ions of compound 5 are given in Table 1. In positive ion ESI mode, a [M+H]+ peak at m/z 611.1605 could confirm the molecular weight to be 610, so C27H30O16was possible molecular composition deduced by the MassHunter software. A fragment at m/z 449.1074 [(M+H)-162]+, corresponding to loss of one hexose unit, also appeared. The absence of the aglycone ion is consistent with a C-hexosyl unit. Compound 5 showed fragments ions at m/z 431.0957, m/z 413.0855 and m/z 329.0655 characteristic for C-hexosyl luteolin. Therefore, compound 5 was inferred to have the structure of O-hexosyl-C-hexosyl luteolin.
Table 1.
MS data and the identification results of the constituents from B. textilis by LC-Q-TOF-MS.
| No. | RT(min) | [M+H]+ | Main Fragments | Experimental m/z | Calculated m/z | Error | Formula | Tentative Identification | |
|---|---|---|---|---|---|---|---|---|---|
| mDa | ppm | ||||||||
| 1. | 3.65 | 151.0756 | 119.0496, 91.0547 | 150.0683 | 150.0681 | −0.24 | −1.59 | C9H10O2 | Phenolic acid |
| 2. | 7.84 | 611.1599 | 431.0969, 413.0870, 395.0752, 329.0654 | 610.1527 | 610.1534 | 0.71 | 1.17 | C27H30O16 | O-hexosyl-C-hexosyl luteolin |
| 3. | 8.80 | 209.1538 | 191.1425, 163.1483, 149.0958, 125.0953 | 208.1465 | 208.1463 | −0.2 | −0.96 | C13H20O2 | Phenolic acid |
| 4. | 9.80 | 535.2735 | 227.1631, 209.1527, 191.1416, 149.0947 | 534.2662 | 534.2676 | 1.44 | 2.69 | C25H42O12 | Unknown |
| 5. | 11.60 | 611.1605 | 449.1074, 431.0957, 413.0855, 329.0655 | 610.1532 | 610.1534 | 0.18 | 0.29 | C27H30O16 | O-hexosyl-C-hexosyl luteolin |
| 6. | 12.31 | 595.1661 | 415.1013, 397.0907, 379.0807, 337.0697 | 594.1588 | 594.1585 | −0.32 | −0.54 | C27H30O15 | Di-O, C-hexosyl-apigenin |
| 7. | 12.56 | 581.1497 | 449.1070, 431.0964, 413.0858, 329.0650 | 580.1424 | 580.1428 | 0.4 | 0.69 | C26H28O15 | O-pentosyl-6-C-hexosyl luteolin |
| 8. | 13.38 | 565.1547 | 547.1427, 511.1217, 379.0807, 325.0701 | 564.1474 | 564.1479 | 0.46 | 0.82 | C26H28O14 | C-hexosyl-C-pentosyl-apigenin |
| 9. | 14.50 | 595.1653 | 449.1077, 431.0965, 413.0861, 329.0656 | 594.1580 | 594.1585 | 0.47 | 0.8 | C27H30O15 | O,C-dideoxyhexosyl-luteolin |
| 10. | 14.61 | 449.1074 | 431.0959, 413.0860, 395.0757, 329.0651 | 448.1001 | 448.1006 | 0.45 | 1.01 | C21H20O11 | Isoorientin |
| 11. | 15.06 | 385.1633 | 325.1366, 217.0861, 181.0847, 167.0697 | 384.1560 | 384.1573 | 1.27 | 3.32 | C22H24O6 | Flavonoid |
| 12. | 16.31 | 449.1078 | 431.0969, 413.0874, 383.0746, 329.0652 | 448.1005 | 448.1006 | 0.05 | 0.11 | C21H20O11 | Orientin |
| 13. | 17.61 | 165.0548 | 147.0448, 119.0494 | 164.0475 | 164.0473 | −0.18 | −1.08 | C9H8O3 | (E)-p-coumaric acid |
| 14. | 20.40 | 165.0546 | 147.0440, 119.0490 | 164.0469 | 164.0473 | −0.4 | 2.46 | C9H8O3 | (Z)-p-coumaric acid |
| 15. | 21.53 | 147.044 | 119.0490, 91.0545 | 146.0367 | 146.0368 | 0.08 | 0.54 | C9H6O2 | Coumarin |
| 16. | 21.88 | 565.1552 | 433.1116, 415.1013, 337.0704, 313.0707 | 564.1479 | 564.1479 | −0.03 | −0.05 | C26H28O14 | O-pentosyl-C-hexosyl-apigenin |
| 17. | 22.81 | 433.1118 | 415.1008, 397.0900, 367.0819, 313.0696 | 432.1046 | 432.1056 | 1.09 | 2.51 | C21H20O10 | Vitexin |
| 18. | 24.44 | 197.1171 | 179.1058, 161.0958, 135.1165, 107.0852 | 196.1098 | 196.1099 | 0.11 | 0.57 | C11H16O3 | Phenolic acid |
| 19. | 24.80 | 579.1711 | 433.1130, 415.1024, 397.0919, 313.0710 | 578.1639 | 578.1636 | −0.31 | −0.54 | C27H30O14 | O-hexosyl-C-hexosyl-apigenin |
| 20. | 25.09 | 433.1125 | 415.1020, 379.0810, 337.0704, 313.0701 | 432.1053 | 432.1056 | 0.38 | 0.89 | C21H20O10 | Isovitexin |
The three potentially bioactive compounds in Table 2 were found to have the same MS data as No. 13, 14 and 19 in Table 1. The results further confirmed that the three compounds were derived from B. textilis McClure, so we next need to further identify the chemical structure of the potential bioactive compounds.
Table 2.
MS data and the identification results of three compounds from dosed plasma (2.5 h) by LC-Q-TOF-MS.
| Compound | RT (min) | [M+H]+ | Main fragments | Experimental m/z | Calculated m/z | Error | Formula | Tentative Identification | |
|---|---|---|---|---|---|---|---|---|---|
| mDa | ppm | ||||||||
| Ⅰ | 17.68 | 165.0543 | 147.0430, 119.0490, 91.0546 | 164.0470 | 164.0473 | 0.34 | 2.06 | C9H8O3 | ( E)-p-coumaric acid |
| Ⅱ | 20.35 | 165.0545 | 147.0445, 119.0491, 91.0548 | 164.0473 | 164.0473 | 0.09 | 0.52 | C9H8O3 | ( Z)-p-coumaric acid |
| Ⅲ | 24.81 | 579.1705 | 433.1129, 415.1021, 313.0703 | 578.1632 | 578.1636 | 0.33 | 0.57 | C27H30O14 | O-hexosyl-C-hexosyl-apigenin |
2.4. Structure Identification of Three Potential Bioactive Compounds
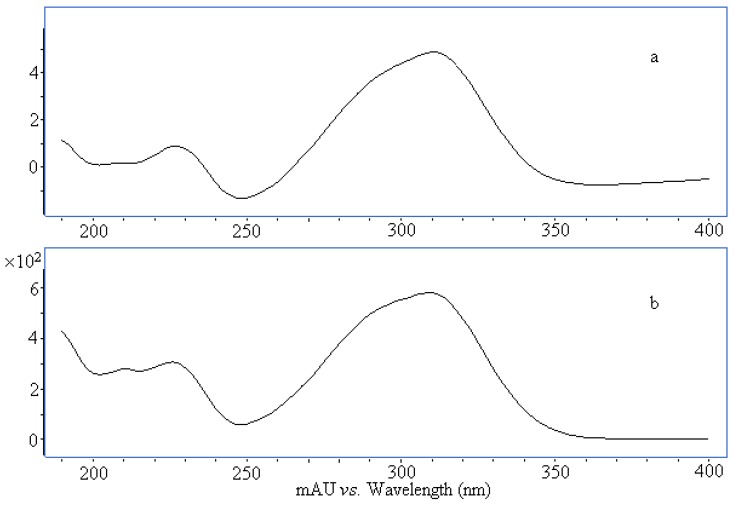
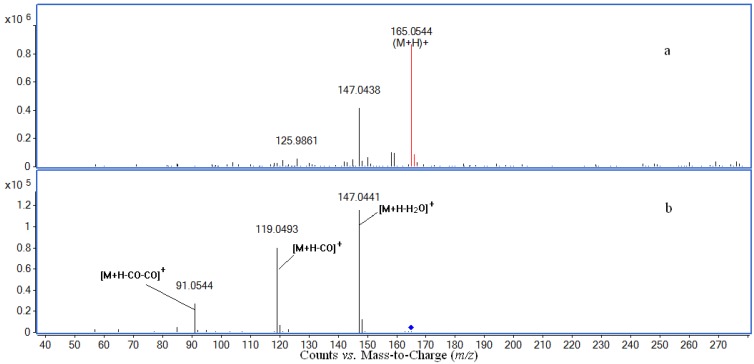
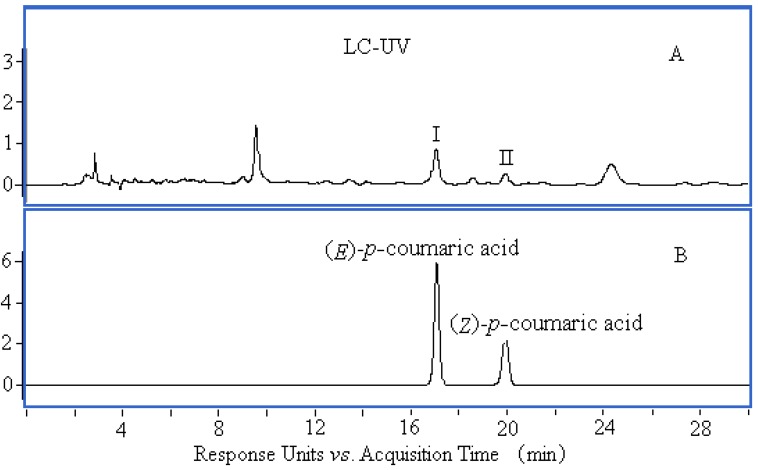
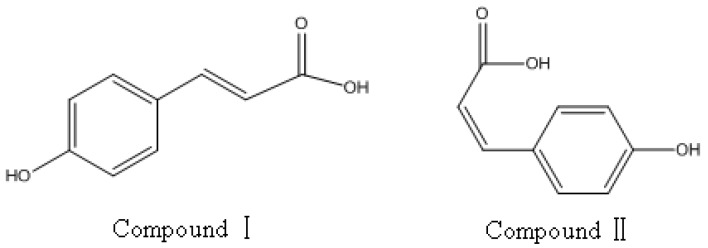
Compounds I and II in Table 2 were identified by comparing their UV spectrum, accurate mass, main fragment ions and retention time with those of (E)-p-coumaric acid and (Z)-p-coumaric acid standards (Figure 3, Figure 4 and Figure 5). The chemical structures of compounds Ι and ΙΙ are shown in Figure 6.
Figure 3.
Comparison UV spectra of compound Ι (a) and p-coumaric acid (b).
Figure 4.
ESI-MS (a) and MS/MS (b) spectra of p-coumaric acid.
Figure 5.
HPLC chromatograms of plasma sample (A) and p-coumaric acid standards (B).
Figure 6.
Structures of compound I and compound II.
2.5. UV Spectrum of Compound III
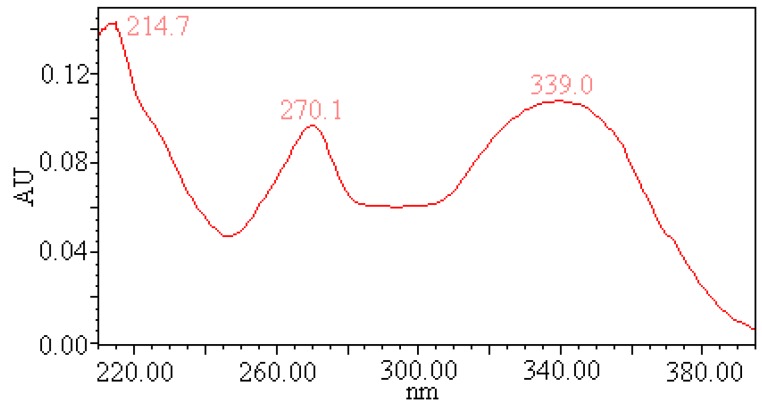
The UV spectrum of Compound III was a typical flavonoid UV spectrum according to its two major absorption bands in the UV region, band I (300–400 nm) and band II (220–280 nm) (Figure 7). Flavonoids are a large group of polyphenolic compounds possessing a basic flavan nucleus with two aromatic rings (the A and the B rings) interconnected by a three-carbon-atom heterocyclic ring (the C ring). The band I of compound III appear at 339.0 nm indicating that the compound III belongs to the flavone family unsubstituted at 3-position. The UV spectrum of the compound III showed a single peak at 270.1 nm, indicating that B ring contains only a 4′-OH group.
Figure 7.
UV spectrum of compound III.
2.6. NMR Analysis of Compound III
The 1H-NMR spectrum of Compound III established the presence of five aromatic protons at δ 6.47 (1H, s), δ 7.81 (2H, d, J = 7.5, H-2′, 6′) and δ 6.81 (2H, d, J = 7.2, H-3′, 5′). Of these protons, the appearance of two doublets and their coupling constants values were δ 7.81 (J = 7.5) and δ 6.81 (J = 7.2), which were clearly assignable to ring B protons at H-2′, H-6′ and H-3′, H-5′, respectively. A single sharp peak at δ 6.72 ppm was assigned to the H-3 proton of the C ring. The 1H-NMR spectrum of the compound exhibited signals at δ 4.52 (J = 9.9) applicable for sugar anomeric protons suggesting the presence of a β-glucopyranoside [15]. According to its 13C-NMR spectrum, a high-field signal at δ 17.9 (C-6′′′) was indicative for the presence of α-rhamnosyl. A downfield signal at δ 182.6 was clearly assigned to the carbonyl carbon C-4 of the pyrone ring. The three downfield signals appearing at δ 161.6, δ 163.1 and δ 156.7 were assigned to the C-5, C-7 and C-4′ carbon atoms bearing hydroxyl groups. Furthermore, a signal at δ 80.5 suggested that a rhamnosyl unit was attached to C-2′′.
2.7. LC-Q-TOF-MS Analysis of Compound III
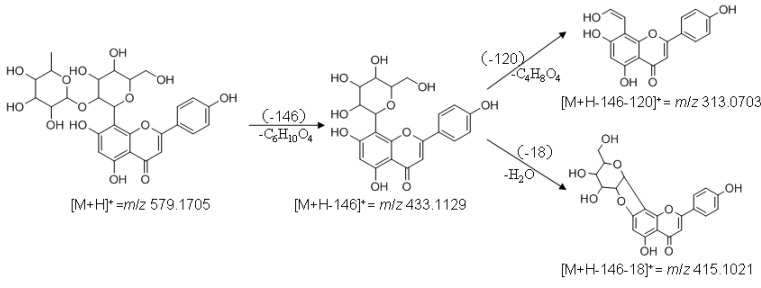
Compound III had a pseudomolecular ion at m/z 579.1705 [M+H]+. A molecular formula of C27H30O14 (calc. 578.1636) was generated using the MassHunter quantitative analysis software. A fragment at m/z 433.1129 [M+H-146]+, corresponded to loss of one deoxyhexose. Thus, compound III could have a deoxyhexosyl unit in the terminal position of a disaccharide unit. The presence of the ion at m/z 313.0703 [M+H-146-120]+ and the absence of the fragment [M+H-146-60]+ indicated a hexose as the C-glycosylation sugar. As analyzed above, the structure of compound III was determined as apigenin-8-C-β-D-(2"-O-α-L-rhamnosyl)-glucopyranoside, which was also confirmed by its MS fragmentation pathways (Figure 8).
Figure 8.
Main fragmentation pathways of compound III.
Bamboo leaves are rich in flavonoids and the main functional components of extract from bamboo leaf are flavone C-glycosides [16,17]. According to the literature flavone C-glycosides, including isoorientin, orientin, vitexin and isovitexin, were poorly absorbed in the gastrointestinal tract of rat. Flavone C-glycosides largely reach the colon where they can be degraded into various aromatic acid metabolites by the microflora. The flavone C-glycosides cannot be absorbed in the rats’ blood after oral administration, whereas p-coumaric acid can be absorbed in blood [18]. The ability of p-coumaric acid to protect rat’s heart against doxorubicin-induced oxidative stress has been proved [19]. In this study, apigenin-8-C-β-D-(2"-O-α-L-rhamnosyl)-glucopyranoside belonging to the C-glycosides class was absorbed in rabbit blood. The absorption mechanism in vivo should be investigated in further research. This study provides helpful chemical information for further our understanding of the pharmacology and active mechanism research of B. textilis McClure.
3. Experimental
3.1. General
Liquid chromatography/quadrupole time-of-flight mass spectrometry (LC-Q-TOF-MS) analysis was performed on an Agilent 1290 series LC system coupled with a Q-TOF (model 6540, Agilent Technologies, Santa Clara, CA, USA) and equipped with a diode array detector (DAD). The system was controlled under MassHunter B.04 software. Purification of bioactive compounds was performed with a Gilson preparative HPLC GX-281/322/156 system (Gilson, Middleton, WI, USA), using a C18 column (250 × 20 mm I.D., 5 µm, Hydrosphere, YMC Japan, Kyoto, Japan). The obtained compounds were dissolved in 0.5 mL of DMSO-d6 and the solution was filled into a NMR tube. NMR analysis was carried out using a Bruker 300 MHz spectrometer operating at 300 (1H) or 75 MHz (13C), respectively. Chemical shifts were reported in ppm on δ scale, and the coupling constants (J) were measured in Hertz (Hz). The compounds were identified by a combination of spectroscopic methods (1H-, 13C-NMR), ESI-MS and comparison with the literature data.
3.2. Materials
The bamboo leaves of B. textilis McClure were collected from the bamboo garden of the Jiangxi Academy of Forestry, Nanchang, China. The species were authenticated by Professor Jiu-Sheng Peng from the Jiangxi Academy of Forestry. Bamboo leaves were dried in the shade, ground to powder, and stored at –20 °C.
3.3. Chemicals
The HPLC-grade acetonitrile and methanol were purchased from Fisher Scientific (Fair Lawn, NJ, USA). Acetic acid and (E)-p-coumaric acid were purchased from Sigma-Aldrich (St. Louis, MO, USA). (Z)-p-coumaric acid was purchased from J&K Scientific Ltd. (Beijing, China). Water was purified with an ultrapure water system (Purelab Plus, Pall, Port Washington, NY, USA). Analytical-grade chemical was obtained from Beijing Chemical Works (Beijing, China). The standards of isoorientin, orientin, isovitexin and vitexin were purchased from Shanghai Winherb Medical S & T Development Co., Ltd. (Shanghai, China).
3.4. Preparation of Hot-Water Extracts of B. textilis McClure
The dried bamboo leaf powder (100 g) was extracted by percolation with water (600 mL) and the solution was heated to reflux and boiled gently for 20 min. The cooled solution was filtered and the residue of the bamboo leaves was carefully washed twice with water (600 mL). The combined extracts were concentrated under reduced pressure at 40 °C. The extracts were suspended in water (100 mL) and stored at 4 °C before use.
3.5. Preparation of Plasma Samples
A rabbit (3 kg) was obtained from the SFA Key Laboratory of Bamboo and Rattan Science and Technology (Beijing, China). The rabbit was fasted 16 h before the experiment and water was taken freely. Hot-water extracts from B. textilis McClure (100 g of bamboo leaves/100 mL of water) was administered orally to the rabbit at a single dose of 33.3 g/kg. Blood samples (2.5–3 mL) were collected in heparinized tubes pre-dose (0 min) and at selected time points (20 min, 1.3 h, 2.5 h, 4 h, 5.5 h, 8 h and 12 h) post-dose. The heparinized tubes were shaken gently as soon after collection as possible to prevent clotting. Then the blood samples were centrifuged at 3,000 rpm for 10 min. The supernatant layer of plasma (0.5 mL) was placed into a 5 mL polypropylene tube. Methanol (2 mL) was added to the tube to deposit proteins. Each tube was vortexed for 30 s and left for 12 h at –18 °C. Then plasma samples were centrifuged at 13,000 rpm for 10 min. The supernatant was transferred to a round-bottom flask, and evaporated to dryness at 40 °C in a rotary vacuum evaporator (Rotary Evaporator, EYELAN-1001D-W, Tokyo, Japan). The residue was reconstituted in 0.5 mL of methanol and then filtered through a 0.22 μm membrane. Experiments were carried out in accordance with the Guide for the Care and Use of Laboratory Animals [8,20].
3.6. LC-Q-TOF-MS Analysis
LC separation was performed using a C18 column (4.6 × 250 mm, 5 µm, YMC pack R&D ODS-A, YMC Japan) at 30 °C. The solvent system consisted of a mixture of water with 0.5% (v/v) acetic acid and acetonitrile (85/15, v/v) at a flow rate of 1.0 mL/min. The LC effluent was split using a T-splitter to produce a flow of 0.25 mL/min [21].
The TOF/MS analysis worked using positive mode. Mass spectra were acquired in the range of 100 to 1,000 m/z for MS1 and 20 to 1,000 m/z for MS2. The MSn data were collected in an auto MS/MS mode. The collision-induced dissociation (CID) voltage was set at 20 V. The conditions of ESI source were as follows: drying gas (N2) flow rate, 8 L/min; drying gas temperature, 350 °C; nebulizer, 45 psig; capillary voltage, 4,000 V; skimmer voltage, 65 V; fragmentor voltage, 175 V; sheath gas temperature, 350 °C; nozzle voltage, 1,000 V. During the analysis, two reference masses were used: 121.0509 (C5H4N4) and 922.0098 (C18H18O6N3P3F24). These masses are continuously infused to the system to allow constant mass correction. The chemical formula of the selected peaks were calculated by the accurate mass of the precursor and product ions. The formula predictor was set as follows: C (0-60), H (0-120), O (0-30). Other elements such as P, S, F and Cl were not considered, since they are rarely present in the components of bamboo leaves.
3.7. Isolation of Active Compound by Preparative HPLC
Powdered leaves (100 g) of B. textilis McClure were extracted again as above. After removing the solvent under reduced pressure and freeze-drying, the combined extracts were concentrated and yielded 18 g of a crude extract. The extract was suspended in water/acetonitrile (100 mL, 85/15, v/v) and filtered through a 0.45 μm membrane to remove the insoluble material. This crude solution was purified on a preparative HPLC system. The mobile phase consisted of H2O (solvent A) and ACN (solvent B). The gradient elution program was as follows: 0–3 min, 0% B; 3–7 min, 0–15% B; 7–45 min, 15% B; 45–50 min, 15–50% B; 50–52 min, 50–15% B; 52–60 min, 15% B. The flow rate was set at 10 mL/min with UV detection at 342 nm to yield compound III (6.8 mg).
3.8. Analytical Data
Apigenin-8-C-β-D-(2"-O-α-L-rhamnosyl)-glucopyranoside (III). Yellowish solid. UV λmax(ACN-H2O) 270, 339 nm; HRESIMS m/z 579.1705 [M+H]+ (calc. for C27H30O14, 579.1708); 1H-NMR (DMSO-d6) δ: 6.72 (1H, s, H-3), 6.47 (1H, s, H-6), 7.81 (2H, d, J= 7.5, H-2′, 6′), 6.81 (2H, d, J= 7.2, H-3′, 5′), 4.52 (1H, d, J= 9.9, H-1′′), 4.97 (1H, s, H-1′′′), 3.40–4.50 (13H, m, Sugar); 13C-NMR (DMSO-d6) δ: 163.8 (C-2), 103.1 (C-3), 182.6 (C-4), 161.6 (C-5), 94.7 (C-6), 163.1 (C-7), 109.5 (C-8), 156.7 (C-9), 109.0 (C-10), 121.5 (C-1′), 128.8 (C-2′), 116.2 (C-3′), 156.7 (C-4′), 116.2 (C-5′), 128.8 (C-6′), 75.0 (C-1′′), 80.5 (C-2′′), 76.2 (C-3′′), 71.7 (C-4′′), 81.9 (C-5′′), 62.2 (C-6′′), 103.1 (C-1′′′), 71.7 (C-2′′′), 71.1 (C-3′′′), 71.4 (C-4′′′), 72.0 (C-5′′′), 17.9 (C-6′′′).
4. Conclusions
LC-Q-TOF-MS analysis coupled with a plasma pharmacochemistry method was applied to analyze the bioactive compounds in the leaves of B. textilis McClure. A total of 20 compounds were detected in bamboo leaves and three potential bioactive compounds detected in rabbit plasma were the original form of the compounds detected in vitro. Based on their UV, MS, and NMR spectra, the potential bioactive compounds were identified as follows: (E)-p-coumaric acid, (Z)-p-coumaric acid, and apigenin-8-C-β-D-(2"-O-α-L-rhamnosyl)-glucopyranoside. This approach provides a strategy for screening and characterizing bioactive compounds in medicinal bamboo.
Acknowledgments
This study was financially supported by the Central Public-Interest Scientific Institution Basal Research Fund, China (No.1632010003) and Key Projects in the National Science & Technology Pillar Program in the Twelfth Five-year Plan Period (No. 2012BAD23B03).
Supplementary Materials
Supplementary materials can be accessed at: http://www.mdpi.com/1420-3049/17/8/8872/s1.
Footnotes
Sample Availability: Samples of the compounds p-coumaric acid and apigenin-8-C-β-D-(2"-O-α-L-rhamnosyl)-glucopyranoside are available from the authors.
References
- 1.Coenye T., Brackman G., Rigole P., De Witte E., Honraet K., Rossel B., Nelis H.J. Eradication of propionibacterium acnes biofilms by plant extracts and putative identification of icariin, resveratrol and salidroside as active compounds. Phytomedicine. 2012;5:409–412. doi: 10.1016/j.phymed.2011.10.005. [DOI] [PubMed] [Google Scholar]
- 2.Ching J., Soh W.L., Tan C.H., Lee J.F., Tan J.Y., Yang J., Yap C.W., Koh H.L. Identification of active compounds from medicinal plant extracts using gas chromatography-mass spectrometry and multivariate data analysis. J. Sep. Sci. 2012;1:53–59. doi: 10.1002/jssc.201100705. [DOI] [PubMed] [Google Scholar]
- 3.Seki T., Kida K., Maeda H. Immunostimulation-mediated anti-tumor activity of bamboo (Sasa senanensis) leaf extracts obtained under ‘vigorous’ condition. Evid. Based Complement. Alternat. Med. 2008;4:447–457. doi: 10.1093/ecam/nen026. [DOI] [PMC free article] [PubMed] [Google Scholar]
- 4.Seki T., Maeda H. Cancer preventive effect of kumaizasa bamboo leaf extracts administered prior to carcinogenesis or cancer inoculation. Anticancer Res. 2010;30:111–118. [PubMed] [Google Scholar]
- 5.Park H.S., Lim J.H., Kim H.J., Choi H.J., Lee I.S. Antioxidant flavone glycosides from the leaves of Sasa borealis. Arch. Pharm. Res. 2007;2:161–166. doi: 10.1007/BF02977689. [DOI] [PubMed] [Google Scholar]
- 6.Mu J., Uehara T., Li J., Furuno T. Identification and evaluation of antioxidant activities of bamboo extracts. For. Stud. Chin. 2004;2:1–5. [Google Scholar]
- 7.Wang B., Deng J., Gao Y., Zhu L., He R., Xu Y. The screening toolbox of bioactive substances from natural products: A review. Fitoterapia. 2011;8:1141–1151. doi: 10.1016/j.fitote.2011.08.007. [DOI] [PubMed] [Google Scholar]
- 8.Wang Y.L., Liang Y.Z., Chen B.M., He Y.K., Li B.Y., Hu Q.N. LC-DAD-APCI-MS-based screening and analysis of the absorption and metabolite components in plasma from a rabbit administered an oral solution of Danggui. Anal. Bioanal. Chem. 2005;2:247–254. doi: 10.1007/s00216-005-0008-7. [DOI] [PubMed] [Google Scholar]
- 9.Hu Y., Jiang P., Wang S., Yan S., Xiang L., Zhang W., Liu R. Plasma pharmacochemistry based approach to screening potential bioactive components in Huang-Lian-Jie-Du-Tang using high performance liquid chromatography coupled with mass spectrometric detection. J. Ethnopharmacol. 2012;2:728–735. doi: 10.1016/j.jep.2011.08.011. [DOI] [PubMed] [Google Scholar]
- 10.Xia X., Jin H., Yan S., Zhang W. Analysis of the bioactive constituents of ChanSu in rat plasma by high performance liquid chromatography with mass spectrometric detection. J. Pharm. Biomed. Anal. 2010;3:646–654. doi: 10.1016/j.jpba.2010.05.009. [DOI] [PubMed] [Google Scholar]
- 11.Wang X., Sun W., Sun H., Lv H., Wu Z., Wang P., Liu L., Cao H. Analysis of the constituents in the rat plasma after oral administration of Yin Chen Hao Tang by UPLC/Q-TOF-MS/MS. J. Pharmaceut. Biomed. 2008;3:477–490. doi: 10.1016/j.jpba.2007.11.014. [DOI] [PubMed] [Google Scholar]
- 12.Xin G.Z., Zhou J.L., Qi L.W., Li P. Mass spectrometry-based strategies for screening of bioactive natural products. Comb. Chem. High Throughput Screen. 2011;2:93–103. doi: 10.2174/138620711794474060. [DOI] [PubMed] [Google Scholar]
- 13.Lv Z., Dong J., Zhang B. Rapid identification and detection of flavonoids compounds from bamboo leaves by LC-(ESI)-IT-TOF/MS. BioResources. 2012;2:1405–1418. [Google Scholar]
- 14.Figueirinha A., Paranhos A., Pérez-Alonso J.J., Santos-Buelga C., Batista M.T. Cymbopogon citratus leaves: characterization of flavonoids by HPLC-PDA-ESI/MS/MS and an approach to their potential as a source of bioactive polyphenols. Food Chem. 2008;3:718–728. [Google Scholar]
- 15.Khan M.H., Jaggi S.K. Isolation of 5,7,4'-trihydroxy flavone-8-C-β-D-glucopyranoside, a flavone glycoside from the roots of Bauhania retusa. Natura Proda Medica. 2010;3:78–80. [Google Scholar]
- 16.Lu B., Wu X., Tie X., Zhang Y., Zhang Y. Toxicology and safety of anti-oxidant of bamboo leaves. Part 1: Acute and subchronic toxicity studies on anti-oxidant of bamboo leaves. Food Chem. Toxicol. . 2005;5:783–792. doi: 10.1016/j.fct.2005.01.019. [DOI] [PubMed] [Google Scholar]
- 17.Zhang Y., Bao B., Lu B., Ren Y., Tie X., Zhang Y. Determination of flavone C-glucosides in antioxidant of bamboo leaves (AOB) fortified foods by reversed-phase high-performance liquid chromatography with ultraviolet diode array detection. J. Chromatogr. A. 2005;2:177–185. doi: 10.1016/j.chroma.2004.12.086. [DOI] [PubMed] [Google Scholar]
- 18.Zhang Y., Tie X., Bao B., Wu X., Zhang Y. Metabolism of flavone C-glucosides and p-coumaric acid from antioxidant of bamboo leaves (AOB) in rats. Brit. J. Nutr. 2007;3:484–494. doi: 10.1017/S0007114507336830. [DOI] [PubMed] [Google Scholar]
- 19.Abdel-Wahab M.H., El-Mahdy M.A., Abd-Ellah M.F., Helal G.K., Khalifa F., Hamada F.M.A. Influence of p-coumaric acid on doxorubicin-induced oxidative stress in rat’s heart. Pharmacol. Res. 2003;5:461–465. doi: 10.1016/s1043-6618(03)00214-7. [DOI] [PubMed] [Google Scholar]
- 20.Bruce S.J., Jonsson P., Antti H., Cloarec O., Trygg J., Marklund S.L., Moritz T. Evaluation of a protocol for metabolic profiling studies on human blood plasma by combined ultra-performance liquid chromatography/mass spectrometry: from extraction to data analysis. Anal. Biochem. 2008;2:237–249. doi: 10.1016/j.ab.2007.09.037. [DOI] [PubMed] [Google Scholar]
- 21.Wang J., Yue Y.D., Jiang H., Tang F. Rapid screening for flavone C-glycosides in the leaves of different species of bamboo and simultaneous quantitation of four marker compounds by HPLC-UV/DAD. Int. J. Anal. Chem. . 2012;2012:205101–1. doi: 10.1155/2012/205101. [DOI] [PMC free article] [PubMed] [Google Scholar]
Associated Data
This section collects any data citations, data availability statements, or supplementary materials included in this article.


