Abstract
Aims: Study of IL4 in relation to the anthropometric, biochemical and immunological parameters in patients with obesity and/or diabetes. Methods: The relationship between IL4 and clinical and biological parameters was studied in 76 patients divided into 4 groups: obese diabetics (OD), n = 25; obese without diabetes (O), n = 25; non obese diabetics (NOD), n = 11; controls (M), n = 15. IL4 was determined using the ELISA method. Statistical analysis was done using the MedCalc statistical software, version 16.1. Results: Serum IL4 was 0.38 ±0,40 pg / mL in the Control group, 0.366 (0,100-2,35) pg / ml in group O, 4.66±3.73 pg / ml in group OD, 0.30 (0.10-1.35) pg / ml in NOD. When IL4 levels were compared between the four groups, statistical significance was reached for the comparison between groups OD and M. Statistically significant correlations were detected between IL4 and age, waist circumference and hip circumference, blood glucose, glycated hemoglobin (HbA1c), VLDL, triglycerides and serum protein fraction β1. In univariate regression, the IL4 level predictors were age, height, BMI, abdominal circumference, hip circumference, beta 1% glucose, HbA1c, total lipids, total cholesterol, VLDL triglycerides, CRP. In multivariate regression, waist circumference and glycemia were significant predictors of levels of IL4 (p = 0.0001).
Keywords: IL4, inflammation, obesity , diabetes mellitus
Introduction
There is increasing evidence that obesity is associated with an inflammatory condition of the white adipose tissue, resulting in chronic activation of innate immunity, which can lead to insulin resistance, impaired glucose tolerance and even diabetes [1]. Adipocytes in the white adipose tissue secrete adipokines, such as chemokines, adiponectin, resistin, leptin, visfatin, interleukins. Some of these citokines have been linked to insulin resistance, endothelial disfunction and atherosclerosis [2]. As a response to several stimuli (such as exposure to cold), adipose tissue remodeling can take place, inducing dynamic changes in cellular function and composition, resulting in biogenesis of beige fat. Eosinophils, alternatively activated macrophages and type 2 cytokines (IL4,IL13), are involved in the afferent beige thermogenic circuit [3].
Adipokines (including IL4) seem to be important in the physiopathology of obesity [4] and diabetes [5]. Several animal studies have addressed the involvement of cytokines in the development of insulin resistance, diabetes and atherosclerosis [6,7,8].
IL4 has been less studied in humans in relationship with obesity and diabetes. The aim of the present study was to investigate the relationship between IL4 serum levels and diabetes and obesity.
Material and method
The study included 76 patients in the Binisan Medical Center, Dragasani, an outpatient clinic, between December 2015 and January 2016. Patients presenting with emergencies, active infections, parasitosis or malignancies were excluded. Informed consent was obtained from every study participant and the study was approved by the Ethics Committee of the Craiova University of Medicine and Pharmacy.
Subjects were divided into four study groups:
The O group (overweight and obese), n = 25, including overweight or obese subjects (body mass index (BMI) ≥25) without diabetes. Six obese or overweight individuals previously not known as diabetics and discovered with diabetes during the study work-up were further assigned to the OD group.
The OD group (overweight and obese diabetics), n = 25, patients with diabetes and a BMI ≥25.
The NOD group (non-obese diabetics), n = 11 lean individuals, known with diabetes and a BMI <25.
The M group (Controls), n=15, with a normal body weight (BMI<25) and without diabetes.
Processing of samples
For each patient, two vacutainers without additives, with separator gel to obtain serum and one K3 EDTA vacutainer were collected.
After blood clotting, for at least 30 minutes, the separating gel vacutainers were centrifuged at 1000 × g for 10 minutes.
After aliquoting, samples were processed according to each particular analysis, and tested using the following analytical methods:
For the serum parameters, the methods used were: the GOD PAP method for glucose, the CHOD PAP method for cholesterol, the PAP GPO method for triglycerides, direct methods for HDL, the Biuret method without blank sample for total protein, the Jaffe method without compensation for creatinine, the Urea method -UV for urea, glycated hemoglobin (HbA1C) by direct method, C-reactive protein by Fixed time method; serum proteins electrophoresis by the method of migration in agarose gel in the electric field.
The method used for IL 4 was ELISA (Sandwich Enzyme-Linked Immunosorbent Assay), by PLAB-CLIA Adaltis, lot B196450.
Statistical analysis
Clinical (sex, age, body weight, abdominal and hip circumference, systolic and diastolic blood pressure, body weight, height, body mass index) and biochemical (the above mentioned variables) parameters were registered and analysed for the entire study group and separately for each of the four subgroups. Numeric variables were expressed as averages ± standard deviations for the normally distributed ones and as median (25-75 percentiles) for the non-normally distributed ones. Qualitative variables were expressed as percentage. Numeric variables were compared using the t test for normal distribution and the Mann Whitney test for non-parametric variables. Qualitative variables were compared using the Chi-squared test. Correlation between parameters was studied using the Pearson correlation coefficient for parametric variables and the Spearman correlation coefficient for the non-parametric variables.
Univariate linear regression and multivariate regression were used to investigate the relationship between IL4 and the clinical and biochemical parameters. The statistical significance threshold chosen was p<0.05. The statistical analysis was performed using the Microsoft Excell software and the MedCalc v.16.1 software.
Results
The characteristics of the study groups are described in Table 1.
Table 1.
Study parameters in the four groups
| PARAMETERS | Group O N=25 | Group OD N=25 | Group NOD N=10 | Group M N=15 | p1 | p2 | p3 |
| CLINICAL | |||||||
| Age(years) | 57.24±11.72 | 63 (58.5-66.25) | 61±9.52 | 29 ±5.29 | <0.0001 | <0.0001 | <0.0001 |
| Sex(%M) | 52 | 56 | 40 | 86.57 | 0.033 | 0.185 | 0.28 |
| Weight(kg) | 93 (79.75-104.25) | 87±11.71 | 61 (59-70) | 68.73 ±6.69 | <0.0001 | <0.0001 | 0.13 |
| Height(cm) | 170 (164.75-177.25) | 167.28±8.86 | 168 (164-174) | 175.66±5.44 | 0.06 | 0.0007 | 0.04 |
| BMI(kg/m2) | 29.74 (27.38-34.31) | 31.05±3.14 | 22.31±1.43 | 22.23±1.43 | <0.0001 | <0.0001 | 0.89 |
| Abdominal circumference (cm) | 107.96±14.71 | 111.8±8.81 | 88±7.93 | 83.26±6.59 | <0.0001 | <0.0001 | 0.13 |
| Hip circumference (cm) | 114.6±9.04 | 116.16±8.21 | 97 (95-100) | 106.6±4.76 | <0.0001 | <0.0001 | 0.2 |
| Systolic blood pressure(mmHg) | 132.4±16.88 | 139.92±18.38 | 135.7±21.66 | 117.53±12.20 | 0.0027 | <0.0001 | 0.03 |
| Diastolic blood pressure(mmHg) | 80 (70-88.5) | 78.64±9.60 | 80 (80-90) | 69.4±11.36 | 0.036 | 0.015 | 0.0034 |
| PARACLINICAL | |||||||
| Total Protein (g/dl) | 7.54 (7.06-7.74) | 7.71±0.55 | 7.78±0.41 | 7.82±0.42 | 0.02 | 0.47 | 0.81 |
| Albumin% | 64.9 (63.07-66.85) | 64.70±3.81 | 64.2±4.038 | 68.03±3.77 | 0.0086 | 0.122 | 0.0384 |
| Alpha1% | 2.44±0.32 | 2.46±0.48 | 2.7 (2.17-2.72) | 2.16±0.56 | 0.09 | 0.099 | 0.12 |
| Alpha2% | 9.68±1.09 | 9.98±1.18 | 10.65±1.14 | 8.76±1.33 | 0.033 | 0.0073 | 0.0016 |
| Beta1% | 7.42±0.83 | 7.85±1.12 | 7.68±1.20 | 6.55±0.64 | 0.0007 | 0.0001 | 0.0243 |
| Beta2% | 3.5 (3.17-3.75) | 3.75±0.89 | 3.46±0.55 | 3.14±0.80 | 0,149 | 0.0336 | 0.25 |
| Gamma% | 11.7 (10.45-13.85) | 11.23±2.46 | 11.27±2.33 | 11.35±2.30 | 0.42 | 0.87 | 0.93 |
| Serum Glucose (mg/dl) | 95 (86.75-108.0) | 150.64±39.47 | 152.7±60.67 | 90.2±7.61 | 0.08 | <0.0001 | 0.01 |
| HbA1C% | 5.76±0.54 | 7.2 (6.67-7.95) | 6.75±1.19 | 5.06±0.71 | 0.0034 | <0.0001 | 0.0015 |
| Total Lipids (mg/dl) | 652.51±122.66 | 668.07±139.17 | 697.41±152.53 | 571.43±116.29 | 0.048 | 0.024 | 0.041 |
| LDL (mg/dl) | 135.67±45.66 | 124.90±50.74 | 133.9±41.81 | 114.34±40.63 | 0.13 | 0.47 | 0.26 |
| HDL (mg/dl) | 44.98 (38.25-50.41) | 43.14 (39.73-46.94) | 43.05±8.81 | 47.47±17.02 | 0.92 | 0.58 | 0.4 |
| VLDL (mg/dl) | 18.37 (15.47-22.8) | 29.02±9.82 | 21.66 (18.92-36.49) | 16.43±10.13 | 0.113 | 0.0006 | 0.0107 |
| Total Cholesterol (mg/dl) | 202.50±49.38 | 198.7±52.82 | 205.81±43.64 | 178.32±42.34 | 0.110 | 0.19 | 0.13 |
| Triglycerides (mg/dl) | 90 (75.33-111.94) | 145.13±49.11 | 108.29 (94.6-182.46) | 82.19±50.68 | 0.15 | 0.0003 | 0.01 |
| IL4 (pg/ml) | 0.366 (0.100-2.35) | 4.66±3.73 | 0.30 (0.10-1.35) | 0.38±0.40 | 0.10 | <0.0001 | 0.46 |
| CRP (mg/dl) | 2.1 (0.83-2.82) | 2.77 (1.53-4.81) | 0.44 (0.12-3.03) | 8.77±26.62 | 0.48 | 0.089 | 0.66 |
| Urea (mg/dl) | 33.92 (30.17-40.45) | 36.64±11.39 | 31.89 (23.63-45.16) | 31.59±12.12 | 0.3 | 0.2 | 0.78 |
| Creatinine (mg/dl) | 0.83 (0.76-0.95) | 0.89±0.21 | 0.75 (0.67-0.77) | 2.63±6.42 | 0.012 | 0.31 | 0.019 |
| Creatinine clearance (ml/min) | 119.61±48.6 | 101.73±20.14 | 80.74±22.52 | 102.33±29.5 | 0.16 | 0.45 | 0.0023 |
Note 1: Study parameters were expressed as mean ± standard deviation for normal distribution and as median (25-75 percentile) for abnormal distribution.
Note 2: p1 refers to the comparisons between groups O and M, p2 refers to the comparisons between groups OD and M, p3 refers to the comparisons between groups NOD and M. Statistical tests used were t-test for normally distributed variables and the Mann Whitney test for abnormal distribution.
Systolic and diastolic blood pressures were significantly higher in all study groups compared to the control group. As expected, blood glucose was significantly higher in OD and NOD groups compared to controls and Hb A1c was significantly higher in obese and diabetic patients compared to the control group. In all three study groups, total serum lipids were significantly higher than in the control group.
Among lipid fractions, VLDL was significantly higher in OD and NOD groups compared to M. The same was found for triglycerides.
In terms of protein metabolism, total protein values were lower in group O than in group M, serum albumin values were lower in all study groups than in group M.
No statistically significant difference was detected between the groups regarding CRP.
IL4 had increasing values in the 4 groups, as follows in ascending order: M, NOD, O and OD The differences reached statistical significance for the comparison between groups M and OD (IL4 4.66±3.73 pg/ml in thr OD group vs 0.38±0.40 pg/ml in the M group, p=<0.0001). Differences between the other study groups and controls in terms of IL4 were not statistically significant (Fig.1).
Figure 1.
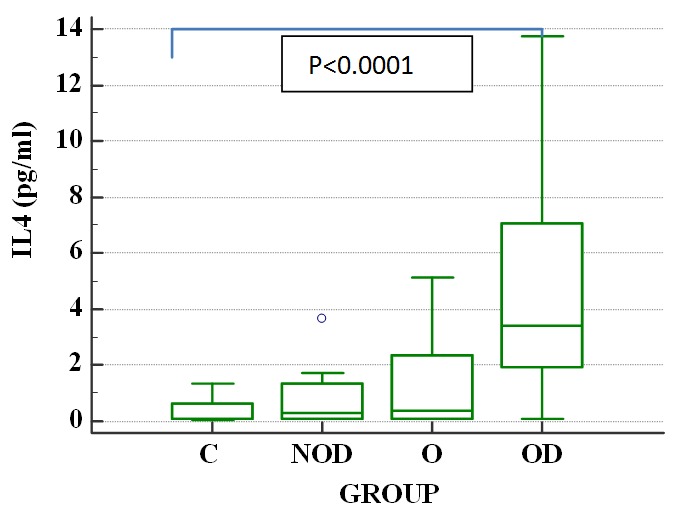
IL4 differences between control and study groups
Statistically significant correlations with IL4 were found for: age (rs=0.349, p=0.0021), height (rs=0.28, p=0.0132), BMI (rs=0.297, p=0.0096), abdominal circumference (rs=0.38, p=0.0008), hip circumference (rs=0.24, p=0.0038), Beta1% (rs=0.306, p=0.04), serum glucose (rs=0.0348, p=0.022), HbA1c (rs=0.388, p=0.0006), total lipids (rs=0.266, p=0.0227), total cholesterol (rs=0.243, p=0.0355), VLDL (rs=0.337, p=0.0035), triglycerides (rs=0.345, p=0.024), CRP (rs=0.248, p=0.0357).
In univariate regression with IL4, statistically significant predictors for IL4 levels were the following: age (R2=0.106, p=0.0044), abdominal circumference (R2=0.1737, p=0.0002), hip circumference (R2=0.076, p=0.016), Beta1% (R2=0.115, p=0.0034), serum glucose (R2=0.1431, p=0.0008), HbA1c (R2=0.1184, p=0.0025), VLDL (R2=0.062, p=0.0382) and triglycerides (R2=0.012, p=0.0327).
In a multivariate regression model with IL4 (overall model statistical significance p <0.0001), significant predictors of IL4 levels were abdominal circumference (R2=0.059, p=0.0044) and glucose (R2=0.01817, p=0.0139).
Figure 2.
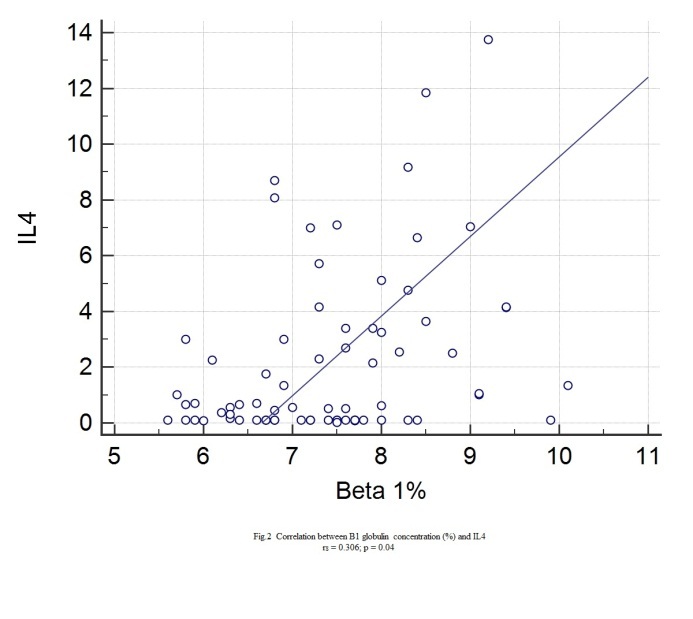
Correlation between IL4 and Beta 1
Figure 3.
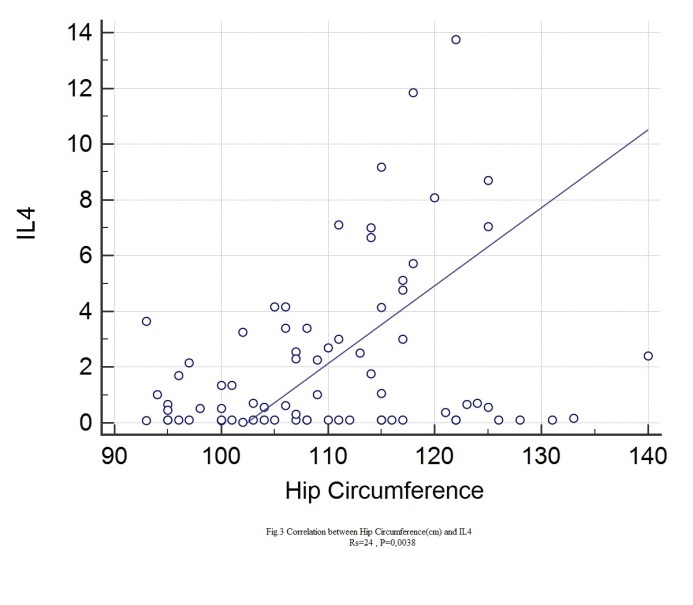
Correlation between IL4 and hip circumference
Figure 4.
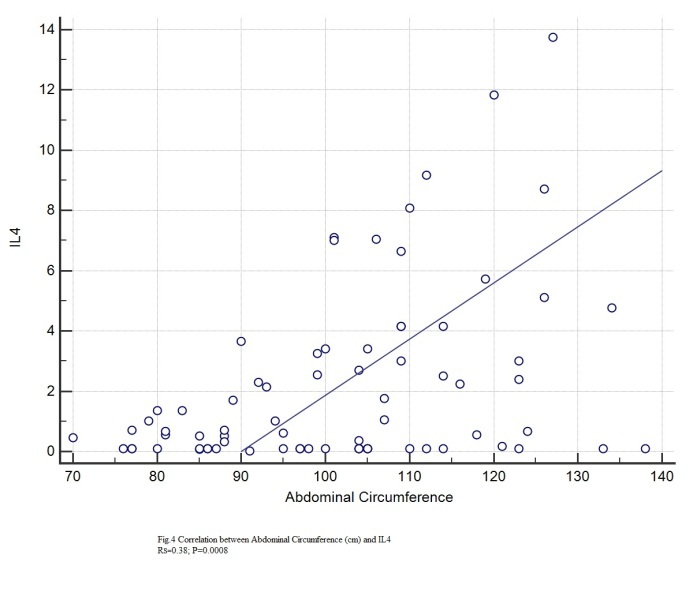
Correlation between IL4 and abdominal circumference
Figure 5.
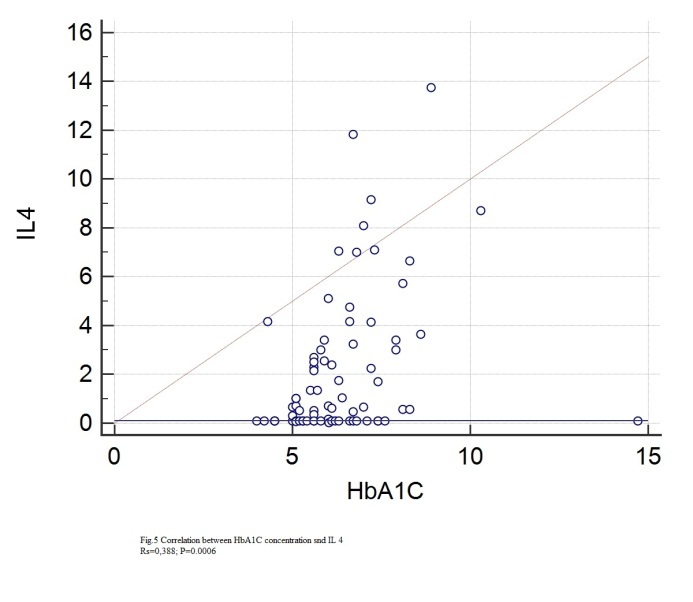
Correlation between IL4 and HbA1C
Figure 6.
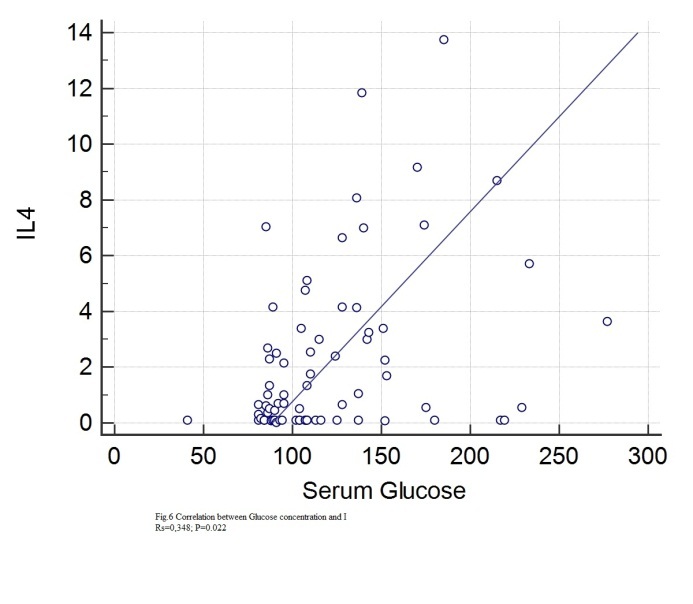
Correlation between IL4 and serum glucose
Figure 7.
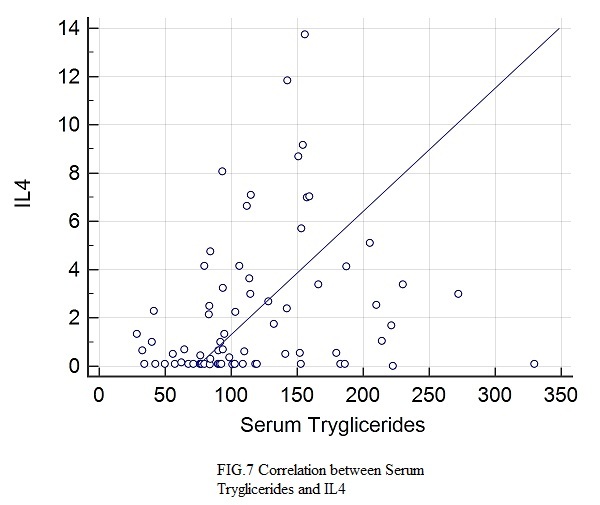
Correlation between IL4 and serum tryglicerides
Figure 8.
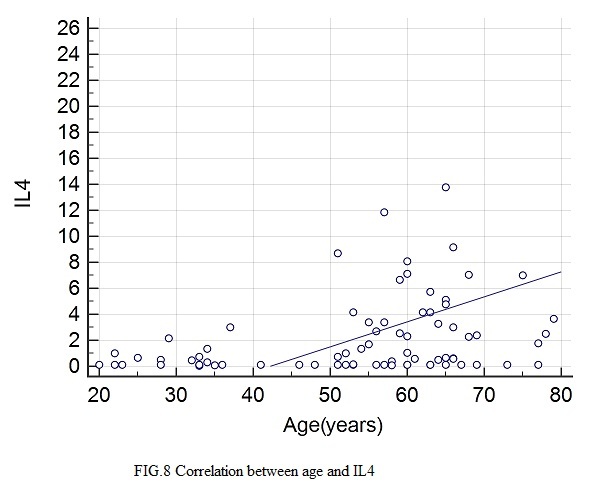
Correlation between IL4 and age
Figure 9.
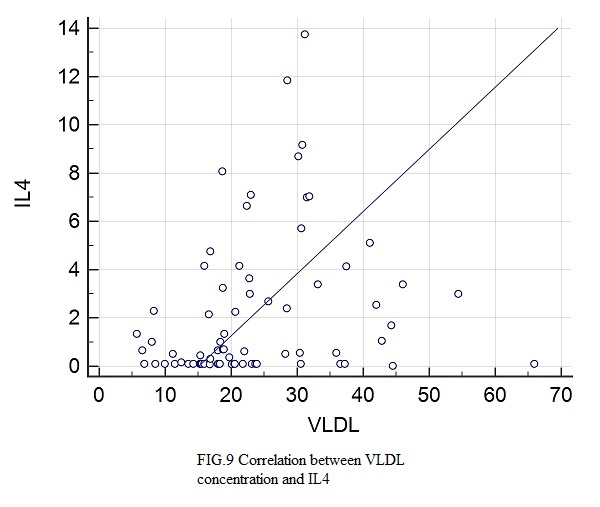
Correlation between IL4 and VLDL
Discussion
Adipose tissue contains, besides adipocytes, several other types of cells, such as pre-adipocytes, macrophages, lymphocytes, fibroblasts and vascular cells [9]. Obesity is associated with changes in the cellular population of the adipose tissue, as well as modulation of cell phenotypes [9],[10]. Expansion of adipose tissue mass, activation of lipolysis, a high fat diet and non-shivering thermogenesis lead to the recruitment and activation of immune cells in the adipose tissue [11]. The immune cells in the adipose tissue are the macrophages (that account for half of the immune cells), mast cells, eosinophils, neutrophils, T lymphocytes, both T helper and invariant Natural Killer T cells (iNKT) (iNKT cells are depleted in the setting of obesity) and B lymphocytes [11]. T helper type 1 lymphocytes (Th1) secrete interleukin 2 (IL2), interferon-g and lymphotoxin-a and stimulate the phagocytic activity, in type 1 immunity. T helper type 2 lymphocytes (Th2) cells secrete IL4, IL5, IL9, IL10 and IL13, stimulating type 2 immunity (humoral immunity, antibody mediated) [12]. After exposure to the above mentioned stimuli, the macrophages from the white adipose tissue undergo alternative activation to induce thyrosine hydroxilase expression and cathecolamine production, factors required for the transformation of the white adipose tissue into beige adipose tissue. Beige fat expresses a thermogenic protein UCP1, that provides defense against cold and obesity. The efferent beige fat thermogenic circuit also comprises eosinophils and type 2 cytokines IL 4 and IL13. It has been shown that genetic loss of IL4 signaling impairs biogenesis of beige fat [3]. IL4 was discovered in 1982 by Maureen Howard and William E. Paul and Dr. Ellen Vitetta. IL-4 is secreted by activated Th2 lymphocytes, basophils, and mast cells, it induces Th2 differentiation, immunoglobulin class switching, and B cell proliferation [13].
In our study, an increase in the IL4 levels was found in the diabetic obese/overweight population. There was a trend of increase in the nondiabetic obese compared to the control group, but the statistical significance threshold was not reached. We found a correlation between IL4 levels on the one hand and obesity (as expressed by BMI, abdominal circumference and hip circumference) and diabetes (serum glucose and glycated hemoglobin) on the other hand. Previous animal studies have found increases of IL4 production by splenic lymphocytes of diet-induced obese mice [14]and a reduction in IL4 serum levels in rats after removal of visceral fat [15]. We have found few studies in humans regarding the relationship between IL4 and obesity. A recent study [16] on cytokines in obese patients failed to find a correlation between obesity and IL4 but IL4 levels were significantly elevated in participants with low physical activity, even when controlled for BMI. Our study has not focused on physical activity, but this could be an interesting direction for further research. The higher levels of IL4 in our obese study groups might be linked to a lesser level of physical activity. In animal studies, IL4 was found to inhibit lipid accumulation in fat tissues [17]. IL4 seems to be an adaptive factor to obesity and/or lack of physical activity, involved in the reduction of fat accumulation. This may explain the higher levels in obese patients. In another human study [18], the expression of IL-4 was significantly higher in the obese subjects and in obese type 2 diabetes mellitus patients than in normal subjects and, moreover, it was reduced after bariatric surgery. There are contrary findings in the literature. One study found lower levels of IL4 in higher BMI groups [19].
We have found a correlation between IL4 levels and serum glucose and glycated hemoglobin. Higher IL 4 serum levels were found in type 1 diabetes mellitus children than those in healthy children [20]. Although not unanimous [21], IL4 was demonstrated to be protective against type 1 diabetes by activated iNKT cells [21] and results from animal studies have shown that IL4 improves insulin sensitivity and glucose tolerance [17]. IL4 has been less studied in type 2 diabetes mellitus. There is data supporting the hypothesis of a state of cytokine resistance to IL4 in type 2 diabetes mellitus [22]. In humans, IL4 promoter polymorphisms were linked to type 2 diabetes mellitus and lower levels of HDL cholesterol [23]. Our findings support the hypothesis that increased serum levels IL4 in type 2 diabetes mellitus may be a result of an adaptive increase of IL4 in a setting of “IL4 resistance”.
We have found an association between abdominal circumference and serum glucose on the one hand and IL4 levels on the other hand. To our knowledge, this is the first study to demonstrate this relationship in humans.
Conclusions
Interleukin 4 was elevated in diabetic and obese patients. Blood glucose and waist circumference were significant predictors of IL4 in the studied group.
Although obesity and diabetes have been extensively studied, there are still missing links in the pathophysiologic mechanisms. Establishing new correlations between clinical parameters, routine laboratory parameters and new factors, such as adipokines could be important in order to achieve a reduction in morbidity and mortality from these diseases.
Acknowledgments
This work is a result of a research made possible by the support of MD Codrin Bernevig and Biologist Andreea Simion from Proton Life Science.
References
- 1.Bastard JP, Maachi M, Lagathu C. Recent advances in the relationship between obesity, inflammation, and insulin resistance. Eur Cytokine Netw. 2006;17(11):4–12. [PubMed] [Google Scholar]
- 2.Lago F, Dieguez C, Gómez-Reino J. Adipokines As Emerging Mediators of Immune Response and Inflammation. Nat Clin Pract Rheumatol. 2007;3(12):716–724. doi: 10.1038/ncprheum0674. [DOI] [PubMed] [Google Scholar]
- 3.Qiu Y, Nguyen KD, Odegaard JI. Eosinophils and type 2 cytokine signaling in macrophages orchestrate development of functional beige fat. Cell. 2014;157(6):1292–1308. doi: 10.1016/j.cell.2014.03.066. [DOI] [PMC free article] [PubMed] [Google Scholar]
- 4.El-Wakkad A, Hassan Nel-M, Sibaii H. Proinflammatory, anti-inflammatory cytokines and adiponkines in students with central obesity. Cytokine. 2013;61(2):682–687. doi: 10.1016/j.cyto.2012.11.010. [DOI] [PubMed] [Google Scholar]
- 5.Su SC, Pei D, Hsieh CH. Circulating pro-inflammatory cytokines and adiponectin in young men with type 2 diabetes. Acta Diabetol. 2011;48(2):113–119. doi: 10.1007/s00592-009-0171-y. [DOI] [PubMed] [Google Scholar]
- 6.Wieser V, Moschen AR, Tilg H. Inflammation, cytokines and insulin resistance: a clinical perspective. Arch Immunol Ther Exp (Warsz) 2013;61(2):119–125. doi: 10.1007/s00005-012-0210-1. [DOI] [PubMed] [Google Scholar]
- 7.De Luca C, Olefsky JM. Inflammation and Insulin Resistance. FEBS letters. 2008;582(1):97–105. doi: 10.1016/j.febslet.2007.11.057. [DOI] [PMC free article] [PubMed] [Google Scholar]
- 8.Mohammed Qatanani, Mitchell A Lazar. Mechanisms of obesity-associated insulin resistance: many choices on the menu. Genes & Dev. 2007;21:1443–1455. doi: 10.1101/gad.1550907. [DOI] [PubMed] [Google Scholar]
- 9.Ouchi N, Parker JL, Lugus J. Adipokines in inflammation and metabolic disease. Nat Rev Immunol. 2011;11(2):85–97. doi: 10.1038/nri2921. [DOI] [PMC free article] [PubMed] [Google Scholar]
- 10.Fusaru Ana Marina, Stănciulescu Camelia Elena, Şurlin V, Taisescu C, Bold Adriana, Pop OT, Baniţă Ileana Monica, Crăiţoiu Ştefania, Pisoschi Cătălina Gabriela. Role of innate immune receptors TLR2 and TLR4 as mediators of the inflammatory reaction in human visceral adipose tissue. Rom J Morphol Embryol. 2012; 53(3):693–701. [PubMed] [Google Scholar]
- 11.Ferrante AW Jr. The immune cells in adipose tissue. Diabetes Obes Metab. 2013;15( Suppl 3):34–38. doi: 10.1111/dom.12154. [DOI] [PMC free article] [PubMed] [Google Scholar]
- 12.Spellberg B1, Edwards JE Jr. Type 1/Type 2 immunity in infectious diseases. Clin Infect Dis. 2001;32(1):76–102. doi: 10.1086/317537. [DOI] [PubMed] [Google Scholar]
- 13.Nelms K, Keegan AD, Zamorano J. The IL-4 receptor: signaling mechanisms and biologic functions. Annu Rev Immunol. 1999;17:701–738. doi: 10.1146/annurev.immunol.17.1.701. [DOI] [PubMed] [Google Scholar]
- 14.Mito N, Hosoda T, Kato C. Change of cytokine balance in diet-induced obese mice. Metabolism. 2000;49(10):1295–1300. doi: 10.1053/meta.2000.9523. [DOI] [PubMed] [Google Scholar]
- 15.Borst SE, Conover CF, Bagby GJ. Association of resistin with visceral fat and muscle insulin resistance. Cytokine. 2005;32(1):39–44. doi: 10.1016/j.cyto.2005.07.008. [DOI] [PubMed] [Google Scholar]
- 16.Schmidt FM, Weschenfelder J, Sander C. Inflammatory Cytokines in General and Central Obesity and Modulating Effects of Physical Activity. PLoS ONE. 2015;10(3) doi: 10.1371/journal.pone.0121971. [DOI] [PMC free article] [PubMed] [Google Scholar]
- 17.Chang YH, Ho KT, Lu SH. Regulation of glucose/lipid metabolism and insulin sensitivity by interleukin-4. Int J Obes (Lond) 2012;36(7):993–998. doi: 10.1038/ijo.2011.168. [DOI] [PubMed] [Google Scholar]
- 18.Dandona P, Ghanim H, Monte SV. Increase in the mediators of asthma in obesity and obesity with type 2 diabetes: reduction with weight loss. Obesity (Silver Spring) 2014;22(2):356–362. doi: 10.1002/oby.20524. [DOI] [PubMed] [Google Scholar]
- 19.Semenchenko IIu, Sharafetdinov KhKh, Plotnikova OA. [Markers of immune inflammation in patients with type 2 diabetes and obesity] Vopr Pitan. 2013;82(5):46–50. [PubMed] [Google Scholar]
- 20.Dai YL, Fu JF, Liang L, Dong GP. [A 10-year review of childhood type 1 diabetes mellitus and the clinical value of interleukin-10 in diabetic ketoacidosis] Zhongguo Dang Dai Er Ke Za Zhi. 2010;12(11):849–854. [PubMed] [Google Scholar]
- 21.Falcone M1, Yeung B, Tucker L. IL-4 triggers autoimmune diabetes by increasing self-antigen presentation within the pancreatic Islets. Clin Immunol. 2001;98(2):190–199. doi: 10.1006/clim.2000.4979. [DOI] [PubMed] [Google Scholar]
- 22.O’Connor JC, Sherry CL, Guest CB. Type 2 diabetes impairs insulin receptor substrate-2-mediated phosphatidylinositol 3-kinase activity in primary macrophages to induce a state of cytokine resistance to IL-4 in association with overexpression of suppressor of cytokine signaling-3. The Journal of Immunology. 2007;178(11):6886–6893. doi: 10.4049/jimmunol.178.11.6886. [DOI] [PubMed] [Google Scholar]
- 23.Ho KT, Shiau MY, Chang YH. Association of interleukin-4 promoter polymorphisms in Taiwanese patients with type 2 diabetes mellitus. Metabolism. 2010;59(12):1717–1722. doi: 10.1016/j.metabol.2010.04.010. [DOI] [PubMed] [Google Scholar]


