Abstract
Echinacea species are popularly included in various formulations to treat upper respiratory tract infections. These products are of commercial importance, with a collective sales figure of $132 million in 2009. Due to their close taxonomic alliance it is difficult to distinguish between the three Echinacea species and incidences of incorrectly labeled commercial products have been reported. The potential of hyperspectral imaging as a rapid quality control method for raw material and products containing Echinacea species was investigated. Hyperspectral images of root and leaf material of authentic Echinacea species (E. angustifolia, E. pallida and E. purpurea) were acquired using a sisuChema shortwave infrared (SWIR) hyperspectral pushbroom imaging system with a spectral range of 920–2514 nm. Principal component analysis (PCA) plots showed a clear distinction between the root and leaf samples of the three Echinacea species and further differentiated the roots of different species. A classification model with a high coefficient of determination was constructed to predict the identity of the species included in commercial products. The majority of products (12 out of 20) were convincingly predicted as containing E. purpurea, E. angustifolia or both. The use of ultra performance liquid chromatography-mass spectrometry (UPLC-MS) in the differentiation of the species presented a challenge due to chemical similarities between the solvent extracts. The results show that hyperspectral imaging is an objective and non-destructive quality control method for authenticating raw material.
Keywords: Echinacea, chemometrics, hyperspectral imaging, principal component analysis, partial least squares discriminant analysis, quality control
1. Introduction
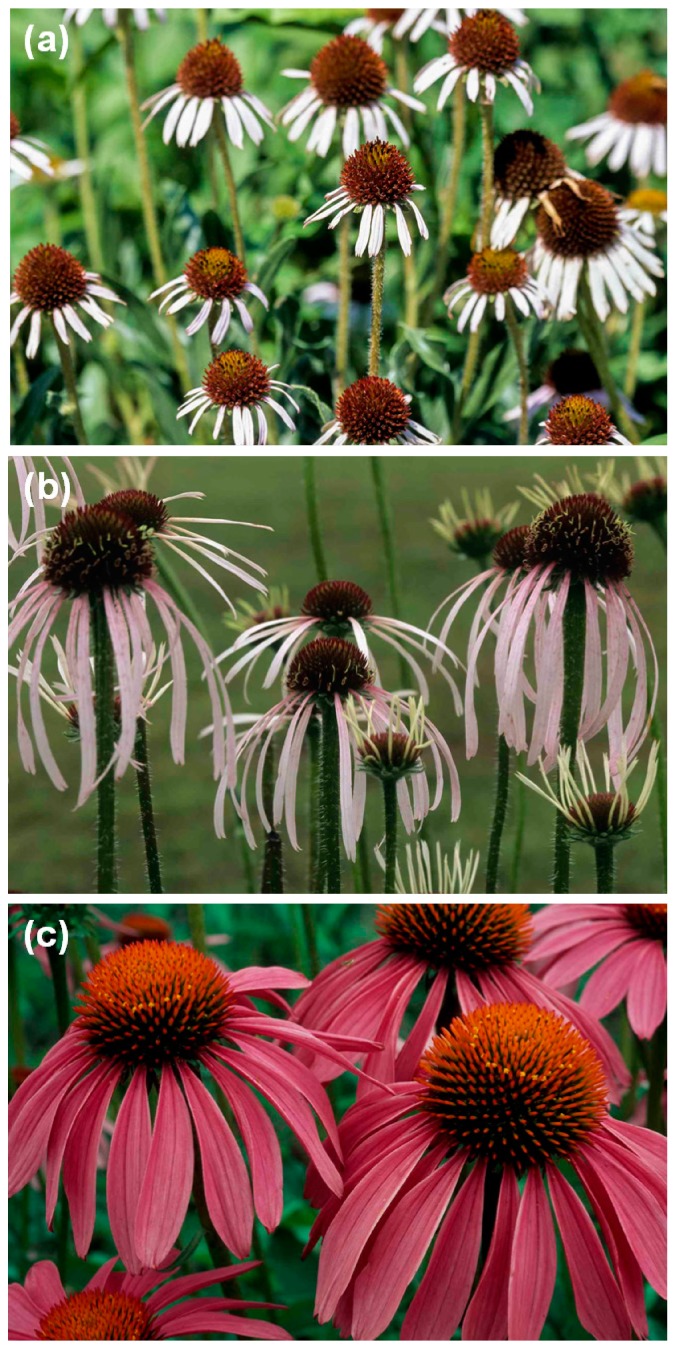
Echinacea species have a long history of use as traditional medicine to treat various ailments, including infections such as syphilis and septic wounds, cough, sore throat and tonsillitis. The three species currently used medicinally and most commonly to treat the common cold, influenza-like illnesses and upper respiratory tract infections (URTIs) are Echinacea angustifolia DC., Echinacea pallida (Nutt.) Nutt. and Echinacea purpurea (L.) Moench [1,2]. Echinacea species (Figure 1) have collectively been referred to as purple cornflower and pre-1968, E. angustifolia and E. pallida were considered to be varieties of the same species. Echinacea pallida is sometimes referred to as pale coneflower or pale purple coneflower and E. angustifolia is known as narrow leaf purple coneflower or Kansas snakeroot. A revision of the species suggested the following nomenclature; E. pallida var. angustifolia (DC.) Cronq. and E. pallida var. pallida (Nutt.) Cronq but the three species (E. angustifolia, E. pallida and E. purpurea) are still separately indicated on commercial products and will therefore be referred to as such in this study. Clinical trials to investigate the effectiveness of Echinacea preparations in the treatment of URTIs have reported effects superior to placebo, but the phytochemical diversity makes the interpretation of research findings difficult [1]. A structured review on clinical trials concluded that Echinacea use has no benefit in the treatment and prevention of colds [2]. Despite the publication of some negative research results, Echinacea products remain extremely popular, and are still frequently mentioned and/or promoted in the media and are commercially important. In the United States of America, annual sales of all Echinacea products exceeded $200 million in 2000 and 2001 whereafter it steadily declined to about $129 million in 2006 [3]. According to the Nutrition Business Journal, Echinacea sales rose to $132 million in 2009 [4] and it is still one of the best-selling herbal preparations in the USA [1].
Figure 1.
Photographs of the three Echinacea species: (a) E. angustifolia; (b) E. pallida; and (c) E. purpurea.
There is variation in the chemical constituents of Echinacea between the different species and within different plant parts. The main chemical constituents include alkamides, phenylpropanoids, polysaccharides and volatile oils, as well as minor constituents such as flavonoids. The chemical composition, including alkamide content, determined using liquid chromatography, is traditionally used to establish the quality of plant material and preparations, as well as to identify the species [1]. According to a review by Barnes [1], several poor quality products have been identified, some not stating the species or plant parts used and others purporting to contain a certain species while in fact it does not. Of 59 commercial products analysed, 28 (48%) did not contain the species claimed on the label. Clearly, developing methods that can rapidly authenticate plant material will have a positive impact on the quality of products distributed to consumers.
While the interchangeable use of the three Echinacea species in commercial products has not been reported as posing any potential risk, evidence of pharmacological equivalence of these species has not been clearly demonstrated. The phytochemical diversity in the raw materials (species) and commercial products that are widely available as directly pressed juices, ethanolic or hydrophilic extracts, powdered leaves, flowers and roots as well as extracts standardised to marker constituents such as phenolic acid or echinacoside content may raise concerns relating to efficacy [5]. Research on the efficacy of Echinacea raw materials and commercial products as immunomodulating agents has been conducted both in vitro and in vivo. Evidence of varying degrees of efficacy of Echinacea was demonstrated in mouse models where E. purpurea demonstrated superior immunomodulation activity compared to E. angustifolia and E. pallida [6]. In a separate study, E. purpurea whole powder again demonstrated consistently high macrophage activation, while products standardised to marker constituents were found to be inactive as immunomodulators [7]. A high degree of variability among similarly standardised extracts was also observed. A comprehensive review on the quality and pharmacological activities of Echinacea raw materials and commercial products reports on the inconsistencies in product quality while pre-clinical and clinical studies on many commercial products do not demonstrate pharmacological equivalence among products [3]. This variation between products and subsequent implications on efficacy should be considered important consumer information which may assist in the choice of product. To date however, there is no consensus with regards to the species, plant part or extraction methods that yields a product with the most desirable pharmacological activity.
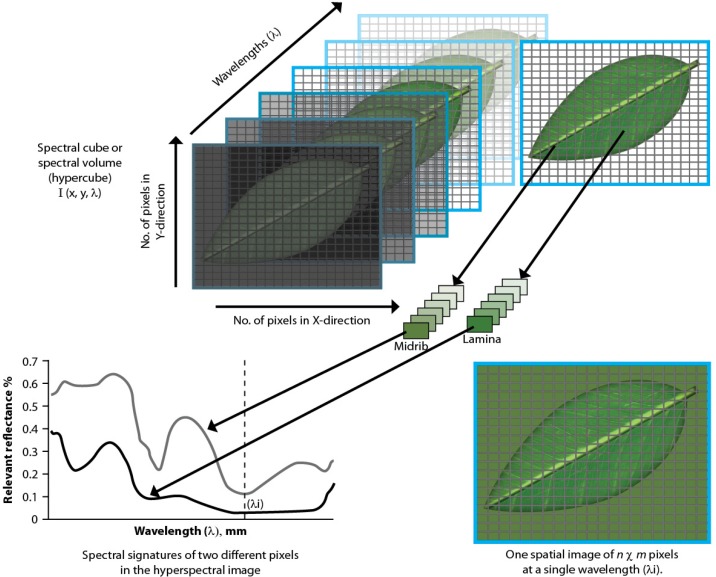
Hyperspectral imaging (HSI) acquires both spectral and spatial information from a sample through a combination of conventional spectroscopy and imaging [8]. It has been used with success as an analytical tool to assess raw material and product quality in the agricultural, food and beverage and pharmaceutical industries amongst others [8,9], where non-destructive analyses can be performed in a much shorter time compared to conventional analysis methods such as liquid chromatography. In hyperspectral imaging, a hypercube is created through the combination of two spatial (x;y) and one wavelength (λ) dimension (Figure 2). Images are collected as a function of wavelength resulting in a stack of images referred to as a hypercube. At any wavelength, the image comprises of several pixels (2D-squares) where each pixel represents a spectrum containing point chemical information. The images are then analysed to identify wave regions where chemical differences are observed within the sample under investigation (Figure 2). The inclusion of spatial information yields more information about a sample and unknown samples can be more accurately predicted in some cases as compared to single-point spectroscopy. Multivariate analysis tools such as principal component analysis (PCA) and partial least squares (PLS) analysis are used to reduce the high dimensionality of data and to display compositional differences in an image enabling the development of models that can be used for quality control purposes [8,10,11].
Figure 2.
An illustration of a spectral hypercube created through the combination of two spatial (x;y) and one wavelength (λ) dimension in hyperspectral imaging.
The aim of this study was to investigate the potential of hyperspectral imaging in combination with multivariate data analysis to distinguish between the three commercially important Echinacea species and to correctly identify the Echinacea species present in commercial products.
2. Results and Discussion
2.1. Image Analysis Using PCA
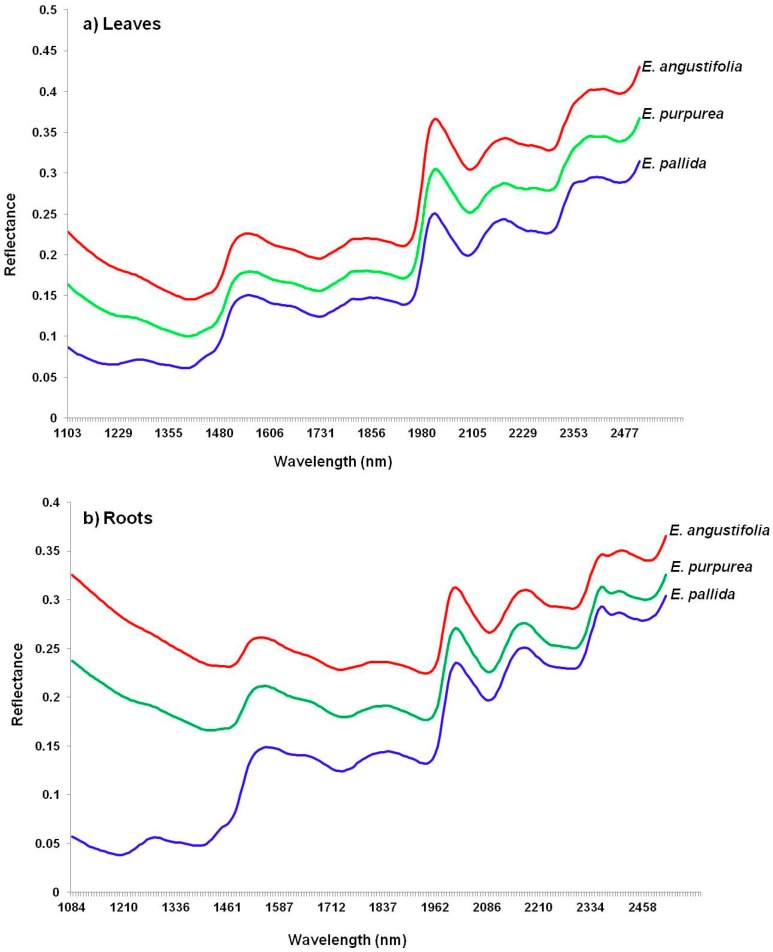
Figure 3 displays NIR spectra of both leaf (a) and root (b) powders for the three Echinacea species. The spectral patterns do not show distinctive features that can be used to differentiate the species and hence the need for PCA which provides visual plots such as score images and scatter plots to observe clearer differences.
Figure 3.
NIR imaging spectra of (a) Echinacea leaves and (b) roots showing similar spectral patterns of the three species.
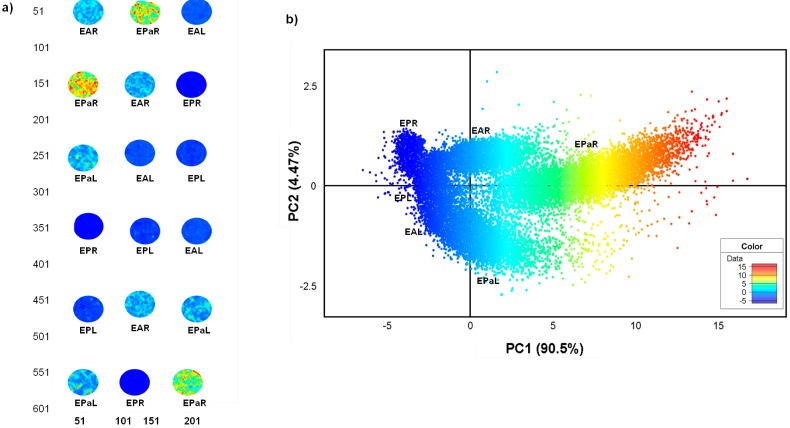
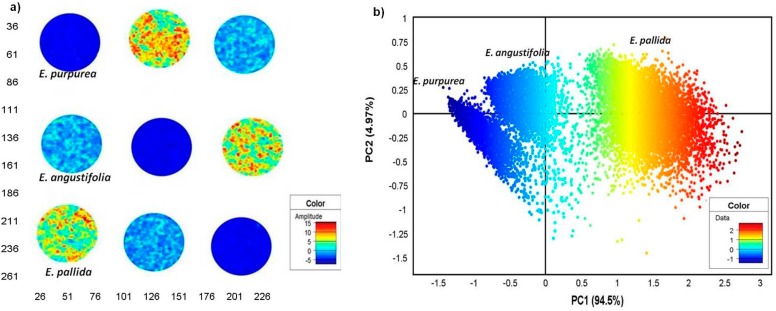
The interactive score image and scatter plots were coloured according to the score values of PCs. The score image is an amplitude plot where similar colours represent similar score values and vice-versa. Principal component analysis of the root and leaf image showed a clear separation of E. pallida from the other two species based on the colour amplitude, as observed in the PCA score image of the first PC (t1) after mean centering and standard normal variate (SNV) correction was applied to the data (Figure 4a). Replicate E. pallida root samples (EPaR) showed a consistently distinct high colour amplitude (yellow-red) compared to the other species, evidence that its chemical profile differed significantly from the other species. As observed for the root powders, E. pallida leaf (EPaL) also showed a higher colour profile (light blue) compared to leaves of E. angustifolia (EAL) and E. purpurea (EPL) that had low amplitude of -5 (dark blue) (Figure 4a).
Figure 4.
PCA score image (t1) of Echinacea root and leaf powders showing distinction of the three species based on colour amplitudes (a). The corresponding score plot (PC1 vs. PC2) shows distinct pixel clusters coloured according to score values that correspond to the images (b). (EAL—E. angustifolia leaf, EPL—E. purpurea leaf, EPaL—E. pallida leaf, EAR—E. angustifolia root, EPR—E. purpurea root, EPaR—E. pallida root).
The corresponding scatter plot shows pixels coloured according to score values which correlates to the amplitudes scale in the score image. Using PCA, chemical variation was observed within the HSI data which revealed 6 pixel clusters with each cluster representing plant parts of different species (Figure 4b). The cumulative chemical variation modeled using three principal components (PCs) was 97.2% (R2Xcum = 0.972). The variation of 90.5% along PC1 was responsible for separating mainly the root powders where E. pallida (EPaR) was shown to be the most distinct with its pixel cluster (highest score value-red yellow) falling on the far positive PC1. The E. angustifolia root cluster (EAR) showed pixels with lower score values spanning Y = 0 region, while E. purpurea root pixels (EPR) occupied negative PC1 (Figure 4b). The observation supports results of the score image where maximum variance modeled along PC1 was shown to differentiate mainly the root samples. Distinction of the leaf samples was observed along PC2 in the scatter plot; however, the variation appears minimal (4.47%) since the presence of root samples influenced variation within the model.
To obtain a clearer picture of the chemical distinction of the root samples, it was necessary to model these separately from the leaves to eliminate the influence of the leaf chemistry on the model. Figure 5a is a score image of PC1 which showed three distinct colour amplitudes, each representing a different species. As observed in Figure 4a, E. pallida displayed the highest colour amplitude (orange-yellow) while E. angustifolia (light blue) and E. purpurea (dark blue) showed lower amplitudes that differed slightly. The corresponding scatter 2D density plot demonstrated a clear separation of the three pixel clusters along PC1 with 94.5% chemical variation in the data cube attributed to the distinction of the three species (Figure 5b).
Figure 5.
PCA score image (t1) of Echinacea root powders showing distinction of the three species based on colour amplitudes (a). The corresponding score plot (PC1 vs. PC2) shows distinct pixel clusters coloured according to score values that correspond to the images (b). (EAR—E. angustifolia root, EPR—E. purpurea root, EPaR—E. pallida root).
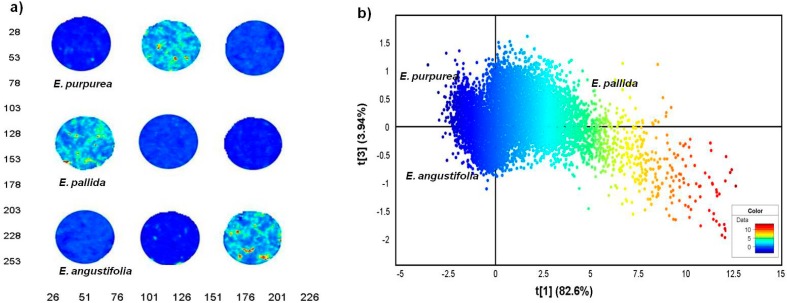
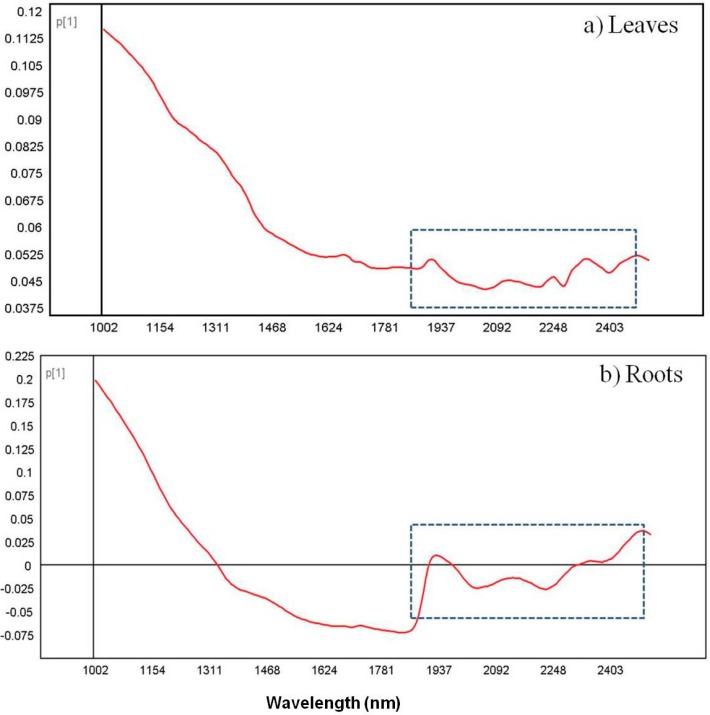
The distribution of the pixel clusters along PC1 was consistent with Figure 4b, only clearer. The results for the root samples demonstrate that the three Echinacea species have distinct chemical profiles which was easily identified using NIR chemical imaging. To analyse the leaf data clearly, the leaf samples were modeled separately to exclude the influence from the roots. Figure 6a shows the score image where E. pallida displayed colour distinction (light blue-yellow) while similarities between E. angustifolia and E. purpurea leaves (dark blue) were evident. The corresponding scatter 2D plot of pixels demonstrates separation of the E. pallida cluster from the other two species along PC1. The majority of the variance was captured in the first two PCs with PC1 accounting for 82.6% of the data and 3.94% in PC2 (Figure 6b). It is clear from the plots that the leaf chemistry of the three species is less varied as demonstrated by the variance parameters. However, E. pallida demonstrated chemical distinction compared to the other species as identified by HSI and multivariate data analysis techniques. To investigate the differences observed in the score images of the leaves and roots, loadings line plots of the first vector (P1) were constructed for the leaf model (Figure 7a) and the roots model (Figure 7b). The loadings plots show the region between 1937–2400 nm as carrying discriminating information of the three species based on both the leaf and the root chemistry. In both cases, positive (peaks) and negative loadings (troughs) were recorded in this region and these regions could be further investigated for molecular signals that can be assigned to specific plant species.
Figure 6.
PCA score image (t1) of Echinacea leaf powders based on colour amplitudes (a). The corresponding score plot (PC1 vs. PC3) shows minimal separation of the pixel clusters (b). (EAL—E. angustifolia leaf, EPL—E. purpurea leaf, EPaL—E. pallida leaf).
Figure 7.
Loadings line plot of vector P1 for the leaf score image (a) and the root score image (b) showing variables responsible for separation of the three species.
Based on these observations, it is evident that the use of NIR chemical imaging for the qualitative differentiation of Echinacea species presents a promising visual technique in the quality control of the raw material. The root chemistry of the species presents a better choice for analysis; however, the minor chemical differences between leaf samples can also be detected using the imaging tool. Previous reports on the chemical profiling of Echinacea species have reported marked differences between E. angustifolia and E. pallida that were previously regarded as varieties of the same species until they were taxonomically revised in 1968 [12]. In this study, E. pallida has demonstrated a distinct chemical profile that could be observed in both root and leaf samples.
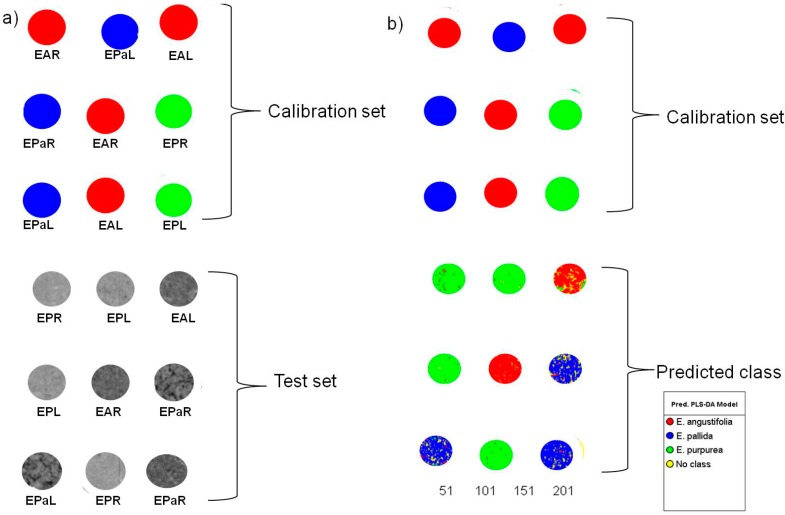
Having successfully established that HSI can distinguish between the three Echinacea species, the next objective was to develop a PLS-DA model to predict the identity of commercial Echinacea products introduced into the model as an external dataset. Since many Echinacea products are prepared using both the leaf and root materials, a model that included both the leaves and the roots was constructed. Ultimately the model predictions would then identify the species present but not specify whether the material used was the root, leaf or both. Figure 8a is a PLS 1 Y-image of the PLS-DA model where the calibration set showed each species (class) assigned a different colour while the background or some unknown areas were classified as “no class” implying that the sample/region within the image could not be correlated to the modeled data. The test set samples (grey-scale) were excluded for external validation of the model where the correct identities were known. Introducing the external test set into the PLS-DA calibration model provided results shown in Figure 8b. The predicted classes of the test samples were in agreement with prior knowledge on identities of the samples based on the colour coding. There were however regions that were misclassified within the samples which can be attributed to chemical similarities between the species and hence the overlap in the pixel data. The PLS-DA model however exhibited good model statistics with R2Xcum of 0.980 and cumulative variation of Y (Q2Ycum) of 0.779 that could be predicted by three components which was subsequently used for class prediction of external samples.
Figure 8.
PLS-DA Y-image showing calibration samples used to build the model and test samples that were excluded for model validation (a). The predictions show test samples assigned to classes that correspond to the species imaged (b) (EAL—E. angustifolia leaf, EPL—E. purpurea leaf, EPaL—E. pallida leaf, EAR—E. angustifolia root, EPR—E. purpurea root, EPaR—E. pallida root).
2.2. Class Prediction of Commercial Echinacea Samples
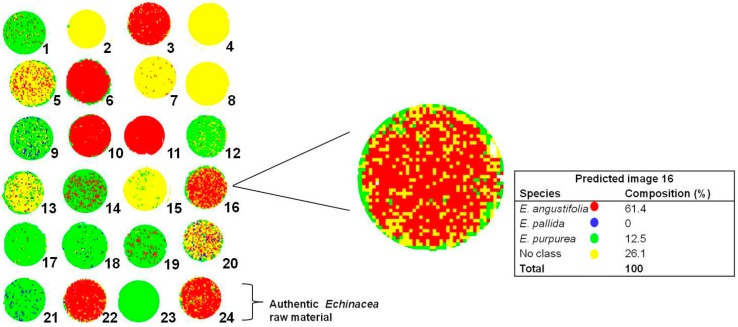
Twenty commercial Echinacea samples and four authentic Echinacea raw material control samples captured as a single image were introduced into the PLS-DA model for class prediction. Figure 9 shows the PLS-DA prediction image after matching the chemical profiles of the products to the authentic Echinacea samples.
Figure 9.
PLS prediction images (t1) of Echinacea commercial products and authentic raw material showing variation in the chemical composition of Echinacea commercial products. The enlarged insert demonstrates the predicted levels of each species in product 16.
The predictions are represented by colour where E. angustifolia is represented in red, E. pallida in blue and E. purpurea in green. The results indicate that 12 out of 20 products were correctly classified (indicated with a) with the HSI class prediction matching the product label. The remaining eight products were misclassified (indicated with b) as the HSI prediction did not match the product label. Seven of the 20 products contained high levels of E. purpurea (1, 9, 12, 14, 17, 18 and 19) while five products contained high levels of E. angustifolia (3, 6, 10, 11 and 16). Five of the 20 products (2, 4, 7, 8, and 15) seemed to present a completely different profile to the powdered authentic Echinacea species and hence these were identified as no class (yellow). Upon investigation it was discovered that most of the samples predicted as ‘no class’ were either labeled as extracts or concentrates of Echinacea and not unprocessed raw material. As chemical processing alters the chemistry of the products, this presents chemical variation between the modeled and predicted samples and hence the products were not classified as Echinacea. In some images (5, 13 and 20) the ‘no class’ prediction was more prominent while trace amounts of one or two Echinacea species was detected. The observation can be explained by the presence of excipients such as magnesium stearate in the formulations in greater proportions compared to Echinacea raw material.
Multi-ingredient formulations containing other herbs such as garlic, parsley and goldenseal were also predicted as containing trace amounts of the Echinacea species while the majority of the constituents could not be classified (Product 20). The last sample row in the image containing authentic Echinacea raw material as a control demonstrates the accuracy of the model in predicting Echinacea raw material. The four samples (21, 22, 23 and 24) were correctly identified where the major species predicted to be dominant in the sample matched the species imaged (root and/or leaf samples). The potential of HSI in determining the presence or absence of Echinacea raw material in both commercial products and raw material samples has been demonstrated.
In addition to a qualitative assessment of the product composition, it was also possible to predict the percentage composition of the constituent species within a product by highlighting the species in the image and obtaining the corresponding prediction table as demonstrated in Figure 9 (insert). The quantitative predictions are reported in Table 1 together with a comparison of the product label. Table 1 shows that most of the commercial products does contain Echinacea raw material in high levels and most of the HSI results are in agreement with the label claim. However, HSI analysis detected the presence of more than one species in many of the products. According to Table 1, E. purpurea and E. angustifolia seem to be the raw materials of choice in many products while E. pallida is rarely used. Only two products were labeled as containing E. pallida; however, according to the predictions, E. purpurea was identified as occurring in higher proportions in both cases while the presence of E. pallida was almost negligible (<10%).
Table 1.
Results of the HSI classification analysis using the (PLS-DA) model in comparison to the product label.
| Product | Product Label Claim | HSI Species Predictions (%) | |||
|---|---|---|---|---|---|
| E. angustifolia | E. purpurea | E. pallida | No Class | ||
| 1 | E. purpurea (herb, root) & E. angustifolia herb | 1.9 | 89.8 a | 0 | 8.3 |
| 2 | E. angustifolia root extract | 0 | 0 | 0.2 | 99.8 b |
| 3 | E. purpurea root & aerial parts | 89.3 a | 2.6 | 0.2 | 7.9 |
| 4 | E. purpurea Herba & Radix dry concentrate | 0 | 0 | 0 | 100 b |
| 5 | E. purpurea & E. angustifolia | 14.3 | 7.7 | 1.2 | 76.8 b |
| 6 | E. purpurea root & E. angustifolia root | 94.6 a | 5.4 | 0 | 0.1 |
| 7 | Echinacea purpurea extract | 0 | 0 | 0 | 100 b |
| 8 | E. purpurea Herba & E. purpurea Radix | 0 | 0 | 0 | 100 b |
| 9 | E. pallida | 0 | 72.2 a | 7.4 | 20.4 |
| 10 | E. purpurea root & E. angustifolia root | 86.7 a | 12.6 | 0 | 0.7 |
| 11 | E. angustifolia root | 99.5 a | 0 | 0.1 | 0.4 |
| 12 | E. purpurea herb | 0.2 | 73.2 a | 0.2 | 26.4 |
| 13 | E. pallida (outer label) & E. purpurea (inner label) | 1.3 | 22.9 | 2.4 | 73.3 b |
| 14 | Echinacea aerial powder & root powder | 9.2 | 90.1 a | 0 | 0.7 |
| 15 | E. angustifolia root & rhizome | 0 | 0 | 0 | 100 b |
| 16 | E. purpurea stem, leaf, flower | 61.8 a | 12.1 | 0 | 26.1 |
| 17 | E. purpurea root | 0.2 | 95.4 a | 0 | 4.4 |
| 18 | Echinacea blend (angustifolia, pallida, purpurea) | 0.1 | 92.4 a | 2 | 5.6 |
| 19 | Echinacea leaf powder & standardised extract | 4.9 | 88.5 a | 0 | 6.6 |
| 20 | Echinacea, Goldenseal, Elderberry, Garlic & Parsley | 16.3 | 8.1 | 9.4 | 66.3 b |
| 21 | E. purpurea leaf (authentic raw material) | 0.1 | 90.2 a | 6.5 | 3.3 |
| 22 | E. angustifolia root (authentic raw material) | 89.1 a | 3.5 | 0.4 | 7 |
| 23 | E. purpurea root (authentic raw material) | 0 | 97.5 a | 0 | 2.5 |
| 24 | E. angustifolia leaf (authentic raw material) | 64.2 a | 6.4 | 1.8 | 27.5 |
a The formulation was predicted to contain the indicated species in highest proportions. b The formulation was predicted to contain little or no authentic Echinacea raw material.
2.3. Ultra Performance Liquid Chromatography-Mass Spectrometry (UPLC-MS) Analysis
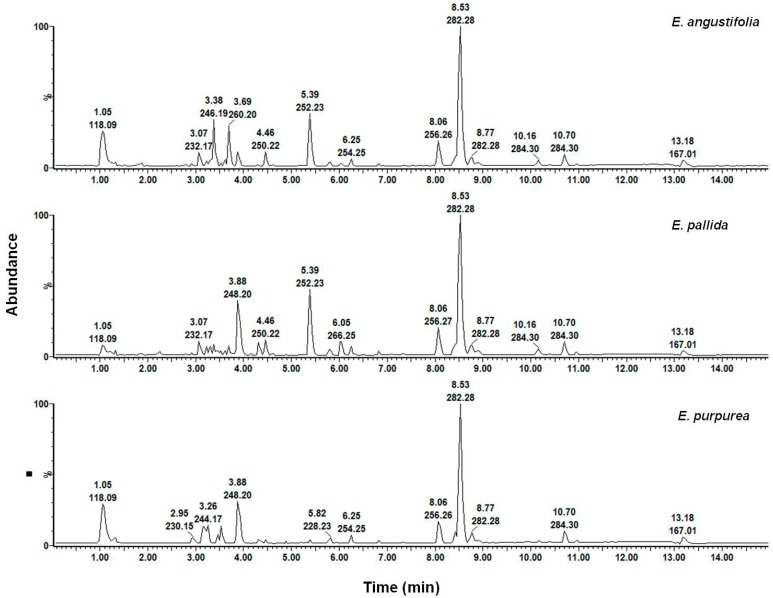
In order to confirm the HSI predictions, UPLC-MS was used to analyse both the raw materials and the products to determine the botanical species in the products. Three solvent systems (methanol, hexane and chloroform), previously reported to provide some distinction between the three Echinacea species, were used. Only the methanol and hexane root extracts were used for product classification as the leaf chromatograms did not display any clear distinction between the three species. Additionally, the chloroform root profiles were very similar to that of hexane, therefore only the hexane chromatograms will be presented for discussion. The BPI chromatograms of each product were qualitatively assessed against the chromatograms of the three different species to identify similarities or differences in the chemical profiles, but marked chemical similarities of the solvent extracts of the three species were observed. Figure 10 shows the BPI chromatograms of the methanol root extracts for the authentic raw materials. The chromatograms demonstrate marked similarities between the three species with the major peaks present in all three species.
Figure 10.
Chromatographic fingerprints of methanol root extracts of Echinacea species.
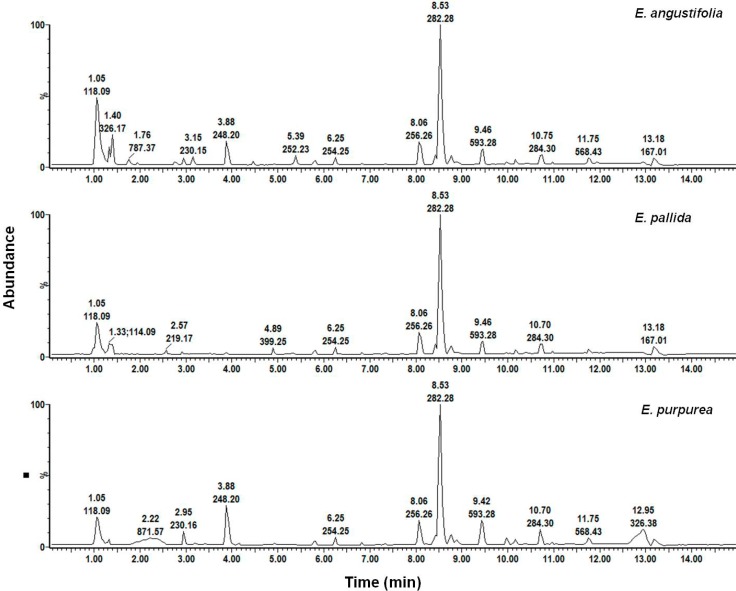
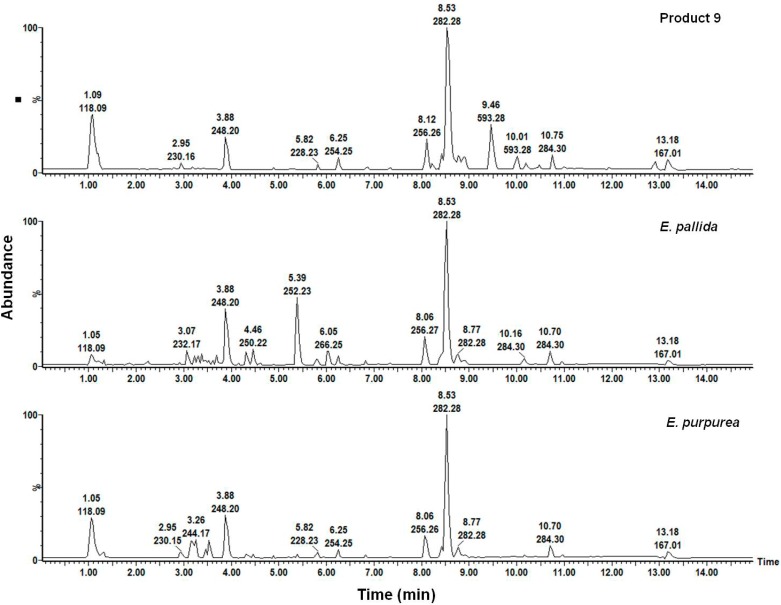
An inspection of the methanol leaf chromatograms (Figure 11) showed similarities in the major peaks, thus both methanol and hexane root extracts presented a challenge in their usefulness to differentiate between the three species. Closer inspection of the methanol chromatograms revealed that minor peaks in the region between 3–5 min appeared to be unique to a species and were therefore selected for qualitative assessment. The methanol chromatogram of product 9, which was labeled as E. pallida but predicted as E. purpurea, was compared to the chromatograms of the authentic material.
Figure 11.
Chromatographic fingerprints of methanol leaf extracts of Echinacea species.
Figure 12 shows that product 9 was devoid of a signal present in E. pallida at Rt 5.39 min (mz−1 = 252.23). Additionally, a minor characteristic peak unique to E. purpurea at Rt 4.89 min (mz−1 = 277.22) is also present in product 9. Based on this comparison it was possible to confirm the HSI prediction that product 9 contains E. purpurea instead of E. pallida as claimed on the product label. The shortfalls of using UPLC-MS as a tool for the qualitative differentiation of Echinacea species and classification of commercial products were demonstrated due to the chemical similarities of the solvent extracts obtained from the raw materials. On the other hand, because HSI presents chemical profiles of the whole metabolome in an untargeted approach, it allows for any possible differences in the composition of the raw material to be detected using this approach in a simple manner.
Figure 12.
A comparison of the methanol root extracts of product 9 and two Echinacea species.
Chemical maps in the form of colour images provide a visual assessment of the composition of the raw materials and the products. Where multiple constituent species are present, it is also easy to detect. This study also highlighted labeling errors as previously reported. The outer packaging of product 13 stated that E. pallida was used. The same product had an inner package insert that stated that E. purpurea was used. This product contained 22.4% of E. purpurea according to HSI prediction. Product 18 purported to contain an Echinacea blend with all three species. The HSI results revealed 92.4% E. purpurea, 0.1% E. angustifolia and 2.0% E. pallida. The question then arises: can this truly be described as a blend if it contains only 0.1% and 2.0% of the species which are considered part of the blend? A blend has not been defined and it is clear that specifications for herbal products need to be set and enforced. However, in order to achieve this, good quality control methods such as HSI need to be developed and implemented.
3. Experimental Section
3.1. Sample Preparation
American Herbal Pharmacopoeia® (AHP)-certified reference material (root and leaf specimens) of E. angustifolia, E. pallida and E. purpurea were purchased from the American Herbal Products Association (AHPA, Silver Spring, MD, USA). Twenty commercial products claiming to contain Echinacea were purchased from local retail outlets in South Africa, as well as international suppliers. Both the botanical reference standards (roots and leaves) and products (capsule contents and tablets) were powdered to attain homogeneity using a Retsch® 400 MM ball mill (Haan, Germany) at a frequency of 30 Hz for 30 s. The powders were sieved through a 500 µm sieve (Endecotts Ltd., London, England) to ensure uniform particle size distribution and filled into plastic containers with a diameter of 8 mm. The surface of the powdered standards (in triplicate) and products were leveled with a spatula to minimise surface effects.
3.2. Short Wave Infrared (SWIR) Hyperspectral Image Acquisition
Powdered botanical standards of both the roots and leaves of three Echinacea species were replicated three times to include a total of 18 samples, positioned randomly on a stage, and image acquisition commenced as the samples entered the field of view. The images were acquired using a sisuChema short wave infrared (SWIR) hyperspectral pushbroom imaging system (Specim, Spectral Imaging Ltd., Oulu, Finland) with Chemadaq version 3.62.183.19 software. The system consisted of an imaging spectrograph coupled to a 2-D array mercury-cadmium-telluride (HgCdTe) detector with a light source of quartz halogen lamps mounted in reflector housing. A 50 mm high magnification lens with a spatial resolution of 0.30 µm was used to capture images at a frame rate of 100 Hz at an exposure of 3.0 ms with a spectral range of 920–2514 nm and a resolution of 6–7 nm. Images with 256 × 320 pixels and a pixel depth of 14 bits/pixel were obtained. Following image capture of the standards, twenty commercial products were positioned on the stage and imaged separately under the same conditions at room temperature. Internal dark and white reference standards were used for image calibration and to correct for variation in sample illumination.
3.3. SWIR Image Analysis
3.3.1. Principal Component Analysis (PCA)
The raw images were corrected automatically for white and dark references and converted to pseudo-absorbance (A/D converter counts to absorbance) using Evince multivariate analysis software version 2.4.0 (UmBio AB, Umeå, Sweden) [10]. Principal component analysis (PCA), which is the first step in multivariate data analysis, was applied with mean centering on the whole image (including background). PCA reduces dimensionality of large datasets by decomposing interrelated variables into a new set of coordinates (PCs) that are uncorrelated and ordered in a way that the first few PCs account for most of the variation in the data [13,14]. The greatest variance in the X data observed was between the sample and the background (the stage). The interactive score image and scatter density plots were used to remove pixels corresponding to the background, dead pixels and edge effects [10,11], revealing the variation between samples. Different mathematical pretreatment methods (standard normal variate (SNV), multiplicative scatter correction (MSC) and derivates) that minimise variability unrelated to the chemical composition of the powders were investigated for spectral pre-processing [15]. The method that provided the best separation with pertinent image differences in the score plot was chosen. The optimum number of principal components (PCs) was determined by excluding all PCs that did not significantly increase the value of the Q2Ycum. The regions at the beginning and at the end of NIR spectra are usually uninformative. Modeling these regions masks useful chemical information and hence the need to investigate these and remove them from the model so that clear chemical differences can be observed. In this study, the wavelengths ≤ 996 nm at the beginning of the spectra (920–996 nm) did not contain differentiating chemical information and it was excluded from the dataset resulting in better pixel classification. The resulting image was then assessed for chemical differences and similarities with the aim of differentiating between leaf and root samples of the different species.
3.3.2. Partial Least Squares Discriminant Analysis (PLS-DA)
PLS-DA is a pattern recognition technique that correlates variation in the X data matrix (spectral data) to an independent Y-variable (class membership), which is categorical, resulting in the discrimination or classification of samples. This is a supervised classification technique as data is assigned into classes based on prior knowledge for effective prediction of group membership in new samples. In this study, the Y-variable was generated by selecting the leaf and root images of a species in the PCA score image, and assigning these to a class (Class A: E. angustifolia, Class B: E. purpurea, Class C: E. pallida). Half of the samples (n = 9) in the PCA score image consisting of 18 samples was assigned to classes and thus comprised the calibration set while the other half (n = 9) formed the test set. Cross-validation of the model was performed using a random selection method. Seven rounds (iterations) of cross-validation were performed as default settings in the software. PLS factors were added to the model and the optimum number was determined by excluding factors that did not significantly increase the value of the Q2Ycum in the model. The PLS-DA score image (Y image) was then used for membership/class prediction (Min Y cut-off: 0.5; Max Y cut-off: 1.5) of the test set, mixtures and commercial samples.
3.4. Ultra Performance Liquid Chromatography-Mass Spectrometry (UPLC-MS)
Three different solvents (methanol, chloroform and hexane) were used separately for extraction of both the leaf and root materials for UPLC-MS analysis. The extracts were then dissolved in super purity methanol to obtain a concentration of 5 mg/mL before injection into the UPLC-MS. The analysis was performed on a Waters Acquity Ultra Performance Liquid Chromatographic system equipped with a PDA detector (Waters, Milford, MA, USA). Separation was achieved on an Acquity UPLC BEH C18 column (150 mm × 2.1 mm, i.d., 1.7 μm particle size, Waters) maintained at 40 °C. Some preliminary tests were performed prior to setting the chromatographic conditions to obtain chromatograms with better resolution and a short analysis time. The mobile phase consisted of 0.1% formic acid (solvent A) and acetonitrile (solvent B) at a flow rate of 0.3 mL/min. The gradient elution was performed as follows: 61% A: 39% B changed to 30% A: 70% B in 2 min, to 20% A: 80% B in 4 min, to 10% A: 90% B in 4.5 min, maintained for 1 min and back to initial ratio in 1 min. The total run time was 15 min and the injection volume was 1.0 μL (full-loop injection). The positive and negative ion modes were examined and the positive ion mode provided results with more information and higher sensitivity. Thus, the mass spectrometer was operated in positive ion electrospray mode and nitrogen (N2) was used as the desolvation gas. Data were acquired between 100 and 1000 mz−1. The desolvation temperature was set to 350 °C at a flow rate of 500 Lh−1 and the source temperature was 100 °C. The capillary and cone voltages were set to 3500 and 35 V, respectively. Masslynx® version 4.1 software was used to process and obtain all the chromatographic data. The base peak intensity (BPI) chromatograms of the botanical reference standards and commercial products were compared to verify the species contained in the commercial products based on MS spectra and retention time. This was performed to validate the results obtained using the HSI method.
4. Conclusions
The results revealed that hyperspectral imaging in combination with multivariate data analysis could convincingly distinguish between the three Echinacea species. In addition, the constructed PLS-DA model with a high coefficient of determination, accurately predicted the Echinacea species contained in several commercially available products and identified products that did not contain crude Echinacea raw material. Products that contained a mixture of species were also confirmed using HSI. The method is clearly more suited for raw material identification and sensitivity was limited in the prediction of polyherbal formulations or products containing a high level of excipients. It is evident that rapid quality control methods such as developed in this study are of utmost importance to ensure high quality products. The species used should always be specified on the label and correspond to the species that is present in the product. Clearly, hyperspectral imaging is suited for the quality control of herbal medicines as it is a rapid, non-destructive method with high prediction ability, which considers a large part of the phytochemical metabolome.
Acknowledgments
The authors would like to thank the Claude Leon Foundation and Tshwane University of Technology for the financial support.
Author Contributions
Maxleene Sandasi: Hyperspectral imaging experimental work, UPLC-MS sample preparation and manuscript writing. IIze Vermaak: Hyperspectral imaging experimental work and manuscript writing. Weiyang Chen: UPLC-MS experimental work and data analysis. Alvaro M. Viljoen: Conceptualization, data analysis and manuscript writing.
Conflicts of Interest
The authors declare no conflict of interest.
Footnotes
Sample Availability: Samples of the raw materials and commercial products studied are available from the authors.
References
- 1.Barnes J., Anderson L.A., Gibbons S., Phillipson J.D. Echinacea species (Echinacea angustifolia (DC.) Hell., Echinacea pallida (Nutt.) Nutt., Echinacea purpurea (L.) Moench): A review of their chemistry, pharmacology and clinical properties. J. Pharm. Pharmacol. 2005;57:929–954. doi: 10.1211/0022357056127. [DOI] [PubMed] [Google Scholar]
- 2.Caruso T.J., Gwaltney J.M. Treatment of the common cold with Echinacea: A structured review. Clin. Infect. Dis. 2005;40:807–810. doi: 10.1086/428061. [DOI] [PubMed] [Google Scholar]
- 3.Tilburt J.C., Emanuel E.J., Miller F.G. Does the evidence make a difference in consumer behavior? Sales of supplements before and after publication of negative research results. J. Gen. Intern. Med. 2008;23:1495–1498. doi: 10.1007/s11606-008-0704-z. [DOI] [PMC free article] [PubMed] [Google Scholar]
- 4.Ostrow N. Echinacea shows little benefit as remedy for treating colds. [(accessed on 13 March 2012)]. Available online: http://www.bloomberg.com/news/2010-12-20/echinacea-shows-little-benefit-as-remedy-for-treating-colds-study-finds.html.
- 5.Barrett B. Medicinal properties of Echinacea: A critical review. Phytomedicine. 2003;10:66–86. doi: 10.1078/094471103321648692. [DOI] [PubMed] [Google Scholar]
- 6.Bauer R. Chemistry, analysis and immunological investigations of Echinacea phytopharmaceuticals. In: Wagner H., editor. Immunomodulatory Agents from Plants. Birkhauser Verlag; Basel, Switzerland: 1999. pp. 41–88. [Google Scholar]
- 7.Rininger J.A., Kickner S., Chigurupati P., McLean A., Franck Z. Immunopharmacological activity of Echinacea preparations following simulated digestion on murine macrophages and human peripheral blood mononuclear cells. J. Leukocyte Biol. 2000;68:503–510. [PubMed] [Google Scholar]
- 8.Gowen A.A., O’Donnel C.P., Cullen P.J., Downey G., Frias J.M. Hyperspectral imaging—An emerging process analytical tool for food quality and safety control. Trends Food Sci. Technol. 2007;18:590–598. [Google Scholar]
- 9.Gendrin C., Roggo Y., Collet C. Pharmaceutical applications of vibrational chemical imaging and chemometrics: A review. J. Pharm. Biomed. Anal. 2008;48:533–553. doi: 10.1016/j.jpba.2008.08.014. [DOI] [PubMed] [Google Scholar]
- 10.Manley M., du Toit F., Geladi P. Tracking diffusion of conditioning water in single wheat kernels of different hardnesses by near infrared hyperspectral imaging. Anal. Chim. Acta. 2011;686:64–75. doi: 10.1016/j.aca.2010.11.042. [DOI] [PubMed] [Google Scholar]
- 11.Williams P., Geladi P., Fox G., Manley M. Maize kernel hardness classification by near infrared (NIR) hyperspectral imaging and multivariate data analysis. Anal. Chim. Acta. 2009;653:121–130. doi: 10.1016/j.aca.2009.09.005. [DOI] [PubMed] [Google Scholar]
- 12.World Health Organization . WHO Monographs on Selected Medicinal Plants. Volume 1 World Health Organization; Geneva, Switzerland: 1999. [Google Scholar]
- 13.Geladi P. Chemometrics in spectroscopy, Part 1. Classical chemometrics. Spectrochim. Acta B. 2003;58:767–782. doi: 10.1016/S0584-8547(03)00037-5. [DOI] [Google Scholar]
- 14.Reich G. Near-infrared spectroscopy and imaging: Basic principles and pharmaceutical applications. Adv. Drug Deliv. Rev. 2005;57:1109–1143. doi: 10.1016/j.addr.2005.01.020. [DOI] [PubMed] [Google Scholar]
- 15.Barnes R.J., Dhanoa M.S., Lister S.J. Standard normal variate, transformation and de-trending of near-infrared diffuse reflectance spectra. Appl. Spectrosc. 1989;43:772–777. [Google Scholar]


