Abstract
Purpose
To compare epicardial fat in patients with arrhythmogenic right ventricular dysplasia/cardiomyopathy (ARVD/C) with that in healthy subjects.
Materials and Methods
In this retrospective study, cardiac CT scans in 44 patients with ARVD/C (mean age, 39 years ± 12; 23 men) were compared with those in 45 control group participants between January 2008 and July 2015. Volumes of intrathoracic adipose tissue, mediastinal adipose tissue (MAT), and total epicardial adipose tissue (EAT) were quantified. EAT was subdivided into three regions—right ventricular (RV) EAT, left ventricular (LV) EAT, and peri-atrial EAT (atrial EAT)—and normalized to MAT for all regions. Logistic regression and receiver operating characteristic analysis were performed to evaluate the association between epicardial fat with the diagnosis of ARVD/C.
Results
Total EAT volume was higher in patients with ARVD/C than in healthy control group participants (median, 98 mL vs 76 mL, respectively; P = .04). Regionally, LV and RV EAT volumes were higher in patients with ARVD/C than in control group participants, most notably when indexed to MAT (median LV EAT index: 0.49 vs 0.15, respectively; median RV EAT index: 0.91 vs 0.52; P ˂ .0005 for both). The optimal cutoff for diagnosis of ARVD/C was an LV EAT index of 0.24, with a sensitivity and specificity of 91% and 71%, respectively. Atrial EAT volume and total intrathoracic adipose tissue volume were not different between groups. RV diameter showed a positive correlation with total EAT index and LV EAT index (r = 0.21, P = .05 and r = 0.33, P = .002, respectively).
Conclusion
Higher amounts of right ventricular and left ventricular epicardial fat are found in hearts with arrhythmogenic right ventricular dysplasia/cardiomyopathy, particularly adjacent to the left ventricle, which correlates with disease severity and helps differentiate patients from healthy subjects.
© RSNA, 2018
Introduction
Arrhythmogenic right ventricular dysplasia/cardiomyopathy (ARVD/C) is an inherited heart disease characterized by fibrofatty replacement of the ventricular myocardium, with an estimated prevalence of 1:5000 people in the general population (1). Although uncommon, it is a frequently reported cause of sudden cardiac death in young athletes, and sudden cardiac death is the first manifestation of this disease in 16%–23% of patients with ARVD/C (2–4).
Fibrofatty infiltration into the right and left ventricular walls is a well-known feature of ARVD/C and can be identified with noninvasive cardiac MRI or cardiac CT (5–7). Studies in epicardial fat deposits have suggested pathogenic roles of epicardial fats in mediating cardiac diseases and arrhythmias. Greater quantities of epicardial fat, defined as the fat within the pericardial space surrounding the myocardial portions of the heart, have been identified as independent risk factors for coronary artery disease and atrial arrhythmias (8). Progress in understanding adipocyte physiologic and pathologic characteristics has indicated that epicardial fats can secrete paracrine and inflammatory cytokines, adipokines, or other factors that influence the health or diseases of the underlying myocardium and coronary arteries (9). Although myocardial fat infiltration has been well described in ARVD/C, changes in epicardial fat deposits with this disease have not been investigated. This topic is of particular interest because cardiac mesenchymal stromal cells from human hearts with ARVD/C and plakophilin-2 mutations are abnormally adipogenic and have been suggested to be the source of pathologic fatty formation in ARVD/C hearts (10). Because human epicardium is rich in cells with mesenchymal characteristics, we hypothesized that patients with ARVD/C may also have a higher volume of epicardial fat. The purpose of this study was to compare the volume of epicardial fat in patients with ARVD/C with that in control group participants without known cardiovascular disease.
Materials and Methods
The study protocol was approved by our local institutional review board and performed under a Health Insurance Portability and Accountability Act waiver of consent. All patients provided written informed consent.
Population
We performed a retrospective study of 44 consecutive patients with ARVD/C who were previously enrolled in a prospective registry of patients with ARVD/C at our institution and who underwent clinical cardiac CT between January 2008 and July 2015. There was no direct industry or governmental funding support for this study. The diagnosis of ARVD/C was based on fulfilling the 2010 Task Force Criteria (11) at the time of last clinical follow-up. Clinical data were collected for all patients, including height, weight, mutation status, Task Force Criteria points, family history, history of implantable cardioverter defibrillator implantation, and history of sustained ventricular tachycardia before CT. All patients with ARVD/C had undergone sequencing of the desmosomal genes (DSP, PKP2, DSG2, DSC2, JUP) and PLN. A control group was selected from a larger ongoing Genetic Study of Atherosclerosis Risk (GeneSTAR), which is a prospective study of 4000 individuals and is designed to characterize genetic and biologic factors associated with cardiovascular disease phenotypes in 883 families with early onset coronary heart disease. Recruitment protocols for GeneSTAR have been previously described in detail (12). Consecutive study participants (n = 703) who underwent coronary CT between July 2009 and January 2012 comprised the control group. From this group, age-, sex-, and body mass index–matched control subjects were selected from study participants with negative coronary CT examinations and no known cardiovascular disease (n = 45).
Quantification of Fat
Standard cardiac CT examinations were performed with the detailed CT imaging protocol described in Appendix E1 (online). CT images were uploaded onto the Volumetric Advantage Workstation (GE Healthcare, Milwaukee, Wis). Image processing was performed by one observer (M.A.G.) with more than 2 years of cardiac imaging analysis experience.
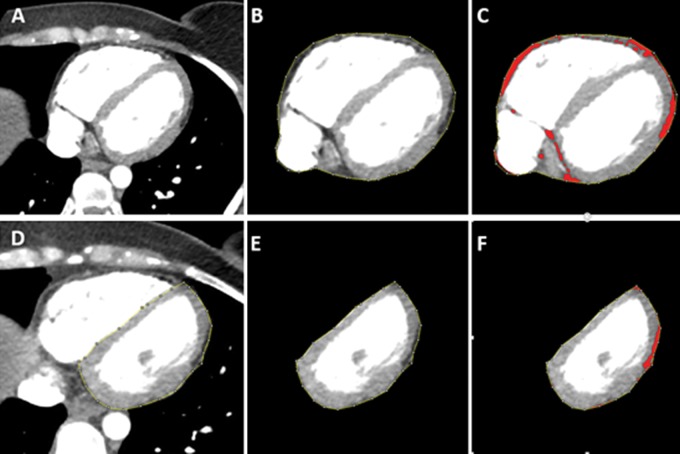
For each CT image, several contours were manually created to segment fat in the mediastinum, epicardium, right ventricle (RV), and left ventricle (LV) on axial images obtained from the pulmonary artery bifurcation cranially through the diaphragm caudally. Figure 1 illustrates the segmentation process. The detailed segmentation method is described in Appendix E2 (online).
Figure 1:
Epicardial fat quantification with contrast-enhanced cardiac CT in 29-year-old woman with arrhythmogenic right ventricular dysplasia/cardiomyopathy. A, Axial image in midheart before performing analysis. B, Epicardial segmentation has been performed by tracing the pericardial contour. C, Threshold (−10 HU and lower limit of −190 HU) has been applied, highlighting all fat pixels in red. D, Example of left ventricular (LV) regional contouring to segment LV epicardial adipose tissue (EAT). E, Example of segmented LV EAT before fat thresholding. F, LV EAT after application of a fat threshold. The volume of fat (red pixels) is automatically calculated by the software. These steps were repeated for each epicardial fat region for each axial section through the heart.
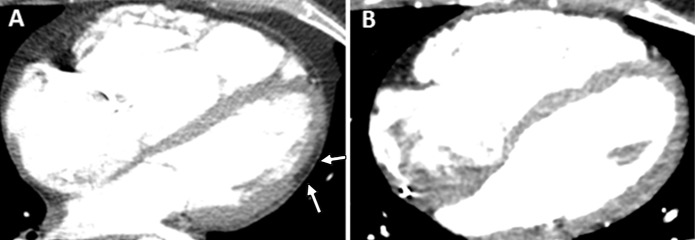
Volumetric measures included all fat within the segmented region. Therefore, for RV and LV epicardial adipose tissue (EAT) segmentations in patients with myocardial fat infiltration, epicardial fat volumes include both epicardial fat and underlying myocardial fat infiltration. We found it was not possible to reliably contour epicardial and myocardial fat infiltration separately in either ventricle, as the border between the two was not distinct. As a substudy, two experienced cardiac radiologists (S.L.Z. and I.R.K., with 6 and >10 years of experience, respectively) reviewed the cardiac CT images in consensus to qualitatively identify images containing LV myocardial fat infiltration. The reviewers were blinded to the diagnosis and volume of the fat in each segment. LV myocardial fat infiltration was defined as the presence of fat within the expected contours of the LV wall and in association with loss of volume (thinning) of the myocardial tissue at the same level, as previously described with MRI (13) (Fig 2). We could not reliably identify the presence or absence of RV fat infiltration with CT given the thinness of the RV wall and low contrast. Therefore, measured RV fat volumes after segmentation were inclusive of both epicardial and any additional RV myocardial fat. Indexed values for all fat volumes were calculated by dividing the volume of fat in each region by the mediastinal adipose tissue (MAT).
Figure 2:
Contrast-enhanced cardiac CT images in, A, 26-year-old woman with arrhythmogenic right ventricular dysplasia/cardiomyopathy (ARVD/C) with left ventricular (LV) epicardial fat infiltration (arrows) and, B, 28-year-old woman with ARVD/C without LV epicardial fat infiltration.
Morphologic CT Analysis
LV and RV diameters were measured on reconstructed four-chamber views from CT images (LV at midcavity and RV at 1 cm apical to the tricuspid annulus).
Statistical Analysis
Statistical analysis was performed by using software (STATA, version 12; StataCorp, College Station, Tex). Normality of data was tested by using the Shapiro-Wilk test. Continuous variables were compared between patients with ARVD/C and control group participants by using either the Student t test or the Mann-Whitney U test as appropriate. A multivariable logistic regression model was created to analyze the association of ARVD/C diagnosis with fat volume, age, sex, and body mass index. Separate models were created for each fat volume parameter and their indexes (total intrathoracic fat, MAT, EAT, RV EAT, LV EAT, and atrial EAT). Receiver operating characteristic analysis was performed to detect specificity and sensitivity of each fat volume for the diagnosis of ARVD/C, and the cutoff point was defined as the optimal point for maximum sensitivity and specificity (Youden approach). Pairwise Spearman correlation was performed to assess the relationship of RV and LV diameters with fat volume and fat volume index. Inter- and intrareader agreement for fat measurements was assessed with the intraclass correlation coefficient for a random subset of 20 patients. Subanalyses were performed in the ARVD/C group, comparing those with and those without fat infiltration into the LV myocardium. Fat volumes and fat volume index were compared by using parametric or nonparametric testing for continuous variables and the Χ 2 test or Fisher exact test for categorical variables as needed. P ˂ .05 was considered indicative of a statistically significant difference.
Results
Patient Demographics and Clinical History
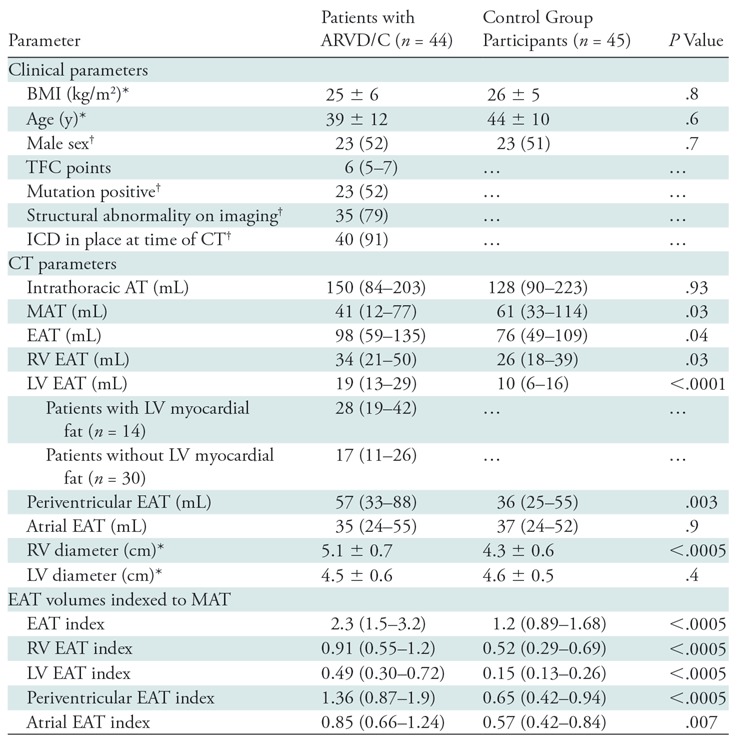
Clinical and demographic characteristics of the patients with ARVD/C and the control group participants are presented in Table 1. The final patient group included 44 patients with ARVD/C and 45 control group participants. The mean age (±standard deviation) of the patients with ARVD/C was 39 years ± 12, and the mean body mass index was 25 kg/m2 ± 6. Twenty-three of the 44 patients with ARVD/C (52%) were men. By study design, there were no significant differences in age, sex, or body mass index between patients and control group participants. Genetic evaluation of patients with ARVD/C showed that 23 of the 44 patients (52%) had mutations in known ARVD/C-associated genes, including 16 of 23 (69%) in plakophilin-2 (PKP2), two (9%) in desmoglein2 (DSG2), and one (4%) each of desmoplakin (DSP), desmocollin-2 (DSC2), and phospholamban (PLN). Two additional patients (9%) had multiple mutations.
Table 1:
Comparison of Demographic Characteristics and Fat Volumes in Patients with ARVD/C and Control Group Participants
Note.—Except where indicated, data are medians, with interquartile range in parentheses. Periventricular EAT is the combination of LV and RV EAT, calculated by subtracting atrial EAT from EAT. ARVD/C = arrhythmogenic right ventricular dysplasia/cardiomyopathy, AT = adipose tissue, BMI = body mass index, EAT = epicardial adipose tissue, ICD = implantable cardioverter defibrillator, LV = left ventricle, MAT = mediastinal adipose tissue, RV = right ventricle, TFC = Task Force Criteria.
*Data are means ± standard deviations.
†Data are numbers of patients or participants, with percentages in parentheses.
Comparison of Epicardial Fat between Patients with ARVD/C and Control Group Participants
Of the 40 patients with ARVD/C who had implantable cardioverter defibrillators, 24 had streak artifacts (11 in the RV, 10 in the septum, two in both the RV and septum, and one in the LV). The regions involved by streak were excluded from analysis for these patients.
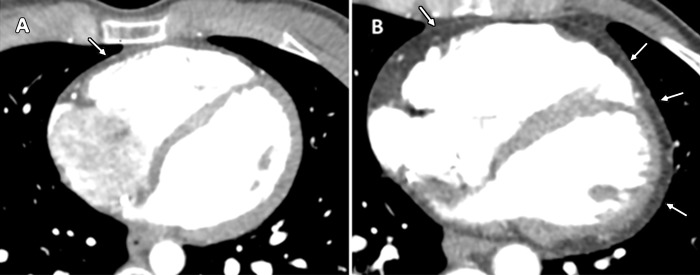
There was no significant difference in total intrathoracic adipose tissue between patients and control group participants (P = .93; Table 1). MAT (the total adipose tissue outside of the parietal pericardium) was higher in control group participants than in patients with ARVD/C (P = .03). Conversely, EAT (the adipose tissue inside of the visceral pericardium, surrounding the myocardial portions of the heart) was higher in patients with ARVD/C than in control group participants, with median values of 98 mL (interquartile range [IQR]: 59–135 mL) and 76 mL (IQR: 49–109 mL), respectively (P = .04) (Fig 3). Regional epicardial adipose evaluation showed that both LV and RV EAT were greater in patients with ARVD/C than in control group participants (P ˂ .0001 and P = .03, respectively). Atrial adipose tissue was not significantly different between patients and control group participants (P = .9).
Figure 3:
Contrast-enhanced cardiac CT images in, A, 31-year-old healthy man with low epicardial adipose tissue (EAT) volume and, B, 39-year-old woman with arrhythmogenic right ventricular dysplasia/cardiomyopathy (ARVD/C) and high EAT volume. In the healthy control group participant, a small amount of epicardial fat is seen around right ventricle (arrow) but not around left ventricle. In patient with ARVD/C, there is extensive fat around both the left and right ventricles (arrows).
Qualitative review of the ARVD/C images by consensus of two experienced radiologists showed that 14 of the 44 patients (32%) had fat infiltration within the LV myocardium, whereas none of the control group participants had LV myocardial fat infiltration. When analyzed separately, both patients with and patients without LV fat infiltration had greater LV EAT volumes compared with control group participants (median: 28 mL [IQR: 19–42 mL] for patients with myocardial fat infiltration and 17 mL [IQR: 11–26 mL] for patients without myocardial fat infiltration vs 10 mL [IQR: 6–16 mL] for control group participants; P ˂ .001 and P ˂ .0001, respectively) (Table 1). Thus, the presence or absence of myocardial LV fatty infiltration did not change our analysis.
Association of Epicardial Fats with Severity of ARVD/C
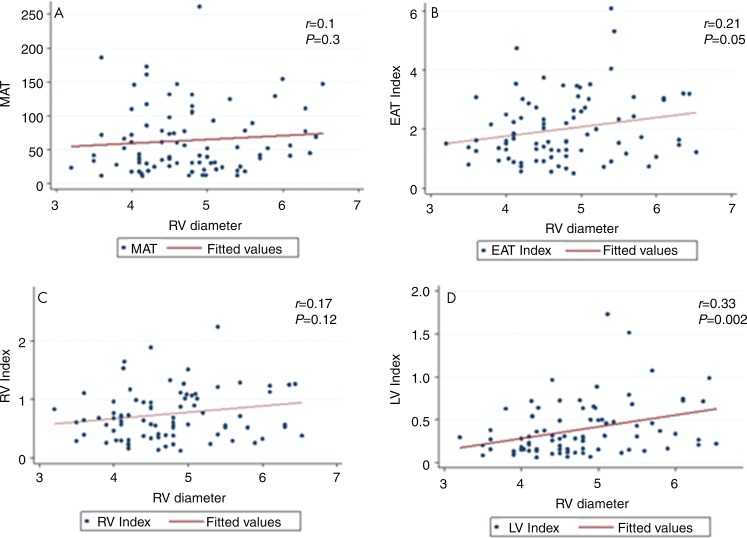
We used RV diameter as a surrogate marker for severity of structural disease in the right side of the heart. Greater RV diameter was associated with more extensive epicardial fat in patients (Fig 4). RV diameter had a positive correlation with EAT index and LV EAT index (r = 0.21, P = .05 and r = 0.33, P = .002, respectively). MAT and RV EAT index did not show a correlation with RV diameter (r = 0.09, P = .3 and r = 0.17, P = .12, respectively). In addition, the absolute or index values of MAT, EAT, RV EAT, and LV EAT had no relationship with the LV diameter in hearts with ARVD/C (P = .36, P = .38, P = .22, P = .18, respectively).
Figure 4:
Graphs show that right ventricular (RV) diameter (in centimeters) in patients with arrhythmogenic right ventricular dysplasia/cardiomyopathy is associated with epicardial but not mediastinal fat. A, Mediastinal adipose tissue (MAT), which is the fat in the mediastinum but outside of the pericardium, showed poor correlation to RV diameter. B, Epicardial adipose tissue (EAT) index, which is all the fat within the pericardium normalized to MAT, showed moderate correlation with RV diameter. C, D, At regional subanalysis of epicardial fat, RV and left ventricular (LV) epicardial adipose tissue indexed to MAT (RV index, LV index) showed a significant moderate correlation with RV diameter only for LV EAT index.
Multivariable Analysis of Fat Volumes versus Diagnosis of ARVD/C
Multivariable logistic regression models were created for each fat parameter. Because we considered the results of three regression models simultaneously, we applied a conservative Bonferroni adjustment to the significance criterion and considered P ˂ .01 to be indicative of a statistically significant difference. In separate models, the index values of EAT, MAT, LV EAT, and RV EAT volumes and the absolute values of MAT and LV EAT were significantly associated with diagnosis of ARVD/C after adjusting for age, sex, and body mass index, with the strongest association for LV EAT (Table E1 [online]). Epicardial fat showed a positive association with diagnosis of ARVD/C, whereas mediastinal fat showed a negative association with the diagnosis, supporting that abnormal fat formation is specific to ARVD/C hearts and patients with ARVD/C are usually in the lean phenotype with less MAT. For the index values of EAT, RV EAT, and LV EAT, all showed strong independent associations with ARVD/C diagnosis.
LV Epicardial Fat Quantification for Diagnosis of ARVD/C
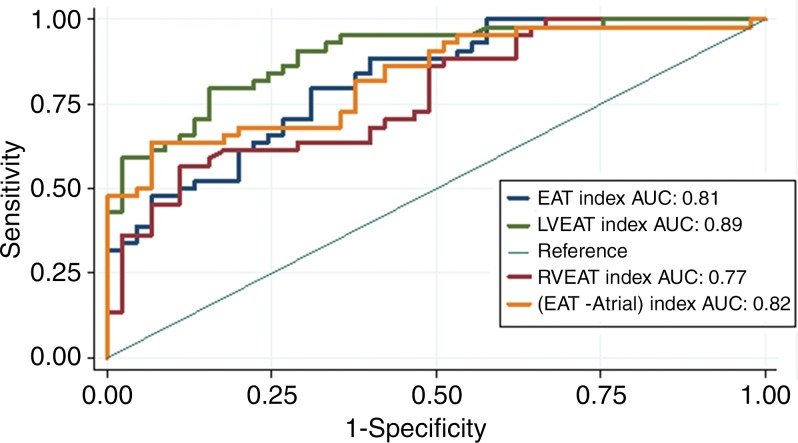
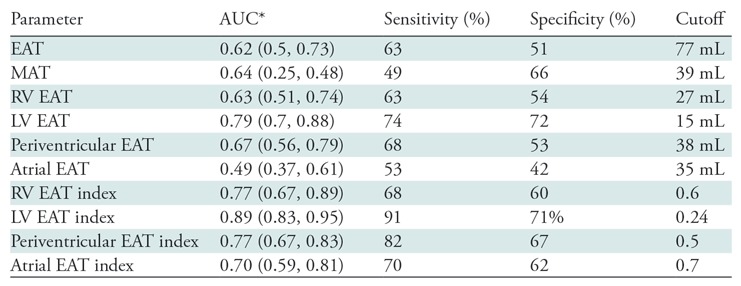
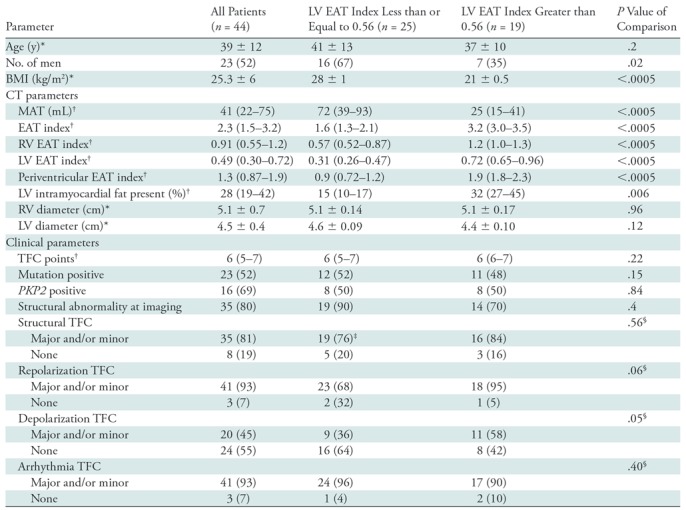
Receiver operating characteristic analysis was used to evaluate the ability of using absolute and index values of EAT, RV EAT, and LV EAT to differentiate patients with ARVD/C from control group participants (Fig 5, Table 2). Results of receiver operating characteristic analysis are shown in Table 2. Among nonindexed volumes, LV EAT had the best ability to help differentiate between patients and control group participants with an optimal cutoff value of 15 mL, resulting in 74% sensitivity and 72% specificity for the diagnosis of ARVD/C. Among indexed values, LV EAT had the highest area under the receiver operating characteristic curve for predicting the diagnosis of ARVD/C (0.89), with sensitivity and specificity of 91% and 71% at a cutoff value of 0.24. Among patients, there was a weak difference in depolarization Task Force Criteria between patients with an LV EAT index above the median value and those with an LV EAT index less than or equal to the median value (P = .05) (Table 3), with patients meeting depolarization criteria (major and/or minor) slightly more common in the group with an LV EAT index greater than the median value.
Figure 5:
Receiver operating curves for evaluating the ability of various epicardial fat parameters to enable the differentiation between patients with arrhythmogenic right ventricular dysplasia/cardiomyopathy (ARVD/C) and control group participants. Left ventricular (LV) epicardial adipose tissue index (EAT) has the greatest sensitivity and specificity for diagnosis of ARVD/C. AUC = area under the receiver operating characteristic curve, RV = right ventricle.
Table 2:
ROC Analysis of the Utility of Thoracic Fat Parameters for Diagnosis of ARVD/C
Note.— Periventricular EAT is the combination of LV and RV EAT, calculated by subtracting atrial EAT from EAT. ARVD/C = arrhythmogenic right ventricular dysplasia/cardiomyopathy, AUC = area under the receiver operating characteristic curve, EAT = epicardial adipose tissue, LV = left ventricle, MAT = mediastinal adipose tissue, ROC = receiver operating characteristic, RV = right ventricle.
*Numbers in parentheses are 95% confidence intervals.
Table 3:
Comparison of Patients with ARVD/C Above and Below the Mean LV EAT Index
Note.—Except where indicated, data are numbers of patients, with percentages in parentheses. Periventricular EAT is the combination of LV and RV EAT, calculated by subtracting atrial EAT from EAT. ARVD/C = arrhythmogenic right ventricular dysplasia/cardiomyopathy, BMI = body mass index, EAT = epicardial adipose tissue, LV = left ventricle, MAT = mediastinal adipose tissue, RV = right ventricle, TFC = Task Force Criteria.
*Data are means ± standard deviations.
†Data are medians, with interquartile range in parentheses.
‡Structural Task Force Criteria information was not available for one patient.
§P value for Fisher exact test comparing proportion of patients meeting any criteria (major and/or minor criteria combined to single variable) for left ventricular epicardial adipose tissue volume groups above and below the mean.
Inter- and Intraobserver Variability for Fat Volume Quantification
Intraclass correlation coefficient analysis for MAT, EAT, RV EAT, and LV EAT showed excellent inter- and intrareader agreement. Interreader analysis showed 0.98, 0.98, 0.97, and 0.95 agreement for MAT, EAT, RV EAT, and LV EAT, respectively. Intrareader analysis showed 0.99, 0.99, 0.98, and 0.94 agreement for MAT, EAT, RV EAT, and LV EAT, respectively.
Discussion
Our study has several major findings. First, we found that epicardial fat volumes surrounding the LV and RV are significantly higher in patients with ARVD/C compared with control group participants. Second, we found a correlation between epicardial fat and the severity of structural disease in the RV. Finally, we found that LV epicardial fat, when normalized to mediastinal fat volumes, is the most different between patients and control group participants and has excellent sensitivity and moderate specificity for the diagnosis of ARVD/C.
There is growing evidence that epicardial fat may play an important role in cardiac diseases, with several studies demonstrating an independent relationship between epicardial fat volumes and coronary artery disease and atrial fibrillation (8,14,15). It is likely that epicardial fat directly interacts with the underlying cardiac muscle through secretion of cytokines, adipokines, and inflammatory mediators (9). In distinction to previous studies, we not only analyzed the epicardial fat volume as a whole (ie, all fat contained by the pericardium) but also evaluated regional epicardial fat surrounding each ventricle and the atria. As suspected, patients with ARVD/C had greater amounts of epicardial fat compared with control group participants, both in whole EAT and regional RV and LV EAT. To minimize the influence of body habitus and age (eg, obesity and aging) on cardiac fat volumes, we used the index values of EAT, RV EAT, and LV EAT, the results of which strongly support that the higher fat volume is specific for the epicardial fat depot in patients with ARVD/C. When these indexed measures are used, the utility of epicardial fat quantification for ARVD/C diagnosis was moderate to good, depending on the parameter used, with up to 91% sensitivity and 71% specificity for the LV EAT index. Please note, however, that more extensive validation in larger cohorts with more phenotypically heterogeneous patients is needed before these methods can be used for clinical assessment. These thresholds could serve as starting points for future research.
Although exact mechanisms underlying our observations are unclear, studies have suggested that abnormal peroxisome proliferator–activated receptor gamma (PPAR-γ) activation is the key pathogenic mechanism for exaggerated lipogenesis and apoptosis in ARVD/C cardiomyocytes (16,17). PPAR-γ is also a master regulator for promoting adipogenesis of mesenchymal stromal (or stem) cells (18). Cardiac mesenchymal stromal cells from ARVD/C hearts or derived from ARVD/C-induced pluripotent stem cells are abnormally adipogenic. The epicardial layers of human hearts contain large number of adipose cells, and resident mesenchymal stromal cells in the heart are the major progenitor cell type for adipocyte formation (19,20), indicating that epicardial fat deposits in ARVD/C hearts might provide an indicator of the degree of myocardial disease progression. Herein, we showed that abnormally high fat generation and/or volume in ARVD/C is not a systemic phenomenon and it is specific to the EATs adjacent to ARVD/C ventricular myocardium, likely due to abnormal “local epicardial fat–ventricular cardiomyocyte interactions.”
We found a weak correlation between RV diameter, used here as a surrogate measure of severity of ARVD/C structural disease, and both EAT index and LV EAT index. The volume of MAT could be affected by multiple factors, such as obesity, physical activities, and diet, which are independent of the ARVD/C disease process. The lack of correlation between RV EAT and RV diameter was surprising, and this finding is most likely related to the small sample size in our study or a greater degree of overlap between patients and control group participants for RV epicardial fat compared with LV epicardial fat; RV EAT may not be as sensitive as LV EAT as a marker of disease.
Our study has some limitations. The sample size of our study is small. Most of our patients who were positive for mutation had a PKP2 mutation, which prevented investigation of genotype-phenotype relationships with respect to epicardial fat. Owing to the thresholding software used, fat measurements included both epicardial fat and intramyocardial fat, if present. For the LV, we performed separate analyses in patients with and patients without myocardial fat deposition to investigate whether differences in fat quantity were being driven by intramyocardial fat deposition. We could not reliably perform this analysis in the RV given difficulties in clearly identifying the RV wall. Patients with ARVD/C are biased toward severe phenotypes, given that CT examinations were performed for arrhythmia ablation planning in most patients, also limiting our ability to investigate the relationship between disease severity and fat quantity. In patients with an implantable cardioverter defibrillator, regions involved by streak were excluded from analysis and fat volume measured was likely slightly less than the true volume in these excluded regions.
In conclusion, patients with ARVD/C have higher volumes of epicardial fat surrounding the ventricles, particularly for epicardial fat surrounding the LV, and the extent of fat shows correlation with disease severity. Our findings support the evidence that cardiac mesenchymal stromal cells specifically in ARVD/C hearts display abnormal and exaggerated adipogenic responses, likely to unidentified factors secreted from failing RV and/or LV, leading to the higher amount of EAT found in ARVD/C hearts with relatively severe phenotypes.
Summary
The higher amount of epicardial fat in hearts with arrhythmogenic right ventricular dysplasia/cardiomyopathy, particularly surrounding the left ventricle, could provide an indicator for the degree of myocardial disease progression.
Implications for Patient Care
■ Patients with arrhythmogenic right ventricular dysplasia/cardiomyopathy have higher amounts of epicardial fat than do healthy control group participants, particularly adjacent to the left ventricle.
■ Epicardial fat has excellent sensitivity and moderate specificity in the diagnosis of arrhythmogenic right ventricular dysplasia/cardiomyopathy.
APPENDIX
The Johns Hopkins ARVD/C Program is supported by the Dr. Francis P. Chiaramonte Private Foundation, the Leyla Erkan Family Fund for ARVD Research, the Dr. Satish, Rupal, and Robin Shah ARVD Fund at Johns Hopkins, the Bogle Foundation, the Healing Hearts Foundation, the Campanella Family, the Patrick J. Harrison Family, the Peter French Memorial Foundation, and the Wilmerding Endowments. H.C. receives research support from Fondation Leducq (RHYTHM network). A.S.J.M.T.R. receives research support from the Dutch Heart Foundation (grant 2015T058), a Clinical Research Talent fellowship from Universitair Medisch Centrum Utrecht and the Netherlands Cardiovascular Research Initiative, an initiative with support of the Netherlands Heart Foundation (grant CVON2015-12 eDETECT). H.S.V.C. was supported by the California Institute of Regenerative Medicine (CIRM) (grant RB4-06276), National Institutes of Health (grant RO1 HL105194), and Indiana University Startup funds.
Disclosures of Conflicts of Interest: M.A.G. disclosed no relevant relationships. A.S.J.M.T.R. disclosed no relevant relationships. C.A.J. Activities related to the present article: disclosed no relevant relationships. Activities not related to the present article: received salary support from a research grant from Boston Scientific; received payment for lectures including service on speakers bureau from Abbott. Other relationships: disclosed no relevant relationships. H.S.V.C. disclosed no relevant relationships. C.T. Activities related to the present article: disclosed no relevant relationships. Activities not related to the present article: received salary support from a research grant from Boston Scientific. Other relationships: disclosed no relevant relationships. B.M. disclosed no relevant relationships. J.E. disclosed no relevant relationships. B.G.K. disclosed no relevant relationships. H.T. Activities related to the present article: disclosed no relevant relationships. Activities not related to the present article: received research support from Abbott. Other relationships: disclosed no relevant relationships. H.C. Activities related to the present article: disclosed no relevant relationships. Activities not related to the present article: is a consultant for Medtronic; receives research support from Boston Scientific. Other relationships: disclosed no relevant relationships. I.R.K. disclosed no relevant relationships. S.L.Z. disclosed no relevant relationships.
Abbreviations:
- ARVD/C
- arrhythmogenic right ventricular dysplasia/cardiomyopathy
- EAT
- epicardial adipose tissue
- IQR
- interquartile range
- LV
- left ventricle
- MAT
- mediastinal adipose tissue
- RV
- right ventricle
References
- 1.te Riele AS, Tandri H, Bluemke DA. Arrhythmogenic right ventricular cardiomyopathy (ARVC): cardiovascular magnetic resonance update. J Cardiovasc Magn Reson 2014;16(1):50. [DOI] [PMC free article] [PubMed] [Google Scholar]
- 2.Dalal D, Nasir K, Bomma C, et al. Arrhythmogenic right ventricular dysplasia: a United States experience. Circulation 2005;112(25):3823–3832. [DOI] [PubMed] [Google Scholar]
- 3.Hulot JS, Jouven X, Empana JP, Frank R, Fontaine G. Natural history and risk stratification of arrhythmogenic right ventricular dysplasia/cardiomyopathy. Circulation 2004;110(14):1879–1884. [DOI] [PubMed] [Google Scholar]
- 4.Calkins H, Tandri H. Left ventricular involvement in ARVD/C: is it time to readjust our views? Circ Arrhythm Electrophysiol 2015;8(6):1311–1312. [DOI] [PubMed] [Google Scholar]
- 5.Bomma C, Dalal D, Tandri H, et al. Evolving role of multidetector computed tomography in evaluation of arrhythmogenic right ventricular dysplasia/cardiomyopathy. Am J Cardiol 2007;100(1):99–105. [DOI] [PubMed] [Google Scholar]
- 6.Cochet H, Denis A, Komatsu Y, et al. Automated quantification of right ventricular fat at contrast-enhanced cardiac multidetector CT in arrhythmogenic right ventricular cardiomyopathy. Radiology 2015;275(3):683–691. [DOI] [PubMed] [Google Scholar]
- 7.Molinari G, Sardanelli F, Zandrino F, et al. Adipose replacement and wall motion abnormalities in right ventricle arrhythmias: evaluation by MR imaging—retrospective evaluation on 124 patients. Int J Card Imaging 2000;16(2):105–115. [DOI] [PubMed] [Google Scholar]
- 8.Spearman JV, Renker M, Schoepf UJ, et al. Prognostic value of epicardial fat volume measurements by computed tomography: a systematic review of the literature. Eur Radiol 2015;25(11):3372–3381. [DOI] [PMC free article] [PubMed] [Google Scholar]
- 9.Salazar J, Luzardo E, Mejías JC, et al. Epicardial fat: physiological, pathological, and therapeutic implications. Cardiol Res Pract 2016;2016:1291537. [DOI] [PMC free article] [PubMed] [Google Scholar]
- 10.Sommariva E, Brambilla S, Carbucicchio C, et al. Cardiac mesenchymal stromal cells are a source of adipocytes in arrhythmogenic cardiomyopathy. Eur Heart J 2016;37(23):1835–1846. [DOI] [PMC free article] [PubMed] [Google Scholar]
- 11.Marcus FI, McKenna WJ, Sherrill D, et al. Diagnosis of arrhythmogenic right ventricular cardiomyopathy/dysplasia: proposed modification of the task force criteria. Circulation 2010;121(13):1533–1541. [DOI] [PMC free article] [PubMed] [Google Scholar]
- 12.Kral BG, Nyquist P, Vaidya D, et al. Relation of subclinical coronary artery atherosclerosis to cerebral white matter disease in healthy subjects from families with early-onset coronary artery disease. Am J Cardiol 2013;112(6):747–752. [DOI] [PMC free article] [PubMed] [Google Scholar]
- 13.Rastegar N, Te Riele AS, James CA, et al. Fibrofatty changes: incidence at cardiac MR imaging in patients with arrhythmogenic right ventricular dysplasia/cardiomyopathy. Radiology 2016;280(2):405–412. [DOI] [PMC free article] [PubMed] [Google Scholar]
- 14.Raggi P, Alakija P. Epicardial adipose tissue: a long-overlooked marker of risk of cardiovascular disease. Atherosclerosis 2013;229(1):32–33. [DOI] [PubMed] [Google Scholar]
- 15.Stojanovska J, Kazerooni EA, Sinno M, et al. Increased epicardial fat is independently associated with the presence and chronicity of atrial fibrillation and radiofrequency ablation outcome. Eur Radiol 2015;25(8):2298–2309. [DOI] [PubMed] [Google Scholar]
- 16.Djouadi F, Lecarpentier Y, Hébert JL, Charron P, Bastin J, Coirault C. A potential link between peroxisome proliferator-activated receptor signalling and the pathogenesis of arrhythmogenic right ventricular cardiomyopathy. Cardiovasc Res 2009;84(1):83–90. [DOI] [PubMed] [Google Scholar]
- 17.Kim C, Wong J, Wen J, et al. Studying arrhythmogenic right ventricular dysplasia with patient-specific iPSCs. Nature 2013;494(7435):105–110. [DOI] [PMC free article] [PubMed] [Google Scholar]
- 18.Cook D, Genever P. Regulation of mesenchymal stem cell differentiation. Adv Exp Med Biol 2013;786:213–229. [DOI] [PubMed] [Google Scholar]
- 19.Rabkin SW. Epicardial fat: properties, function and relationship to obesity. Obes Rev 2007;8(3):253–261. [DOI] [PubMed] [Google Scholar]
- 20.Sacks HS, Fain JN. Human epicardial adipose tissue: a review. Am Heart J 2007;153(6):907–917. [DOI] [PubMed] [Google Scholar]
Associated Data
This section collects any data citations, data availability statements, or supplementary materials included in this article.


