

Abstract
Courtship rituals serve to reinforce reproductive barriers between closely related species. Drosophila melanogaster and D. simulans exhibit reproductive isolation due, in part, to the fact that D. melanogaster females produce 7,11-heptacosadiene (7,11-HD), a pheromone that promotes courtship in D. melanogaster males but suppresses courtship in D. simulans males. Here we compare pheromone-processing pathways in D. melanogaster and D. simulans males to define how these sister species endow 7,11-HD with the opposite behavioral valence to underlie species discrimination. We show that males of both species detect 7,11-HD using the homologous peripheral sensory neurons but this signal is differentially propagated to the P1 neurons that control courtship behavior. A change in the balance of excitation and inhibition onto courtship-promoting neurons transforms an excitatory pheromonal cue in D. melanogaster into an inhibitory cue in D. simulans. Our results reveal how species-specific pheromone responses can emerge from conservation of peripheral detection mechanisms and diversification of central circuitry and illustrate how flexible nodes in neural circuits can contribute to behavioral evolution.
Animals display an extraordinary diversity of behavior both within and between species. While there is increasing insight into how learning and experience modify neural processing to produce variations in individual behavior, far less is known about how evolution shapes neural circuitry to generate species-specific responses. Cross-species comparative studies have identified genetic loci that explain behavioral diversity1-4, but only rarely examined the neural substrate upon which this genetic variation acts. Therefore, how the nervous system evolves to give rise to species-specific behaviors remains unclear.
As species diverge, their reproductive isolation is often reinforced by the development of behavioral differences that signify species identity and discourage interspecies courtship. The rapid evolution of courtship rituals thus provides an entry point to examine the neural mechanisms that underlie behavioral divergence between closely related species. For example, D. melanogaster and D. simulans diverged 2-3 million years ago5 (Fig. 1a), and, although these cosmopolitan species frequently encounter each other in the environment, they remain reproductively isolated and rarely mate. When copulation does occur, it results in inviable or sterile offspring. Avoiding interspecies mating therefore benefits both species. Indeed, both D. melanogaster and D. simulans males are choosy in selecting mates and, when offered a choice, preferentially court conspecific females (Fig. 1b).
Figure 1: Pheromone regulation of D. simulans courtship.
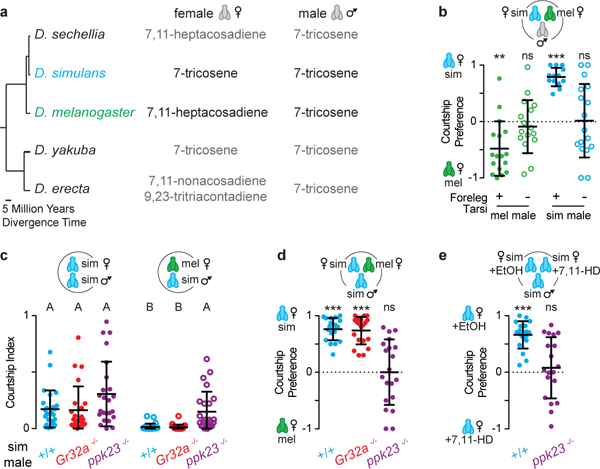
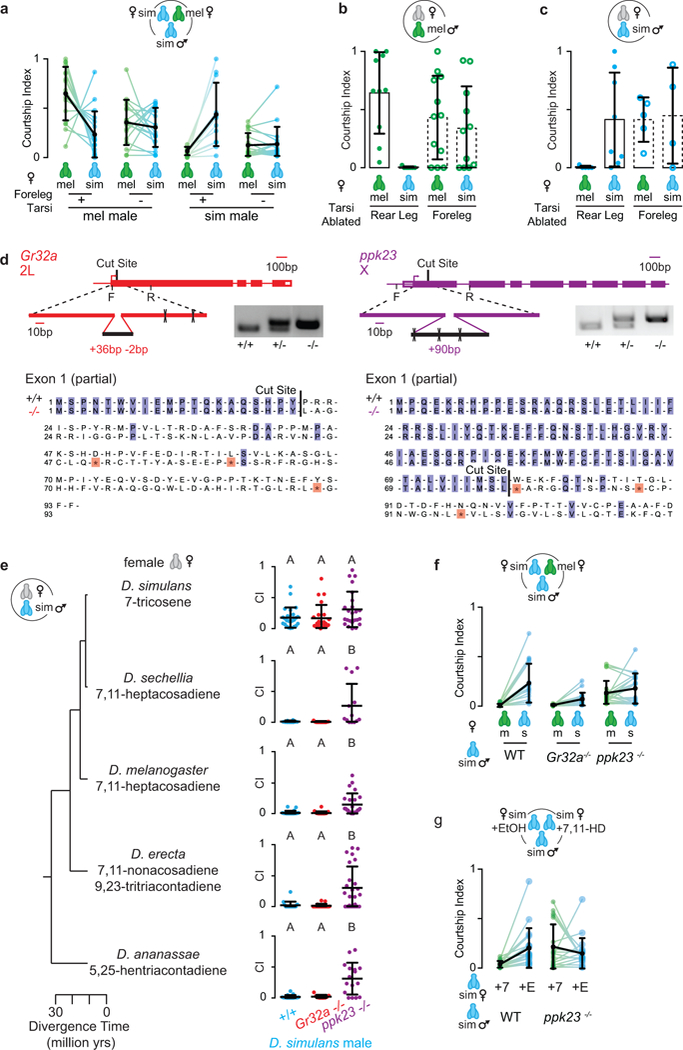
a, Predominant cuticular hydrocarbons of related species. b, Courtship preferences of D. melanogaster and D. simulans males with foreleg tarsi intact (+) or removed (−). c, d, Courtship indices (c) or preference indices (d) of wild-type (+/+), Gr32a−/−, and ppk23−/− D. simulans males offered D. simulans and/or D. melanogaster females. e, Preference indices of wild-type or ppk23−/− D. simulans males offered D. simulans females perfumed with ethanol (EtOH) or 7,11-HD. b, d, e, one-sample t-test. c, Kruskal-Wallis test. Bars: mean and s.d. See Supplemental Table 1 for details of statistical analyses.
One mechanism for selective courtship is the use of sex- and species-specific pheromones that either promote courtship towards conspecific females or suppress pursuit of inappropriate mates6. Pheromone production has rapidly diversified across drosophilids7 such that D. melanogaster females produce 7,11-heptacosadiene (7,11-HD) on their cuticle while D. simulans females produce 7-tricosene (7-T), as do D. simulans and D. melanogaster males6. This pheromonal difference appears to be sufficient for species discrimination: perfuming D. simulans females with 7,11-HD renders them attractive to D. melanogaster males but unattractive to D. simulans males8. Thus 7,11-HD is detected by males of both species, but plays an opposing role in controlling their courtship decisions.
Species-specific pheromone responses could arise from the evolution of peripheral detection mechanisms or the central circuits that process pheromone signals to regulate courtship. To differentiate between these possibilities, we performed a direct comparison of the homologous pheromone pathways in D. simulans and D. melanogaster males. Here we demonstrate that species-specific responses to 7,11-HD emerge from the reweighting of excitatory and inhibitory inputs at a central node in the courtship circuit, highlighting how functional adaptations of central sensory processing pathways can lead to divergent behaviors.
ppk23 mediates 7,11-HD detection
A critical step in Drosophila mate assessment occurs when a male taps the abdomen of another fly with his foreleg to taste their cuticular pheromones9. D. melanogaster and D. simulans males whose foreleg tarsi have been surgically removed still court vigorously (Extended Data Fig. 1a-c), but do so promiscuously (Fig. 1b). Thus, while the detection of cuticular pheromones is not necessary for courtship8, it is essential for species discrimination.
Multiple classes of gustatory sensory neurons on the D. melanogaster male foreleg detect pheromones to differentially regulate courtship. One heterogeneous sensory population expresses the ppk23 DEG/ENaC channel: a subset of ppk23+ neurons detects female pheromones, including 7,11-HD, to promote courtship and another subset detects male pheromones to inhibit courtship10-12. A smaller population of foreleg sensory neurons expresses the Gr32a receptor and detects 7-T to suppress inappropriate pursuit of D. simulans females and D. melanogaster males13,14. Although it is not known whether Gr32a and ppk23 directly bind cuticular hydrocarbons, they serve as essential components of these pheromone transduction pathways10-14. We therefore investigated how Gr32a and ppk23 shape mate preferences in D. simulans by using CRISPR-Cas9 genome editing to generate mutant alleles (Extended Data Fig 1d). Both Gr32a and ppk23 mutant males pursued conspecific females with the same vigor as wild-type D. simulans males (Fig. 1c), suggesting that either these receptors do not contribute to detection of 7-T in D. simulans or 7-T does not play a role in promoting male courtship15, despite being the predominant cuticular pheromone on D. simulans females6. D. simulans Gr32a mutant males also did not court D. melanogaster females or females of more distant species (Fig. 1c-d, Extended Data Fig. 1e-f). Thus, contrary to its role mediating courtship suppression in D. melanogaster13,14, Gr32a does not appear to influence mate choices in D. simulans.
In contrast, ppk23 mutants pursued D. melanogaster females and other drosophilids carrying diene pheromones with the same intensity as they courted D. simulans females and were unable to differentiate between D. melanogaster and D. simulans females in preference assays (Fig. 1c-d, Extended Data Fig. 1e-f). Moreover, ppk23 mutants were not deterred from courting D. simulans females perfumed with 7,11-HD (Fig. 1e, Extended Data Fig. 1g), suggesting that their promiscuous courtship reflects an inability to detect the D. melanogaster pheromone. Thus, males of both species rely on ppk23 to detect 7,11-HD, but detection of this pheromone initiates opposing behaviors in the two species—promoting courtship in D. melanogaster while suppressing courtship in D. simulans. We therefore developed genetic tools in D. simulans to examine ppk23+ pathways and identify the neural adaptations that contribute to species-specific pheromone responses.
fruitless specifies courtship circuitry
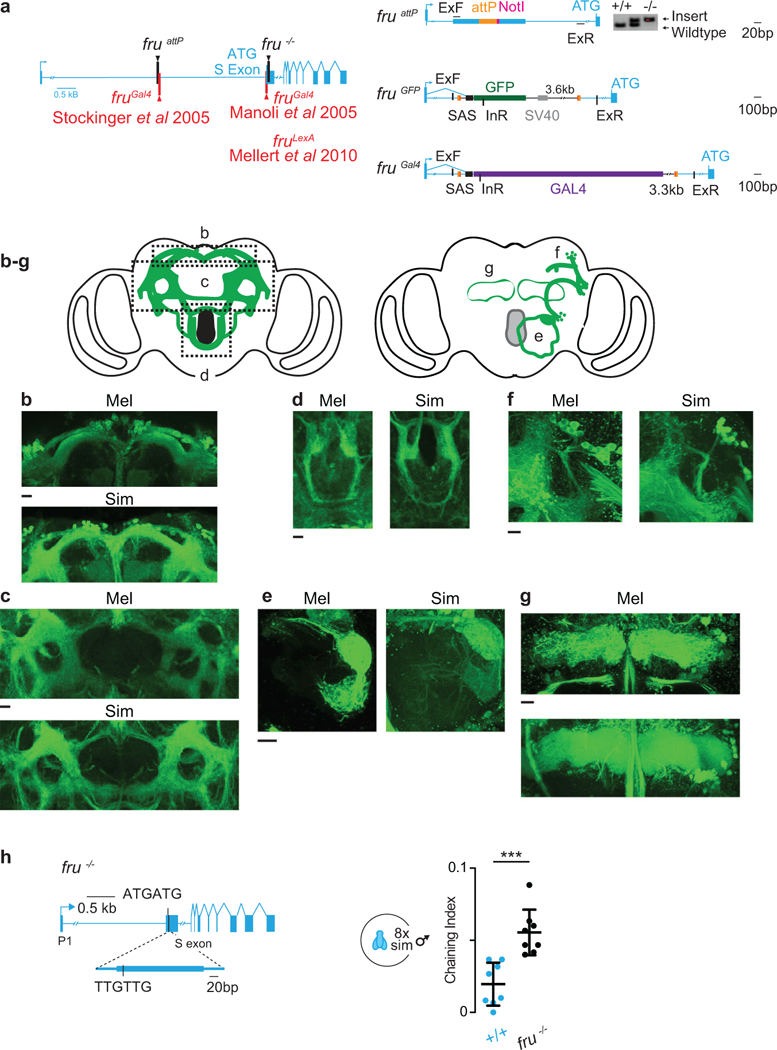
In D. melanogaster, the male-specific isoform of the Fruitless transcription factor (FruM)16,17 marks the majority of ppk23+ sensory neurons in the male foreleg10-12 along with the neural circuitry mediating most components of male courtship, from sensory detection to motor implementation. To gain genetic access to the repertoire of Fru+ neurons in D. simulans, including those that detect and process 7,11-HD, we integrated either the GFP or Gal4 coding sequence into the first intron of the fru locus (Extended Data Fig. 2a). We observed that in both species, fru marks a similar ensemble of neurons distributed throughout the male nervous system, with comparable innervation patterns evident in most brain neuropils (Fig. 2a, Extended Data Fig. 2b-g).
Figure 2: Fruitless plays a conserved role in male courtship.
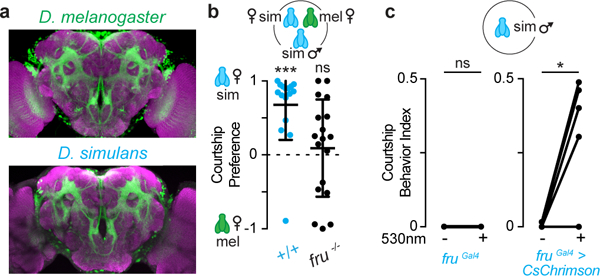
a, Fru+ neurons (green) with neuropil counterstain (magenta) in brains of D. melanogaster and D. simulans males. Scale bar: 30 μm. b, Courtship preferences of wild-type (+/+) and fru−/− D. simulans males. c, Fraction of time solitary males displayed courtship behaviors with or without optogenetic stimulation of fru+ neurons. b, one-sample t-test, c, Wilcoxon matched-pairs signed rank test. Bars: mean and s.d. See Supplemental Table 1 for details of statistical analyses.
The anatomic similarity of Fru+ neurons reflects the evolutionary conservation of fru as a master regulator of male courtship behaviors16-20. As in D. melanogaster, mutation of fruM resulted in D. simulans males that exhibited aberrant mate preferences while optogenetic activation of Fru+ neurons triggered multiple components of the courtship ritual in an isolated male (Fig. 2b-c, Extended Data Fig. 2h). Therefore, in both species, fru marks circuits that specify male courtship towards appropriate sexual partners, providing an inroad to trace the neural pathways that underlie mate discrimination, from the sensory periphery to higher brain centers.
Conserved peripheral sensory responses
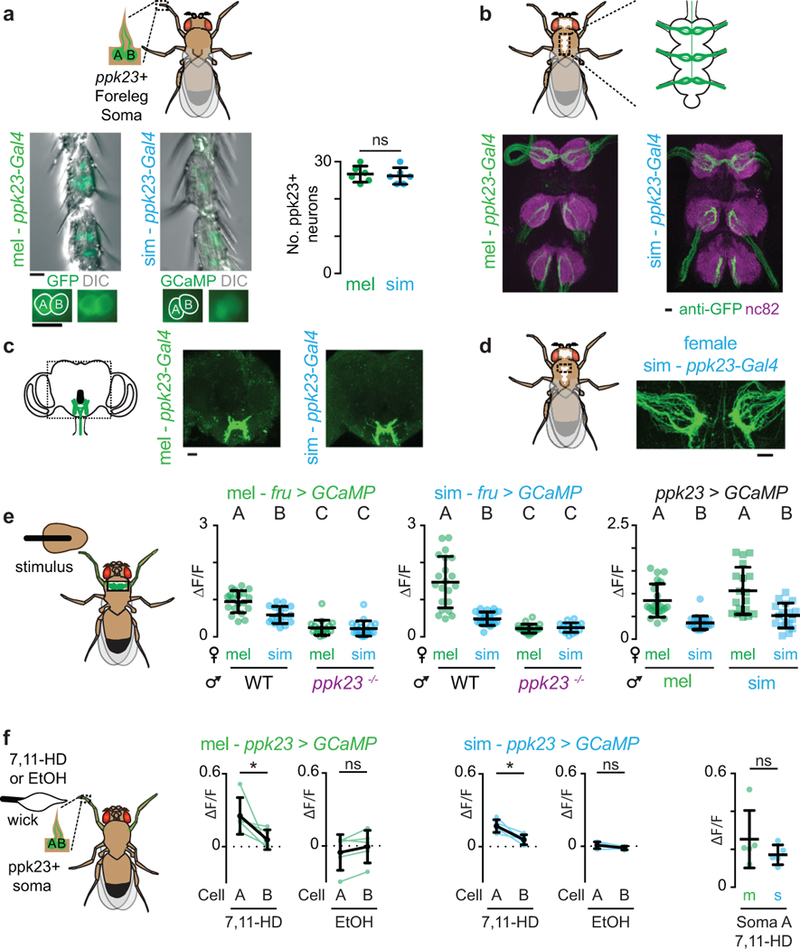
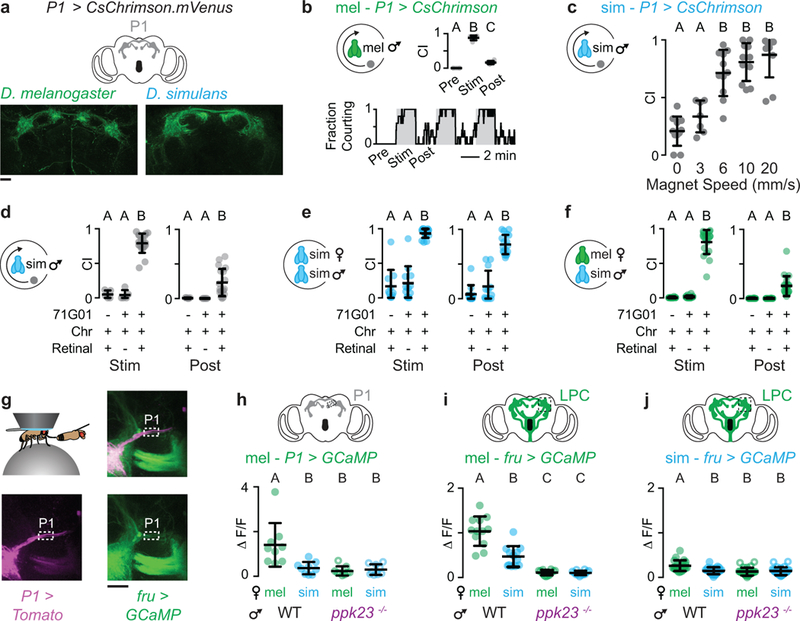
To investigate the pheromone tuning of the ppk23+ sensory population in D. melanogaster and D. simulans males, we expressed the Ca2+ indicator GCaMP6s in Fru+ neurons and monitored the aggregate responses of foreleg sensory afferents in the ventral nerve cord of a male as his tarsus contacted the abdomen of a female (Fig. 3a). We found that the Fru+ sensory neurons of both D. melanogaster and D. simulans males exhibited comparable pheromone tuning, responding robustly to the taste of a D. melanogaster female but weakly to a D. simulans female (Fig. 3b-c). In males of both species, sensory neuron responses were strongly attenuated in ppk23 mutants (Fig. 3b-c, Extended Data Fig. 3e), verifying that ppk23 plays a conserved and essential role in pheromone detection.
Figure 3: Conserved pheromonal tuning of ppk23+/Fru+ foreleg sensory neurons.
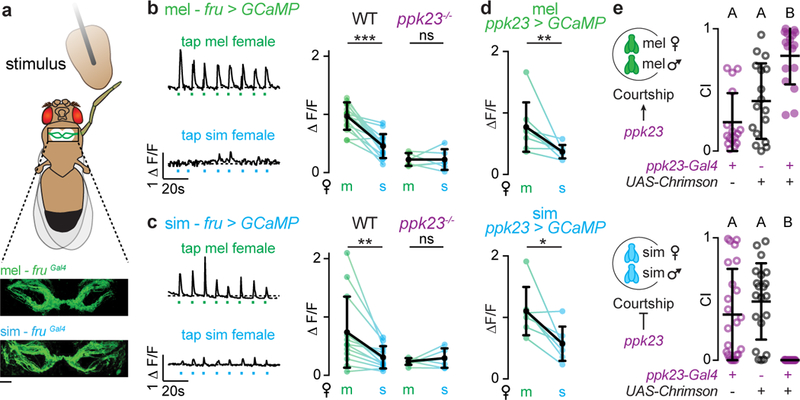
a, Schematic of ventral nerve cord preparation used for imaging with Fru+ foreleg sensory neurons expressing GCaMP. b, c, Functional responses of Fru+ foreleg afferents in D. melanogaster (b) or D. simulans (c) males evoked by the taste of a D. melanogaster (m) or D. simulans (s) female. Representative activity traces with time of taps indicated (left) and average ΔF/F in wild-type and ppk23−/− males (right). d, Functional responses (average ΔF/F) of ppk23+ foreleg afferents evoked by the taste of a D. melanogaster (m) or D. simulans (s) female. e, Courtship indices (CI) towards conspecific females during optogenetic stimulation of ppk23+ neurons in D. melanogaster and D. simulans males. b-d, Wilcoxon matched-pairs test, d, Kruskal-Wallis test. Black bars and dots: mean and s.d. Scale bar: 10 μm. See Supplemental Table 1 for details of statistical analyses.
To directly compare the distribution of 7,11-HD-responsive sensory neurons across species, we generated a ppk23-Gal4 construct in D. simulans, taking advantage of the fact that in D. melanogaster the ppk23 promoter reproduces endogenous channel expression11. We found that the ppk23 promoter from either species drove expression in a comparable number of sensory neurons in the male foreleg that exhibited a similar sexually-dimorphic pattern of axonal projections within the ventral nerve cord (Extended Data Fig. 3a-d). Imaging the aggregate activity of these ppk23+ sensory afferents revealed equivalent pheromone tuning across species, with significantly stronger responses to the taste of a D. melanogaster female than a D. simulans female evident in males of both species (Fig. 3d, Extended Data Fig. 3e). Moreover, we observed no difference in the distribution or magnitude of responses in ppk23+ soma when we stimulated individual sensory bristles with synthetic 7,11-HD (Extended Data Fig. 3f). As in D. melanogaster11,21, ppk23+ soma were paired beneath a sensory bristle, and only one soma of each pair responded to 7,11-HD. Somatic responses to synthetic 7-T were negligible in both species (data not shown), mirroring the weak responses evoked at the population level by the taste of a D. simulans female.
Together, these experiments demonstrate that a quantitatively and qualitatively similar population of ppk23+ sensory neurons is tuned to 7,11-HD in both D. melanogaster and D. simulans males. To assess if activation of ppk23+ sensory neurons could replicate the opposing courtship behaviors elicited by 7,11-HD, we expressed CsChrimson in this sensory population in males of both species and examined how optogenetic activation influenced courtship of a conspecific female. While optogenetic stimulation of ppk23+ sensory neurons in D. melanogaster males drove increased courtship11,12, it inhibited courtship towards an otherwise attractive conspecific female in D. simulans males (Fig. 3e), replicating the courtship suppression that results from perfuming a D. simulans female with 7,11-HD. Therefore, activation of the homologous ppk23+ sensory neuron population is sufficient to drive opposing behavioral responses in D. melanogaster and D. simulans males, suggesting that differences must exist in the downstream circuits that link pheromone detection to courtship decisions.
Divergent responses in central circuits
In D. melanogaster, male-specific P1 neurons form a central node in the Fru+ circuitry that integrates input from multisensory pathways to represent the suitability of a potential mate and triggers the initiation of courtship21-26. Anatomic labeling revealed that in both species P1 neurons exhibit rich projections in the lateral protocerebral complex (LPC, Fig. 4a), a sexually-dimorphic Fru+ neuropil21,25,27.
Figure 4: Divergent pheromone responses in courtship-promoting P1 neurons.
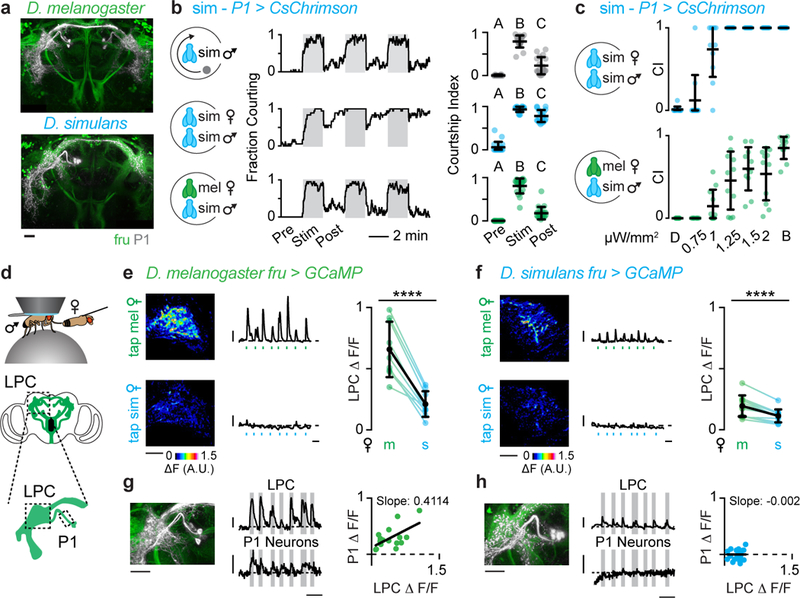
a, P1 neurons (grey) innervate the Fru+ (green) lateral protocerebral complex (LPC). b, c, Optogenetic stimulation of P1 neurons in D. simulans males. b, Courtship towards a rotating magnet (top), D. simulans female (middle), or D. melanogaster female (bottom). Fraction of flies courting (left, grey boxes: illumination with bright light). Courtship indices (CI) pre-, during, and post-stimulation (right). c, Courtship indices of D. simulans males towards D. simulans (top) and D. melanogaster females (bottom) in dim (D) or bright (B) white light or indicated 627 nm illumination. d, In vivo preparation used for functional GCaMP imaging (top) and cartoon of Fru+ neurons (bottom, regions imaged outlined). e, f, Functional responses of Fru+ neurons in the LPC of D. melanogaster (e) and D. simulans (f) males evoked by tapping D. melanogaster (m) and D. simulans (s) females. Representative GCaMP fluorescence increase upon stimulation (left). Representative activity traces with time of stimulating taps indicated (middle). Average ΔF/F for individual males (right). g, h, Simultaneously recorded activity of LPC and P1 neurons in D. melanogaster (g) and D. simulans (h) males evoked by the taste of a D. melanogaster female. Magnified P1 neuron anatomy (left, same images as in a). Representative activity traces (middle, grey bars indicate taps) and relationship between responses evoked by individual taps in LPC and P1 neurons (right). b, c, Kruskal-Wallis test, e, f, paired t-test and g, h, linear regression. Black bars and dots: mean and s.d. Scale bars: 10 μm. Scale bars for activity traces: vertical, 0.25 ΔF/F, horizontal, 10s. See Supplemental Table 1 for details of statistical analyses.
To test whether P1 neurons play a conserved role in regulating courtship across species, we introduced a transcriptional enhancer (R71G01-Gal4) that labels this neural population in D. melanogaster23 into the D. simulans genome and used it to drive expression of CsChrimson (Extended Data Fig. 4a). Optogenetic activation of P1 neurons in D. simulans males strongly enhanced courtship of conspecific females and drove almost incessant courtship of inappropriate targets, including D. melanogaster females and a small rotating magnet (Fig. 4b, Supplementary Video 1). Pursuit of the magnet was significantly reduced when it was stationary or moving slowly, highlighting the importance of motion for vigorous courtship23,26 (Extended Data Fig. 4c). Courtship towards all targets remained elevated after stimulation, indicating that transient activation of P1 neurons is sufficient to trigger an enduring state of sexual arousal across species24-26,28 (Fig. 4b, Extended Data 4b-f).
Interestingly, titrating the stimulating light revealed that evoked courtship in D. simulans males was significantly weaker towards D. melanogaster females than D. simulans females (Fig. 4c), raising the possibility that 7,11-HD may counter P1 neuron excitation. To compare how pheromone signals are propagated from the periphery to P1 neurons and other central Fru+ populations, we monitored responses either in the LPC or P1 neurons in a tethered male as he tapped the abdomen of a target fly with his foreleg (Fig. 4d, Extended Data Fig. 4g). In D. melanogaster males, robust responses were evoked in the LPC by the taste of a D. melanogaster, but not a D. simulans female, reflecting strong excitation of P1 neurons by the pheromones of an appropriate mate (Fig. 4e, g, Supplementary Video 2, 3)25,29. In contrast, in D. simulans males neither the P1 neurons nor any other Fru+ neural population in the LPC were activated in response to the taste of a D. simulans female (Fig. 4f, Supplementary Video 4) consistent with behavioral evidence that contact pheromones are not necessary to promote D. simulans courtship8,15. Neurons in the LPC of D. simulans males were, however, weakly activated by the taste of a D. melanogaster female, but these signals failed to propagate to the P1 neurons (Fig. 4f, h, Supplementary Video 5). Responses were lost in ppk23 mutants verifying that pheromone signaling to the LPC relies on ppk23+ sensory pathways (Extended Data Fig. 4h-j). Opposing behavioral responses to 7,11-HD in the two species therefore appear to be mirrored by divergent P1 neuron excitation.
Species-specific central circuit changes
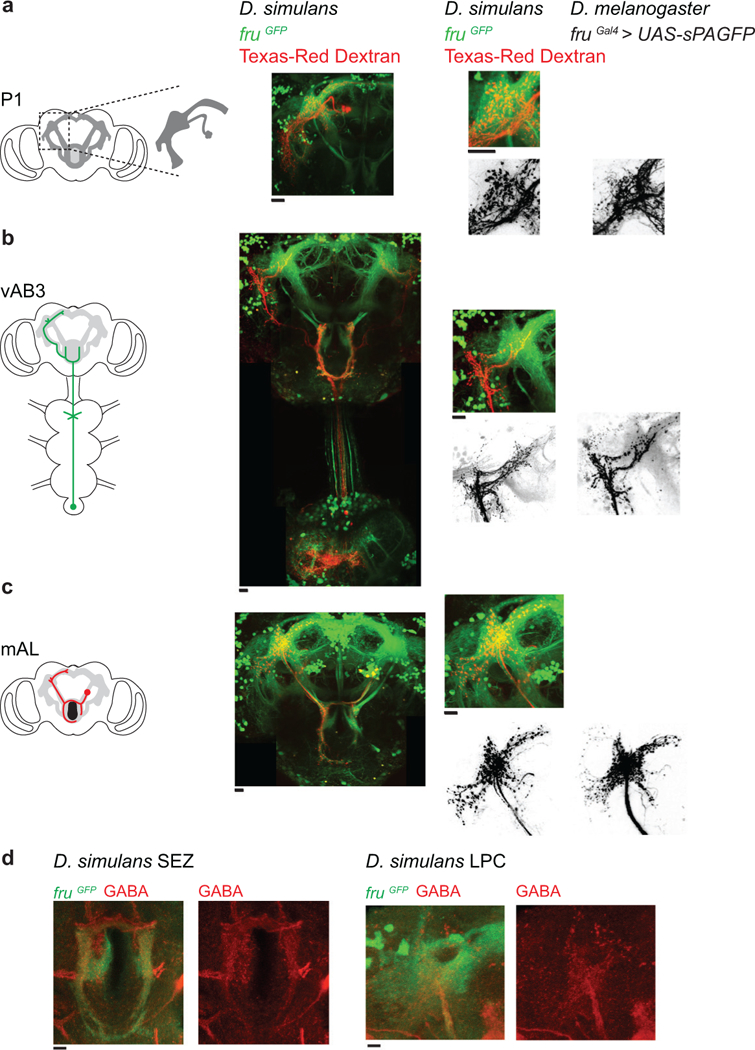
In D. melanogaster and D. simulans males, equivalent pheromone responses at the sensory periphery are translated into differential excitation of P1 neurons, implying that the ascending pathways that convey pheromone signals from the forelegs to the LPC have diverged. In D. melanogaster, 7,11-HD signals are transmitted from ppk23+ sensory neurons to vAB3 neurons whose dendrites reside in the ventral nerve cord and whose axons project to the LPC, providing a direct excitatory route to the P1 neurons25 (Fig. 5a). vAB3 neurons also extend collaterals into the subesophageal zone (SEZ), where they synapse onto GABAergic mAL interneurons25. mAL axons arborize extensively in the LPC and provide inhibitory input onto P1 neurons, forming a feed-forward inhibitory circuit motif that tempers P1 neuron excitation and regulates the gain of pheromone responses21,25. In D. melanogaster, P1 neurons thus receive excitatory and inhibitory input even in response to the taste of a conspecific female, with 7,11-HD evoking net excitation to trigger courtship. Anatomic labeling of D. simulans vAB3 and mAL neurons revealed broadly conserved projection patterns within the LPC (Fig. 5b, Extended Data Fig. 5), indicating that they remain anatomically poised to synapse onto P1 neurons in both species.
Figure 5: Differential propagation of ascending pheromone signals to P1 neurons.
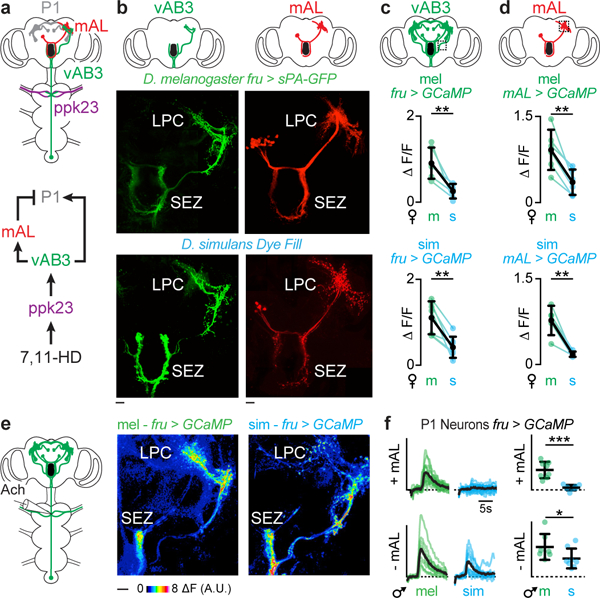
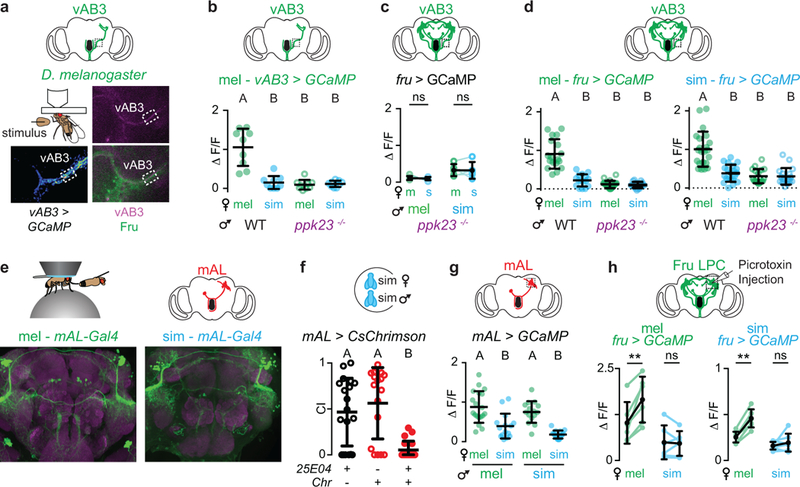
a, Schematic of Fru+ circuit that processes 7,11-HD. b, Anatomy of vAB3 and mAL neurons in D. melanogaster and D. simulans. SEZ: suboesophageal zone, LPC: lateral protocerebral complex. Scale bars: 10 μm. c, d, Average ΔF/F for individual males evoked by D. melanogaster (m) and D. simulans (s) females in vAB3 (c) and mAL (d) neurons. e, Representative GCaMP fluorescence increase in Fru+ neurons evoked by direct vAB3 stimulation. f, P1 neuron responses to vAB3 stimulation before (top) and after (bottom) mAL severing in D. melanogaster (green) and D. simulans (blue) males. Coloured lines: individual stimulations, black lines: average (left). Graph plots peak ΔF/F per animal (right). Scale bars for functional responses: 0.6 ΔF/F. c, d, paired t-test, f, unpaired t-test. Bars: mean and s.d. See Supplemental Table 1 for details of statistical analyses.
Given the structural conservation of these ascending pathways, we considered whether there might be functional differences in how pheromone signals are transmitted through this circuit to generate divergent P1 neuron responses. Functional imaging revealed that vAB3 neurons were similarly tuned to pheromones across species, with robust responses elicited only by the taste of a D. melanogaster, but not a D. simulans female (Fig. 5c, Extended Data Fig. 6a-d). Moreover, in both species vAB3 pheromone responses were lost in ppk23 mutants (Extended Data Fig. 6b-d). Therefore, while ppk23+ sensory neurons drive opposing courtship behaviors in D. melanogaster and D. simulans males, they nevertheless elicit comparable pheromone responses in the homologous ascending pathways in the brain.
To directly compare the role of mAL neurons across species, we introduced a genetic driver (R25E04-Gal4) that labels mAL neurons25 into D. simulans (Extended Data Fig. 6e). Optogenetic activation of mAL neurons in D. simulans males strongly attenuated courtship (Extended Data Fig. 6f), replicating the robust courtship suppression mediated by mAL neurons in D. melanogaster21 and confirming that this population inhibits neurons in the LPC in both species. Functional imaging revealed that mAL neurons were equivalently excited by the taste of a D. melanogaster female in both D. melanogaster and D. simulans males (Fig. 5d, Extended Data Fig. 6g). Thus, in both species vAB3 and mAL pathways are similarly activated by D. melanogaster female pheromones, suggesting that alterations in the strength of their signaling to P1 neurons might underlie the emergence of species-specific mate preferences.
To examine this possibility, we directly stimulated vAB3 neurons through iontophoresis of acetylcholine onto their dendrites within the ventral nerve cord and performed multi-plane functional imaging to visualize activated Fru+ neurons in the brain (Extended Data Fig. 7a-b). While this stimulation elicited equivalent responses in the vAB3 and mAL neurons of both species, P1 and other neurons of the LPC were excited only in D. melanogaster and not in D. simulans males (Fig. 5e, f, Extended Data Fig. 7d-g), mirroring the differential propagation of pheromone signals through this pathway in vivo. In both species, the responses of all Fru+ neurons were lost after we severed the vAB3 axons with a two-photon laser, verifying that they mediate these divergent activity patterns (Extended Data Fig. 7c).
To assess whether mAL-mediated inhibition could counter vAB3 excitation to suppress P1 neurons in D. simulans, we used a two-photon laser to sever the mAL axonal tract and prevent the transmission of their GABAergic signal. After mAL severing, we found that P1 neurons could now be excited by vAB3 stimulation in D. simulans males, although to a lower level than in D. melanogaster males (Fig. 5f, Extended Data Fig. 7g). Pharmacological weakening of inhibition by injection of the GABA-receptor antagonist, picrotoxin, into the LPC similarly enhanced pheromone responses in vivo, unmasking excitation specifically in response to the taste of D. melanogaster female (Extended Data Fig. 6h). These results suggest that mAL-mediated inhibition antagonizes vAB3 excitation to fully suppress P1 neuron responses in D. simulans, but not D. melanogaster males, revealing how alterations in excitatory and inhibitory input to this population may generate divergent responses to the same pheromone cue.
Discussion
The sensory periphery has been proposed to be the most evolutionarily labile element of the nervous system30-32, as changes in the expression or tuning of sensory receptors can allow for the emergence of species-specific behaviors without necessitating potentially more complex developmental rewiring of central pathways in the brain. In contrast, our results suggest that species-specific behavioral responses to 7,11-HD arise through functional alterations in how pheromone signals are propagated through a central circuit. By altering the balance of excitatory vAB3 and inhibitory mAL signaling to P1 neurons, 7,11-HD is transformed from an excitatory signal that promotes courtship in D. melanogaster into an inhibitory signal that suppresses courtship in D. simulans. While our analysis highlights the importance of this pheromone pathway in shaping species-specific mate preferences, we cannot exclude the possibility that additional inputs to P1 neurons or other targets of mAL and vAB3 neurons also contribute to divergent courtship decisions. Nevertheless, our data suggest that the branched architecture of pheromone processing pathways serves as a substrate for the evolution of mate preferences, pointing to the existence of favorable sites within neural circuits to instantiate adaptive behavioral changes, analogous to how specific nodes within developmental regulatory networks contribute to morphological diversity33.
The conserved tuning of ppk23+ neurons implies that D. simulans males dedicate this sensory pathway to detecting D. melanogaster female pheromones, rather than sensing the chemical cues carried by their conspecific females. Consistent with this idea, while P1 neurons are sufficient to elicit courtship in D. simulans males, they are not excited by the taste of a D. simulans female. Given that D. simulans cuticular pheromones are sexually monomorphic and offer ambiguous signals for mate recognition, males likely rely on additional sensory inputs for their arousal. Indeed, the fervent courtship exhibited by D. simulans ppk23 mutants towards females of different species demonstrates that D. simulans males can be aroused in the absence of any species-specific excitatory cue. Dienes, like 7,11-HD, actively suppress this arousal, presumably through recruitment of strong mAL-mediated inhibition via ppk23+ pathways. Together, these observations reinforce the notion that pheromone communication in Drosophila serves to focus a male’s desire such that flies lacking cuticular pheromones can be inherently attractive and appropriate mate choices are honed by specific inhibitory chemical cues8,9,13,14.
Peripheral adaptations likely play a significant role in the evolution of novel chemical sensitivities2,31,32. In the case we have studied, however, preserving the sensory periphery while varying central circuits provides a mechanism to alter the behavioral valence of the same chemical cue. As D. melanogaster and D. simulans diverged, their reproductive isolation was likely strengthened by the ability of both species to detect the same pheromone but assign it different meaning through these central circuit modifications. Interestingly, in D. melanogaster P1 neuron excitability is regulated by the social history of a male24,34. This suggests that both experience-dependent and evolutionary adaptations may act on the same neural substrate to modify sensory integration and mate choices, similar to how phenotypic plasticity may facilitate morphological evolution35. Thus, functional reweighting of sensory inputs at flexible nodes in the nervous system, shaped by evolutionary selection or individual experience, may allow alternative behavioral responses to the same sensory signal.
Methods
Flies stocks and husbandry
Flies were housed under standard conditions at 25 °C under a 12 hr light: 12 hr dark cycle. Fly stocks and sources: Drosophila melanogaster Canton-S, 20xUAS-IVS-GCaMP6s (Bloomington #42746, #42749), UAS-mCD8::GFP (#5130, #5137), LexAop-GCaMP6s (#53747), 10xUAS-IVS-myr::tdTomato (#32222), R71G01-Gal4 (#39599), AbdB-Gal4 (#55848) R25E04-Gal4 (#49125), and 20xUAS-IVS-CsChrimson.mVenus (#55134) were obtained from the Bloomington Stock Center. D. sechellia (14021-0248.25) and D. erecta (14021-0224.01) were obtained from the UCSD Stock Center. The following were gifts, obtained as indicated: D. ananassae and D. simulans (Richard Axel), D. simulans attP2039 36 (Yun Ding and David Stern, Janelia Research Campus); SplitP1-Gal4 24 (David Anderson, Caltech); fruLexA37 and fruGal416 (Barry Dickson, HHMI/Janelia Farm Research Campus); D. melanogaster ppk23-Gal4 11 (Kristin Scott, UC Berkeley); LexAop-myr::tdTomato (Cesar Mendes Columbia University); UAS-SPA-t2a-SPA-GFP 25. Please see Supplemental Table 1 for detailed descriptions of genotypes used in each experiment.
Courtship behavior assays and analysis.
To standardize fly size and life history across trials, all flies used for behavioral assays were reared in food vials at a low density (3 females and 3 males as parents). All experimental animals were male and all stimulus animals were virgin females unless noted. Males for all assays were collected as virgins, placed in individual food vials (d = 3 cm, h = 9.5 cm) and housed in isolation for 3-6 days. Males were added to behavioral assays by direct aspiration from the food vial without ice or CO2 anesthetization, except for the tarsi ablation experiments in which males were ice-anesthetized. Virgin females were group-housed in food vials and aged 3-6 days. All behavior experiments were conducted with the experimenter blinded to the genotype of any male or female fly that was a variable in a given experiment. The experimenter was unblinded only after analysis of the assay. All behavioral assays were conducted at zeitgeber 0 to 3 hrs except for assays using flies reared in the dark. All behavioral assays were conducted in a heated, humidified room (25 °C, 46% RH) on a back-lite surface (Slim Edge-Light Pad A-5A, 5400K, 6 kLux) to maximize courtship indices. For all statistical comparisons of behavior, an equal sample size per condition per day was used to control for potential variations in experimental conditions across days. For all preference assays, only males who spent more than 5% of the time courting (>30 s of total courtship) were included in the analysis. Courtship behaviors included in analysis were singing, tapping, licking, orienting, abdomen bending and chasing. QuickTime7 software was used when analyzing courtship videos.
For all preference assays (Fig. 1b, 1d, 1e and 2b), a male and two female flies were placed into a 38 mm diameter, 3 mm height circular chamber with sloping walls (courtship arena)38. The experimenter, who was blinded, kept track of the females during the assay either by noting which female was introduced first to the courtship arena or by painting a small white dot on the thorax of the female 16-20 hrs prior to the start of the experiment under ice anesthesia. Results were not affected by the method used to differentiate between females and the experimenter was unblinded only after analysis. The preference index reflects the amount of time the male spent courting one female subtracted from the amount of time spent courting the other female divided by the total time spent courting within a 10 min assay. When males displayed no preference for females it was because, on average, the population courted the two females an equal amount of time. The wide spread of the data reflects the fact that individual males will sometimes continue to pursue a single female throughout the assay even if both females are equivalent. In Extended Data Fig. 1 we plot the courtship indices (time spent courting/total time of assay) underlying the preference indices of Fig. 1.
For the tarsi ablation assays (Fig. 1b, Extended Data Fig. 1a-c), males were ice-anesthetized 16-20 hrs prior to the start of the experiment and had either the distal three tarsal segments on both forelegs removed or a sham treatment that left their appendages intact. For single-choice assays (Extended Data Fig. 1b, c), the rear leg tarsi were ablated as a control. Males were then returned to a food vial to recover in isolation. Males without foreleg or rearleg tarsi still vigorously courtship females.
In D. simulans single pair courtship assays (Fig. 1c, 3e, 4b and 4c. Extended Data Fig 1b, 1c, 4c, 4e, 4f and 6f), a single virgin female and a D. simulans male were loaded into a courtship arena. Courtship index (time spent courting divided by total time together) was measured for the 10 min after the male was introduced into the chamber.
For the chaining assay (Extended Data Fig. 2h), eight males were loaded into a courtship arena and chaining index (time where at least three of the males were simultaneously courting each other) was measured for 10 min after the males were introduced into the chamber.
For the preference assays with perfumed females (Fig. 1d), we provided a male the choice between a D. simulans virgin female perfumed with 7,11-HD (7(Z), 11(Z)-heptacosadiene, 10 mg/mL Cayman Chemicals #100462-58-6) or ethanol using a previously published protocol8. Briefly, 7,11-HD or ethanol was added to 1 mL of ethanol in a 2mL glass vial (Themo Scientific #03-377D), which was placed on ice and dried it using a stream of nitrogen gas. Seven ice-anesthetized female flies were placed in each vial, which were then gently vortexed three times for thirty seconds before placing the females on food for an hour to recover. After perfuming, separate aspirators were used to handle the flies in order to avoid pheromone contamination. Courtship indices underlying courtship preference in Fig. 1d were plotted in Extended Data Fig. 1g.
For fruGal4 optogenetic stimulation experiments (Fig. 2c), fruGal4>UAS-CsChrimson-tdTomato or fruGal4 parental controls were reared in the dark for 3-7 days after eclosion. Male flies were transferred to food containing 400 μM all-trans-retinal (Sigma R2500-10MG) 16-20 hrs before the assays24. Single male flies were loaded into a courtship arena and allowed to acclimate for 1 min. Flies were subsequently recorded for 7 min, alternating between 1 min dim white light followed by 1 min with constant LED stimulation (530 nm Precision LED Spotlight with Uniform Illumination-PLS-0530-030-S, Mightex Systems at an intensity of 0.02 mW/mm2). The experimenter was blinded to the genotype of the flies until after the experiment. Genotypes were established using PCR screening of the UAS transgene. We quantified a courtship behavior index, which represented the fraction of time a male spent performing courtship behaviors, with or without LED stimulation.
For ppk23-Gal4 (Fig. 3e) and 25E04-Gal4 (Extended Data Fig. 6f) optogenetic stimulation experiments, we used D. simulans w+ 25E04-Gal4, ppk23-Gal4 and UAS-CsChrimson.tdTomato parental stocks and D. melanogaster w- ppk23-Gal4 and UAS-CsChrimson parental stocks lacking balancer chromosomes. The original D. simulans 25E04-Gal4, ppk23-Gal4 and UAS-CsChrimson.tdTomato parental stocks were in a background mutant for white (w-), which exhibited extremely low courtship indices (~5% on average) presumably due to their low visual acuity, in contrast to D. melanogaster w- transgenic lines that maintained robust courtship even in a white mutant background (data not shown). We, therefore, backcrossed D. simulans stocks to wild type flies to generate w+ strains and confirmed their genotype by PCR. All crosses were reared in the dark. Virgin male progeny were reared in isolation in the dark for 3-7 days after eclosion and then transferred to food containing 400 μM all-trans-retinal 16-20 hrs before the assays24. We found that D. simulans courtship was less robust under single wavelength LED illumination or dim white light illumination so we conducted our assays using the same lighting conditions used for the non-optogenetic courtship assays (Slim Edge-Light Pad A-5A, 5400K, 6 kLux). Single male flies were loaded into a courtship arena that contained a conspecific virgin female and courtship index was assayed over a 10 min period after the male was introduced. Due to the absence of balancers and easy to follow positive markers that do not affect courtship behaviors in D. simulans, stable, homozygous stocks of most transgenes have been difficult to generate. Therefore, progeny of crosses were a mix of wild type, parental controls, and experimental flies. The experimenter was blinded to the genotype of the flies until after the experiment. Genotypes were established using PCR sequencing of the Gal4 and UAS transgenes. Males of all genotypes exhibited similar levels of locomotion when they were not courting.
For optogenetic stimulation of P1 neurons in D. simulans (Fig. 4b, c, Extended Data Fig. 4c-f), we used R71G01-Gal4>UAS-CsChrimson.mVenus males that carried a wild type (w+) X chromosome. As in other behavioral experiments, P1 neuron-elicited courtship pursuit was far weaker in males mutant for white (data not shown). For optogenetic stimulation of P1 neurons in D. melanogaster w-; 71G01-Gal4>UAS-CsChrimson.mVenus males lacking balancer chromosomes were used. We found a high degree of lethality in both the D. melanogaster and D. simulans R71G01-Gal4>UAS-Chrimson crosses grown on standard fly food containing cornmeal (presumably due to the low levels of retinal metabolized from vitamin A). Therefore, we grew these crosses on sugar-yeast food in the dark (Per 1L of water: 100g Brewer’s Yeast, 50g sucrose, 15g agar, 3mL Propionic acid, 3g p-Hydroxy-benzoic acid methyl ester). Progeny of parental crosses were group housed in the dark for 3-7 days after eclosion before males were transferred to food containing 400 μM all-trans-retinal 48 hrs before the assays24. Single male flies were loaded into a courtship arena that contained either a virgin D. simulans female, virgin D. melanogaster female or a magnet (radius=1mm, height=1mm) rotating in a circle at 9mm/sec25. Upon loading the male fly into the chamber with the target, we alternated between 2 min of dim light (10 Lux) and 2 min of bright light (6 kLux) in a 14 min assay. Dim light was used because it was sufficient to allow males to visually track a target object but insufficient to optogentically activate the P1 neurons, as evidenced by the lack of courtship towards a magnet or D. melanogaster female prior to bright illumination. Assays were filmed (Sony alpha6) and later scored for courtship behavior, binned in 1-second intervals. We calculated “fraction courting” as a function of time by dividing the number of males courting during a one-second interval (aligned from the start of the assay) by the total males tested. Courtship indices were also calculated for each individual at different times relative to the optogenetic stimulation: “pre” represents the courtship index of the 2 min prior to the first bright light stimulus, “stimulus” represents an average of the courtship indices during bright light illumination period and “post” represents an average of the courtship index after the bright light illumination. For the parental controls (Extended Data Fig. 5d-f), we used w+;UAS-CsChrimson.mVenus males grown in an identical way as the experimental animals and similarly placed on retinal for 48 hours. For the non-retinal controls (Extended Data Fig. 5d-f), w+;71G01-Gal4>UAS-CsChrimson.mVenus males were placed in a new vial of SY food for 48 hours prior to the experiment. To characterize evoked courtship as a function of light intensity (Fig. 4c), each experiment was initiated by illuminating for two minutes with dim light (10 Lux) to establish a baseline and then we added increasing intensities 627nm illumination from an LED, with two minutes at each intensity, and finally ending with two minutes of bright white light illumination. A power meter (Coherent PowerMax-USD light sensor and Coherent PowerMax PC Software) was used to measure the intensity of 627nm illumination in the behavioral chamber during the assay. To examine how elicited courtship depends on the speed of the magnet (Extended Data Fig. 4c), each male was given the opportunity to court a magnet moving at 0, 3, 6, 10 and 20 mm/s during bright white light illumination. Magnet speed order was randomized and there were one-minute periods in between stimulus trials were the light was off and the magnet was stationary.
Targeted mutagenesis and transformation in D. simulans
The protocols described below combine methods for CRISPR mutagenesis39-41. See last section of the methods for sgRNA sequences, sgRNA primers and sequencing primers.
CRISPR guide RNAs had an 18-20 nucleotide target sequence and were flanked by a 3’ PAM sequence (‘NGG’) and a 5’ T7 RNA polymerase recognition sequence (‘GG’). Before designing sgRNAs, Sanger sequencing was carried out across target genomic sites to identify single nucleotide polymorphisms. Guide RNA template was amplified using KOD HotStart (Millipore #71086-3) and 0.5 μM forward and reverse primers as templates for each other. Reactions were cycled on an Eppendorf MasterCycler (98 °C 30 s, 35 cycles of [98 °C 10 s, 60 °C 30 s, 72 °C 15 s], 72 °C 10 min, 4 °C hold) and then purified (PCR purification kit, QIAGEN). In vitro transcription of 300 ng of sgRNA template DNA using T7 MEGAscript kit (Ambion) was carried out at 37 oC for 16-20 hrs. Turbo DNAse was added for an additional 15 min at 37 oC before adding a 10% ammonium acetate stop solution. The RNA was isolated by phenol/chloroform extraction and precipitated with isopropanol at −20 oC for 16-20 hrs. The precipitated reaction was purified with 70% ethanol, re-suspended with RNAse-free water, and frozen in small aliquots at −80 oC for long-term storage. Before injection, the sgRNA was thawed on ice and purified using sodium acetate and ethanol before being re-suspended in RNAse free water.
CRISPR injection mixtures contained 300 ng/μL recombinant Cas9 protein (CP01, PNA Bio), 40 ng/μL sgRNA (per guide) and 125 ng/μL single stranded DNA oligonucleotide. CRISPR injection mixture was combined on ice and placed at −80 to −20 oC until the injection. PhiC-31 mediated recombination injection mixtures contained donor plasmid (1 μg/μL) and helper plasmid (1 μg/μL), both of which were purified using endotoxin-free plasmid prep kits (Qiagen). Rainbow Transgenic Flies, Inc performed all injections.
To generate mutant alleles of ppk23 and Gr32a (Extended Data Fig. 1d), we designed sgRNAs targeting three regions spanning 200 bp of the first exon for each gene. These sgRNAs were combined into a single cocktail and injected into ~200 wild type D. simulans eggs. Only CRISPR guide sequences that generated the mutations are listed in Table 2. The adult G0 flies were individually crossed to wild type male or virgin female flies. For each G0 cross, we PCR screened 8-16 progeny (F1s) for the presence of an insertion or deletion. Genomic DNA was extracted from the F1 flies by placing a midleg, hindleg or wing into a well of a 96-well plate containing 20 μL of lysis buffer (10 mM Tris pH 8.2, 1 mM EDTA pH 8.0, 25 mM NaCl, 400 μg/ml Proteinase K). The fly was then placed in the corresponding well of a 96-well deep well plate (Brandtech VWR #80087-070) filled halfway with fly food and capped with cotton. The 96-well plate of lysis buffer and fly legs was then heated at 37 oC for 1 hr followed by a 2 min heat inactivation at 95 oC. 3.2 μL of genomic DNA from the leg was used as the PCR template for a 20 μL reaction of Apex Taq Red Master Mix (Genesee Scientific #42-138) for 35 cycles. The PCR screening primers spanned an approximately 400 bp region encompassing the three sgRNA target sites. In order to maximize resolution of heterozygous indels, we ran the entire PCR reaction on a 2% agarose gel at 70 V. Using these specifications, the smallest indel we detected was ~20 bp. We backcrossed any flies that had a heterozygous mutation to wild type flies and then homozygosed their progeny. Flies were Sanger sequenced to determine if an in-frame stop codon was introduced. Homozygous stocks were genotyped and Sanger sequenced for three generations to ensure that the population was pure.
For recombination into the fru locus, we prescreened sgRNAs to identify those that mediate efficient cutting. Nine sgRNAs were designed, six which targeted the intronic region upstream of the first exon and three which targeted the first exon. Pools of three sgRNAs were injected into 100 embryos and genomic DNA was extracted from surviving flies. We first used the T7 endonuclease1 (T7E1) assay for preliminary qualitative analysis of cutting propensity (http://www.crisprflydesign.org/t7-endo-i-assay/). Two positive hits from the T7E1 assays were analyzed using MiSeq analysis39, which revealed that over 95% of the reads in PCR product were mutated. We only used these two sgRNAs (listed in Table 2), one targeted to the exon and one targeted to the intron, for generating mutant flies.
To generate fruattP flies, we integrated in a 200 bp single stranded oligonucleotide designed to have the minimal 51 bp attP sequence42, a diagnostic restriction digest site and ~70 bp arms of homology that flanked the CRISPR target site into the fru intron (Extended Data Fig. 2a). To generate fru−/− flies, we integrated in a similar attP-containing oligo into the first exon of the FruM coding sequence, but also used this oligo to replace the ATGATG start site with TTGTTG (Extended Data Fig. 2h), as has been reported previously in D. melanogaster17. The sgRNA, attP-oligo and Cas9 protein were injected into ~200 embryos. G0s were singly crossed to wild type virgin flies. F1s with successful integration of the attP site were identified by PCR genotyping, isolated, and sequenced using methods described above. fruattP and fru−/− F1s were backcrossed to wild type flies and then homozygosed. Homozygous stocks were genotyped for three generations to ensure that the population was pure.
We used PhiC31-mediated recombination to integrate attB plasmids containing larger transgenes into the intronic fruattP locus (Extended Data Fig. 2a). We chose not to use eye color visual markers to avoid complications of the white mutation on behavior. To determine if the transgene was homozygous, we screened F1s using the protocol described above for the binary presence of a PCR product using one primer pair that spanned the transgene and one that spanned the genomic locus. To create a stable stock of flies, we crossed homozygous virgin females to D. simulans males with a balancer allele on their 3rd chromosome (In(3R)Ubx, Flybase ID FBab0023784, UCSD Stock Center #14021-0251.098). Progeny with the Ubx visible mutation were crossed together and subsequent progeny were genotyped.
Plasmid design and construction
attB-SAS-GFP (Extended Data Fig. 2a) was made by amplifying eGFP from pUAST-mCD8GFP using primers that attached a splice acceptor site43 and kozak sequence onto the 5’ end of the GFP and an SV40 termination sequence onto the 3’ end. A nested-PCR was performed to attach Gibson-assembly adaptors onto the GFP PCR product, which was then combined with PCR-linearized pHD-DsRed-attP using Gibson assembly (NEB). The plasmid was then digested with EcoRI and NotI to insert a 51 bp attB oligo with flanking EcoRI and NotI sites. The double stranded oligo was made by annealing two single-stranded oligos together.
attB-SAS-Gal4 (Extended Data Fig. 2a) was made by integrating attB-SAS and Gal4 DNA fragments into pHD-DsRed cut with EcoRI and SpeI using Gibson Assembly (NEB). The attB-SAS fragment was amplified from attB-SAS-GFP and the Gal4 fragment was amplified from pBPGUw. The digestion removed 3xP3-DsRed.
We generated an attP landing site with an inactivated EYFP gene using CRISPR-Cas9 mutagenesis. We co-injected embryos of D. simulans strains carrying an attP landing site marked with 3XP3::EYFP with p{CFD4-EYFP-3xP3::DsRed}36 and Cas9 mRNA and sib-mated surviving adults. We screened for progeny with reduced or no EYFP expression in the eyes. Flies with EYFP- were bred to homozygosity and the 3XP3::EYFP transgene in each strain was re-sequenced to confirm the presence of the mutation and to confirm that the mutation did not disrupt the attP landing site. To generated flies expressing GCaMP6s under UAS control, we co-injected p{GP-JFRC7-20XUAS-IVS-GCaMP3 K78H T302L R303P D380Y T381R S383T R392G.15.641}44 and pBS130 (containing phiC-31 integrase under control of a heat-shock promoter) into the attP, EYFP- strain and screened for w+ integrants. We generated one D. simulans UAS-CsChrimson transgenetic line by co-injecting p{20XUAS-IVS-CsChrimson.tdTomato}45 and pBS130 into the attP, EYFP- strain and screening for w+ integrants. We generated a second D. simulans UAS-CsChrimson transgenetic line by co-injecting a piggyBac vector pBac(20xUAS-CsChrimson.mVenus, 3xp3::dsRed)2 and a piggyback transposase helper plasmid into wild type flies and screened for dsRed expression in the eye.
To generate flies expressing GCaMP6s under UAS control, we co-injected p{GP-JFRC7-20XUAS-IVS-GCaMP3 K78H T302L R303P D380Y T381R S383T R392G.15.641}62 and pBS130 (containing phiC-31 integrase under control of a heat-shock promoter) into a D. simulans attP, EYFP- strain 217855 and screened for w+ integrants. We generated one D. simulans UAS-CsChrimson transgenetic line by co-injecting p{20XUAS-IVS-CsChrimson.tdTomato}63 and pBS130 into attP, EYFP- strain 2178 and screening for w+ integrants. We generated a second D. simulans UAS-CsChrimson transgenetic line by co-injecting a piggyBac vector pBac(20xUAS-CsChrimson-mVenus, 3xp3::dsRed) and a piggyBac transposase helper plasmid into the Lethal Hybrid Rescue strain of D. simulans (Brideau NJ, et al. (2006) and then screening for dsRed expression in the eyes. The CsChrimson-mVenus piggyBac insertion was mapped with TagMap (SternDL (2016) Tagmentation-Based Mapping (TagMap) of Mobile DNA Genomic Insertion Sites. bioRxiv:1-7.) to base pair 23,569,712 on chromosome 3R.
The D. simulans ppk23-Gal4 plasmids were cloned by amplifying the homologous 2.695 kb fragment upstream of the D. simulans ppk23 promoter, analogous to previously published methods11, and TOPO-cloning the PCR product into the pDONR-Topo vector. Using a BP-clonase Gateway reaction, the sim-ppk23 promoter was recombined into pBPGUw (addgene #17575). PhiC31-mediated recombination was used to integrate sim-ppk23-Gal4 into D. simulans attp217636 (Fig. 3d and Extended Data Fig. 3a-d), R25E04-Gal4, 3xp3::DsRed in D. simulans attP217636 (Extended Data Fig. 6e) and pBPGuW R71G01-Gal4 in D. simulans attP217636 (Extended Data Fig. 4a).
Immunohistochemistry
To visualize D. simulans fruGFP (Fig. 2a, Extended Data Fig. 2b-g), D. melanogaster fruGal4>UAS-GCaMP (Fig. 2a, Extended Data Fig. 2b-g), D. simulans ppk23Gal4>UAS GCaMP (Extended Data Fig. 3b) and R25E04-Gal4>UAS-GCaMP (Extended Data Fig. 6e), 1-3 day old adult brains were dissected in Schneider’s Medium for 1 hr then immediately transferred to cold 1% PFA (Electron Microscopy Sciences) and fixed for 16-20 hrs at 4 oC. Samples were then washed in PAT3 Buffer (0.5% BSA/0.5% Triton/1X PBS pH 7.4) 3 times, with last two washes incubated for 1 hr on nutator at room temperature. Brains were blocked in 3% Normal Goat Serum for 90 min at room temperature. Primary antibodies in 3% Normal Goat Serum were incubated 3 hrs at room temperatures then left at 4 °C for 16-20 hrs. Primary antibodies used were 1:20 Mouse anti-Brp (nc82, Developmental Studies Hybridoma Bank), 1:1000 Sheep anti-GFP (sim fruGFP, mel fruGal4>UAS-GCaMP, ppk23-Gal4>UAS GCaMP and R25E04-Gal4, Bio-Rad #4745-1051) and 1:100 rabbit anti-GABA antibody (D. simulans fruGFP, Catalog #A2052; Sigma, St. Louis, MO). Brains were then washed in PAT3 Buffer. Samples were incubated in secondary antibody for 3 hr at room temperature then for 5-7 days at 4 °C. Secondary antibodies used were 1:500 Anti-sheep Alexa Fluor 488, Anti-rabbit Alexa Fluor 546, Anti-mouse Alexa Fluor 647 and Anti-mouse Alexa Fluor 555 (ThermoFischer Scientific). Brains were washed in PAT3 buffer three times then once in 1X PBS, nutating at room temperature for 5 min. Samples were mounted in Vectashield (Vector Laboratories) in 5/8th inch hole reinforcements placed on glass slides. Images were captured on a Zeiss LSM 880 using a 40X objective. Flies were 1-2 days old.
Two-photon functional imaging
All imaging experiments were performed on an Ultima two-photon laser scanning microscope (Bruker Nanosystems) equipped with galvanometers driving a Chameleon Ultra II Ti:Sapphire laser. Emitted fluorescence was detected with either photomultiplier-tube or GaAsP photodiode (Hamamatsu) detectors. Images for ex vivo experiments were acquired with an Olympus 60×, 1 numerical aperture objective and in vivo experiments were acquired with an Olympus 40× 0.8 numerical aperture objective (LUMPLFLN). All images were collected using PrairieView Software (Version 5.4) at 512 pixel × 512 pixel resolution with a frame rate from 0.2-0.4 Hz when imaging an ROI and 0.7-0.8 Hz when imaging the whole field of view. Saline (108 mM NaCl, 5 mM KCl, 2 mM CaCl2, 8.2 mM MgCl2, 4 mM NaHCO3, 1 mM NaH2PO4, 5 mM trehalose, 10 mM sucrose, 5 mM HEPES pH7.5, osmolarity adjusted to 275 mOsm) was used to bath the brain for all imaging experiments unless otherwise noted. Flies were 3-6 days old.
To prepare flies for in vivo imaging of Fru+ and ppk23+ sensory afferents in the ventral nerve cord (Fig. 3a-d, Extended Data Fig. 3e), the wings and all legs except one foreleg were removed from a 4-7 day old CO2-anesthetized male. The single-legged male was tethered to a piece of clear packing tape covering a hole in the bottom of the modified 35 mm petri dish using a hair placed across his cervical connectives. The body was oriented such that the ventral side faced the inside of the dish. A rectangular hole the length and width of the male fly’s body was cut from the tape and the fly was positioned such that the ventral half of the body was placed above the plane of the tape. Great care was taken to ensure that the foreleg was extended so the tibia and femur did not cover the thorax. Small dots of UV-curable glue were used to secure the eyes, part of the thorax and the tip of the abdomen to the tape. The dish was then filled with saline and the cuticle covering the first thoracic ganglion was gently removed, taking care to not damage the foreleg nerve. The preparation was positioned on the two-photon microscope and an ROI was centered on the most ventral portion of the VNC corresponding to the intact leg (Fig. 3a). To prepare stimulating females, a pin was attached to the dorsal thorax of virgin female D. melanogaster or D. simulans fly with their head, wings and legs removed so that the abdomen could make contact with the distal tarsal segments of the male fly’s foreleg. To guide stimulation, an 850 nm IR light was used to illuminate the chamber and the fly was imaged from the side using a Point Grey Firefly camera mounted with a 1x-at-94 mm Infinistix lens fitted with a shortpass IR filter (850 nm OD 4, Edmund Optics) to block 925 nm two-photon laser illumination, which was viewed using FlyCapture2 Software (2.12.3.2). After recording a 10 s baseline, the experimenter gently tapped the female abdomen onto the tarsi of the experimental fly once every 10 s for 6-8 bouts. Three replicates per preparation (total 18-24 tapping bouts) were conducted with D. simulans and D. melanogaster stimuli interweaved.
Images and quantification of ppk23+ soma in the male’s foreleg were completed using a Zeiss Axioplan 2 scope under Nomarski optics and widefield fluorescence at 40x or 63x. Images were acquired through a Zeiss AxioCam and the Axiovision software (Extended Data Fig. 3a). Somata were counted only in the first three tarsal segments of the foreleg.
We modified published methods from the Scott lab11,21 for in vivo imaging of ppk23+ soma in the foreleg (Extended Data Fig. 3f). Male ppk23-Gal4>UAS-GCaMP flies were isolated as virgins and aged 3-6 days, CO2-anesthetized, decapitated, and immobilized by folding a piece of parafilm over the body such that the first five tarsal segments extended out of the parafilm. The immobilized animal was placed on a glass coverslip for imaging using a monochromatic camera (Point Grey Research, Flir Chameleon 3). Pheromone was presented as follows: 1 μL of 7,11-Heptacosadiene or ethanol was pipetted onto a paper wick (Hampton Research) that had been trimmed such that one constituent fiber was exposed at the tip. Using a micromanupulator, the wick was brought into contact with one chemosensory sensillum on the 3rd tarsal segment of the foreleg. GCaMP responses were visualized using a 50x air objective using 488 nm LED illumination on a bright field microscope (Scientifica). DeltaF/F values were calculated using ImageJ as the maximum signal in the 30 s following pheromone presentation in accord with published methods11,21. Without more precise genetic tools in D. simulans, we defined soma A as the soma that responded more strongly to 7,11-HD presentation, in accord with previous work11. To demonstrate that the response of soma A was specific to the pheromone, we also presented the ethanol vehicle in which ethanol alone was adsorbed to a wick. The range of our maximum DeltaF/F values for 7,11-HD stimulation are consistent with previously published results in D. melanogaster11,21,46.
To prepare flies for in vivo imaging of the LPC, P1 neurons and mAL neurons in the central brain using both fruGal4 and R25E04-Gal4 neural drivers (Fig. 4d-h, Fig. 5d, Extended Data Fig. 4g-j, and Extended Data Fig. 6g-h), CO2-anesthetized 4-7 day old males were affixed to a customized, milled tethering plate47 using UV-curable glue around their head and thorax. Glue was cured in short bursts to minimize exothermic damage to the preparation and flies whose legs touched the glue were discarded. The proboscis was glued to the head, carefully avoiding the antennae, to minimize movement of the brain during imaging. Flies were given an hour to recover and were only used if they displayed vigorous activity post-tether. A small hole in the head was opened under external saline using sharp forceps. Muscle 16, obstructing trachea, and fat were removed. The imaging plate had magnets inside to allow facile positioning under the 40x objective in the two-photon microscope. Using a micromanipulator, a styrofoam ball48 floating on an air stream was positioned under the fly so that he had a surface to stand and walk on. Only animals that exhibited robust walking or grooming behavior following dissection were used for further experimentation. A D. melanogaster or D. simulans virgin female tethered to a pin (see above for tethering detail) was positioned in front of the tethered male using a micromanipulator. To stimulate tapping events, the female was moved in front of the male fly who freely tapped on her abdomen with his foreleg tarsi. The male fly was imaged from the side (see above methods) to facilitate positioning the ball and the stimulus during the experiment. After 4 to 5 s of baseline recording, the stimulus fly was presented to the tethered male for 2-5 s allowing multiple taps before being withdrawn. This was repeated 9 times for each fly stimulus with D. melanogaster and D. simulans stimuli interweaved. An ROI was centered on the LPC or on the fasciculated projections from P1 neuron cell bodies to the LPC. We vetted our ability to reproducibly identify P1’s characteristic processes by first imaging them using R71G01-Gal4>UAS-GCaMP in D. melanogaster males (Extended Data Fig. 4g), which showed robust and specific responses in all parts of the P1 neurons to the taste of a D. melanogaster female. When imaging the fasciculated projections of P1 neurons, our field of view contained both the LPC and the P1 projections so we were capable of aligning responses in the LPC with P1 neurons when the male tapped a female (Fig. 4g, h). We attempted to use the R71G01-Gal4 driver for functional imaging of the P1 neurons in D. simulans, but we observed no response to the taste of either a D. melanogaster or D. simulans female. While this is consistent with the lack of pheromone responses we observed when imaging all Fru+ neurons in the LPC or Fru+ P1 neurons, we could not rule out that the last of responses was due to weak expression of GCaMP. Notably, we observed pheromone responses using similarly weak driver lines like R25E04-Gal4 in both D. melanogaster and D. simulans.
For experiments with picrotoxin (Extended Data Fig. 6h), in vivo responses were recorded in the LPC before and after iontophoresis of picrotoxin unilaterally into the LPC (1 mM in water, 3-5 pulses, 100 ms at 20 V). Local injection of picrotoxin had no noticeable effect on the male fly’s behavior or baseline fluorescence of the LPC, in contrast to bath application of picrotoxin (10 μM and 100 μM), which caused seizures in the fly and a dramatic, fluctuating increase in baseline fluorescence of the LPC (data not shown). Iontophoresis of saline had no effect on pheromone-evoked responses in either species (data not shown). Picrotoxin iontophoresis was based on previously published methods49,50. We did not attempt picrotoxin iontophoresis with D. simulans 71G01-Gal4 because we could not confidently identify the LPC due to weak expression of GCaMP.
To prepare flies for in vivo imaging of vAB3 (Fig. 5c, Extended Data Fig. 6a-d), 2-5 day old male flies were briefly anesthetized using CO2 (for <30 s) and then tethered used a previously described preparation57 in which the male was affixed to a piece of tape covering a hole in the bottom of a modified 35 mm petri dish using human hair placed across the cervical connectives. A small strip of tape was placed over they fly’s proboscis and two pieces of putty were placed next to the fly’s thorax to prevent the legs from getting stuck onto the tape. A small hole above the head was precisely cut into the tape and the head was secured using two small dots of UV-curable glue that bridged the eyes and the tape. The dish was filled with external saline and the head capsule was opened by carefully tearing off the flap of cuticle covering the dorsal portion of the head and removing any obstructing trachea and fat. The dish was placed under the microscope and vAB3’s axonal tract projecting from the SEZ to the LPC was identified. We vetted our ability to reproducibly identify vAB3’s characteristic morphology by first imaging the vAB3 axonal tract using AbdB-Gal4>UAS-GCaMP in D. melanogaster males (Extended Data Fig. 6a, b). Baseline fluorescence was recorded for 4 s before a female abdomen was presented to the male for him to tap (see above for methods). Trials were repeated three times for each female region and then ΔF/F responses were averaged.
Ex vivo stimulation of vAB3 (Fig. 5e, f, Extended Data Fig. 7) was preformed as previously described25,51. A Grass stimulator was used to iontophorese acetylcholine (10 V, 200 ms) through a fine glass electrode positioned on the axons of the ppk23+ sensory neurons in the ventral nerve cord (Fig. 5e, f, Extended Data Fig. 7). The stimulating electrode was filled with 10 mM acetylcholine, 10 mM glutamate or external saline and Texas-Red Dextran BSA to facilitate positioning the electrode in the Fru+ neuropil. The local nature of the stimulation combined with the anatomically segregated sensory innervation of the ppk23+ sensory neurons in the ventral nerve cord facilitated restricted and reproducible stimulation. To functionally visualize responsive neurons in the brain, we imaged a Z-plane every 5 μm and combined these to build a volume of the anterior ~100 μm of the brain. For quantitative comparisons of specific neural populations across individuals (Fig 5f, Extended Data Fig. 7), single Z-planes were recorded using a 40x objective at 2x zoom with an ROI of 300 × 300 pixels. Given that P1 soma and fasciculated processes reside on the posterior side of the brain, when imaging P1 and vAB3 neurons in response to vAB3 stimulation, we rotated the brain 180o around the cervical connectives.
For two-photon severing of mAL (Fig. 5f, Extended Data Fig. 7), the brain was pinned ventral side up and we focused 925 nm light on a small ROI encompassing only the mAL axon tract at 8X optical zoom. The mAL axon tract could be readily identified by its characteristic morphology. For two-photon severing of vAB3 or a mock Fru+ neuron (Extended Data Fig. 7c), the VNC and brain were pinned ventral side up. We validated that vAB3 axons could be reproducibly identified within the ventral nerve cord by performing initial experiments in AbdB-Gal4>UAS-Tomato/Fru-LexA>LexAOP-GCaMP D. melanogaster males in which vAB3 neurons are anatomically marked. We found that vAB3 axons were always robustly activated by acetylcholine iontophoresis and have a characteristic position within the ventral cord that allowed for their identification even in the absence of an anatomic marker. We focused 925 nm light on a small ROI encompassing either the vAB3 axon tract or the tract of a Fru+ neuron more lateral than vAB3. We then switched the laser wavelength to 850 nm and imaged using short (<1s) pulses until a cavitation bubble was observed. After switching back to 925 nm and zooming out, if the axon tract was successfully severed, we observed a striking increase in baseline fluorescence due to Ca2+ rushing into the neurons and activating GCaMP. Since vAB3 neurons project bilaterally, we also severed the corresponding axon tract on the opposite side of the brain. To image P1 neurons after severing mAL, we re-pinned the brain such that the dorsal side of the brain and the ventral side of the VNC were facing up, inserted the stimulating electrode in the VNC and recorded activity in P1 neurons and vAB3 neurons. vAB3 activation was not affected by mAL severing (data not shown).
Dye-filling of neural tracts using Texas-Red Dextran (100 mg/mL, Invitrogen) was performed as previously described51. For dye-filling we targeted the fasciculated bundle of P1 neurons projecting from the somata (Fig. 4a, h, Extended Data Fig. 5a), the segregated vAB3 terminals in the VNC (Fig. 5b, Extended Data Fig. 5b) and the characteristic mAL axonal bundle projecting between the SEZ and LPC (Fig. 5b, Extended Data Fig. 5c). To photolabel neurons, we located the neural structure of interest using 925 nm laser illumination, a wavelength that does not cause significant photoconversion, defined an ROI in PrairieView Software in a single Z-plane, and exposed the target area to 710 nm light (~10-30 mW at the back aperture of the objective) 100-300 times. After diffusion of the photoconverted fluorophores throughout the targeted neurons for 30-60 min, we imaged at 925 nm. All anatomical images are maximum projections of z-stacks with 1μm steps. Autofluorescence from the glial sheath and basal fluorescence from non-dye-filled structures were masked for clarity.
Unless stated, anatomical images were acquired on the 2P microscope using standard techniques.
Imaging Analysis
To analyze functional responses, we calculated ΔF/F for each frame of calcium imaging time courses using the second to sixth frames as the baseline and used the maximum ΔF/F value within the time during which the stimulus was presented. To represent responses graphically, we show heatmaps (ΔF): the maximum projection of two frames of baseline subtracted from the maximum projection of the two frames with peak fluorescence in response to a stimulus (FIJI). The arbitrary units (A.U.) correspond to 1/100th of the “minimum displayed value” and “maximum displayed value” when we set the display range in FIJI.
Statistics and Reproducibility
For courtship indices, each data point represents a biological replicate of an individual male’s courtship behavior. For in vivo functional assays (Fig. 3b-d, 4e, 4f, 5c, 5d and 5f. Extended Data Fig. 3f, 6b, 6c, and 6h, 7c and 7e), each pair of dots represents the average response to a D. melanogaster female (mel, green) or D. simulans female (sim, blue) for a given individual or in an individual D. melanogaster male (mel, green) or D. simulans male (sim, blue). Individual taps or stimulations were plotted in (Fig. 4g, 4h, Extended Data Fig. 3e, 4h-j, 6d, 6g, 7d, 7f and 7g). Each representative example was replicated more than 5 times in independent experiments (Fig. 2a, 3a-c, 4a, 4e-h, 5b, 5e, Extended Data Fig. 2b-g, 3a-d, 4a, 4g, 5, 6a, 6e, 7a-c, and Supplemental Videos 1-5). Sample sizes were based on pilot experiments. For all behavior experiments, n > 15 and for all in vivo imaging experiments n > 5. We used the PRISM software package to graph and statistically analyze data. Prior to statistical analysis, we tested if the values were normally distributed using D’Agostion-Pearson ombibus and Shapiro-Wilk normality tests. When data were normally distributed, we used parametric tests. When data was not normally distributed, we used non-parametric tests. We adjusted P-values accordingly when multiple comparisons were conducted. See Supplemental Table 1 for more details on statistical tests and P-values.
Extended Data
Extended Data Figure 1: Pheromone regulation of D. simulans courtship.
Mutant males and males lacking foreleg tarsi still court, but display altered courtship preferences. a, Courtship indices of males with foreleg tarsi intact (+) or surgically removed (−). Data is replotted from Fig. 1b. b, c, Courtship indices of D. melanogaster (b) and D. simulans (c) males with either foreleg tarsi or rear leg tarsi ablated towards D. melanogaster or D. simulans females. d, Schematic of CRISPR/Cas9-induced mutations (top) in Gr32a (left) and ppk23 (right) gene loci. Cas9 was targeted by gRNA to the first exon (cut site) of Gr32a or ppk23. Cleaved DNA was repaired by non-homologous end-joining resulting in a 36 bp insertion/2 bp deletion in the Gr32a coding sequence and 90 bp insertion into the ppk23 coding sequence. Both indels resulted in in-frame stop codons (bottom, * highlighted red in resulting amino acid sequence). Forward (F) and reverse (R) genotyping primers are marked with a line. e, Courtship indices towards females of different Drosophila species by wild-type (+/+), Gr32a−/− and ppk23−/− D. simulans males. f, Courtship indices of D. simulans males towards D. melanogaster and D. simulans females in preference assays. Data is replotted from Fig. 1d. g, Courtship indices of D. simulans males towards D. simulans female perfumed with 7,11-HD (7, green) or ethanol (E, EtOH, blue). Data is replotted from Fig. 1e. e, Kruskal-Wallis test, different letters mark significant differences. Black bars and dots: mean and s.d. Lines connect courtship indices of the same male towards the different female targets in a preference assay. Since the male can only court one female at a time, the paired points are inherently interdependent on each other, thus inappropriate for statistical analysis. See Supplemental Table 1 for details of statistical analyses.
Extended Data Figure 2: Anatomic and functional conservation of Fru+ neurons.
a, Schematic of chromosomal location of fruattP and fru−/− integration sites in D. simulans and previously generated fruGal4 and fruLexA transgenes in D. melanogaster (left). Schematic of attP oligo integrated into the fru intron to generate fruattP allele and subsequent integration of attB plasmids (right). ExF and ExR are primers located in the genome and InR is a primer located inside the transgene. b-g, Maximum intensity confocal (b-d) and two-photon stacks (e-g) of anatomically defined regions of Fru+ neuropil in D. melanogaster fruGal4>UAS-GCaMP6s and D. simulans fruGFP males: lateral protocerebral complex (b, c), suboesophageal zone (d), antennal lobe (e), lateral horn and DC1 neural tract and soma (f) and mushroom body γ-lobes (g). h, Generation of D. simulans fru−/− by integrating an oligo that deleted codons 1 and 2 of the first exon, introducing a frameshift mutation. i, Male-male chaining indices of wild-type (+/+) and fru−/− males. Paired t-test,Bars: mean and s.d. Scale bar: 10 μm. See Supplemental Table 1 for details of statistical analyses.
Extended Data Figure 3: Conserved anatomy and functional tuning of ppk23+/Fruitless+ foreleg sensory neurons.
a-c, ppk23 promoter expression in D. melanogaster and D. simulans males in forelegs (a), ventral nerve cord (b, VNC) and brain (c). Green: GFP. Grey: DIC. Magenta: neuropil counterstain. a, Number of ppk23+ sensory neuron soma in the first three tarsal segments of the foreleg (middle right). d, ppk23 neuron innervation in the first thoracic ganglion of the VNC of D. simulans females. ppk23+ sensory neurons display a characteristic sexually dimorphic expression pattern in the ventral nerve cord where they do not cross the midline in females, but do in males. e, Schematic of VNC imaging preparation (left). Functional responses evoked by individual taps of a female abdomen in Fru+ neurons (middle) and ppk23+ neurons (right) in the VNC of wild-type (WT) and ppk23−/− D. melanogaster and D. simulans males. Data replotted from Fig. 3b-d. f, Schematic of paired ppk23+ somatic imaging preparation (left) and functional responses of the paired neurons (cell A and B, see methods) within a sensory bristle stimulated with 7,11-HD or ethanol (middle). Comparison of 7,11-HD responses in ppk23+ soma across species (right). a, unpaired t-test, e, Kruskal-Wallis test, different letters mark significant differences, and f, paired and unpaired t-tests. Scale bars represent 10 μm. See Supplemental Table 1 for details of statistical analyses.
Extended Data Figure 4: Behavioral and functional analysis of P1 neurons.
a-f, Anatomy (a) and optogenetic behavioral manipulations (b-f) of P1 neurons using 71G01-Gal4 to drive the expression of CsChrimson. b, Courtship indices (top, right) towards a rotating magnet by D. melanogaster males pre-, during, and post-P1 neuron stimulation. Fraction of male flies courting (bottom, grey boxes: bright light illumination, see methods). c, Courtship indices towards a magnet moving at different speeds during optogenetic P1 neuron stimulation in D. simulans males. d-f, Comparison of courtship indices towards magnet (d), D. simulans female (e), or D. melanogaster female (f) by D. simulans males of denoted genotypes, fed, or not fed retinal. g, In vivo preparation used to measure pheromone responses in the P1 neurons (top left) and overlay of the Fru+ (green) neurons and fasciculated P1 neuron processes (magenta). White box indicates approximate ROI imaged to measure P1 responses. h-j, Functional responses evoked by individual taps of a female abdomen in P1 neurons (h) and Fru+ neurons in the LPC (i, j) of wild-type (WT) and ppk23−/− D .melanogaster and D. simulans males (data replotted from Fig. 4 e, f). b, d-f, h-j, Kruskal-Wallis test and c, One-way ANOVA). Black bars: mean and s.d. See Supplemental Table 1 for details of statistical analyses.
Extended Data Figure 5: Anatomy of P1, vAB3 and mAL neurons in D. simulans and D. melanogaster males.
a-c, Detailed anatomic images of P1 neurons (a), vAB3 neurons (b) and mAL neurons (c). Cartoon of neural anatomy (left), Texas-Red dextran dye-fill (red) in D. simulans fruGFP (green) males (middle-left), magnified view of labeled neurons in the lateral protocerebral complex (LPC) showing dye-filled neurons (red) and Fru+ neurons (green) or just dye-filled neurons (black, middle-right) and photo-activated neurons in D. melanogaster LPC (black, right). d, Antibody staining of D. simulans Fru+ neurons (anti-GFP, green) with anti-GABA (red) in the SEZ and LPC demonstrating that mAL neurons are GABAergic and thus inhibitory. Scale bars: 10 μm.
Extended Data Figure 6: Pheromone responses in central neurons of D. melanogaster and D. simulans males.
a, Schematic of in vivo preparation used to measure pheromone responses in vAB3 processes in the brain (top). Representative fluorescence increase of vAB3 responses in D. melanogaster male evoked by tapping a D. melanogaster female (bottom left). GCaMP was expressed in vAB3 neurons using the AbdB-Gal4 driver. Anatomy of fasciculated vAB3 processes co-labeled by fruGal4 (green) and AbdB-Gal4 (magenta) in the same in vivo preparation used for imaging (right). White box indicates approximate ROI analyzed for functional imaging. b-d, Functional responses evoked by the taste of female pheromones in the vAB3 processes of wild-type (WT) and ppk23−/− males. b, Functional responses evoked by individual taps in vAB3 neurons in D. melanogaster labeled using AbdB-Gal4. c, Average responses of vAB3 neurons in ppk23−/− D. melanogaster and D. simulans males in response to the taste of D. melanogaster (m) and D. simulans (s) females. GCaMP was expressed in vAB3 neurons using fruGal4. d, Functional responses evoked by individual taps in vAB3 neurons in wild type and ppk23−/− mutant males. Data replotted from Fig. 5c and Extended Data Fig. 6c. e, Expression of 25E04-Gal4 > UAS-GCaMP (green) with neuropil counterstain (magenta) in the brains of D. melanogaster (left) and D. simulans (right) males. f, Courtship indices towards conspecific females during optogenetic activation of mAL neurons in D. simulans males with parental controls. g, Functional responses evoked by individual taps in mAL neurons. Data replotted from Fig. 5d. h, Average ΔF/F responses in Fru+ neurons of the LPC evoked by the taste of a female before and after local injection of picrotoxin, a GABA receptor antagonist, into the LPC. In males of both species, application of picrotoxin increased responses only to D. melanogaster female stimuli. Lines connect average functional responses in the same male towards the different female targets. b, d, f, g, Kruskal-Wallis test, different letters mark significant differences, and c, h, paired t-test. Black bars: mean and s.d. See Supplemental Table 1 for details of statistical analyses.
Extended Data Figure 7: Functional responses of Fru+ neurons to direct vAB3 stimulation in D. melanogaster and D. simulans males.
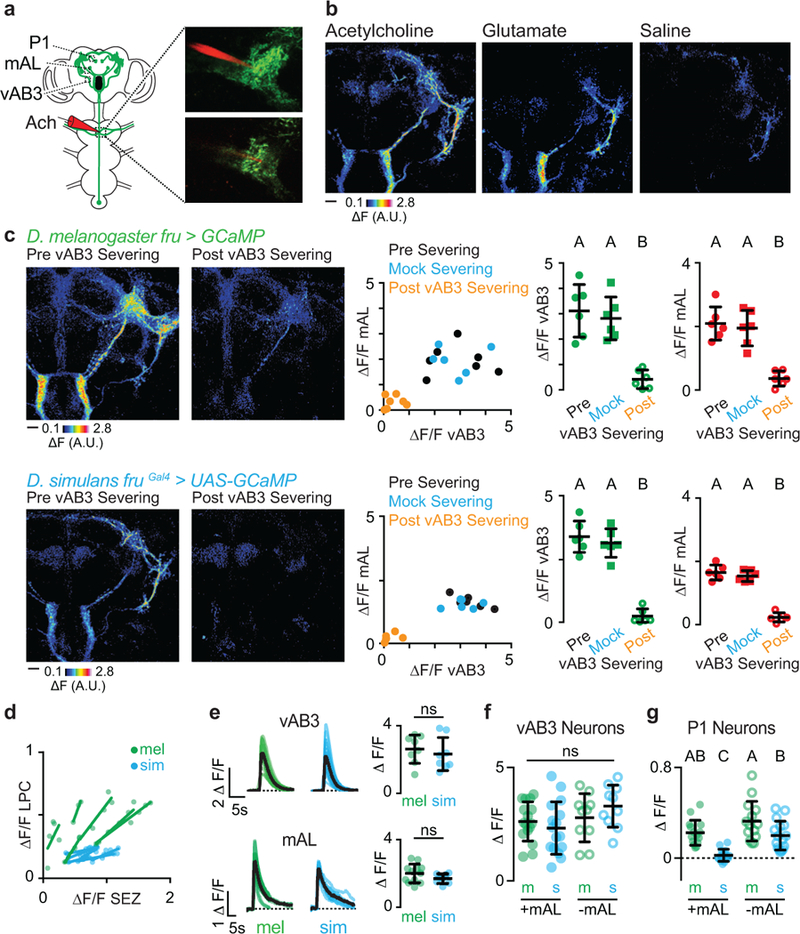
a, Schematic and representative image depicting direct stimulation of vAB3 neurons by iontophoresis of neurotransmitter onto their dendrites within the ventral nerve cord (VNC). Maximum intensity Z-projection (top) and single Z-plane (bottom) showing electrode placement in VNC. Electrode is filled with neurotransmitter and Texas-red dye (red) to allow precise targeting in the Fru+ neuropil (green). b, Representative multi-plane fluorescence increase of Fru+ brain neurons in D. simulans males when the VNC is stimulated with acetylcholine (left), glutamate (middle) and saline (right) iontophoresis. c, To test the necessity of vAB3 in propagating signals from the VNC to higher brain, we compared response profiles in the brain before severing vAB3 (black), after severing a nearby Fru+ axon (mock control, blue) and then after severing vAB3 axons (orange) in D. melanogaster males (top) and D. simulans males (bottom). Representative multi-plane fluorescence increase of Fru+ neurons (left) shows the loss of evoked functional responses in the brain after severing vAB3. Graph (middle) depicts relationship between average ΔF/F responses in vAB3 and mAL. Average ΔF/F responses of vAB3 (green) and mAL (red) neurons evoked by vAB3 stimulation, before and after severing vAB3. Responses were lost in both neural populations in both species after vAB3 was severed but not in the mock control. d, Relationship of functional responses in the SEZ and LPC of D. melanogaster and D. simulans males evoked by direct vAB3 stimulation. Dots on graph represent different stimulation intensities and lines connect responses of individual D. melanogaster (green) and D. simulans (blue) males. e, Response of vAB3 (top) and mAL (bottom) axon tracts in response to vAB3 stimulation in D. melanogaster (green) and D. simulans (blue) males. Coloured lines represent single stimulations and black lines represent average. Peak ΔF/F plotted (right) with coloured dots representing average response per animal and black bars representing mean and s.d. f, g, Comparison of vAB3-evoked responses in D. melanogaster and D. simulans males in vAB3 neurons (f) and P1 neurons (g) before (+) and after (−) mAL severing. c, f, g, Kruskal-Wallis test, different letters mark significant differences and e, unpaired t-test. Scale bars: 10 μm. See Supplemental Table 1 for details of statistical analyses.
Supplementary Material
Acknowledgements
We thank Y. Ding (Janelia/HHMI) for D. simulans CsChrimson flies, P. Pires-Mussells and J. Marquina-Solis for experimental assistance, E. Clowney, B. Matthews, K. Kistler, J. Petrillo, and G. Maimon for technical advice, E. Clowney, S. Datta, B. Noro, L. Vosshall, S. Shaham, C. McBride, and members of the Ruta lab for discussion and comments on the manuscript. This work was supported by the New York Stem Cell Foundation, the Pew Foundation; the McKnight Foundation; the Irma T. Hirschl Foundation; the Alfred P. Sloan Foundation, and the NIH (DP2 NS0879422013) to V.R. and an NSF and Kavli Fellowship to L.F.S.
Footnotes
Reviewer Information Nature thanks the anonymous reviewers for their contribution to the peer review of this work.
Data Availability datasets generated during the current study are available from V.R. on reasonable request.
Supplementary Information is linked to the online version of the paper at www.nature.com/nature.
References
- 1.Lim MM et al. Enhanced partner preference in a promiscuous species by manipulating the expression of a single gene. Nature 429, 754–757 (2004). [DOI] [PubMed] [Google Scholar]
- 2.McGrath PT et al. Parallel evolution of domesticated Caenorhabditis species targets pheromone receptor genes. Nature 477, 321–325 (2011). [DOI] [PMC free article] [PubMed] [Google Scholar]
- 3.Weber JN, Peterson BK & Hoekstra HE Discrete genetic modules are responsible for complex burrow evolution in Peromyscus mice. Nature 493, 402–405 (2013). [DOI] [PubMed] [Google Scholar]
- 4.Ding Y, Berrocal A, Morita T, Longden KD & Stern DL Natural courtship song variation caused by an intronic retroelement in an ion channel gene. Nature 536, 329–332 (2016). [DOI] [PubMed] [Google Scholar]
- 5.Hey J & Kilman RM Population genetics and phylogenetics of DNA sequence variation at multiple loci within the Drosophila melanogaster species complex. Mol. Biol. Evol. 10, 804–822 (1993). [DOI] [PubMed] [Google Scholar]
- 6.Jallon J-M & David JR Variation in cuticular hydrocarbons among the eight species of the Drosophila melanogaster subgroup. Evolution (N. Y). 41, 294–302 (1987). [DOI] [PubMed] [Google Scholar]
- 7.Shirangi TR, Dufour HD, Williams TM & Carroll SB Rapid evolution of sex pheromone-producing enzyme expression in Drosophila. PLoS Biol. 7, 1–14 (2009). [DOI] [PMC free article] [PubMed] [Google Scholar]
- 8.Billeter J-C, Atallah J, Krupp JJ, Millar JG & Levine JD Specialized cells tag sexual and species identity in Drosophila melanogaster. Nature 461, 987–991 (2009). [DOI] [PubMed] [Google Scholar]
- 9.Bastock M & Manning A The courtship of Drosophila melanogaster. Behaviour 8, 85–111 (1955). [Google Scholar]
- 10.Lu B, LaMora A, Sun Y, Welsh MJ & Ben-Shahar Y Ppk23-dependent chemosensory functions contribute to courtship behavior in Drosophila melanogaster. PLoS Genet. 8, 1–13 (2012). [DOI] [PMC free article] [PubMed] [Google Scholar]
- 11.Thistle R, Cameron P, Ghorayshi A, Dennison L & Scott K Contact chemoreceptors mediate male-male repulsion and male-female attraction during Drosophila courtship. Cell 149, 1140–1151 (2012). [DOI] [PMC free article] [PubMed] [Google Scholar]
- 12.Toda H, Zhao X & Dickson BJ The Drosophila female aphrodisiac pheromone activates ppk23+ sensory neurons to elicit male courtship behavior. Cell Rep. 1, 599–607 (2012). [DOI] [PubMed] [Google Scholar]
- 13.Miyamoto T & Amrein H Suppression of male courtship by a Drosophila pheromone receptor. Nat. Neurosci. 11, 874–876 (2008). [DOI] [PMC free article] [PubMed] [Google Scholar]
- 14.Fan P et al. Genetic and neural mechanisms that inhibit Drosophila from mating with other species. Cell 154, 89–102 (2013). [DOI] [PMC free article] [PubMed] [Google Scholar]
- 15.Coyne JA, Crittenden AP, Mah K & Maht K Genetics of a pheromonal difference contributing to reproductive isolation in Drosophila. Science (80-. ). 265, 1461–1464 (1994). [DOI] [PubMed] [Google Scholar]
- 16.Stockinger P, Kvitsiani D, Rotkopf S, Tirián L & Dickson BJ Neural circuitry that governs Drosophila male courtship behavior. Cell 121, 795–807 (2005). [DOI] [PubMed] [Google Scholar]
- 17.Manoli DS et al. Male-specific fruitless specifies the neural substrates of Drosophila courtship behaviour. Nature 436, 395–400 (2005). [DOI] [PubMed] [Google Scholar]
- 18.Demir E & Dickson BJ fruitless splicing specifies male courtship behavior in Drosophila. Cell 121, 785–794 (2005). [DOI] [PubMed] [Google Scholar]
- 19.Cande J, Stern DL, Morita T, Prud’homme B & Gompel N Looking under the lamp post: neither fruitless nor doublesex has evolved to generate divergent male courtship in Drosophila. Cell Rep. 8, 363–370 (2014). [DOI] [PMC free article] [PubMed] [Google Scholar]
- 20.Tanaka R, Higuchi T, Kohatsu S, Sato K & Yamamoto D Optogenetic activation of the fruitless -labeled circuitry in Drosophila subobscura males induces mating motor acts. J. Neurosci. 37, 11662–11674 (2017). [DOI] [PMC free article] [PubMed] [Google Scholar]
- 21.Kallman BR, Kim H & Scott K Excitation and inhibition onto central courtship neurons biases Drosophila mate choice. Elife 4, 1–18 (2015). [DOI] [PMC free article] [PubMed] [Google Scholar]
- 22.von Philipsborn AC et al. Neuronal control of Drosophila courtship song. Neuron 69, 509–522 (2011). [DOI] [PubMed] [Google Scholar]
- 23.Pan Y, Meissner GW & Baker BS Joint control of Drosophila male courtship behavior by motion cues and activation of male-specific P1 neurons. Proc. Natl. Acad. Sci. 109, 10065–10070 (2012). [DOI] [PMC free article] [PubMed] [Google Scholar]
- 24.Inagaki HK et al. Optogenetic control of Drosophila using a red-shifted channelrhodopsin reveals experience-dependent influences on courtship. Nat. Methods 11, 325–32 (2014). [DOI] [PMC free article] [PubMed] [Google Scholar]
- 25.Clowney EJ, Iguchi S, Bussell JJ, Scheer E & Ruta V Multimodal chemosensory circuits controlling male courtship in Drosophila. Neuron 87, 1036–1049 (2015). [DOI] [PMC free article] [PubMed] [Google Scholar]
- 26.Kohatsu S & Yamamoto D Visually induced initiation of Drosophila innate courtship-like following pursuit is mediated by central excitatory state. Nat. Commun. 6, 6457 (2015). [DOI] [PubMed] [Google Scholar]
- 27.Yu JY, Kanai MI, Demir E, Jefferis GSXE & Dickson BJ Cellular organization of the neural circuit that drives Drosophila courtship behavior. Curr. Biol. 20, 1602–1614 (2010). [DOI] [PubMed] [Google Scholar]
- 28.Ding Y et al. Neural Changes Underlying Rapid Fly Song Evolution. bioRxiv (2017). [Google Scholar]
- 29.Kohatsu S, Koganezawa M & Yamamoto D Female contact activates male-specific interneurons that trigger stereotypic courtship behavior in Drosophila. Neuron 69, 498–508 (2011). [DOI] [PubMed] [Google Scholar]
- 30.Tierney AJ Evolutionary implications of neural circuit structure and function. Behav. Processes 35, 173–182 (1995). [DOI] [PubMed] [Google Scholar]
- 31.Cande J, Prud’homme B & Gompel N Smells like evolution: The role of chemoreceptor evolution in behavioral change. Curr. Opin. Neurobiol. 23, 152–158 (2013). [DOI] [PubMed] [Google Scholar]
- 32.Bendesky A & Bargmann CI Genetic contributions to behavioural diversity at the gene-environment interface. Nat. Rev. Genet. 12, 809–820 (2011). [DOI] [PubMed] [Google Scholar]
- 33.Stern DL The genetic causes of convergent evolution. Nat. Rev. Genet. 14, 751–764 (2013). [DOI] [PubMed] [Google Scholar]
- 34.Zhang SX, Rogulja D & Crickmore MA Dopaminergic circuitry underlying mating drive. Neuron 91, 168–181 (2016). [DOI] [PubMed] [Google Scholar]
- 35.West-Eberhard MJ Developmental plasticity and the origin of species differences. Proc. Natl. Acad. Sci. 102, 6543–6549 (2005). [DOI] [PMC free article] [PubMed] [Google Scholar]
- 36.Stern DL et al. Genetic and Transgenic Reagents for Drosophila simulans. G3 Genes| Genomes| Genet. 7, 1339–1347 (2017). [DOI] [PMC free article] [PubMed] [Google Scholar]
- 37.Mellert DJ, Knapp J-M, Manoli DS, Meissner GW & Baker BS Midline crossing by gustatory receptor neuron axons is regulated by fruitless, doublesex and the Roundabout receptors. Development 137, 323–332 (2010). [DOI] [PMC free article] [PubMed] [Google Scholar]
- 38.Agrawal S, Safarik S & Dickinson M The relative roles of vision and chemosensation in mate recognition of Drosophila melanogaster. J. Exp. Biol. 217, 2796–805 (2014). [DOI] [PubMed] [Google Scholar]
- 39.Kistler KE, Vosshall LB & Matthews BJ Genome engineering with CRISPR-Cas9 in the mosquito aedes aegypti. Cell Rep. 11, 51–60 (2015). [DOI] [PMC free article] [PubMed] [Google Scholar]
- 40.Gratz SJ et al. Highly specific and efficient CRISPR/Cas9-catalyzed homology-directed repair in Drosophila. Genetics 196, 961–971 (2014). [DOI] [PMC free article] [PubMed] [Google Scholar]
- 41.Bassett AR, Tibbit C, Ponting CP & Liu JL Highly Efficient Targeted Mutagenesis of Drosophila with the CRISPR/Cas9 System. Cell Rep. 4, 220–228 (2013). [DOI] [PMC free article] [PubMed] [Google Scholar]
- 42.Thorpe HM, Wilson SE & Smith MCM Control of directionality in the site-specific recombination system of the streptomyces phage phiC31. Mol. Microbiol. 38, 232–241 (2000). [DOI] [PubMed] [Google Scholar]
- 43.Venken KJT & Bellen HJ Transgenesis upgrades for Drosophila melanogaster. Development 134, 3571–84 (2007). [DOI] [PubMed] [Google Scholar]
- 44.Chen T-W et al. Ultrasensitive fluorescent proteins for imaging neuronal activity. Nature 499, 295–300 (2013). [DOI] [PMC free article] [PubMed] [Google Scholar]
- 45.Klapoetke NC et al. Independent optical excitation of distinct neural populations. Nat. Methods 11, 338–46 (2014). [DOI] [PMC free article] [PubMed] [Google Scholar]
- 46.Vijayan V, Thistle R, Liu T, Starostina E & Pikielny CW Drosophila pheromone-sensing neurons expressing the ppk25 ion channel subunit stimulate male courtship and female receptivity. PLoS Genet. 10, 1–11 (2014). [DOI] [PMC free article] [PubMed] [Google Scholar]
- 47.Maimon G, Straw AD & Dickinson MH Active flight increases the gain of visual motion processing in Drosophila. Nat. Neurosci. 13, 393–399 (2010). [DOI] [PubMed] [Google Scholar]
- 48.Seelig JD et al. Two-photon calcium imaging from head-fixed Drosophila during optomotor walking behavior. Nat. Methods 7, 535–540 (2010). [DOI] [PMC free article] [PubMed] [Google Scholar]
- 49.Hill RG, Simmonds MA & Straughan DW Antagonism of GABA by picrotoxin in the feline cerebral cortex. Br. J. Pharmacol. 44, 807–809 (1972). [DOI] [PMC free article] [PubMed] [Google Scholar]
- 50.Crossman AR, Walker RJ & Woodruff GN Picrotoxin antagonism of y aminobutyric acid inhibitory responses and synaptic inhibition in the rat substantia nigra. Br. J. Pharmacol. 49, 696–698 (1973). [DOI] [PMC free article] [PubMed] [Google Scholar]
- 51.Ruta V et al. A dimorphic pheromone circuit in Drosophila from sensory input to descending output. Nature 468, 686–690 (2010). [DOI] [PubMed] [Google Scholar]
Associated Data
This section collects any data citations, data availability statements, or supplementary materials included in this article.