Acute myeloid leukemia (AML) is a heterogeneous group of diseases caused by oncogenic transformation of hematopoietic stem and progenitor cells. Mutations in the gene encoding the tyrosine kinase FLT3 leading to internal tandem duplications (ITDs) of sequence represent one of the most frequent genetic aberrations in human AML and are associated with a dismal prognosis.1 Herein, we show that genetic inactivation of the transmembrane (receptor-like) protein-tyrosine phosphatase (RPTP) PTPRJ/DEP-1 in FLT3-ITD knock-in mice (FLT3ITD/ITD mice) promotes FLT3-ITD-mediated aberrancies in hematopoiesis. FLT3ITD/ITD Ptprj−/− mice were characterized by enhanced extramedullary progenitor expansion, most notable in the spleen, increased colony forming unit-granulocyte monocyte (CFU-GM), and a more severe myeloproliferative neoplasia (MPN).
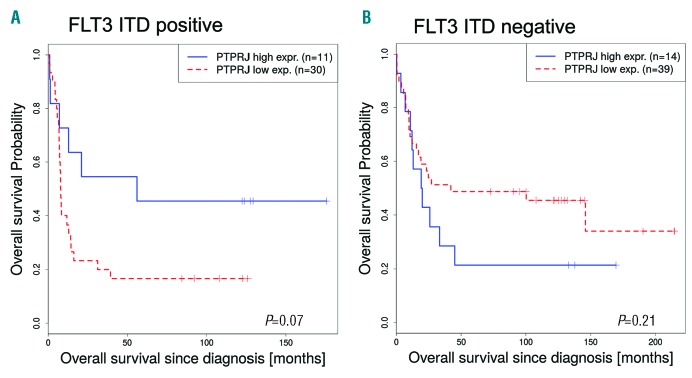
Our previous work demonstrated that PTPRJ/DEP-1 functions as a negative regulator of physiological FLT3 signaling, but was partially inactivated in cells expressing FLT3-ITD due to reversible oxidation by reactive oxygen species (ROS) formation.2,3 Expression studies in human AML are also consistent with a possible contributing role of relative PTPRJ deficiency for FLT3-ITD driven disease. In general, according to transcriptomic data available from bloodspot, PTPRJ appears to be highly expressed in AML patient samples compared to progenitor cells of healthy controls (data not shown). Of note, the expression of PTPRJ appeared to be lower in FLT3-ITD positive AML compared to patient samples without ITD mutations. One data set showed a significant downregulation in the FLT3-ITD positive AML patients compared to AML patients expressing FLT3 wild-type (WT; t-value=-2.48, P=0.01).4 In addition, the overall survival of FLT3-ITD positive patients with a low PTPRJ expression level tended to be shorter than the survival of patients with a high PTPRJ expression level (P=0.07, Figure 1A). The data from another study5 revealed a similar correlation (data not shown). In contrast, expression of PTPRJ did not correlate with overall survival in FLT3 WT AML (P=0.21) and even showed improved survival for low PTPRJ expression (Figure 1B).
Figure 1.
PTPRJ expression is inversely correlated to survival of FLT3-ITD positive AML patients. (A, B). Overall survival of patients (Valk study,4,13 GEO accession GSE1159) with low (red, dotted) and high (blue) PTPRJ expression. Survival curves of AML FLT3-ITD positive (A: cutoff = 33.3, P=0.07) and FLT3 WT patients (B: cutoff = 34.9, P=0.21) are presented. The number of patient samples (n) is indicated.
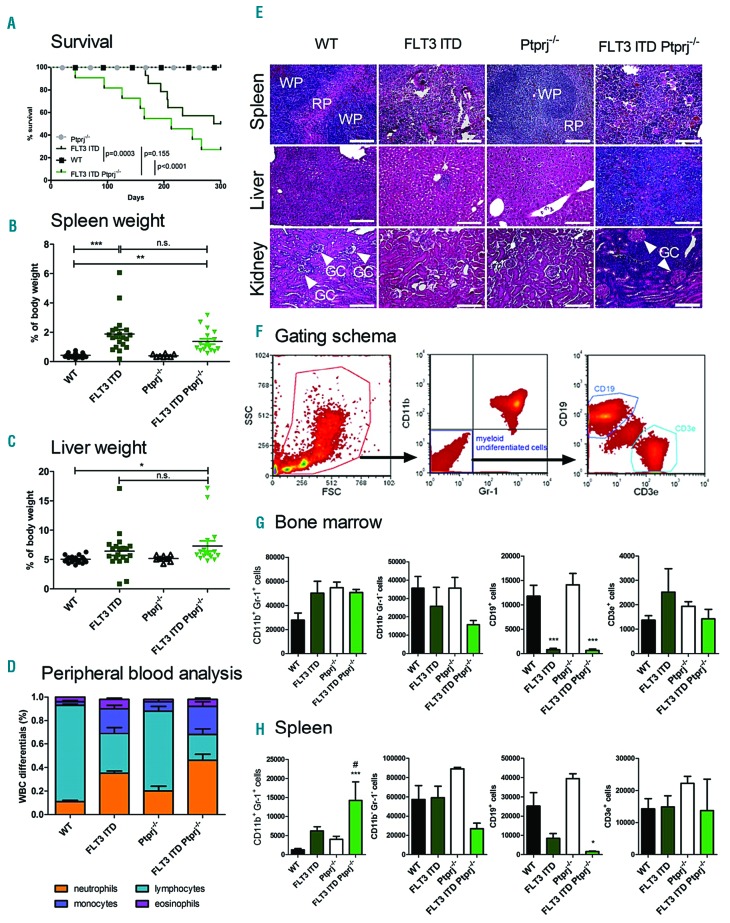
In order to directly study the role of PTPRJ in FLT3-ITD induced disease, FLT3ITD/ITD mice6 were crossed with Ptprj−/− mice.7 FLT3ITD/ITD Ptprj−/− mice showed an early onset of disease and a shortened survival (Figure 2A). The significantly reduced lifespan of FLT3-ITD mice was further shortened in response to Ptprj inactivation. The splenomegaly observed in FLT3ITD/ITD mice6 appeared less pronounced in FLT3ITD/ITD Ptprj−/− mice (Figure 2B). While the liver weight of FLT3ITD/ITD mice was not significantly elevated compared with WT mice, it was significantly increased in the FLT3ITD/ITD Ptprj−/− mice (Figure 2C). The weight development during growth and the total weight of the adult animals did not differ among the respective genotypes (data not shown).
Figure 2.
The inactivation of Ptprj results in enhanced myeloproliferation in FLT3ITD/ITD mice. (A) Kaplan-Meier survival curves of FLT3ITD/ITD Ptprj−/− and age-matched litter mates. The P values of the log rank test are indicated. The spleen (B) and liver (C) weight (normalized to total body weight) of 30 to 35-week-old WT, FLT3ITD/ITD, Ptprj−/− and FLT3ITD/ITD Ptprj−/− mice. *P<0.05, **P<0.01, ***P<0.001 compared to WT mice. (D) White blood cell count (WBC) differentials of peripheral blood. WBC differentials are shown in mean ± SEM for FLT3ITD/ITD Ptprj−/− mice and controls from 30 to 35-week-old mice and indicate a reduced lymphocyte and increased neutrophil and monocyte population in Ptprj−/−FLT3ITD/ITD mice compared to FLT3ITD/ITD mice. (E) H&E histopathology showing spleen (top), liver (middle) and kidney (bottom) architecture from 30-to 35-week-old WT, FLT3ITD/ITD, Ptprj−/− and FLT3ITD/ITD Ptprj−/− mice (WP: white pulpa; RP: red pulpa; GC, glomerula capsule with arrows); bars indicate 100 μm. (F-H) Immunophenotype of the BM and spleen cells from FLT3ITD/ITD Ptprj−/− mice show an expansion of the granulocyte/monocyte population and lack of B cells. 30 to 35-week-old mice were analyzed. (F) Gating schema for the characterization of myeloid undifferentiated B and T cells (G) Graphical presentation of CD11b/Gr-1 expression in the BM (G) or spleen (H) and CD19/CD3e expression in the CD11b−/Gr-1− population as the total cell number out of 106 analyzed cells. Values are given as mean ± SEM; *P<0.05, **P<0.01, ***P<0.001 compared to WT; #P<0.05compared to FLT3ITD/ITD. n.s: not significant; WT: wild-type.
Histological spleen sections demonstrated myeloid infiltration in FLT3ITD/ITD mice, compared to WT or Ptprj−/−mice. This phenotype was more prominent in FLT3ITD/ITD Ptprj−/− mice (Figure 2E). Concomitantly, lymphocyte numbers were decreased in the peripheral blood, bone marrow, and spleen (Figure 2D,G,H; Online Supplementary Figure S1). While the histology of kidneys derived from FLT3ITD/ITD or Ptprj−/− mice was not different from that of the kidneys of WT animals, kidneys derived from FLT3ITD/ITD Ptprj−/− mice showed massive infiltration of leukemic cells in the renal medulla resulting in an obvious reduction of the Bowman’s space around the glomerular capsule (Figure 2E). Similarly, a massive infiltration of leukemic cells was observed in the livers of FLT3ITD/ITD Ptprj−/− mice. Infiltration occurred predominantly around liver sinusoids, but was also widespread in the tissue (Figure 2E). Myeloperoxidase (MPO) staining confirmed the infiltration of myeloid cells in the liver (Online Supplementary Figure S2) and kidney (data not shown) of FLT3ITD/ITD Ptprj−/− mice in contrast to age-matched littermates of all other genotypes. Consistent with earlier findings in the FLT3ITD/ITD strain,6 the number of neutrophils and monocytes in the peripheral blood of 30-to 35-week-old mice compared to their WT littermates was 3-and 6-fold higher, respectively (Figure 2D, Online Supplementary Table S1). This phenotype appeared even further pronounced in FLT3ITD/ITD Ptprj−/− animals. A white blood count (WBC) confirmed the expansion of leukocytes in this mouse strain (Online Supplementary Figure S3A). The red blood cell count (RBC) as well as the number of platelets of FLT3ITD/ITD animals was significantly reduced compared to age-matched WT littermates (Online Supplementary Figure S3B,C). The loss of Ptprj in FLT3ITD/ITD mice did not further promote this effect. In FLT3ITD/ITD Ptprj−/− mice hemoglobin (HGB) was significantly enhanced compared to FLT3ITD/ITD mice (Online Supplementary Figure S3D).
The previously reported increased number of mature myeloid (Gr1+/CD11b+) cells in the bone marrow (BM), and particularly in the spleen of FLT3ITD/ITD mice6 was further elevated in the spleen and in peripheral blood in response to Ptprj inactivation (Figure 2G,H; Online Supplementary Figure S1) demonstrating that the absence of Ptprj may lead to the acceleration of the myeloproliferative phenotype driven by FLT3-ITD. Comparative analysis of cytospins of age-matched littermates confirmed an expanded monocyte population in the BM (Online Supplementary Figure S3E). In the spleen a massive infiltration of Gr1+ CD11b+ myeloid cells was observed in FLT3ITD/ITD Ptprj−/− mice (Figure 2H). The number of CD19+ cells was drastically reduced in FLT3ITD/ITD mice. While in the BM this reduction was irrespective of Ptprj activity, in the spleen Ptprj−/− resulted in a further abrogation of CD19+ cells (Figure 2G,H). The amount of CD3e+ T cells of the Gr-1-CD11b− population did not change in any of the investigated genotypes (Figure 2G,H). These data reveal that the inactivation of Ptprj did not promote an inflammatory phenotype in the FLT3ITD/ITD background and aberrancies are due to altered hematopoiesis.
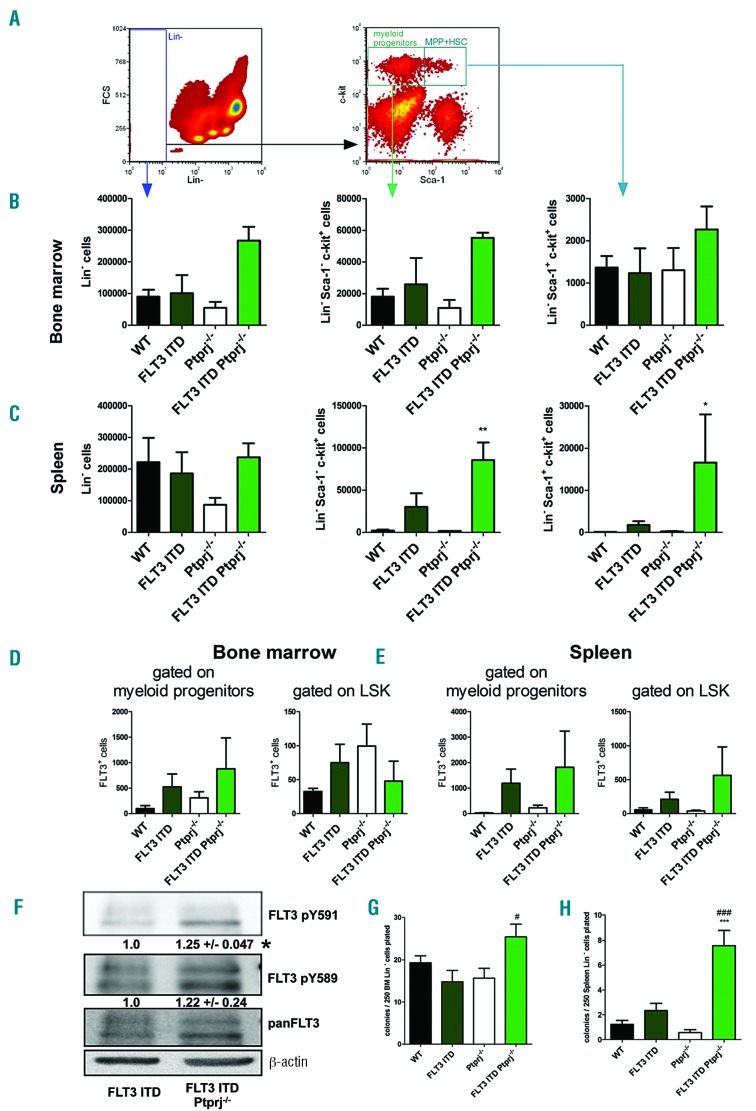
To address the question whether inactivation of Ptprj in FLT3ITD/ITD mice affects the abundance of hematopoietic progenitor cells, lineage negative (Lin-) cells from the BM and spleen were characterized. While the single genetic lesions did not alter the number of Lin-cells in the BM, a roughly 2.5-fold elevation in FLT3ITD/ITD Ptprj−/− mice was observed (Figure 3B). In the spleen of Ptprj−/− mice, a reduction of about 50% of this cell population compared to WT or FLT3ITD/ITD littermates was detected. Previous reports have highlighted an increase of hematopoietic stem and progenitor cell numbers in FLT3ITD/ITD spleens.8,9 Importantly, we found a further increase in the number of Lin− Sca-1+ c-Kit+ (LSK) cells in the spleen of FLT3ITD/ITD Ptprj−/− mice (Figure 3C), whereas such differences were not observed in the BM. Taken together, these data demonstrate that the absence of Ptprj in FLT3ITD/ITD mice results in an increase of Lin-progenitor cells, which is predominantly apparent in the spleen. Further evaluation of the LSK compartment demonstrated reduced numbers of megakaryocyte erythroid progenitors (MEP) and elevated numbers of granulocyte-macrophage progenitor (GMP) cells in FLT3ITD/ITD mice, but this did not alter in response to the inactivation of Ptprj. (Online Supplementary Figure S4). The number of common myeloid progenitors (CMP) remained unchanged in all genotypes. The abundance of hematopoietic stem cells (HSC), long-term (LT) HSC and short-term (ST) HSC in Lin-Sca1+ c-kit+ cells using CD34 and FLT3 staining remained unchanged among the different mouse genotypes (data not shown).
Figure 3.
The inactivation of Ptprj in FLT3ITD/ITD mice affects the formation of progenitor cells. Lineage analysis of the BM and spleen cells from FLT3ITD/ITD Ptprj−/− mice shows an expansion of the Lin− c-kit+ Sca-1− and Lin− c-kit+ Sca-1+ population and amount of FLT3+ cells. Representative flow cytometric analysis of the BM or spleen cells derived from WT, FLT3ITD/ITD, Ptprj−/− and FLT3ITD/ITD Ptprj−/− mice are shown. (A) Dot plots illustrating the gating for Lin−, Lin− c-kit+ Sca-1− and LSK (Lin-c-kit+ Sca-1+) cell populations. An abundance of these cells in the BM (B) and spleen (C) is presented. Values are given as mean ± SEM; *P<0.05, **P<0.01, compared to WT. (D, E) The number of FLT3 positive cells of myeloid progenitors (Lin-c-kit+ Sca-1−, left) or LSK cell (right) derived from the BM (D) or spleen (E). (F) FLT3ITD/ITD Ptprj−/− mice show enhanced FLT3-ITD activity. Western blotting of the Lin-BM cells of 30-week-old FLT3ITD/ITD and FLT3ITD/ITD Ptprj−/− mice. BM cells were MACS-purified for Lin-immunophenotype. Cells were lysed, processed via sodium dodecyl sulfate polyacrylamide gel electrophoresis (SDS-PAGE) and subsequently underwent immunoblotting using phospho site specific antibodies which recognized FLT3 pY591 and FLT3 pY589. Each blot was reprobed for panFLT3 antibodies and β-actin was used as the loading control. A representative blot is presented. Numbers under the phosphor-specific blots (mean +/-SEM) represent the quantification of the phosphor-specific signals of three independent experiments, normalized to the corresponding signals with pan-specific antibodies, and relative to the signals in FLT3 ITD mice, which was set to 1.0. *P<0.05. (G, H) The promotion of clonogenic growth of Lin-FLT3ITD/ITD Ptprj−/− spleen cells. Lin-BM (G) and spleen (H) cells from 30 to 35-week-old WT, FLT3ITD/ITD, Ptprj−/− and FLT3ITD/ITD Ptprj−/− mice were plated on M3434 methylcellulose medium (containing stem cell factor [SCF-1], interleukin-3 [IL-3], erythropoietin [EPO]) and scored for colony formation seven days later. ***P<0.001 compared to WT;#P<0.05; ###P<0.001 compared to FLT3ITD/ITD mice. WT: wild-type.
The previously reported massive expansion of FLT3 positive cells8 was confirmed in our FLT3ITD/ITD mouse model: in Lin− c-Kit+ progenitors derived from FLT3ITD/ITD mice, a 5-or 40-fold elevation of FLT3 positive cells in the BM or spleen, respectively, was observed compared with WT mice (Figure 3D,E). The inactivation of Ptprj resulted in a further increase of this cell population (Figure 3D,E) confirming extramedullary hematopoiesis in the spleen. Similarly, FLT3-ITD expressing LSK cells in FLT3ITD/ITD Ptprj−/− mice were enhanced in the spleen only.
Given that PTPRJ can negatively regulate FLT3 signaling, we expected that the transformation of the signaling of FLT3-ITD in the absence of Ptprj would be enhanced, thereby promoting the myeloproliferative phenotype. To assess FLT3-ITD signaling activity, Lin-cells from the BM of 30-week-old mice were purified by magnetic-activated cell sorting (MACS) and subsequently probed for activity specific phosphorylation of FLT3. While in WT or Ptprj−/−cells the level of FLT3 expression was too low to be detected by western blotting, a significant increase of FLT3-ITD pY591 autophosphorylation activity could be detected in cells from FLT3ITD/ITD Ptprj−/−mice compared with cells from FLT3ITD/ITD mice (Figure 3F). In addition, an increased dominance of the immature FLT3 receptor of these cells further confirmed elevated activity.10 Unfortunately, altered FLT3-ITD mediated STAT5 activation could not be demonstrated in vivo. Elevated kinase activity of FLT3 is known to shift the dose-response curve for tyrosine kinase inhibitors (TKI) towards somewhat lower sensitivity. Inversely, relative resistance to TKI11 may indicate higher FLT3 signaling activity. We employed 32D cells stably overexpressing FLT3-ITD12 with inactivated Ptprj using CRISPR/Cas9 (Online Supplementary Figure S5A). A slight elevation of pY589 site-specific phosphorylation was observed (Online Supplementary Figure S5B). Inactivation of Ptprj in these cells resulted in an elevated IC50 for the FLT3-selective TKI quizartinib (AC220) and the more broadly active TKI midostaurin (PKC412). These findings indicate that FLT3-ITD signaling activity appears to be increased upon Ptprj inactivation. Moreover, data point to the possibility that patients with lower PTPRJ levels may be relatively less sensitive to TKI treatment.
To determine the potential of progenitor cells in the BM and spleen for CFU, cells were MACS-sorted for Lin-immunophenotype and subsequently evaluated in in vitro clonogenic assays in M3434 methylcellulose. While the number of CFU of BM granulocytes/ macrophages of WT, FLT3ITD/ITD or Ptprj−/− mice showed no significant changes, the numbers of CFU-GM from FLT3ITD/ITD Ptprj−/− BM were significantly elevated (Figure 3G). The Lin-spleen cells of FLT3ITD/ITD mice formed a similar number of CFU-GM as cells from WT mice, but CFU-GMs were significantly elevated in FLT3ITD/ITD Ptprj−/− mice (Figure 3G). Cytospins of CFU-GM showed that cells derived from FLT3ITD/ITD or FLT3ITD/ITD Ptprj−/− BM were characterized by an accumulation of myelocytes, myeloblasts and monocytes while the abundance of granulocytes and macrophages was reduced compared to WT and Ptprj−/− littermates (data not shown). Almost no CFU of multipotential granulocyte, erythroid, macrophage, megakaryocyte progenitor cells (CFU-GEMM) or erythroid progenitor cells (BFU-E) were observed for all genotypes (data not shown). We performed the re-plating of FLT3ITD/ITD Ptprj−/−BM cells in order to assess for a potential gain in self-renewal capacity by combined FLT3-ITD expression and Ptprj loss, however, FLT3ITD/ITD Ptprj−/− cells lacked re-plating capacity, just like the FLT3ITD/ITD or Ptprj−/− controls. In the absence of cytokines no colony formation of Lin-cells in methylcellulose was observed (data not shown).
Taken together, the inactivation of Ptprj in FLT3ITD/ITD mice resulted in a more pronounced infiltration of myeloid (Gr-1+ CD11b+) cells with an increased repression of lymphocytes, which may indicate an enhanced aggressiveness of a FLT3-ITD driven disease. The expansion of the progenitor cells of FLT3ITD/ITD Ptprj−/− mice, most notable in the spleen, indicated an increase of extramedullary hematopoiesis. Clonogenic assays showed an enhanced CFU-GM potential of Lin-spleen cells. Moreover, the specific phosphorylation of FLT3 in Lin-BM cells derived from FLT3ITD/ITD Ptprj−/− mice was enhanced. Thus, our data identify PTPRJ as a suppressor of FLT3-ITD induced myeloproliferation.
Supplementary Material
Acknowledgments
We are thankful to Jörg Cammenga (Lund University, Sweden) for kindly providing FLT3ITD/ITD mice and Klaus Metzelder for providing additional array data. We thank Ilse D. Jacobsen for kindly providing access to the Mindray Hematology system.
Footnotes
Funding: the work was supported by the Deutsche Forschungsgemeinschaft (grant Mu955/11-1) and by the Federal Ministry of Education and Research (BMBF), Germany, FKZ 01ZX1302B, 01ZX1602B (CancerTel-Sys), FKZ: 01EO1002, 01EO1502 (CSCC).
Information on authorship, contributions, and financial & other disclosures was provided by the authors and is available with the online version of this article at www.haematologica.org.
References
- 1.Papaemmanuil E, Gerstung M, Bullinger L, et al. Genomic classification and prognosis in acute myeloid leukemia. N Engl J Med. 2016; 374(23):2209–2221. [DOI] [PMC free article] [PubMed] [Google Scholar]
- 2.Arora D, Stopp S, Böhmer SA, et al. Protein-tyrosine phosphatase DEP-1 controls receptor tyrosine kinase FLT3 signaling. J Biol Chem. 2011;286(13):10918–10929. [DOI] [PMC free article] [PubMed] [Google Scholar]
- 3.Godfrey R, Arora D, Bauer R, et al. Cell transformation by FLT3 ITD in acute myeloid leukemia involves oxidative inactivation of the tumor suppressor protein-tyrosine phosphatase DEP-1/ PTPRJ. Blood. 2012;119(19):4499–4511. [DOI] [PubMed] [Google Scholar]
- 4.Valk PJ, Verhaak RG, Beijen MA, et al. Prognostically useful gene-expression profiles in acute myeloid leukemia. N Engl J Med. 2004; 350(16):1617–1628. [DOI] [PubMed] [Google Scholar]
- 5.Metzeler KH, Hummel M, Bloomfield CD, et al. An 86-probe-set gene-expression signature predicts survival in cytogenetically normal acute myeloid leukemia. Blood. 2008;112(10):4193–4201. [DOI] [PMC free article] [PubMed] [Google Scholar]
- 6.Lee BH, Tothova Z, Levine RL, et al. FLT3 mutations confer enhanced proliferation and survival properties to multipotent progenitors in a murine model of chronic myelomonocytic leukemia. Cancer Cell. 2007;12(4):367–380. [DOI] [PMC free article] [PubMed] [Google Scholar]
- 7.Trapasso F, Drusco A, Costinean S, et al. Genetic ablation of Ptprj, a mouse cancer susceptibility gene, results in normal growth and development and does not predispose to spontaneous tumorigenesis. DNA Cell Biol. 2006;25(6):376–382. [DOI] [PubMed] [Google Scholar]
- 8.Li L, Bailey E, Greenblatt S, Huso D, Small D. Loss of the wild-type allele contributes to myeloid expansion and disease aggressiveness in FLT3/ITD knockin mice. Blood. 2011;118(18):4935–4945. [DOI] [PMC free article] [PubMed] [Google Scholar]
- 9.Li L, Piloto O, Nguyen HB, et al. Knock-in of an internal tandem duplication mutation into murine FLT3 confers myeloproliferative disease in a mouse model. Blood. 2008;111(7):3849–3858. [DOI] [PMC free article] [PubMed] [Google Scholar]
- 10.Schmidt-Arras DE, Bohmer A, Markova B, Choudhary C, Serve H, Bohmer FD. Tyrosine phosphorylation regulates maturation of receptor tyrosine kinases. Mol Cell Biol. 2005;25(9):3690–3703. [DOI] [PMC free article] [PubMed] [Google Scholar]
- 11.Tse KF, Allebach J, Levis M, Smith BD, Bohmer FD, Small D. Inhibition of the transforming activity of FLT3 internal tandem duplication mutants from AML patients by a tyrosine kinase inhibitor. Leukemia. 2002;16(10):2027–2036. [DOI] [PubMed] [Google Scholar]
- 12.Grundler R, Miething C, Thiede C, Peschel C, Duyster J. FLT3-ITD and tyrosine kinase domain mutants induce 2 distinct phenotypes in a murine bone marrow transplantation model. Blood. 2005; 105(12):4792–4799. [DOI] [PubMed] [Google Scholar]
- 13.Metzelder SK, Michel C, von Bonin M, et al. NFATc1 as a therapeutic target in FLT3-ITD-positive AML. Leukemia. 2015;29(7):1470–1477. [DOI] [PubMed] [Google Scholar]
Associated Data
This section collects any data citations, data availability statements, or supplementary materials included in this article.


