

Abstract
Chitin is the second most abundant polysaccharide in nature and linked to fungal infection and asthma. However, bona fide immune receptors directly binding chitin and signaling immune activation and inflammation have not been clearly identified because polymeric crude chitin with unknown purity and molecular composition has been used. By using defined chitin (N‐acetyl‐glucosamine) oligomers, we here identify six‐subunit‐long chitin chains as the smallest immunologically active motif and the innate immune receptor Toll‐like receptor (TLR2) as a primary fungal chitin sensor on human and murine immune cells. Chitin oligomers directly bind TLR2 with nanomolar affinity, and this fungal TLR2 ligand shows overlapping and distinct signaling outcomes compared to known mycobacterial TLR2 ligands. Unexpectedly, chitin oligomers composed of five or less subunits are inactive, hinting to a size‐dependent system of immuno‐modulation that appears conserved in plants and humans. Since blocking of the chitin‐TLR2 interaction effectively prevents chitin‐mediated inflammation in vitro and in vivo, our study highlights the chitin‐TLR2 interaction as a potential target for developing novel therapies in chitin‐related pathologies and fungal disease.
Keywords: anti‐fungal innate immunity, chitin, inflammation, N‐acetyl‐glucosamine, toll‐like receptor
Subject Categories: Immunology; Microbiology, Virology & Host Pathogen Interaction; Signal Transduction
Introduction
Fungal infections and airway inflammation in allergic asthma are associated with an immense socio‐economic burden globally 1, 2 and have both been linked to immune activation by the second most abundant polysaccharide in nature, chitin. Chitin is a β‐(1‐4)‐N‐acetyl D‐glucosamine (NAG, also referred to as GlcNAc) homo‐polymer 3 and is found in fungi, parasitic nematodes, crustaceans, insects, and house‐dust mite allergen 4, 5. Chitin elicits strong immunogenic activity with particular relevance for fungal infection 6, 7 and airway inflammation during asthma 8, 9. Chitin also constitutes a highly conserved microbe‐associated molecular pattern (MAMP) 4 eliciting immune activation in plants and mammals. In the latter, chitin is considered an “orphan MAMP” by many researchers in the field as its direct immune receptor has so far not been identified. MAMPs are typically sensed by direct binding to pattern recognition receptors (PRRs), for example, Toll‐like receptors (TLRs) and C‐type‐lectin‐like receptors (CLRs) 10, 11. Certain CLRs detect oligosaccharide structures common on fungal pathogens such as β‐glucans which are sensed by the CLR Dectin‐1 11; TLRs directly recognize non‐oligosaccharide and more structurally diverse MAMPs—e.g., lipopeptides (via TLR2), lipopolysaccharide (LPS, via TLR4), or nucleic acids (via TLRs 7, 8 and 9)—via their extracellular domains (ECD), and cytoplasmic signaling involves the adapter myeloid differentiation factor 88 (MyD88). Whereas respiratory burst and phagocytosis are triggered only by CLRs, CLR and TLR signaling may cooperate for pro‐inflammatory cytokine and/or interferon (IFN) transcription and the initiation of adaptive immunity 10.
Although plants lack adaptive immunity, their sophisticated innate immune system shows interesting similarities to mammalian innate immunity with regard to MAMP recognition, for example, regarding flagellin and chitin 10, 12. Fungal chitin in both rice (Oryza sativa) and Arabidopsis thaliana involves the composite CEBiP/CERK1 chitin receptor system and is based on oligomeric chitin fragments 13, 14, a feature not reported for mammalian chitin recognition thus far. Although in mammals immunological effects have been considered “size‐dependent”, this was only studied on a macromolecular and not oligomer scale 15, 16: The so‐called smallest immunostimulatory macromolecular chitin used to date (typically > 1 μm) contains hundreds to thousands of NAG subunits, thus exceeding the size of entire human immune cells, whereas multimeric chitin < 0.2 μm has been considered immunologically inactive in the field and thus irrelevant in mammals 4. Since oligomeric chitin would better match the dimensions of the PRRs discussed so far, such a conclusion seems counterintuitive but has not been properly challenged due to the difficulty in obtaining oligomeric chitin. Studies of the molecularly ill‐defined crude chitin in knockout (KO) mice have thus yielded a controversial list of putative chitin receptors in mammals, but direct binding of chitin to any of these receptors has not been demonstrated so far. Whereas a chitin‐binding molecule, FIBCD1, on non‐immune cells was reported 17, the receptor for the observed pleiotropic immunological effects of chitin in mammalian immune cells is still elusive 6.
Using defined chitin oligomers rather than crude chitin, we here show TLR2 to be a mammalian immune cell PRR to bind chitin with nanomolar affinity and signal to chitin. Unexpectedly, oligomers of at least six NAGs activate the receptor, whereas oligomers of ≤ 5 NAGs show antagonistic activity. This highlights a size‐dependent system of immune activation versus regulation common to plant and animal kingdom, and chitin‐TLR2 binding as a therapeutic target for modulating chitin‐mediated immune activation.
Results and Discussion
Small chitin oligomers activate human and murine immune cells
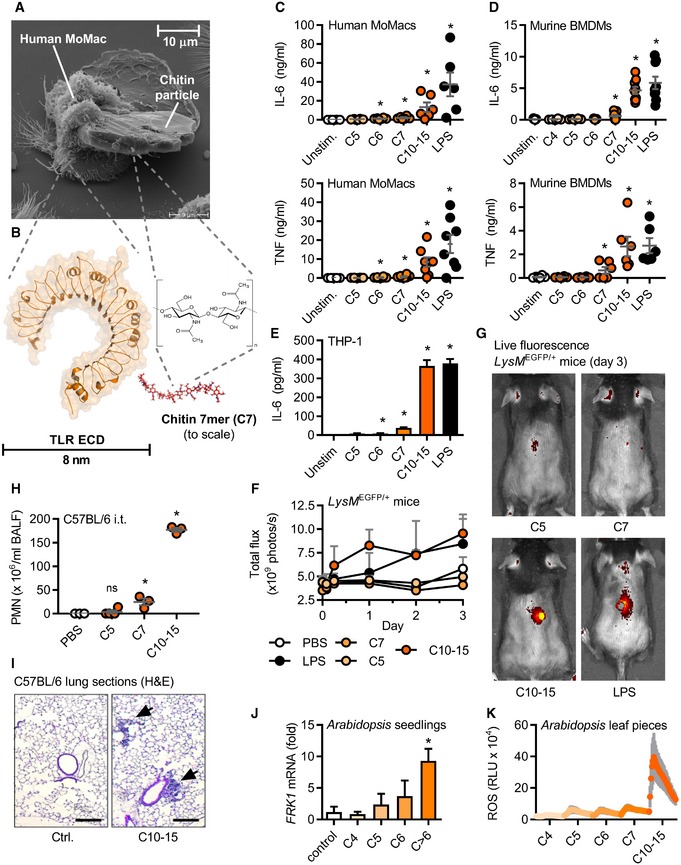
To illustrate the challenge to study size‐dependent aspects of chitin interaction with a cell‐surface receptor, we first conducted scanning electron microscopy studies of immune cells incubated with the type of crude chitin used before in the field (Table EV1). These particles are as big as entire human monocyte‐derived macrophages (MoMacs, Fig 1A) and thus much larger than the NAG chitin subunit and typical PRR MAMP‐sensing domains (Fig 1B). Crude chitin preparations are thus not suitable to solve molecular recognition principles. The findings that large chitin particles strongly induced chitinase transcription in human whole blood (Fig EV1A) and that both murine broncho‐alveolar lavage fluid (BALF, Fig EV1B) and MoMac supernatants (Fig EV1C) showed significant chitinase activity prompted us to assess the immunological effects of oligomeric chitin. Thus, we tested highly purified and endotoxin‐free oligomers of defined length derived from crab‐shell chitin (see Materials and Methods) comprising 4–15 NAGs, which are in the size range of known PRR ligand recognition domains, e.g., TLR ectodomains (Fig 1B). Whereas fragments with 4 or 5 NAGs (termed, e.g., C4 or C5) did not elicit substantial IL‐6 and/or TNF release from MoMacs (Fig 1C) and murine bone marrow‐derived macrophages (BMDMs, Fig 1D) at equimolar concentrations, chitin oligomers of 6 (C6) or 7 (C7) NAGs elicited cytokine release significantly above baseline upon overnight incubation. Preparations of oligomers of 10–15 NAGs (C10‐15, MW range 2,000–3,000 Da, see Appendix) induced cytokine release comparable to the TLR4 agonist LPS. A similar dependence on fragment length ≥ 6 NAG was observed for the human macrophage‐like THP‐1 cell line (Fig 1E). Important control experiments using, e.g., in Tlr4‐deficient BMDMs or using polymyxin B (Fig EV1D and E) showed that the observed effects were not due to endotoxin contamination but rather that chitin oligomers themselves elicited robust immune activation.
Figure 1. Size‐dependent recognition of defined chitin oligomers in humans, mice, and plants.
-
AElectron micrograph of a human MoMac engulfing a crude chitin particle (n = 2).
-
B–E(B) Size comparison (to scale) of typical TLR ectodomain and a chitin 7‐mer (seven NAG subunits). Release of IL‐6 and/or TNF release (ELISA) from (C) human MoMacs (n = 6–8), (D) murine BMDMs (n = 6), or (E) THP‐1 cells (n = 3).
-
F, G(F) GFP in vivo fluorescence post‐intradermal injection of chitin oligomers into LysM EGFP/+ C57BL/6 mice (n = 3/group). (G) Representative in vivo imaging results.
-
H, ILeukocyte infiltration in vivo after intratracheal administration assessed by (H) BALF flow cytometry (n = 3–4/group) and (I) histology analysis (n = 2), scale bar = 200 μm, arrows show cellular infiltrate.
-
J, KArabidopsis thaliana seedling (J) target gene mRNA induction (n = 3) or leaf piece (K) ROS production (0–45 min, n = 6).
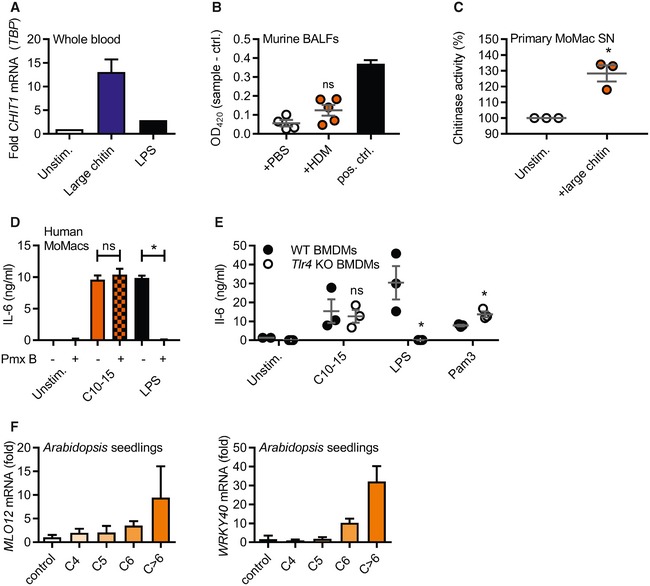
Figure EV1. Chitin treatment results in chitinase and target gene induction in mammalian and plant cells, respectively.
-
AmRNA induction of CHIT1 relative to TBP and unstimulated conditions in human whole blood treated with large chitin (n = 2).
-
BChitin azure degradation indicative of chitinase activity in murine BALF from mice previously treated with PBS or house‐dust mite allergen (HDM) in vivo (n = 5). S. griseus recombinant chitinase was used as a positive control.
-
CPrimary human MoMacs were stimulated with C10‐15 or large chitin for 24 h and supernatants harvested and incubated with chitin azure (n = 3).
-
D, ECytokine release induced by chitin is independent of endotoxin. (D) IL‐6 release from stimulated human MoMacs stimulated in the absence or presence of polymyxin B (Pmx B, n = 3), and (E) IL‐6 release from WT or Tlr4 KO BMDMs (n = 3) are shown for one representative batch of C10‐15.
-
FTarget gene induction in A. thaliana seedlings. MLO12 and WRKY40 mRNA induction (n = 3).
To test whether chitin oligomers possessed immunostimulatory properties in vivo, several applications were tested in mice. Chitin plays a role in infections and inflammation in both the skin and the lung 5, 18. C10‐15 was therefore first injected into the skin of C57BL/6 mice expressing enhanced green fluorescent protein (EGFP) under the control of a myeloid‐specific promoter (LysM). Thus, fluorescently labeled myeloid cells in these mice allow for straightforward in vivo imaging of immune activation. C10‐15 clearly elicited fulminant local immune cells infiltration indicated by a rapid and strong increase in local EGFP fluorescence (Fig 1F and G). Next, C10‐15 oligomers were also administered intratracheally to assess lung inflammation 9. Consistent with 19 showing an influx of neutrophils into the lung within 6 h of crude chitin treatment, C10‐15 led to a significant influx of neutrophils in BALF (Fig 1H) and lung tissue (Fig 1I). Although further explorations into timing and nature of C10‐15‐mediated lung infiltration (e.g., eosinophils) are warranted, in summary, these results indicate that—contrary to expectations—defined chitin oligomers are immunologically active in vivo and in vitro, and that immune recognition depends on a minimum number of 6–7 NAG subunits in both human and murine cells. Since size‐dependent recognition of chitin was reported in plants earlier 13, we sought to determine whether size‐dependent recognition of chitin oligomers extended across kingdoms. Indeed, application of the same panel of chitin oligomers to A. thaliana seedlings confirmed innate immune responses such as target gene induction (e.g., FRK1, MLO12, and WRKY40, Figs 1J and EV1F) and respiratory burst (Fig 1K), and the response depended on oligomer size. Chitin sensing is thus broadly conserved across kingdoms in requiring oligomeric chitin chains of similar chain length for immune activation.
Oligomeric chitin sensing depends on TLR2
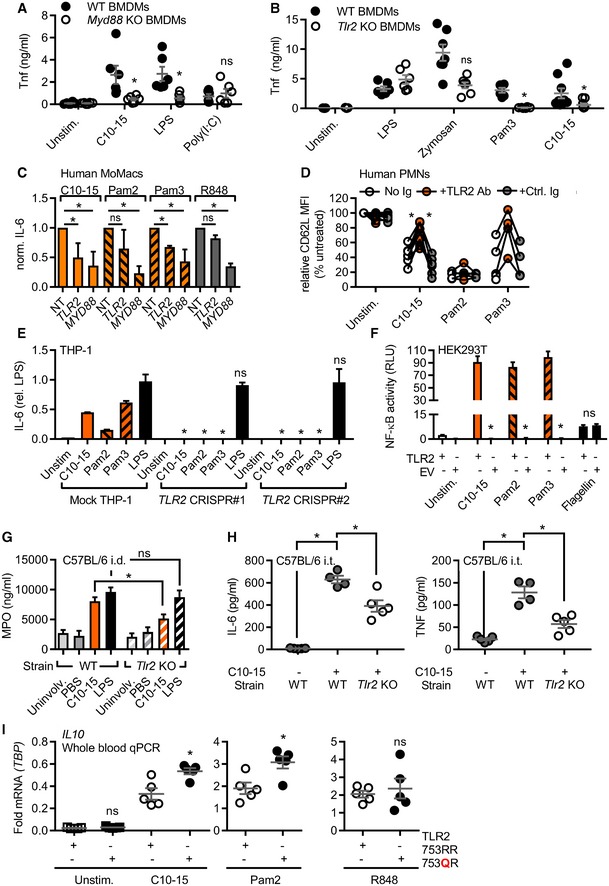
Direct sensing by a typical cell‐surface PRR would be expected to lead to a rapid transcriptional response which we indeed observed in THP‐1 cells, BMDMs, and human MoMacs for IL6 and TNF transcripts (Fig EV2A). Additionally, primary human neutrophils (PMNs) effectively shed CD62L (L‐selectin) and released IL‐8 upon C10‐15 exposure on a time frame typical for PRRs (Fig EV2B). Excluding secondary effects resulting from the particle‐like properties of crude chitin preparations, we used our defined chitin oligomers to unequivocally identify the PRR responsible for the immunostimulatory effects of chitin. BMDMs deficient for the TLR adaptor MyD88 showed a significant reduction in the TNF response to C10‐15 but not the MyD88‐independent TLR3 stimulus, poly(I:C), compared to WT BMDMs (Fig 2A), indicating the involvement of a MyD88‐dependent TLR in chitin sensing. Additionally, TNF release in response to C10‐15 as well as the known mycobacterial TLR2 lipopeptide ligand, Pam3CSK4 (Pam3), was partially reduced in Tlr2 KO BMDMs (Fig 2B). This suggested that at least in mice TLR2 might be involved in molecular chitin sensing. To confirm the involvement of TLR2 in the human system, MYD88 and TLR2 were silenced using siRNA in human MoMacs, which led to a significant reduction in relative IL‐6 release for C10‐15 similar to the reduction observed for the TLR2 ligands Pam2CSK4 (Pam2) and Pam3, but not TLR8 agonist, R848 (Fig 2C, knock‐down analysis in Fig EV2C). Blocking of human PMN TLR2 responses, including C10‐15, with a well‐characterized anti‐TLR2 blocking Ab 20 but not with a control IgG led to impaired CD62L shedding (Fig 2D). Furthermore, CRISPR deletion of TLR2 in THP‐1 cells (see 21 and verification of TLR protein levels in Fig EV2D) resulted in complete abrogation of IL‐6 production in response to C10‐15, Pam2, and Pam3, compared to LPS (Fig 2E). Conversely, genetic complementation of HEK293T cells (which endogenously express TLR5 as well as the known TLR2 co‐receptors, TLR1 and TLR6) with TLR2 was sufficient to establish responsiveness to C10‐15 in terms of NF‐κB activation (Fig 2F). Of note, Dectin‐1, NOD2, and TLR9 reconstitution in HEK293T did not result in chitin responsiveness (Fig EV2E), and Clec7a KO (Dectin‐1‐deficient) immortalized macrophages (iMacs) 22 responded as efficiently to C10‐15 as WT macrophages (Fig EV2F). In vitro, TLR2 thus was essential for full chitin‐mediated cellular activation. To corroborate this in an in vivo setting, C10‐15 was also applied intradermally or administered intratracheally in WT and Tlr2 KO mice. In the skin, WT mice showed significantly higher myeloperoxidase (MPO) activity 12 h post‐injection than Tlr2 KO mice upon treatment with C10‐15 but not with LPS, indicating lower PMN activation in Tlr2 KO mice (Fig 2G). Similarly, IL‐6 and TNF levels in the BALF of Tlr2 KO mice treated with C10‐15 were significantly lower than the cytokine levels in WT mice (Fig 2H), confirming a dependence on TLR2 in vivo. To gain additional evidence for TLR2‐dependence of chitin recognition in humans, we analyzed whole blood from healthy individuals without (WT p.753RR) and with heterozygous carriage of a well‐known TLR2 gene variant, rs5743708 (p.753RQ); this variant is strongly associated with pulmonary invasive fungal disease in acute myeloid leukemia patients (OR 4.5, 95% CI 1.4–15.1, P = 0.014, see 23) and with up to 40‐fold altered cytokine levels during Candida sepsis, respectively 24. Similarly to the mycobacterial TLR2 agonist Pam2, but not to the TLR8 agonist R848, stimulation with C10‐15 showed a 100% higher induction of relative IL10 transcription between 753RR and 753QR allele groups, (Fig 2I). This was in line with the reported effect of Candida albicans TLR2 signaling on IL‐10 25 and indicates a shared response of both mycobacterial lipopeptides and fungal chitin via TLR2. Collectively, these results show that TLR2 is a critical mediator of immune activation in response to oligomeric chitin in both humans and mice.
Figure EV2. Chitin oligomers initiate cellular activation in a TLR2‐dependent manner.
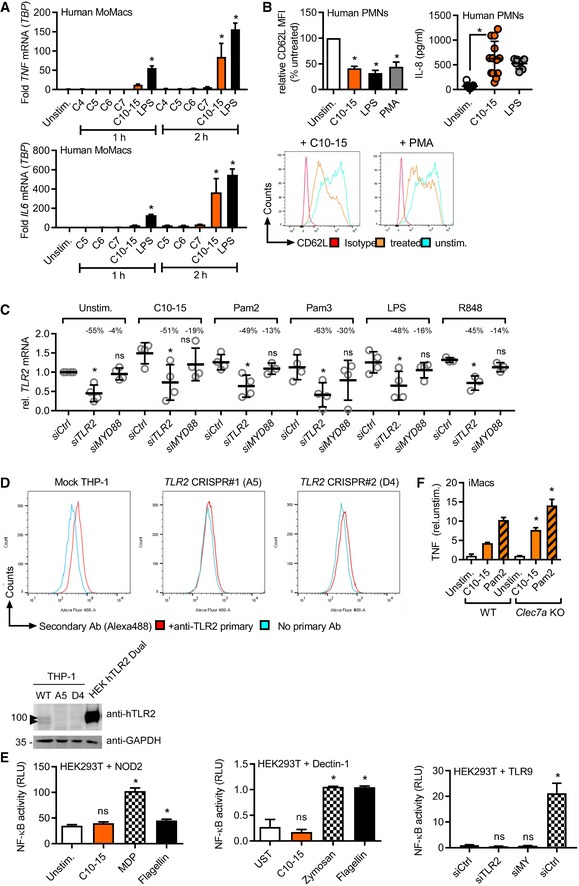
- IL6 or TNF mRNA induction relative to TBP in human MoMacs (n = 3).
- Relative CD62L shedding (n = 8, histograms shown for one representative donor) and IL‐8 release (n = 7–13) from human PMNs upon 1‐ or 4‐h stimulation, respectively.
- TLR2 mRNA knock‐down efficiency upon Ctrl, MYD88 or TLR2 siRNA transfection in human MoMacs (see Fig. 2c), relative to Ctrl siRNA.
- TLR2 immunoblot and flow cytometry in TLR2 CRISPR‐edited THP‐1 cells (n = 1 each). Arrowheads denote endogenous TLR2 (glycosylated).
- NF‐κB activity in empty vector (EV) or NOD2, Dectin‐1, or TLR9‐transfected HEK293T cells (n = 2–3).
- TNF release (relative to unstimulated) from WT or Clec7a KO (Dectin‐1 deficient) immortalized macrophages (iMacs, n = 2).
Figure 2. TLR2 is the mediator of chitin oligomer‐mediated immune activation.
-
A, BTNF released from WT or Myd88 (A) or Tlr2 (B) KO BMDM (total n = 6–9/group combined from three experiments).
-
CIL‐6 released from primary MoMacs (n = 5) treated with non‐targeting (NT), TLR2‐, or MyD88‐specific siRNA relative to NT condition.
-
DCD62L shedding from human PMNs (n = 4–8) with or without isotype control or anti‐TLR2 blocking antibody.
-
EIL‐6 protein released from mock or TLR2 Cas9‐CRISPR‐edited THP‐1 cells (n = 3).
-
FNF‐κB activity in empty vector (EV) or TLR2‐transfected HEK293T cells (n = 3).
-
GMPO release from intradermally injected WT or Tlr2 KO mice (n = 5–15 biopsies each).
-
HBALF IL‐6 and TNF from intratracheally treated WT or Tlr2 KO mice (n = 4–5 mice each).
-
IRelative IL10 mRNA in whole blood of WT or heterozygous TLR2 R753Q carriers (n = 5 each).
Oligomeric chitin engages TLR1 and acts as a unique fungal TLR2 agonist
Several earlier in vitro and in vivo results had implicated TLR2 in fungal infection (reviewed in 7), but the precise molecular nature of the fungal TLR2 agonist has so far remained unclear. This is epitomized by the finding that the complex Saccharomyces cerevisiae cell wall preparation, zymosan, is well‐known to possess TLR2‐stimulatory activity 26. But despite > 1,200 published immunological studies using zymosan, the molecular nature of this “TLR2 activity” is unknown. Interestingly, TLR2 (but not Dectin‐1) activity can be “depleted” by hot alkali treatment. Thus, among the known components of fungal cells that are chemically sensitive to hot sodium hydroxide treatment, we noted that chitin was previously chemically de‐acetylated by such treatment 27. Interestingly, hot alkali “depletion” of both zymosan and C10‐15 led to reduced NF‐κB activation in TLR2‐transfected HEK293T cells (Fig 3A). “Depleted” zymosan also showed reduced TLR2‐dependent IL‐8 release from primary PMNs but rather increased ROS production (Fig 3B). ROS production was not detectable by known TLR2 agonists like Pam2 or Pam3 and is thus TLR2‐independent. Similar results were obtained in immortalized macrophages (iMacs), and treatment of zymosan with a recombinant chitinase resulted in reduced NF‐κB activation in TLR2‐HEK293T cells (Fig EV3A). The partial reduction in IL‐8 release was in line with the fact that chitin accounts for only 1% of zymosan 28 and other MAMPs can elicit a residual cytokine response in PMNs via their cognate PRRs even in chitin‐depleted zymosan. Furthermore, mass spectrometry confirmed the de‐acetylation of chitin upon “depletion” (see Appendix) and that soluble material released by in vitro treatment of insoluble zymosan with recombinant bacterial chitinase contained di‐NAG (Fig EV3B). Our results thus point to chitin as a relevant TLR2‐stimulatory component of zymosan, identifying the molecular moiety that links zymosan, fungal infection in general, and the role of TLR2.
Figure 3. Chitin is a unique fungal TLR2 ligand.
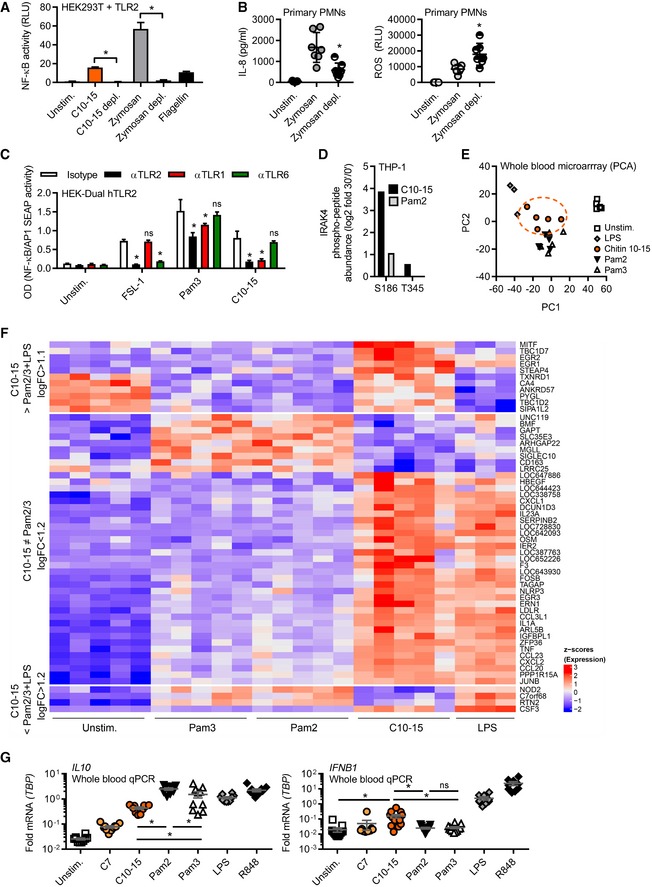
- NF‐κB activity in TLR2‐transfected HEK293T cells (n = 3).
- IL‐8 release and ROS production from primary PMNs (n = 7).
- NF‐κB activity in hTLR2 HEK‐Dual cells pre‐treated with TLR1, TLR2, or TLR6 blocking Abs (n = 2).
- IRAK4 S186 and T345 phospho‐site containing IRAK4 peptides quantified in proteome‐wide phospho‐screen in THP‐1 cells (n = 1).
- Principal component analysis of microarrays conducted on stimulated whole‐blood samples from healthy donors (n = 3–5).
- Microarray intensities (excerpt) of chitin‐specific signature genes (n = 5).
- Relative cytokine mRNAs in whole‐blood stimulation (n = 5–13).
Figure EV3. Zymosan contains chitin as a TLR2‐stimulatory component and chitin oligomers induce distinct gene expression profiles.
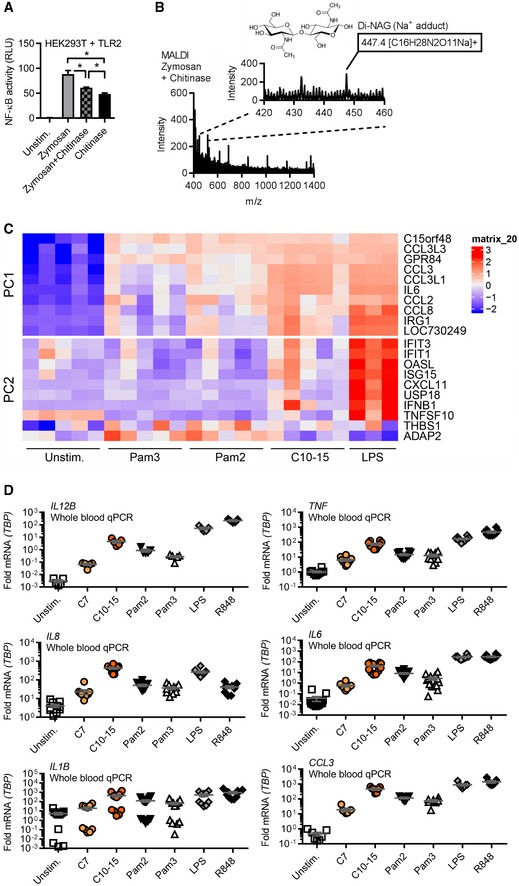
- NF‐κB activity in TLR2‐HEK293T cells using zymosan with or without o/n incubation with S. griseus chitinase or chitinase alone. Note: S. griseus chitinase contained TLR2 activity in the absence of an additional stimulant. Incubation of zymosan with this chitinase led to a reduction in this residual level of TLR2 activity.
- MALDI‐TOF‐MS analysis of chitinase‐treated zymosan supernatants (n = 2).
- Whole‐blood microarray intensities (excerpt) of the 10 genes contributing most strongly to PC1 and PC2, respectively (see Expanded View methods and Code EV1).
- Relative cytokine mRNAs in whole‐blood stimulation (n = 5–13).
We next wondered whether chitin‐elicited, i.e. fungal, TLR2 signaling further differed from mycobacterial lipopeptide TLR2 signaling at the levels of signal transduction and transcriptional profiles. Use of TLR1 or TLR6 blocking antibodies in TLR2‐expressing HEK293‐Dual cells (which express both co‐receptors; Fig 3C) stimulated with FSL‐1 (an alternative di‐acetylated TLR2 agonist compared to Pam2), Pam3, and C10‐15 pointed to a preference for TLR1 as a co‐receptor for chitin‐TLR2 signaling. To gain an idea about potential differences between chitin and lipopeptide TLR2 ligands, we also conducted more global analyses using equimolar ligand concentrations: First, mapping of a dataset from a preliminary phospho‐proteomics screen (dimethyl‐labeling global phospho‐proteomics, see Materials and Methods) in THP‐1 cells to KEGG pathways indicated that within 30 min C10‐15 activated signaling pathways typically engaged by cell‐surface TLR ligands in macrophages, e.g., MAPK, PI3K, and NF‐κB (29 and Dataset EV1). We also compared specific phospho‐peptides in Pam2‐ and C10‐15‐stimulated (30 min at equimolar concentrations) samples. Although many phosphorylation events were shared between Pam2 and chitin, certain phospho‐peptides mapping to MAPK pathway members, e.g., MEK2, cPLA2, STMN1, MAPKAPK, and PAK1/2, were more abundant upon C10‐15 stimulation than after treatment with Pam2 (Dataset EV2). Additionally, a novel phosphorylation site at Ser 186 in the TLR2 pathway kinase IRAK4 was identified and found in 16‐fold greater abundance in C10‐15‐stimulated versus twofold in Pam2‐stimulated samples, compared to unstimulated samples (Fig 3D). Thus, C10‐15 downstream signaling may have certain distinct features compared to other TLR2 ligands. To investigate this more broadly, we used microarrays to study how chitin‐stimulation impacted the gene expression profiles in whole blood from healthy donors, compared to Pam2 and Pam3 stimulation. Principal component analysis (PCA, see Code EV1) showed that while all treatments resulted in a clear separation from unstimulated controls, samples treated with Pam2 and Pam3 were virtually indistinguishable (Fig 3E). In contrast, chitin‐treated samples were clearly different from other treatments, forming a group distinct from LPS and Pam2/Pam3 (Figs 3E and EV3C showing genes contributing to PC1 or PC2). Although there was also overlap, chitin treatment showed many differentially expressed genes compared to other treatments (1,748 genes versus LPS, 411 versus Pam2, 426 genes versus Pam3, Fig 3F and Dataset EV2)—either by inducing or repressing genes significantly more than other treatments or by regulating genes not significantly regulated by other treatments (see Appendix). The most distinct signature genes unique for chitin (Dataset EV2) included the secreted cytokine regulatory factor, oncostatin‐M, and the transcriptional regulators, early growth response proteins 1, 2, and 3, and IκBNS (NFKBID) (Fig 3F). A number of typical TLR‐induced cytokines and chemokines were also differentially regulated (Dataset EV2 and Fig EV3C). Validation by qPCR in additional donors (Fig 3G) confirmed that chitin induced significantly higher levels of IFNB1 (~6‐fold mean transcript levels) and CCL3 (4 or 6.1‐fold), for example, whereas IL10 was more prominently induced by Pam2 or Pam3 (~5‐fold, see Figs 3G and EV3D). These results indicate that oligomeric chitin acts as a novel TLR2 agonist with overlapping but also distinct (e.g., IFNB1 > IL10 induction) properties compared to known mycobacterial TLR2 agonists. Disparate signaling outcomes for different ligands acting through the same receptor were previously reported for TLR7/8 30 or TLR4 31. Our data indicate TLR2 may operate similarly for Pam2/3 versus chitin. Alternatively, differences may be attributable to particular co‐receptors that functions differently than TLR1 or TLR6 for mycobacterial ligands or an additional so‐far‐unidentified receptor responsive to chitin.
The TLR2 ectodomain directly binds to chitin in solution and on the fungal cell wall
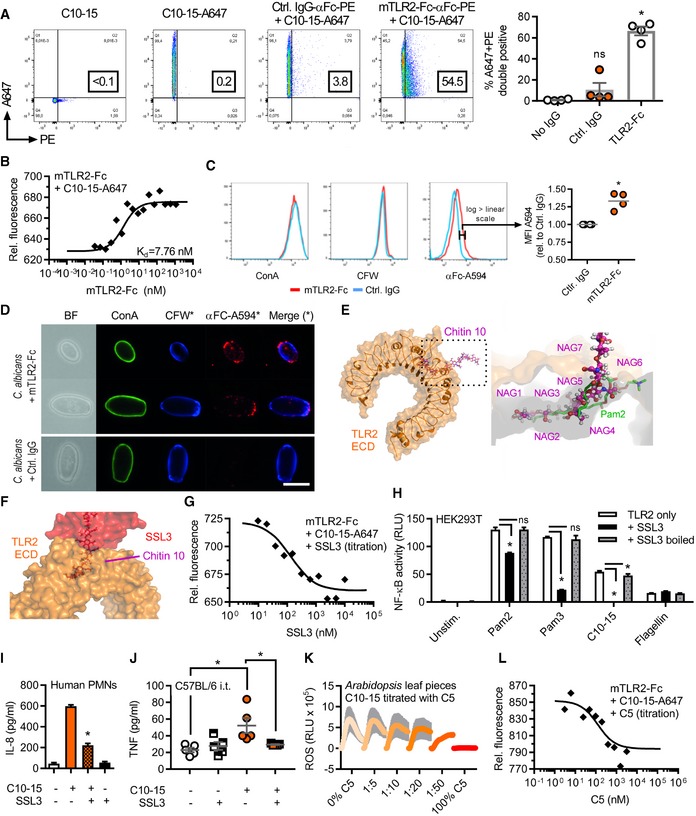
Given that all other previously known TLR2 agonists are lipopeptides 32, 33, the finding that TLR2 senses the oligosaccharide chitin was initially surprising and warranted further confirmation by direct binding assays which were never done for chitin before. In a flow cytometric setup, Alexa647‐labeled C10‐15 interacted with recombinant murine TLR2 ectodomain‐human IgG1 Fc fusion protein (mTLR2‐Fc) but not with a control IgG1‐Fc (Fig 4A). Additionally, microscale thermophoresis (MST, see 34) demonstrated a dose‐dependent binding of Alexa647‐C10‐15 to murine (Fig 4B) and human (Fig EV4A) TLR2 ectodomains with Kd values in the low nanomolar range, namely 6.65 ± 1.69 nM and 7.18 ± 0.3 nM, respectively. This binding was dependent on correct folding of the TLR2 ectodomain since controlled heat denaturation of the TLR2 protein 35 abrogated C10‐15 binding completely. Thus, isolated chitin oligomers directly bound to the TLR2 ectodomain (ECD) in vitro. In line with chitin constituting a small fraction (~3–4%, see 36) of the fungal cell wall, there was a moderately (~25% higher) but consistently stronger staining of C albicans fungal cells by mTLR2‐Fc ECD than control IgG (Fig 4C), indicative of TLR2 binding. The control stain, calcofluor white (CFW), which broadly stains chitin‐rich cell wall areas, showed comparable staining across samples. In confirmation of this result, fluorescence microscopy showed few but distinct mTLR2‐Fc‐stained areas within the cell wall of stained C. albicans (Fig 4D). These data suggest that the TLR2 ectodomain can bind directly to chitin in the fungal cell wall but potentially with few accessible binding sites. Fungi dynamically adapt the MAMP content of their cell walls in the host 37. Receptor dependence of a MAMP in the context of an entire microbe is therefore difficult to assess in vivo, but our data are in good agreement with the observed dependence of fungal infections on TLR2 7.
Figure 4. Direct chitin TLR2 binding and immune activation can be blocked by SSL3 or short chitin oligomers.
-
A, BFlow cytometric quantification (A) or microscale thermophoresis (MST) analysis (B) of Alexa647‐labeled C10‐15 interaction with mTLR2‐Fc protein (n = 4 each).
-
C, D(C) Flow cytometry and (D) fluorescence microscopy of Candida albicans stained with control IgG or mTLR2‐Fc anti‐Fc‐Alexa594, together with ConA‐Alexa488 and CFW (n = 4 each). Scale bar = 5 μm.
-
E, F(E) Docking of chitin 10 (magenta) into the TLR2 (orange) Pam2 (green) lipopeptide binding pocket (close‐up, pdb: 2z7x), (F) overlaid with SSL3 from a SSL3‐inhibited TLR2 complex (pdb: 5d3i).
-
GMST analysis of Alexa647‐labeled C10‐15 and mTLR2‐Fc protein with SSL3 titration (n = 2).
-
H, I(H) NF‐κB activation in TLR2‐transfected HEK293T cells (n = 3) or (I) IL‐8 release from primary PMNs (n = 2) without or with SSL3.
-
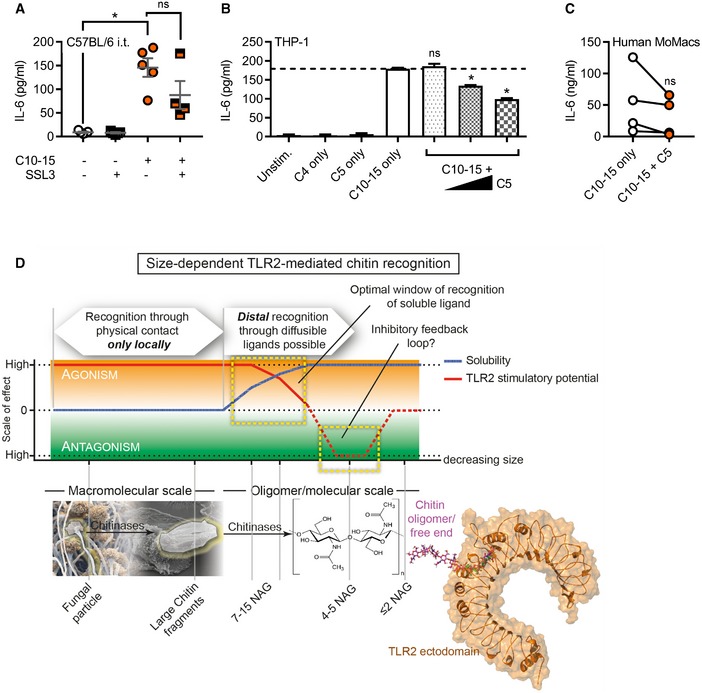
JBALF TNF in C57BL/6 mice (n = 5/group) upon C10‐15 administration without or with SSL3.
-
KROS production between 0 and 45 min post‐chitin application in A. thaliana leaf pieces (n = 6).
-
LMST analysis of Alexa647‐labeled C10‐15 and mTLR2‐Fc Protein with C5 titration (n = 2).
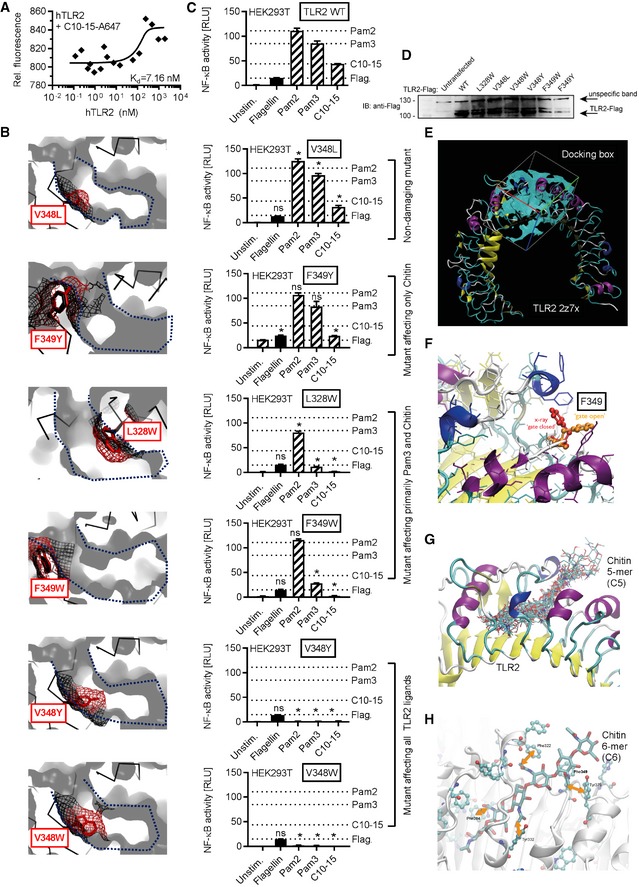
Figure EV4. TLR2 recognition depends on residues in the hydrophobic channel of the TLR2 ectodomain.
-
AMicroscale thermophoresis analysis of Alexa647‐labeled C10‐15 and hTLR2 protein (n = 3).
-
B–DModeling (B), functional NF‐κB activity (C), and expression levels (D) in empty vector (EV) or TLR2‐transfected HEK293T cells (n = 2) for TLR2 WT or point mutants designed to narrow the hydrophobic pocket. In (B), a blue dotted line delineates the hydrophobic pocket, here shown in cross‐section. Black mesh signifies original surface profile in pdb 2z7x, and red mesh the predicted surface of the respective point mutant. In (C), dotted lines signify the levels of NF‐κB activity observed for WT TLR2 for the respective ligand. (D) Expression of TLR2 mutants verified by anti‐Flag immunoblot (n = 1).
-
EDocking grid used for placing of a chitin 5‐mer.
-
FClose‐up on the gatekeeper F349 which restricts access to the cavity in “closed position” (red) but allows access in “open” rotamer position (orange).
-
GDocking poses of a 5‐mer (C5) in the grid specified in e and with F349 in “open” rotamer position.
-
HPotential interactions of chitin 6‐mer (C6) hydrophobic methyl groups with aromatic side chains in the TLR2 hydrophobic cavity.
Crystallographic evidence shows that mycobacterial TLR2 ligands are bound via a hydrophobic TLR2 pocket 32, 33. In silico docking studies (see Materials and Methods) indicated that 5 NAG subunits of chitin, a relatively apolar molecule 6, 38, can be accommodated in the TLR2 hydrophobic pocket (Fig 4E and Movie EV1). Mycobacterial lipopeptide binding and TLR2 activation can be blocked by the S. aureus immune evasion protein staphylococcal superantigen‐like protein 3 (SSL3) 39. Thus, if chitin is bound via the same binding pocket as lipopeptides, SSL3 would be expected to impair chitin TLR2 binding and consequent immune activation (Fig 4F). Indeed, SSL3 decreased C10‐15‐TLR2 binding in a dose‐dependent manner (Fig 4G) and reduced NF‐κB activation in TLR2 HEK293T cells and IL‐8 release from primary neutrophils (Fig 4H and I). Binding of chitin to the hydrophobic pocket was further supported by the comparable effects of the known TLR2 blocking antibody on both chitin and lipopeptides (cf. Figs 2D and 3C), the effect of TLR2 point mutants narrowing the hydrophobic pocket (Fig EV4B–D), and additional molecular modeling (Fig EV4E–H, Movie EV2) in agreement with a computational study of a chitin NAG trimer 40. Thus, chitin‐TLR2 binding appears to involve the free ends of at least 5 NAG long oligomers, which explains why fungal cells, where chitin is polymeric and cross‐linked to other cell wall components, only have limited numbers of accessible TLR2 epitopes (cf. Fig 4C and D). Since chains of only 5 NAGs were not sufficient for signaling (cf. Fig 1C–E), we speculate that NAG subunits protruding from the binding pocket (NAG6+n) are essential for making additional contacts with another TLR2 ECD or TLR1 as co‐receptor, which may lead to receptor dimerization events known to establish TLR2 signaling for other ligands 32, 33. For fungal infections, the effect of S. aureus SSL3 on fungal chitin sensing is noteworthy since co‐infections of S. aureus and pathogenic fungi such as C. albicans frequently occur 41.
Interference with chitin‐TLR2 binding suppresses chitin‐mediated inflammation
Since we identified TLR2 as the direct mediator of inflammatory signaling in response to chitin, we wondered whether blocking chitin‐TLR2 binding might also reduce immune activation and inflammation in the lung in vivo. Application of SSL3 together with C10‐15 indeed significantly reduced both TNF and IL‐6 levels in the BALF of intratracheally treated animals compared to C10‐15 alone (Figs 4J and EV5A). An alternative mode of blocking chitin binding was gleaned from earlier studies in plants 13 and confirmed here, namely that short (< 6) NAG chains reduce immune activation elicited by longer NAG chains (Fig 4K). Based on these and our modeling data (cf. Fig 4E), we speculated that inactive chitin fragments such as C5 are probably too short to bridge receptors to initiate signaling but may nevertheless compete with stimulatory C10‐15 for the TLR2 binding pocket. Indeed, C5 dose‐dependently inhibited the binding of a constant amount of Alexa647‐chitin to TLR2 in MST measurements (Fig 4L), suggestive of a potential inhibitory effect of chitin oligomers of ≤ 5 NAG chain length. In preliminary experiments in THP‐1 cells and primary MoMacs, an inhibitory effect on IL‐6 release was observed when the cells were treated with C5 before the addition of stimulatory C10‐15 (Fig EV5B and C). Collectively, our data indicate that chitin binding to TLR2 is direct and, depending on oligomer size, may promote or even restrict immune activation.
Figure EV5. Size‐dependent immuno‐modulatory effects of oligomeric chitin.
-
ABALF IL‐6 in C57BL/6 mice (n = 4–5/group) upon C10‐15 administration without or with SSL3.
-
B, CIL‐6 release from THP‐1 cells (B) or primary MoMacs (C) without or with C5 (n = 3 or 4).
-
DSchematic representation of size‐dependent recognition of chitin oligomers by TLR2. Through the activity of chitinase or physical fragmentation, a range of different sized fragments and oligomers is generated. TLR2 recognition is possible for both particulate chitin as well as diffusible oligomers. As recognition can occur in a window where both activatory potential and solubility are high, distal recognition of fungal pathogens is possible, while the minimum length required for agonism (6 NAG) ensures that mono‐ or disaccharides are prevented from receptor activation. As activating oligomers are cleaved, soluble fragments with antagonistic properties may arise, representing an inherent negative regulatory loop.
Apart from mechanistic insights, our study makes a firm mechanistic connection between (i) a vast number of non‐mechanistic chitin studies, (ii) chitin‐related pathologies, and (iii) TLR2 as key responsible PRR. Although a lung chitin phenotype for Tlr2 KO was reported before 19, this non‐mechanistic study used crudely purified chitin and left open whether the TLR2‐dependent effects were direct. Since other PRR (e.g., TLR9 or NOD2) were equally proposed as chitin receptors (e.g., 42)—but not confirmed by molecular studies or direct binding—our study now for the first time provides conclusive experimental evidence for TLR2 as a primary chitin immune receptor. TLR2 seems to cooperate with TLR1 in agreement with 43, but possibly an additional receptor contributes to full activation. Our results provide a missing molecular link between fungal infection and the previously observed dependence on TLR2 in murine fungal infection models 7, 44 and, importantly, in patients with the functional rs5743708 (p.753RQ) TLR2 allele 23, 24. Of note, the effect of SSL3 on chitin sensing warrants further analysis in S. aureus/C. albicans co‐infections 41. Based on our in vitro and in vivo results, the SSL3 counter‐strategy, employed by S. aureus to tune down the effect of its TLR2‐activating lipoteichoic acid MAMPs 39, may not only lead to a dampened host response against S. aureus but concomitantly also impair the chitin‐TLR2‐mediated anti‐fungal response.
We here found that TLR2 has a preference for free ends of ≥ 6 NAG, both in the context of the fungal cell wall and for soluble chitin oligomers. Previously proposed concepts, which focused only on the macromolecular (insoluble) range 4, 15, may therefore have to be extended to include oligomers (Fig EV5D). Due to the technical challenge of detecting small fragments in complex mixtures or in vivo, additional experimental evidence for the generation and activity of specific small chitin oligomer will be required to fully assess the physiological relevance of oligomeric chitin. However, it appears highly plausible that human chitinases (Ref. 5, 45 and Fig EV1) would not only create additional free chitin ends in particles or fungal cells required for TLR2 sensing but also soluble, smaller oligomers that could be detected by TLR2 on distal immune cells for anti‐fungal innate and adaptive immune responses. Further chitinase activity may eventually generate antagonistic fragments with ≤ 5 NAGs that may compete with stimulatory fragments as a negative feedback loop to restrict excessive inflammation. MAMP degradation in Drosophila 46 or humans 47 has been seen to only lead to the eventual loss of agonistic ligands; our study points to the possibility that a downstream anti‐inflammatory loop based on small antagonistic MAMP fragments and known only in plants 13 also operates in humans and mice.
From a translational perspective, our study raises the possibility that chitin oligomers could serve as tools for developing therapies in chitin‐mediated inflammatory disease conditions, such as fungal‐ or house‐dust mite‐related asthma and lung fibrosis 9. Efforts in the latter area could now center on chitin‐TLR2 binding and activation as key patho‐biological events, and on developing biologicals (e.g., SSL3‐derivatives or blocking antibodies), short chitin oligomers, or other “chito‐mimetic” TLR2 antagonists structurally resembling short‐chain NAGs to block these steps. Such targeted approaches may bring therapeutic benefit to the vast and growing number of patients suffering from allergic asthma 1 or fungal infections 2.
Materials and Methods
Reagents and antibodies
All chemicals were from Sigma unless otherwise stated. Polymeric crude chitin (“large chitin”) and C4, C5, C6, C7 chitin oligomers, and C10‐15 chitosan oligomers were from Isosep, Elicityl, and Carbosynth, respectively, and originally derived and purified from crab shells. Chitin C10‐15 was generated from chitosan oligomers by acetylation 38 Purities of > 95%, acetylation of > 90% and coupling to Alexa647 were achieved. Further details and all other reagents are described in Appendix.
Plasmid constructs
Plasmids for Flag‐tagged TLR2 and TLR9 were from I. Bekeredjian‐Ding and A. Dalpke (Medical Microbiology, Heidelberg University, Germany). Plasmids expressing human NOD‐2 were from T. Kufer (Hohenheim University, Germany) or for human Dectin‐1 from G. Brown (Aberdeen University, UK). TLR2 hydrophobic pocket mutants were generated using the QuikChange II XL site‐directed mutagenesis kit (Agilent) according to the manufacturer's instructions using primers shown in Appendix Table S1 and verified by automated DNA sequencing (GATC Biotech).
Chitinase assays
Chitinase activity in murine BALF or MoMac cell culture supernatant was determined using colloid chitin azure 48 (Sigma C3020) with Streptomyces griseus chitinase (Sigma C6137) as a control, see Appendix.
Growth and fixation of Candida albicans
Candida albicans SC5314 was grown in synthetic complete media (Formedium SC broth 2% glucose, additionally supplemented with 25 mg/l adenine sulfate) by shaking at 150 rpm at 30°C overnight, fixed by adding paraformaldehyde to 3.7% for 1 h and harvested by centrifugation and washing in sterile Dulbecco's phosphate‐buffered saline (DPBS).
Analysis of TLR2 binding to Candida albicans cells
1 × 10⁶ fixed C. albicans cells were incubated with 1 μM recombinant mouse TLR2 Fc chimera protein or corresponding control human IgG1 Fc overnight. Next day, cells were stained with Alexa594‐conjugated mouse anti‐human IgG (Jackson ImmunoResearch 209‐585‐098), 25 μM calcofluor white, and 50 μg/ml Concanavalin A CF488A (Biotum 20967 and 29016) at room temperature in DPBS. For microscopy, cells were imaged on poly‐L‐lysine‐coated coverslips on a Nikon Eclipse Ti2 system at 100× magnification. Flow cytometry was conducted with a BD LSRFortessa™ system. Further details in Appendix.
Flow cytometric analysis of TLR2 chitin interaction
0.5 μM of Alexa647‐labeled C10‐15 was incubated with 70 nM of recombinant mouse TLR2 Fc chimera protein (R&D 1530‐TR‐050) or a corresponding control IgG1‐Fc in 200 μl DPBS overnight at 4°C, stained with 1:15 diluted human Fcγ‐specific PE‐conjugated F(ab’)₂ fragments (Jackson ImmunoResearch 109‐116‐098), and measured on a BD FACSCanto™ II system with 488‐ and 633‐nm laser excitation for the respective fluorophores. Further details see Appendix.
Microscale thermophoresis analysis of TLR2 chitin interaction
Microscale thermophoresis 34 was conducted with fluorescence‐labeled chitin and recombinant TLR2. In brief, 1:1,000 diluted Alexa647‐labeled C10‐15 chitin (c = 17.7 μM) was mixed 1:1 with twofold serial dilutions of mTLR2‐Fc or hTLR2 (R&D Systems, c = 1150 nM or 1,900 nM maximal concentrations in PBS, see Appendix), incubated in the dark at RT overnight with gentle shaking. Solutions were then transferred to Nanotemper capillaries and measured on a Monolith NT.115 instrument and dataset with the highest ΔF fitted using Nanotemper software.
Dual NF‐κB luciferase assay and immunoblot in HEK293T cells
HEK293T were transfected with 25 ng TLR2 plasmid, 10 ng TLR9 plasmid, 0.25 ng NOD2 plasmid or 50 ng Dectin‐1 plasmid or empty vector (EV) backbone, firefly luciferase under the NF‐κB promoter (100 ng) and constitutive Renilla luciferase reporters (10 ng), stimulated for 18 h with the respective PRR agonists (MDP 200 nM, zymosan 100 μg/ml, CpG, Pam2 or 3, and C10‐15 at 1 μM) and DLA measured. For immunoblot equal protein, lysates in RIPA buffer were run on 8% Tris‐Glycine gels, separated, blotted on nitrocellulose membrane, and probed with anti‐Flag (Sigma F7425) and anti‐rabbit IgG‐HRP (Vector laboratories PI‐1000) using a BlotCycler (Biozym) and a Vilbert Lourmat CCD system for ECL detection. Further details see Appendix.
HEK‐Dual hTLR2 analysis with TLR1, TLR2, and TLR6 blocking antibodies
HEK‐Dual hTLR2 cells (Invivogen) were seeded and incubated for 1 h with TLR1, TLR2, and TLR6 blocking antibodies (Invivogen) or isotype control (4 μg/ml) and stimulated for 24 h with FSL‐1 (1 ng/ml), Pam3 (1 ng/ml), C10‐15 (5 μM). Supernatants were collected and SEAP levels (driven by an NF‐κB promoter) determined using QUANTI‐Blue detection assay (Invivogen). Further details see Appendix.
ELISA
Cytokines were determined in half‐area plates (Greiner Bio‐One) using triplicate points on a standard plate reader. The assay was performed according to the manufacturer's suggestions (BioLegend), using appropriate (1/3–1/20) dilutions of the supernatants.
Respiratory burst (ROS) assay and cytokine analysis from Dectin‐1‐deficient macrophages
Immortalized murine macrophages from CLEC7A KO (Dectin‐1 deficient) and the respective WT mice were originally described 22 and were a kind gift of P. Taylor (Cardiff University, UK). ROS or cytokine release upon PRR agonist addition (C10‐15 and Pam2 at 5 μM and zymosan at 50 μg/ml) was measured as described in Appendix.
THP‐1 cell line analysis
The human monocytic THP‐1 cell line (Invivogen) and two THP‐1‐based TLR2 Cas9‐CRISPR‐edited clones or their parental cell lines (a gift from V. Hornung, Gene Center, Munich, Germany) 21 differentiated with 300 ng/ml PMA overnight were rested for 48 h without PMA and stimulated with C7, C10‐15, Pam2, Pam3 at 5 μM, LPS at 1 μg/ml, or zymosan at 25 μg/ml. For competition experiments, C10‐15 was used at 5 μM and C5 at 0.2, 1, and 5 μM and pre‐incubated for 2 h. qPCR of mRNA induction relative to TBP using gene‐specific TaqMan primers was performed as described in Appendix (ThermoFisher, Appendix Table S2) or ELISAs as described before. TLR2 expression was verified using flow cytometry and immunoblot as detailed in Appendix.
Dimethyl‐labeling of THP‐1 cells and global phosho‐proteome mass spectrometry analysis
THP‐1 cells (Invivogen) were prepared and stimulated as before with PBS, 5 μM C10‐15 or 5 μM Pam2 for 30 min. Dimethyl‐labeling of equal amounts of lysate, sample workup, MS acquisition, peak annotation, and database searches was done as described in Appendix. Data were deposited in the PRIDE database (identifier PXD007542).
Human study subjects and sample acquisition
All healthy blood donors included in the analyses of immune cells for this study provided their written informed consent before study inclusion. Approval for use of their biomaterials was obtained by the local ethics committee at the University of Tübingen, in accordance with the principles laid down in the Declaration of Helsinki. Whole blood samples from voluntary healthy donors were obtained at the University of Tübingen, Department of Immunology. Immune cells were also acquired from leucocyte concentrates obtained from blood donations processed at the Center for Clinical Transfusion Medicine (ZKT) at the University Hospital Tübingen.
Mice
Myd88 and Tlr2 KO mice (both on a C57BL/6 background, originally a gift from H. Wagner, Ludwigs‐Maximilian University, Munich) and C3H/HEJ (Tlr4 LpsD, Jackson) were used between 8 and 20 weeks of age in accordance with local institutional guidelines on animal experiments and under specific locally approved protocols for sacrificing and in vivo work. All mouse colonies were maintained in line with local regulatory guidelines and hygiene monitoring.
Isolation and analysis of primary human monocyte‐derived macrophages
Primary monocytes were isolated from heparinized whole blood (Department of Immunology) using standard Ficoll density gradient purification and anti‐CD14 magnetic bead positive selection (Miltenyi Biotec, > 90% purity assessed by anti‐CD14‐PE flow cytometry). For macrophage differentiation, cells were grown with GM‐CSF (Prepro Tech) for 6 days, re‐seeded, and treated with LPS (100 ng/ml), C10‐15, Pam2, and Pam3 (all 5 μM), and R848 (5 μg/ml). For competition experiments, C10‐15 was used at 5 μM and C5 at 0.2 μM pre‐incubated for 2 h. For electron microscopy (performed by J. Berger, Max‐Planck‐Institute, Tübingen, Germany), cells were seeded on poly‐L‐lysine‐treated coverslips in 24‐well plates. Specimen preparation and EM analysis were done according to standard procedures. For RNAi experiments, MoMacs were transfected with 35 nM of corresponding siRNA (see Appendix Table S3, GE Dharmacon) using Viromer Blue (Biozol) on day 5 of GM‐CSF differentiation. On day 6, cells were stimulated and supernatants harvested on day 7. Further details see Appendix.
Isolation and analysis of primary human neutrophils
Primary neutrophils were isolated by Ficoll density gradient purification using ammonium chloride erythrocyte lysis to > 97% purity and no signs of pre‐activation. Where appropriate, the cells were pre‐treated with a purified anti‐mouse/human anti‐CD282 (TLR2) Ab (BioLegend 121802, 49), a Sigma anti‐HA (H9658) isotype control or SSL3 for 30 min and subsequently stimulated with the PRR agonists C10‐15 (5 μM), PMA (500 ng/ml), LPS (200 ng/ml), Pam2 and Pam3 (0.5 or 5 μM), zymosan and zymosan depleted (both 25 μg/ml) for 1 h (CD62L shedding using anti‐CD62L‐BV421) or 4 h (IL‐8 ELISA). For ROS analysis, cells were incubated with stimuli together with DCF at 10 μg/ml and fluorescence measured continuously for 3 h. Further details see Appendix.
Human whole‐blood microarray and qPCR analyses
For whole‐blood assays, 1 ml freshly drawn heparinized blood was aliquoted and stimulated for 3 h. Subsequently, plasma was removed and erythrocyte lysis performed. The remaining cells were frozen at −80°C in RLT buffer for RNA isolation (QIAamp RNA Blood Mini Kit, Qiagen), genomic DNA digestion (Turbo DNA‐free Kit, ThermoFisher), reverse transcription to cDNA (High Capacity RNA‐to‐cDNA Kit; ThermoFisher), and analysis by qPCR using gene‐specific TaqMan Primers (Thermo, see Appendix Table S2) or microarray (Illumina HumanHT‐12 v4.0 Expression BeadChip Kit on an Illumina HiScan array scanner) as described in Appendix. Data were deposited in the Gene Expression Omnibus (GEO) repository (identifier GSE103094).
Isolation and analysis of mouse bone marrow‐derived macrophages (BMDM)
Mice were sacrificed, femurs and tibia were then opened, and bone marrow (BM) cells were flushed out, passed through a 0.22‐μM strainer, and differentiated with GM‐CSF for 6 days. The resulting BMDMs were seeded in 96‐well plates, and TNF and/or IL‐6 levels were measured after 18‐h incubation with the following stimuli: C5 (5 μM), C6 (5 μM), C7 (5 μM), C10‐15 (5 μM), LPS (1 μg/ml), poly(I:C) (20 μg/ml), Pam2 (5 μM), Pam3 (5 μM), zymosan and zymosan “depleted” (both 10 μg/ml). For measuring ROS activity, 7.5 × 10⁴ cells were seeded and assayed as described above for WT and Clec7a‐deficient immortalized macrophages.
In vivo dermal inflammation analysis
For female LysM‐EGFP mice expressing EGFP in myeloid cells 50, the dorsal backs were shaved under 2% isoflurane, injected intradermally (i.d.) with chitin oligomers C10‐15, C7, and C5 at 5 μM concentration in PBS, 1 mg/kg LPS or PBS alone, and imaged in vivo on a Lumina III IVIS (PerkinElmer) as described in Appendix. Ten‐millimeter‐punch biopsies were also taken from the injection site at 3 days after treatment, weighed, and then homogenized in protein lysis buffer for myeloperoxidase assays (MPO; R&D Systems).
In vivo lung inflammation analysis
WT and Tlr2 KO mice were anesthetized using ketamine‐xylazine solution, and a vertical cut was made on the neck to expose trachea to instill 30 μl of 1 mM chitin oligomers using a Hamilton syringe. For competition experiments with SSL3, 25 μl of an endotoxin‐free 50 μg/ml (2.6 mM) of SSL3 solution was first instilled into the trachea followed by instillation of 30 μl of a 1 mM C10‐15 solution. The wound was afterward sealed using Vetbond tissue adhesive. Mice were euthanized 12 h post‐instillation of chitin to harvest BALF. Lung tissues were inflated at 1 atm pressure with 0.5% low melting point agar and fixed using formalin. Lung sections were embedded, and sections were stained with hematoxylin and eosin to assess leukocyte infiltration. BALF was centrifuged, and cell‐free supernatant was stored at −80°C for cytokine analysis by triplicate ELISA (R&D Systems). The cell pellet was resuspended in PBS, and cells were counted using a Coulter counter or inspected by light microscopy. BALFs for chitinase activity measurements were prepared as described before 51 and in Appendix.
Arabidopsis thaliana analyses
Arabidopsis (Arabidopsis thaliana Col‐0) plants or seedlings were grown as described 52. ROS measurements and qPCR were performed as described 52, 53 in 1 × 4 mm leaf pieces of 5‐week‐old Arabidopsis plants floated overnight in water, placed in a 96‐well plate (two pieces/well) containing 90 μl of the reaction mix (final concentration in 100 μl: 20 μM Luminol L‐012, Wako Chemicals, USA, 5 μg/ml horseradish peroxidase, AppliChem, Germany). Before measurement, samples were stimulated with 10 μl of chitin oligomers by adding them to the reaction mix. Further details are described in Appendix.
In silico docking and molecular modeling of TLR2–chitin interactions
The human TLR2 receptor PDB entry 2z7x 32 was used to generate input files for AutoDOCK 3.05 (126 × 64 × 64 grid points, resolution = 0.375 Å) and Autodock Vina (48 × 24 × 24 Å) 54 using AutoDockTools 55. MD simulations were performed in explicit solvent for 50 ns at 310 K using YASARA 56. The MD trajectories were analyzed using Conformational Analysis Tools (http://www.md-simulations.de/CAT/). The TLR2‐SSL3‐inhibited structure corresponds to PDB entry 5d3i 39. Structures were inspected and figures and movies generated using VMD and Pymol 1.4.1. (Schrödinger). Further details are given in Appendix.
Statistical analysis
Experimental data were analyzed using Excel 2010 (Microsoft) and/or GraphPad Prism 6 or 7 (GraphPad Software, Inc.), microscopy data with ImageJ and Fiji, flow cytometry data using FlowJo software version 10. P‐values were determined (α = 0.05, β = 0.8) as indicated. P < 0.05 were generally considered statistically significant and are denoted by * throughout even if calculated P‐values were considerably lower than P = 0.05.
Author contributions
KF, YCG, O‐OW, FH, LS, CD, CT, SD, T‐MD, ZB, AS, DaH, MAS, KJK, TS, MK, CG, TR, DLR, NAS, MF, and SL‐L performed experiments; KF, YCG, O‐OW, FH, LS, CD, SD, T‐MD, ZB, AS, MAS, TS, MK, CT, NAS, FF, CG, BM, LM, TN, SL‐L, AAG, CSDC, and AW analyzed data; DoH and ANRW wrote the manuscript which all other authors commented on; AW conceived and coordinated the study.
Conflict of interest
KF, CG and AW are listed as inventors on two German patents. MF is an employee of Biognos AB, Göteborg, Sweden, and DH is an employee of Hoffmann La Roche, Basel, Switzerland. None of the other authors declares a conflict of interest.
Supporting information
Appendix
Expanded View Figures PDF
Table EV1
Dataset EV1
Dataset EV2
Movie EV1
Movie EV2
Code EV1
Review Process File
Acknowledgements
This work was supported by the Wilhelm Schuler Stiftung, the University of Tübingen Medical Faculty, the University of Tübingen Graduate College “Of Plants and Men”, the Deutsche Forschungsgemeinschaft (DFG)‐funded CRC 685 “Immunotherapy”, the CRC/TR 156 “The skin as a sensor & effector organ orchestrating local & systemic immune responses”, the project grant We‐4195/14‐1, the Federal State Baden‐Württemberg Program “Glycobiology” (all to A.W.), the NIH grant HL126094 (to C.D.C), and the Swiss National Science Foundation (SNSF) grant #173123 (to T.R.). The work was also funded in part by the grant R01AR069502 (to L.M.) from the US National Institutes of Health. We thank Magno Delmiro Garcia, Johanna Bödder, Elisa Rusch, Timo Manz, Jennifer Ewald, Stefan Stevanović, Paul Vogel, Patrick Müller, Markus Löffler, P. Anoop Chandran, Sascha Venturelli, Christoph Mayer, Jürgen Berger, Hubert Kalbacher, Martin Schaller, Beate Pömmerl, David Voehringer, Luigina Romani, Louris Feitsma, Eric Huizinga, Uffe Holmskov, and Luke O'Neill for technical assistance, provision of reagents, critical reading of the manuscript, and/or other very helpful comments.
EMBO Reports (2018) 19: e46065
References
- 1. To T, Stanojevic S, Moores G, Gershon AS, Bateman ED, Cruz AA, Boulet LP (2012) Global asthma prevalence in adults: findings from the cross‐sectional world health survey. BMC Public Health 12: 204 [DOI] [PMC free article] [PubMed] [Google Scholar]
- 2. Brown GD, Denning DW, Gow NA, Levitz SM, Netea MG, White TC (2012) Hidden killers: human fungal infections. Sci Transl Med 4: 165rv13 [DOI] [PubMed] [Google Scholar]
- 3. Morgulis S (1916) The chemical constitution of chitin. Science 44: 866–867 [DOI] [PubMed] [Google Scholar]
- 4. Lee CG, Da Silva CA, Lee JY, Hartl D, Elias JA (2008) Chitin regulation of immune responses: an old molecule with new roles. Curr Opin Immunol 20: 684–689 [DOI] [PMC free article] [PubMed] [Google Scholar]
- 5. Mack I, Hector A, Ballbach M, Kohlhaufl J, Fuchs KJ, Weber A, Mall MA, Hartl D (2015) The role of chitin, chitinases, and chitinase‐like proteins in pediatric lung diseases. Mol Cell Pediatr 2: 3 [DOI] [PMC free article] [PubMed] [Google Scholar]
- 6. Bueter CL, Specht CA, Levitz SM (2013) Innate sensing of chitin and chitosan. PLoS Pathog 9: e1003080 [DOI] [PMC free article] [PubMed] [Google Scholar]
- 7. Cunha C, Romani L, Carvalho A (2010) Cracking the toll‐like receptor code in fungal infections. Expert Rev Anti Infect Ther 8: 1121–1137 [DOI] [PubMed] [Google Scholar]
- 8. Choi JP, Lee SM, Choi HI, Kim MH, Jeon SG, Jang MH, Jee YK, Yang S, Cho YJ, Kim YK (2016) House dust mite‐derived chitin enhances Th2 cell response to inhaled allergens, mainly via a TNF‐alpha‐dependent pathway. Allergy Asthma Immunol Res 8: 362–374 [DOI] [PMC free article] [PubMed] [Google Scholar]
- 9. Van Dyken SJ, Liang HE, Naikawadi RP, Woodruff PG, Wolters PJ, Erle DJ, Locksley RM (2017) Spontaneous chitin accumulation in airways and age‐related fibrotic lung disease. Cell 169: 497–509 e13 [DOI] [PMC free article] [PubMed] [Google Scholar]
- 10. Kawasaki T, Kawai T (2014) Toll‐like receptor signaling pathways. Front Immunol 5: 461 [DOI] [PMC free article] [PubMed] [Google Scholar]
- 11. Hoving JC, Wilson GJ, Brown GD (2014) Signalling C‐type lectin receptors, microbial recognition and immunity. Cell Microbiol 16: 185–194 [DOI] [PMC free article] [PubMed] [Google Scholar]
- 12. Jones JD, Dangl JL (2006) The plant immune system. Nature 444: 323–329 [DOI] [PubMed] [Google Scholar]
- 13. Liu T, Liu Z, Song C, Hu Y, Han Z, She J, Fan F, Wang J, Jin C, Chang J et al (2012) Chitin‐induced dimerization activates a plant immune receptor. Science 336: 1160–1164 [DOI] [PubMed] [Google Scholar]
- 14. Hayafune M, Berisio R, Marchetti R, Silipo A, Kayama M, Desaki Y, Arima S, Squeglia F, Ruggiero A, Tokuyasu K et al (2014) Chitin‐induced activation of immune signaling by the rice receptor CEBiP relies on a unique sandwich‐type dimerization. Proc Natl Acad Sci USA 111: E404–E413 [DOI] [PMC free article] [PubMed] [Google Scholar]
- 15. Da Silva CA, Chalouni C, Williams A, Hartl D, Lee CG, Elias JA (2009) Chitin is a size‐dependent regulator of macrophage TNF and IL‐10 production. J Immunol 182: 3573–3582 [DOI] [PubMed] [Google Scholar]
- 16. Alvarez FJ (2014) The effect of chitin size, shape, source and purification method on immune recognition. Molecules 19: 4433–4451 [DOI] [PMC free article] [PubMed] [Google Scholar]
- 17. Schlosser A, Thomsen T, Moeller JB, Nielsen O, Tornoe I, Mollenhauer J, Moestrup SK, Holmskov U (2009) Characterization of FIBCD1 as an acetyl group‐binding receptor that binds chitin. J Immunol 183: 3800–3809 [DOI] [PubMed] [Google Scholar]
- 18. Koller B, Muller‐Wiefel AS, Rupec R, Korting HC, Ruzicka T (2011) Chitin modulates innate immune responses of keratinocytes. PLoS ONE 6: e16594 [DOI] [PMC free article] [PubMed] [Google Scholar]
- 19. Da Silva CA, Hartl D, Liu W, Lee CG, Elias JA (2008) TLR‐2 and IL‐17A in chitin‐induced macrophage activation and acute inflammation. J Immunol 181: 4279–4286 [DOI] [PMC free article] [PubMed] [Google Scholar]
- 20. Meng G, Rutz M, Schiemann M, Metzger J, Grabiec A, Schwandner R, Luppa PB, Ebel F, Busch DH, Bauer S et al (2004) Antagonistic antibody prevents toll‐like receptor 2‐driven lethal shock‐like syndromes. J Clin Invest 113: 1473–1481 [DOI] [PMC free article] [PubMed] [Google Scholar]
- 21. Schmid‐Burgk JL, Schmidt T, Gaidt MM, Pelka K, Latz E, Ebert TS, Hornung V (2014) OutKnocker: a web tool for rapid and simple genotyping of designer nuclease edited cell lines. Genome Res 24: 1719–1723 [DOI] [PMC free article] [PubMed] [Google Scholar]
- 22. Rosas M, Liddiard K, Kimberg M, Faro‐Trindade I, McDonald JU, Williams DL, Brown GD, Taylor PR (2008) The induction of inflammation by dectin‐1 in vivo is dependent on myeloid cell programming and the progression of phagocytosis. J Immunol 181: 3549–3557 [DOI] [PubMed] [Google Scholar]
- 23. Fischer M, Spies‐Weisshart B, Schrenk K, Gruhn B, Wittig S, Glaser A, Hochhaus A, Scholl S, Schnetzke U (2016) Polymorphisms of dectin‐1 and TLR2 predispose to invasive fungal disease in patients with acute myeloid leukemia. PLoS ONE 11: e0150632 [DOI] [PMC free article] [PubMed] [Google Scholar]
- 24. Woehrle T, Du W, Goetz A, Hsu HY, Joos TO, Weiss M, Bauer U, Brueckner UB, Marion Schneider E (2008) Pathogen specific cytokine release reveals an effect of TLR2 Arg753Gln during Candida sepsis in humans. Cytokine 41: 322–329 [DOI] [PubMed] [Google Scholar]
- 25. Netea MG, Sutmuller R, Hermann C, Van der Graaf CA, Van der Meer JW, van Krieken JH, Hartung T, Adema G, Kullberg BJ (2004) Toll‐like receptor 2 suppresses immunity against Candida albicans through induction of IL‐10 and regulatory T cells. J Immunol 172: 3712–3718 [DOI] [PubMed] [Google Scholar]
- 26. Gantner BN, Simmons RM, Canavera SJ, Akira S, Underhill DM (2003) Collaborative induction of inflammatory responses by dectin‐1 and Toll‐like receptor 2. J Exp Med 197: 1107–1117 [DOI] [PMC free article] [PubMed] [Google Scholar]
- 27. No HK, Cho YI, Kim HR, Meyers SP (2000) Effective deacetylation of chitin under conditions of 15 psi/121 degrees C. J Agric Food Chem 48: 2625–2627 [DOI] [PubMed] [Google Scholar]
- 28. Di Carlo FJ, Fiore JV (1958) On the composition of zymosan. Science 127: 756–757 [DOI] [PubMed] [Google Scholar]
- 29. Weintz G, Olsen JV, Fruhauf K, Niedzielska M, Amit I, Jantsch J, Mages J, Frech C, Dolken L, Mann M et al (2010) The phosphoproteome of toll‐like receptor‐activated macrophages. Mol Syst Biol 6: 371 [DOI] [PMC free article] [PubMed] [Google Scholar]
- 30. Colak E, Leslie A, Zausmer K, Khatamzas E, Kubarenko AV, Pichulik T, Klimosch SN, Mayer A, Siggs O, Hector A et al (2014) RNA and imidazoquinolines are sensed by distinct TLR7/8 ectodomain sites resulting in functionally disparate signaling events. J Immunol 192: 5963–5973 [DOI] [PMC free article] [PubMed] [Google Scholar]
- 31. Pieterse E, Rother N, Yanginlar C, Hilbrands LB, van der Vlag J (2016) Neutrophils discriminate between lipopolysaccharides of different bacterial sources and selectively release neutrophil extracellular traps. Front Immunol 7: 484 [DOI] [PMC free article] [PubMed] [Google Scholar]
- 32. Jin MS, Kim SE, Heo JY, Lee ME, Kim HM, Paik SG, Lee H, Lee JO (2007) Crystal structure of the TLR1‐TLR2 heterodimer induced by binding of a tri‐acylated lipopeptide. Cell 130: 1071–1082 [DOI] [PubMed] [Google Scholar]
- 33. Kang JY, Nan X, Jin MS, Youn SJ, Ryu YH, Mah S, Han SH, Lee H, Paik SG, Lee JO (2009) Recognition of lipopeptide patterns by Toll‐like receptor 2‐Toll‐like receptor 6 heterodimer. Immunity 31: 873–884 [DOI] [PubMed] [Google Scholar]
- 34. Jerabek‐Willemsen M, Wienken CJ, Braun D, Baaske P, Duhr S (2011) Molecular interaction studies using microscale thermophoresis. Assay Drug Dev Technol 9: 342–353 [DOI] [PMC free article] [PubMed] [Google Scholar]
- 35. Jimenez‐Dalmaroni MJ, Radcliffe CM, Harvey DJ, Wormald MR, Verdino P, Ainge GD, Larsen DS, Painter GF, Ulevitch R, Beutler B et al (2015) Soluble human TLR2 ectodomain binds diacylglycerol from microbial lipopeptides and glycolipids. Innate Immun 21: 175–193 [DOI] [PMC free article] [PubMed] [Google Scholar]
- 36. Gow NAR, Latge JP, Munro CA (2017) The fungal cell wall: structure, biosynthesis, and function. Microbiol Spectr 5: 267–292 [DOI] [PMC free article] [PubMed] [Google Scholar]
- 37. Marakalala MJ, Vautier S, Potrykus J, Walker LA, Shepardson KM, Hopke A, Mora‐Montes HM, Kerrigan A, Netea MG, Murray GI et al (2013) Differential adaptation of Candida albicans in vivo modulates immune recognition by dectin‐1. PLoS Pathog 9: e1003315 [DOI] [PMC free article] [PubMed] [Google Scholar]
- 38. Bueter CL, Lee CK, Rathinam VA, Healy GJ, Taron CH, Specht CA, Levitz SM (2011) Chitosan but not chitin activates the inflammasome by a mechanism dependent upon phagocytosis. J Biol Chem 286: 35447–35455 [DOI] [PMC free article] [PubMed] [Google Scholar]
- 39. Koymans KJ, Feitsma LJ, Brondijk TH, Aerts PC, Lukkien E, Lossl P, van Kessel KP, de Haas CJ, van Strijp JA, Huizinga EG (2015) Structural basis for inhibition of TLR2 by staphylococcal superantigen‐like protein 3 (SSL3). Proc Natl Acad Sci USA 112: 11018–11023 [DOI] [PMC free article] [PubMed] [Google Scholar]
- 40. Shen PC, Li WW, Wang Y, He X, He LQ (2016) Binding mode of chitin and TLR2 via molecular docking and dynamics simulation. Mol Simulat 42: 936–941 [Google Scholar]
- 41. Morales DK, Hogan DA (2010) Candida albicans interactions with bacteria in the context of human health and disease. PLoS Pathog 6: e1000886 [DOI] [PMC free article] [PubMed] [Google Scholar]
- 42. Wagener J, Malireddi RK, Lenardon MD, Koberle M, Vautier S, MacCallum DM, Biedermann T, Schaller M, Netea MG, Kanneganti TD et al (2014) Fungal chitin dampens inflammation through IL‐10 induction mediated by NOD2 and TLR9 activation. PLoS Pathog 10: e1004050 [DOI] [PMC free article] [PubMed] [Google Scholar]
- 43. Davis S, Cirone AM, Menzie J, Russell F, Dorey CK, Shibata Y, Wei J, Nan C (2018) Phagocytosis‐mediated M1 activation by chitin but not by chitosan. Am J Physiol Cell Physiol 315: C62–C72 [DOI] [PMC free article] [PubMed] [Google Scholar]
- 44. Goodridge HS, Underhill DM (2008) Fungal recognition by TLR2 and dectin‐1. Handb Exp Pharmacol 183: 87–109 [DOI] [PubMed] [Google Scholar]
- 45. Stockinger LW, Eide KB, Dybvik AI, Sletta H, Varum KM, Eijsink VG, Tondervik A, Sorlie M (2015) The effect of the carbohydrate binding module on substrate degradation by the human chitotriosidase. Biochim Biophys Acta 1854: 1494–1501 [DOI] [PubMed] [Google Scholar]
- 46. Wang L, Weber AN, Atilano ML, Filipe SR, Gay NJ, Ligoxygakis P (2006) Sensing of Gram‐positive bacteria in Drosophila: GNBP1 is needed to process and present peptidoglycan to PGRP‐SA. EMBO J 25: 5005–5014 [DOI] [PMC free article] [PubMed] [Google Scholar]
- 47. Scheibner KA, Lutz MA, Boodoo S, Fenton MJ, Powell JD, Horton MR (2006) Hyaluronan fragments act as an endogenous danger signal by engaging TLR2. J Immunol 177: 1272–1281 [DOI] [PubMed] [Google Scholar]
- 48. Shen CR, Chen YS, Yang CJ, Chen JK, Liu CL (2010) Colloid chitin azure is a dispersible, low‐cost substrate for chitinase measurements in a sensitive, fast, reproducible assay. J Biomol Screen 15: 213–217 [DOI] [PubMed] [Google Scholar]
- 49. Meng G, Grabiec A, Vallon M, Ebe B, Hampel S, Bessler W, Wagner H, Kirschning CJ (2003) Cellular recognition of tri‐/di‐palmitoylated peptides is independent from a domain encompassing the N‐terminal seven leucine‐rich repeat (LRR)/LRR‐like motifs of TLR2. J Biol Chem 278: 39822–39829 [DOI] [PubMed] [Google Scholar]
- 50. Cho JS, Guo Y, Ramos RI, Hebroni F, Plaisier SB, Xuan C, Granick JL, Matsushima H, Takashima A, Iwakura Y et al (2012) Neutrophil‐derived IL‐1beta is sufficient for abscess formation in immunity against Staphylococcus aureus in mice. PLoS Pathog 8: e1003047 [DOI] [PMC free article] [PubMed] [Google Scholar]
- 51. Mays LE, Ammon‐Treiber S, Mothes B, Alkhaled M, Rottenberger J, Muller‐Hermelink ES, Grimm M, Mezger M, Beer‐Hammer S, von Stebut E et al (2013) Modified Foxp3 mRNA protects against asthma through an IL‐10‐dependent mechanism. J Clin Invest 123: 1216–1228 [DOI] [PMC free article] [PubMed] [Google Scholar]
- 52. Brock AK, Willmann R, Kolb D, Grefen L, Lajunen HM, Bethke G, Lee J, Nurnberger T, Gust AA (2010) The Arabidopsis mitogen‐activated protein kinase phosphatase PP2C5 affects seed germination, stomatal aperture, and abscisic acid‐inducible gene expression. Plant Physiol 153: 1098–1111 [DOI] [PMC free article] [PubMed] [Google Scholar]
- 53. Albert M, Furst U (2017) Quantitative detection of oxidative burst upon activation of plant receptor kinases. Methods Mol Biol 1621: 69–76 [DOI] [PubMed] [Google Scholar]
- 54. Trott O, Olson AJ (2010) AutoDock Vina: improving the speed and accuracy of docking with a new scoring function, efficient optimization, and multithreading. J Comput Chem 31: 455–461 [DOI] [PMC free article] [PubMed] [Google Scholar]
- 55. Morris GM, Huey R, Lindstrom W, Sanner MF, Belew RK, Goodsell DS, Olson AJ (2009) AutoDock4 and AutoDockTools4: automated docking with selective receptor flexibility. J Comput Chem 30: 2785–2791 [DOI] [PMC free article] [PubMed] [Google Scholar]
- 56. Krieger E, Vriend G (2015) New ways to boost molecular dynamics simulations. J Comput Chem 36: 996–1007 [DOI] [PMC free article] [PubMed] [Google Scholar]
Associated Data
This section collects any data citations, data availability statements, or supplementary materials included in this article.
Supplementary Materials
Appendix
Expanded View Figures PDF
Table EV1
Dataset EV1
Dataset EV2
Movie EV1
Movie EV2
Code EV1
Review Process File