

Abstract
Parkin‐mediated mitophagy is a quality control pathway that selectively removes damaged mitochondria via the autophagic machinery. Autophagic receptors, which interact with ubiquitin and Atg8 family proteins, contribute to the recognition of damaged mitochondria by autophagosomes. NDP52, an autophagy receptor, is required for autophagic engulfment of damaged mitochondria during mitochondrial uncoupler treatment. The N‐terminal SKICH domain and C‐terminal zinc finger motif of NDP52 are both required for its function in mitophagy. While the zinc finger motif contributes to poly‐ubiquitin binding, the function of the SKICH domain remains unclear. Here, we show that NDP52 interacts with mitochondrial RNA poly(A) polymerase (MTPAP) via the SKICH domain. During mitophagy, NDP52 invades depolarized mitochondria and interacts with MTPAP dependent on the proteasome but independent of ubiquitin binding. Loss of MTPAP reduces NDP52‐mediated mitophagy, and the NDP52–MTPAP complex attracts more LC3 than NDP52 alone. These results indicate that NDP52 and MTPAP form an autophagy receptor complex, which enhances autophagic elimination of damaged mitochondria.
Keywords: mitophagy, MTPAP, NDP52, Parkin, SKICH domain
Subject Categories: Autophagy & Cell Death
Introduction
Macroautophagy (hereafter referred to as autophagy) is an evolutionarily conserved dynamic membrane process in which cytoplasmic components including macromolecules and organelles are sequestered into double membrane structures called autophagosomes and delivered to lysosomes for degradation 1, 2. Traditionally, autophagy has been considered to be a nonselective bulk process; however, accumulating evidences show that some of cytosolic components, including protein aggregates, dysfunctional organelles, and invading pathogens, are eliminated selectively by autophagy. Mitochondrial autophagy (mitophagy) is a mitochondrial quality control mechanism that selectively engulfs damaged mitochondria within autophagosomes (mitophagosomes) for degradation in lysosomes 1, 3. Numerous clinical and animal studies indicate that mitochondrial dysfunction is involved in many processes and diseases, including aging, cancer, diabetes, and neurodegenerative diseases 4, 5, 6, 7, 8. Mitochondrial quality control via mitophagy assumes an important role to maintain cellular homeostasis.
Parkin‐mediated mitophagy is one of the best‐characterized mechanisms of mitophagy in mammalian cells 3. In damaged mitochondria, e.g., mitochondria with loss of membrane potential, under genetic or environmental stresses, or with unfolded protein accumulation, the protease activity of presenilin‐associated rhomboid‐like (PARL), which mediates cleavage of a mitochondrial Ser/Thr kinase, PTEN‐induced putative kinase 1 (PINK1), is reduced. This stabilizes PINK1, which then phosphorylates the E3 ubiquitin ligase, Parkin, and ubiquitin at S65 9, 10, 11, 12. Activated Parkin is recruited to damaged mitochondria and ubiquitylates outer mitochondrial membrane (OMM) proteins. Phosphorylated ubiquitin also activates Parkin E3 ligase activity 10, 11, 12, and this feed‐forward loop initiates Parkin‐mediated mitophagy. Following ubiquitylation of OMM proteins by Parkin, damaged mitochondria are selectively engulfed by autophagosomes. Autophagy adaptor/receptor proteins containing both ubiquitin binding domains and microtubule‐associated proteins 1A/1B light chain 3 (LC3)‐interacting region (LIR) motifs, which bind to both ubiquitin and the autophagy‐related protein 8 (Atg8) family (LC3 and GABARAP subfamily) proteins, contribute to recognition of ubiquitylated cargo in selective autophagy 13. Two autophagy receptors linked to xenophagy, optineurin (OPTN) and nuclear domain 10 protein 52 (NDP52, also known as CALCOCO2), are primary adapters for Parkin‐mediated mitophagy 14. These proteins are involved in recruitment of autophagy factors and/or activation of TANK‐binding kinase 1 (TBK1) 14, 15.
Nuclear domain 10 protein 52 plays a role in the clearance of the ubiquitin‐coated bacteria as a xenophagy receptor 16. NDP52 selectively binds with LC3C via a noncanonical LIR (CLIR) motif and has no or very weak affinity for other members of the Atg8 family 17. During Salmonella infection, NDP52 promotes activation of autophagy by binding with galectin 8, a protein that accumulates on vacuoles containing bacteria. NDP52 also promotes maturation of bacteria‐containing autophagosome 18, 19. While NDP52 plays multiple roles in xenophagy, the role of NDP52 in mitophagy is not clear.
Here, we report that NDP52 functions as a mitophagy receptor by interacting with mitochondrial RNA poly(A) polymerase (MTPAP; also known as PAPD1 or TUTase1) via its N‐terminal SKICH domain and that this interaction is required for efficient autophagic engulfment of depolarized mitochondria. Our findings reveal a novel mechanism for recognition of damaged mitochondria by the autophagic membrane.
Results
NDP52 localizes to damaged mitochondria and is degraded by autophagy
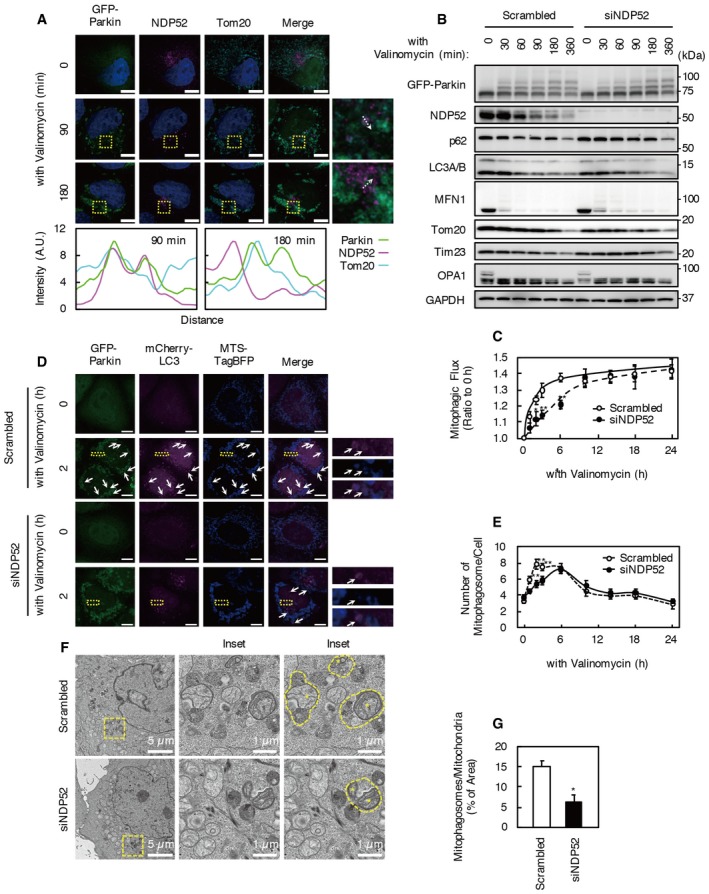
To assess the involvement of NDP52 in mitophagy, we incubated HeLa cells stably expressing GFP‐Parkin (HeLa‐GFP‐Parkin cells) with valinomycin, a mitochondrial uncoupler. In HeLa‐GFP‐Parkin cells, Parkin activity can be monitored by ubiquitylation of an N‐terminal GFP‐tag as a pseudo‐substrate 20. In untreated cells, endogenous NDP52 predominantly localized to the perinuclear region (Fig 1A). In cells incubated with valinomycin for 90 min, a portion of NDP52 colocalized with GFP‐Parkin localized at mitochondria. However, colocalization of NDP52 with Parkin localized at mitochondria was reduced in cells treated with valinomycin for 180 min. The majority of NDP52 was degraded after incubation with valinomycin for 3 h while minimal degradation occurred to the remaining NDP52 after incubation with valinomycin for 6–24 h (Fig EV1A). In valinomycin‐treated cells, degradation of NDP52 was inhibited by bafilomycin A1, a specific vacuolar ATPase inhibitor, and not by epoxomicin, a specific proteasome inhibitor (Fig EV1B). These results indicate that NDP52 is degraded soon (within 3 h) after valinomycin treatment. In addition, degradation of a large proportion of mitochondrial proteins was strongly activated in the same period. Therefore, to clarify the role of NDP52 in Parkin‐mediated mitophagy, we focused on the contribution of NDP52 in the early mitophagy period.
Figure 1. Mitophagosome formation is reduced by NDP52 knockdown.
-
AHeLa cells stably expressing GFP‐Parkin (HeLa‐GFP‐Parkin cells) were treated with 1 μM valinomycin and immunostained with anti‐NDP52 and anti‐Tom20 antibodies. Boxed areas in the images are shown in the next panels on the right. Colocalization of GFP‐Parkin, NDP52, and Tom20 was determined using Line Scan. Fluorescence intensities of each channel were measured along the dotted white arrow. Scale bars, 10 μm. Images are representative of three independent experiments.
-
BHeLa‐GFP‐Parkin cells were transfected with siNDP52 or scrambled siRNA. Seventy‐two hours after transfection, cells were incubated with 1 μM valinomycin for the indicated times. Western blotting was performed using the indicated antibodies. Data are representative of three independent experiments.
-
CMitophagy flux assay using Mtphagy dye. Increase in Mtphagy dye fluorescence intensity indicates the recruitment of mitochondria to lysosomes during valinomycin treatment. Results are a summary of three independent experiments. Values are the means ± SEM. *P < 0.05, **P < 0.01 compared with scrambled oligo‐treated cells, determined with one‐way ANOVA followed by the Student's t‐test.
-
DFluorescence images of NDP52 KD and control cells expressing mCherry‐LC3 and MTS‐TagBFP. Arrows indicate mCherry‐LC3 puncta colocalized with MTS‐TagBFP. Scale bars, 10 μm. Boxed areas in images are shown in the next panels on the right. Images are representative of four independent experiments.
-
EThe number of mCherry‐LC3 puncta colocalized with MTS‐TagBFP (representing mitophagosomes) per cell was counted. Results were from at least six microscopic fields of three independent experiments. Values are the means ± SEM. **P < 0.01 compared with scrambled oligo‐treated cells, determined with one‐way ANOVA followed by the Student's t‐test.
-
F, GElectron micrographs of NDP52 KD and control cells. Asterisks indicate mitochondria sequestered by autophagosomes (mitophagosomes, yellow dotted line). The ratios of mitophagosomes per mitochondrial area are shown in (G). Ten cells from three independent experiments were counted. Values are the means ± SD. *P < 0.05 compared with scrambled oligo‐treated cells, determined with one‐way ANOVA followed by the Student's t‐test.
Source data are available online for this figure.
Figure EV1. Effect of valinomycin treatment on the levels of NDP52 and mitochondrial proteins.
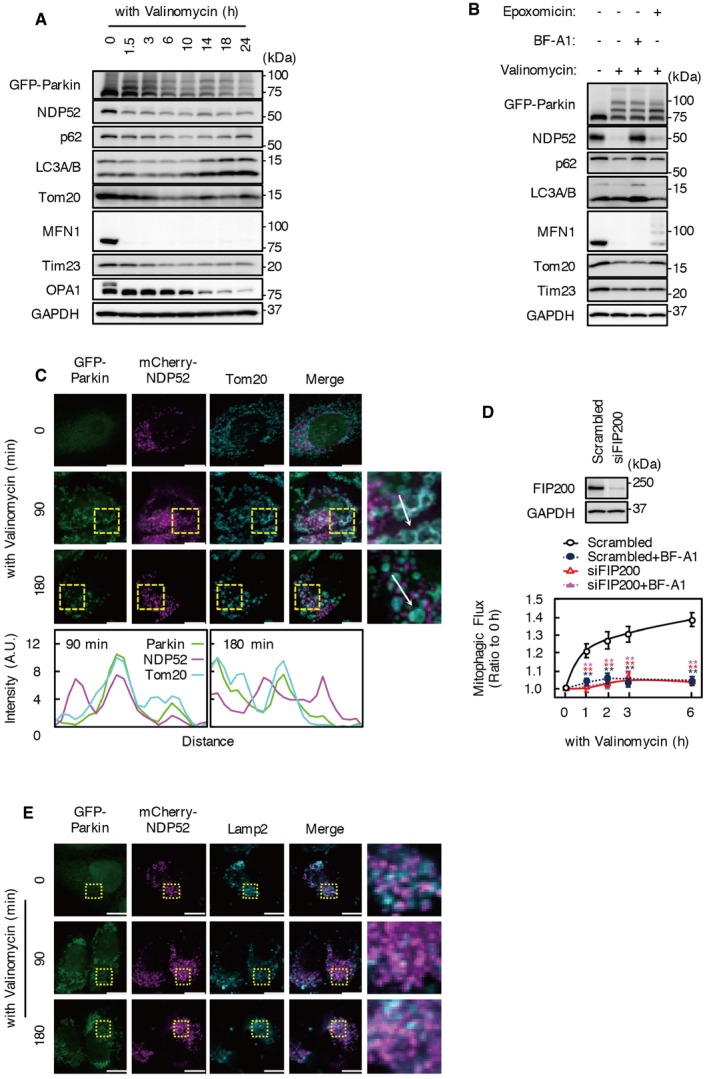
- HeLa‐GFP‐Parkin cells incubated with valinomycin for 0–24 h. Cell lysates were subjected to Western blotting using the indicated antibodies.
- HeLa‐GFP‐Parkin cells incubated with valinomycin for 3 h in the presence or absence of 100 nM bafilomycin A1 or epoxomicin. Cell lysates were subjected to Western blotting using the indicated antibodies.
- HeLa‐GFP‐Parkin cells expressing mCherry‐NDP52 were incubated with valinomycin. Cells were immunostained with anti‐Tom20 antibody. Colocalization of GFP‐Parkin, NDP52, and Tom20 was determined using Line Scan. Fluorescence intensities of each channel were measured along the white arrow. Scale bars, 10 μm.
- Mitophagy flux assay in FIP200 KD cells. Cells transfected with siFIP200 oligo were incubated with valinomycin for 6 h in the presence or absence bafilomycin A1. Results are a summary of three independent experiments. Values are the means ± SEM. **P < 0.01 compared with scrambled oligo‐treated cells, determined with one‐way ANOVA followed by the Student's t‐test.
- mCherry‐NDP52 was expressed in HeLa‐GFP‐Parkin cells and immunostained with anti‐Lamp2 antibody. Scale bars, 10 μm.
Source data are available online for this figure.
As was the case with endogenous NDP52, mCherry‐NDP52 predominantly localized to the perinuclear region without valinomycin treatment and partially colocalized with Parkin localized at mitochondria in cells incubated with valinomycin for 90 min (Fig EV1C). Colocalization of mCherry‐NDP52 with Parkin localized at mitochondria was also reduced in cells treated with valinomycin for 180 min.
NDP52 knockdown induces a delay in mitophagy
To clarify the role of NDP52 in Parkin‐mediated mitophagy, we knocked down NDP52 expression in HeLa‐GFP‐Parkin cells using siRNA (Fig 1B–G). The NDP52 siRNA oligo completely blocked endogenous NDP52 expression 72 h after transfection. NDP52 knockdown (KD) did not influence proteasomal degradation of mitofusin 1 (MFN1), a Parkin substrate 21; degradation of the OMM protein, Tom20; or degradation of the inner mitochondrial membrane (IMM) proteins, Tim23 and OPA1 (Fig 1B).
To precisely assess the effect of NDP52 KD on mitophagy, we quantified mitophagic flux using Mtphagy dye (Fig 1C). Mtphagy dye stains mitochondria, and its fluorescence intensity depends on the pH conditions. When mitochondria are transported to lysosomes by mitophagy, Mtphagy dye exhibits higher fluorescence intensity. We confirmed that the fluorescence enhancement of Mtphagy dye during valinomycin treatment is autophagy dependent and lysosomal pH dependent (Fig EV1D). Mitophagy in control cells was precipitously induced by valinomycin treatment and reached a plateau after treatment for approximately 6 h. NDP52 KD significantly reduced mitophagic flux 2–6 h after valinomycin treatment. Thereafter, mitophagic flux in NDP52 KD cells caught up with that in control cells. This indicates that NDP52 KD delays mitophagy.
To assess the effect of NDP52 KD on mitophagosome formation, we expressed mCherry‐LC3 and MTS‐TagBFP, which fluorescently label autophagosomes and mitochondria, respectively, and investigated colocalization of the mCherry and TagBFP signals (reflecting mitophagosomes) using IN Cell Analyzer (Fig 1D and E). In control cells, the number of mCherry‐LC3 puncta with MTS‐TagBFP signal was increased 1–3 h after valinomycin treatment. However, the number of mCherry‐LC3 puncta colocalized with MTS‐TagBFP was significantly reduced by NDP52 KD at 1, 2, and 3 h after valinomycin treatment. Nevertheless, the number of mitophagosomes was comparable in NDP52 KD and control cells at 6–24 h after valinomycin treatment. Furthermore, the majority of NDP52 was degraded and its level reached its minimum at 3 h after valinomycin treatment (Fig 1B). Therefore, we assumed that NDP52 was not involved in mitophagosome formation after 3 h.
To more precisely clarify the effect of NDP52 KD on mitophagy, we performed electron microscopy analysis to compare the number and morphology of mitophagosomes in NDP52 KD and control cells (Fig 1F and G). To quantify mitophagosomes, cells were incubated with both valinomycin and bafilomycin A1 for 2 h, which caused accumulation of mitophagosomes by inhibition of fusion between mitophagosomes and lysosomes. Mitochondria sequestered by autophagosomes were observed in both NDP52 KD and control cells. However, the ratio of mitophagosomes to total mitochondrial area was significantly lower in NDP52 KD cells compared with controls (6.1 and 14.1%, respectively). These results indicate that NDP52 is involved in mitophagy in the early period (within 3 h) of valinomycin treatment and may be involved in efficient engulfment of damaged mitochondria by autophagosomes.
Both N‐terminal SKICH and C‐terminal LIM‐L domains of NDP52 are required for mitophagy
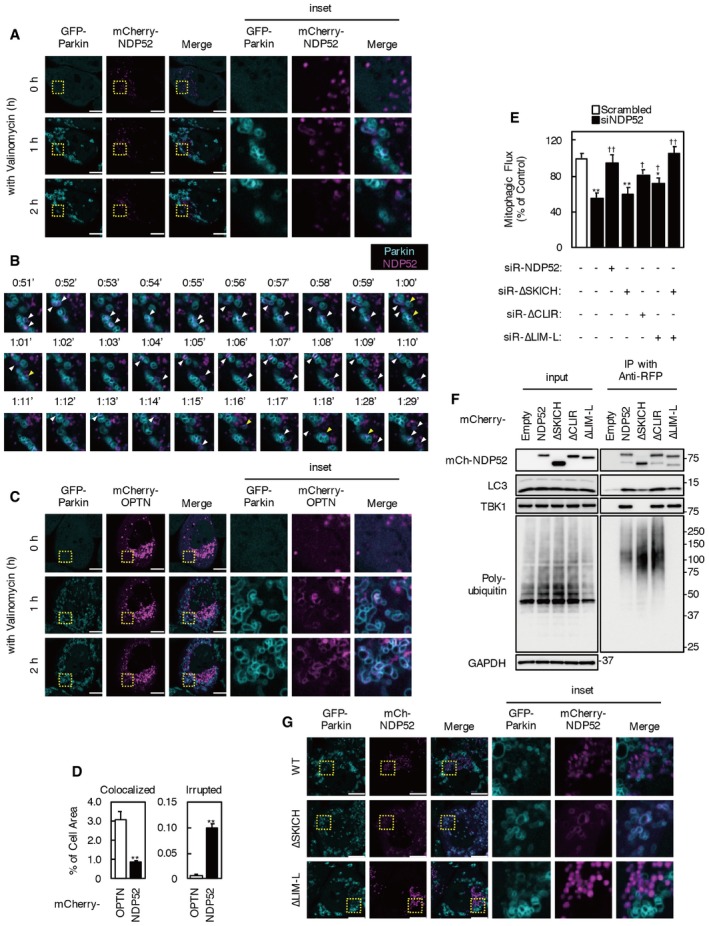
To investigate the precise behavior of NDP52 in valinomycin‐treated cells, we performed time‐lapse imaging of mCherry‐NDP52 and GFP‐Parkin (Fig 2A and C, Movies EV1 and EV2). GFP‐Parkin formed ring‐like structures surrounding mitochondria from 20 min after valinomycin treatment (Movie EV1). Almost at the same time, mCherry‐NDP52 began to colocalize with part of the Parkin‐ring‐like structures. At first, mCherry‐NDP52 was recruited to the edges of the Parkin‐positive ring structures as dot‐shaped structures, which then elongated along the ring structures and overlapped with Parkin‐positive mitochondria. Some mCherry‐NDP52 signals were also observed inside Parkin‐ring‐like structures after elongation (Fig 2B and D, yellow arrowheads). While mCherry‐tagged OPTN, another essential mitophagy receptor, was recruited and accumulated to most Parkin‐ring structures as previously described 22 (Fig 2C, Movie EV3), mCherry‐NDP52 tended to be recruited to smaller ring structures and rarely localized to larger mitochondrial rings. mCherry‐NDP52‐positive mitochondria immediately disappeared or translocated to the perinuclear region. Furthermore, after valinomycin treatment, much of the mCherry signal coalesced and formed an aggregation at the perinuclear area. Immunofluorescence staining showed that a portion of mCherry‐NDP52 colocalized with the lysosomal membrane protein, lysosomal‐associated membrane protein 2 (Lamp2; Fig EV1E). mCherry is a pH‐stable fluorescent protein; therefore, this mCherry region indicates accumulation of sequestrated mCherry‐NDP52 in lysosomes via the autophagic/mitophagic pathway. Thus, disappearance or perinuclear translocation of NDP52‐localized mitochondria likely represents mitophagy. These results indicate that NDP52 plays a role as a mitophagy receptor in the early period of valinomycin‐induced Parkin‐mediated mitophagy.
Figure 2. SKICH and LIM‐L domains of NDP52 are both required for mitophagy.
-
A, CImages of HeLa‐GFP‐Parkin cells expressing mCherry‐NDP52 (A) or mCherry‐OPTN (C) under valinomycin treatment. The images are from Movies EV2 and EV3, respectively. Cyan, GFP‐Parkin; magenta, mCherry‐NDP52 or OPTN. Scale bars, 10 μm. Images are representative of five independent experiments.
-
BTime‐lapse images of HeLa‐GFP‐Parkin cells expressing mCherry‐NDP52 under valinomycin treatment. The images are representative of five independent experiments and correspond to the boxed regions of Fig 2A and Movie EV2. Cyan, GFP‐Parkin; magenta, mCherry‐NDP52. The white arrowheads indicate colocalization of GFP‐Parkin and mCherry‐NDP52. The yellow arrowheads indicate mCherry‐NDP existing inside GFP‐Parkin‐ring structures.
-
DmCherry‐NDP52 or OPTN signals colocalized with Parkin‐ring structures and existing inside of Parkin‐ring structures (irrupted) were quantified. Data were from five independent experiments in cells incubated with valinomycin for 2 h. Values are the means ± SEM. **P < 0.01 compared with mCherry‐OPTN‐expressing cells, determined with one‐way ANOVA followed by the Student's t‐test.
-
EMitophagic flux in NDP52 KD cells expressing siRNA‐resistant NDP52 or NDP52 mutants. Cells were incubated with valinomycin for 3 h. Results are a summary of three independent experiments. Values are the means ± SEM. *P < 0.05, **P < 0.01 vs. scrambled oligo‐transfected cells; †P < 0.05, ††P < 0.01 vs. empty vector‐transfected cells, determined with one‐way ANOVA followed by the Tukey–Kramer post hoc test.
-
FHeLa‐GFP‐Parkin cells expressing mCherry‐NDP52 mutants were incubated with 1 μM valinomycin and 100 nM bafilomycin A1 for 3 h. Cell lysates were subjected to immunoprecipitation using anti‐RFP magnetic beads. Immunoprecipitates were analyzed by Western blotting. Data are representative of three independent experiments.
-
GImages of HeLa‐GFP‐Parkin cells expressing mCherry‐NDP52 ∆LIM‐L or mCherry‐NDP52 ΔSKICH treated with valinomycin for 2 h. The images are from Movie EV4. Cyan, GFP‐Parkin; magenta, mCherry‐NDP52 mutant. Scale bars, 10 μm. Images are representative of three independent experiments.
Source data are available online for this figure.
Human NDP52 contains an N‐terminal skeletal muscle and kidney‐enriched inositol phosphatase carboxy homology (SKICH) domain (which is required for TBK1 interaction via Nap1 or Sintbad), a noncanonical LC3‐interacting region motif for LC3C interaction (CLIR), a coiled‐coil domain for homodimerization, and a C‐terminal Lin1, Isl‐1 and Mec‐3 (LIM)‐like (LIM‐L) domain 16, 17, 23, 24. The region containing the LIM‐L domain includes two zinc finger motifs associated with poly‐ubiquitin chain interaction 16, 25. To determine which NDP52 region is important for mitophagosome formation, we constructed NDP52 deletion mutants lacking the SKICH domain, CLIR motif and upstream acidic amino acid cluster, or LIM‐L domain (Fig EV2A). To assess the biological activities of these mutants in NDP52 KD cells, we designed them to be siRNA‐resistant (siR). Expression of full‐length siR‐NDP52 and siR‐NDP52∆CLIR, but not siR‐NDP52∆SKICH or siR‐NDP52∆LIM‐L, restored the mitophagic flux inhibited by NDP52 KD (Fig 2E). However, siR‐NDP52∆LIM‐L expression partially rescued the mitophagic flux inhibited by NDP52 KD. Intriguingly, co‐expression of siR‐NDP52∆SKICH and siR‐∆LIM‐L restored the mitophagic flux to levels comparable with those of full‐length siR‐NDP52‐expressing cells and control cells. As expected, LC3, TBK1, and ubiquitin co‐immunoprecipitated with mCherry‐tagged full‐length NDP52, while the ∆SKICH and ∆LIM‐L mutants had no interaction with TBK1 and ubiquitin, respectively (Fig 2F). The LC3 interaction was diminished by SKICH domain deletion, but was not influenced by CLIR or LIM‐L domain deletion. In HeLa‐GFP‐Parkin cells, endogenous LC3C expression and the NDP52‐LC3C interaction were not detected (Fig EV2C). These data can explain the activity of NDP52∆CLIR and indicate that both N‐terminal SKICH and C‐terminal LIM‐L domains are essential for the function of NDP52.
Figure EV2. Ubiquitin‐binding‐deficient mutants of NDP52 fail to localize at damaged mitochondria.
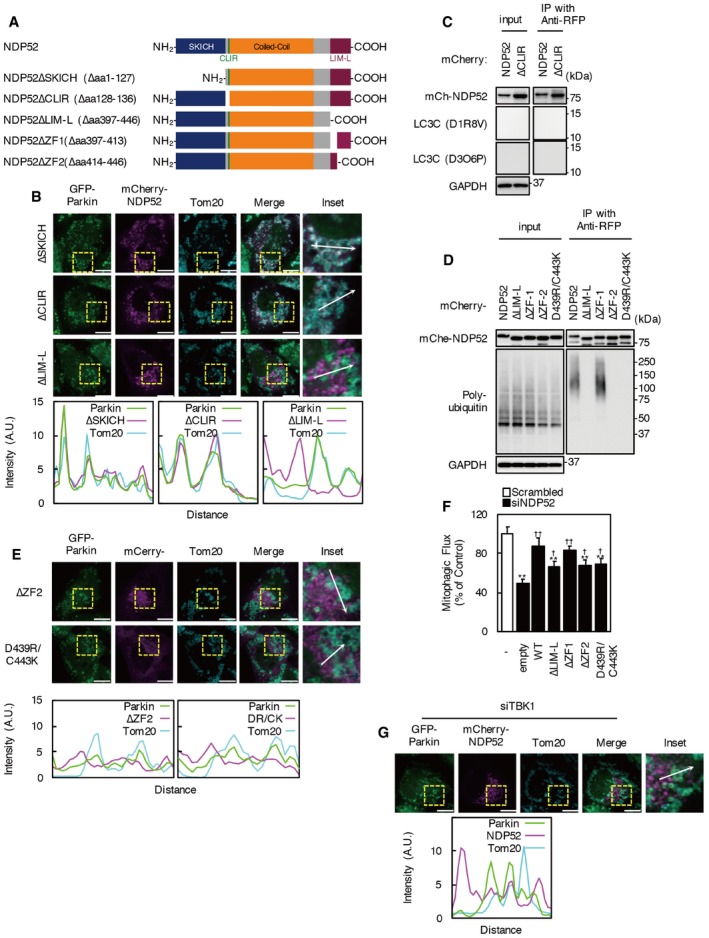
- Schematic structures of NDP52 truncated mutants used in this study.
- HeLa‐GFP‐Parkin cells expressing mCherry‐NDP52 ΔSKICH, ∆CLIR, or ∆LIM‐L were immunostained with anti‐Tom20 antibody. Scale bars, 10 μm. Colocalization of GFP‐Parkin, mCherry‐NDP52 mutant, and Tom20 was determined using Line Scan. Fluorescence intensities of each channel were measured along the white arrow.
- HeLa‐GFP‐Parkin cells expressing mCherry‐NDP52 or ∆CLIR were incubated with valinomycin and bafilomycin A1 for 3 h. Cell lysates were subjected to immunoprecipitation using an anti‐RFP antibody. Immunoprecipitates were analyzed by Western blotting.
- HeLa‐GFP‐Parkin cells expressing mCherry‐NDP52 mutants were incubated with valinomycin and bafilomycin A1 for 3 h. Cell lysates were subjected to immunoprecipitation using an anti‐RFP antibody. Immunoprecipitates were analyzed by Western blotting.
- HeLa‐GFP‐Parkin cells expressing mCherry‐NDP52∆ZF2 or D439R/C443K were incubated with valinomycin for 2 h. Immunostaining was performed with anti‐Tom20 antibody. Scale bar, 10 μm. Colocalization of GFP‐Parkin, mCherry‐NDP52 mutant, and Tom20 was assessed using Line Scan.
- Mitophagic flux in NDP52 KD cells transfected with siRNA‐resistant NDP52 or NDP52 mutants. Cells were incubated with valinomycin for 3 h. Results are a summary of three independent experiments. Values are the means ± SEM. **P < 0.01 vs. scrambled oligo‐transfected cells; †P < 0.05, ††P < 0.01 vs. empty vector‐transfected cells, determined with one‐way ANOVA followed by the Tukey–Kramer post hoc test.
- mCherry‐NDP52 was expressed in TBK1 KD cells. Cells were incubated with 1 μM valinomycin for 2 h and immunostained with anti‐Tom20 antibody. Scale bars, 10 μm. Colocalization of GFP‐Parkin, mCherry‐NDP52 mutant, and Tom20 was determined using Line Scan.
Source data are available online for this figure.
Without valinomycin treatment, ∆LIM‐L was predominantly localized to the perinuclear region, similar to full‐length NDP52, whereas most mCherry‐NDP52 ΔSKICH showed diffuse localization in the cytosol (Fig 2G, Movie EV4). NDP52∆SKICH, but not NDP52∆LIM‐L, colocalized with Parkin‐localized ring‐shaped mitochondria after valinomycin treatment (Figs 2G and EV2B, Movie EV4). While some mCherry‐∆SKICH‐positive mitochondria immediately disappeared, most NDP52∆SKICH accumulated on depolarized mitochondria. Unlike full‐length NDP52, mCherry‐∆SKICH colocalized with smaller GFP‐Parkin rings and with larger mitochondria. Indeed, deletion of the SKICH domain increased colocalization of NDP52 with Parkin at mitochondria. These results indicate that the SKICH domain of NDP52 is required for the localization of NDP52 in normal conditions and for the migration of damaged mitochondria to lysosomes.
The LIM‐L domain of NDP52 contains an unconventional zinc finger (ZF1) and a C2H2‐type zinc finger (ZF2), and only ZF2 interacts with mono‐ubiquitin or poly‐ubiquitin chains 25. As previously reported, interaction between NDP52 and ubiquitin was abolished by deletion of the ZF2 domain and point mutations of the D439 and C443 residues, two key interface amino acid residues of ZF2 (Fig EV2D). Both ∆ZF2 and D439R/C443K mutants rarely colocalized with Tom20 or GFP‐Parkin (Fig EV2E). As with siR‐∆LIM‐L, expression of siR‐NDP52∆ZF2 or siR‐NDP52 D439R/C443K could restore part of the mitophagic flux inhibited by NDP52 KD (Fig EV2F). These results confirm that the interaction between ubiquitin and the zinc finger motif of NDP52 is required for the recruitment of NDP52 to damaged mitochondria.
NDP52 has TBK1‐independent functions during valinomycin‐induced mitophagy
The SKICH domain of NDP52 is required for the interaction with TBK1; therefore, we examined the effect of TBK1 KD on NDP52‐mediated mitophagy. KD of TBK1 or OPTN significantly reduced mitophagic flux following valinomycin treatment for 3 h (Fig 3A). An additive effect on mitophagic flux was not observed using both siTBK1 and siOPTN; however, combinations of siNDP52 and siTBK1, or siNDP52, siTBK1, and siOPTN reduced mitophagic flux to a significantly greater extent compared with using siTBK1 or siNDP52 alone (P < 0.01, P < 0.05, respectively).
Figure 3. Effects of TBK1 knockdown on Parkin‐mediated mitophagy.
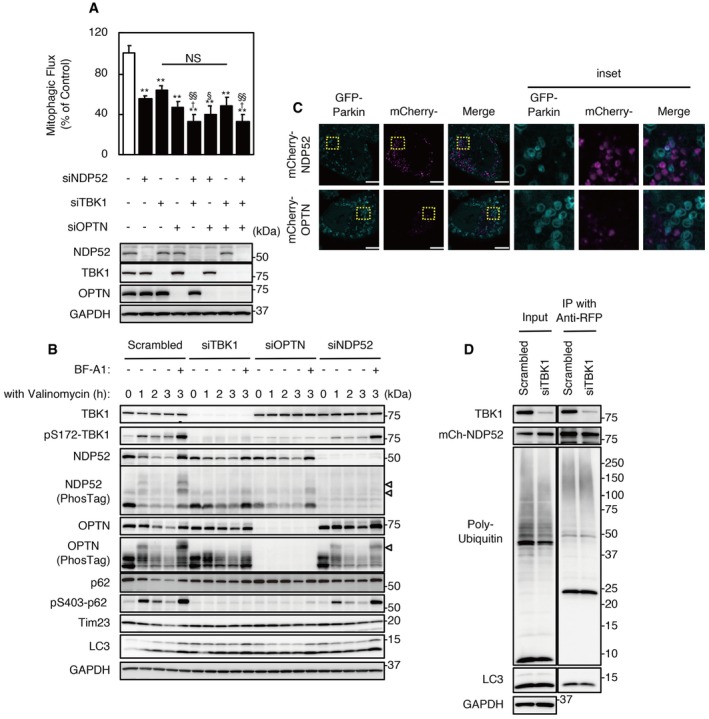
- Mitophagic flux in cells transfected with siNDP52, siTBK1, siOPTN, or a combination of siRNAs. Results are a summary of three independent experiments. Values are the means ± SEM. **P < 0.01 vs. scrambled oligo‐transfected cells; †P < 0.05 vs. siNDP52‐transfected cells; §P < 0.05, §§P < 0.01 vs. siTBK1; NS: not significant, determined with one‐way ANOVA followed by the Tukey–Kramer post hoc test.
- HeLa‐GFP‐Parkin cells transfected with siNDP52, siOPTN, siTBK1, or scrambled siRNA were incubated with 1 μM valinomycin for the indicated times. Cell lysates were subjected to SDS–PAGE or Phos‐tag‐PAGE prior to Western blotting using the indicated antibodies. Data are representative of two independent experiments. The position of phosphorylated forms of NDP52 or OPTN is indicated by arrowheads.
- Images of TBK1 KD cells expressing mCherry‐NDP52 or mCherry‐OPTN under valinomycin treatment from Movie EV5. Cyan, GFP‐Parkin; magenta, mCherry‐NDP52. Images are representative of two independent experiments. Scale bars, 10 μm.
- TBK1 KD and control cells expressed mCherry‐NDP52. Lysates were subjected to immunoprecipitation using anti‐RFP beads. Immunoprecipitates were analyzed by Western blotting. Data are representative of three independent experiments.
Source data are available online for this figure.
Phosphorylation of the activation loop site (Ser172) in TBK1 is essential for its activation, and activated TBK1 phosphorylates p62 at Ser403, OPTN, and NDP52 15, 26, 27. Phosphorylation of TBK1 and p62 was detected between 30 and 180 min, and reached a peak at 60 min after valinomycin treatment in scrambled siRNA‐treated cells (Fig 3B). To detect phosphorylated forms of NDP52 and OPTN, cell extracts were separated by Phos‐tag‐PAGE. Lower mobility forms of NDP52 and OPTN were detected in scrambled oligo‐treated cells. Bafilomycin A1 treatment stabilized phosphorylated forms of these molecules. However, phosphorylation of p62, OPTN, and NDP52 was rarely detected in TBK1 KD cells even after treatment with valinomycin and bafilomycin A1 for 3 h. It was reported that NDP52 and OPTN form stable complexes with TBK1 that translocate into damaged mitochondria 26. While OPTN KD inhibited phosphorylation of TBK1 and p62, NDP52 KD did not affect phosphorylation of these molecules. In addition, TBK1 KD inhibited the degradation of OPTN during valinomycin treatment; however, KD of TBK1 or OPTN did not influence the degradation of NDP52.
The recruitment of mCherry‐NDP52 to Parkin‐ring structures was reduced by TBK1 KD, but mCherry‐NDP52 certainly colocalized with smaller Parkin‐positive mitochondria in TBK1 KD cells during valinomycin treatment (Figs 3C and EV2G, Movie EV5). In contrast, TBK1 KD dramatically changed mCherry‐OPTN behavior; colocalization of mCherry‐OPTN and Parkin‐ring structures was rarely observed in TBK1 KD cells during valinomycin treatment (Fig 3C, Movie EV5). In addition, TBK1 KD did not influence co‐immunoprecipitation of ubiquitin or LC3 with NDP52 (Fig 3D). These data indicate that OPTN but not NDP52 contributes to TBK1‐dependent mitophagy and that the SKICH domain of NDP52 must have TBK1‐independent functions.
NDP52 interacts with mitochondrial RNA poly(A) polymerase via its SKICH domain
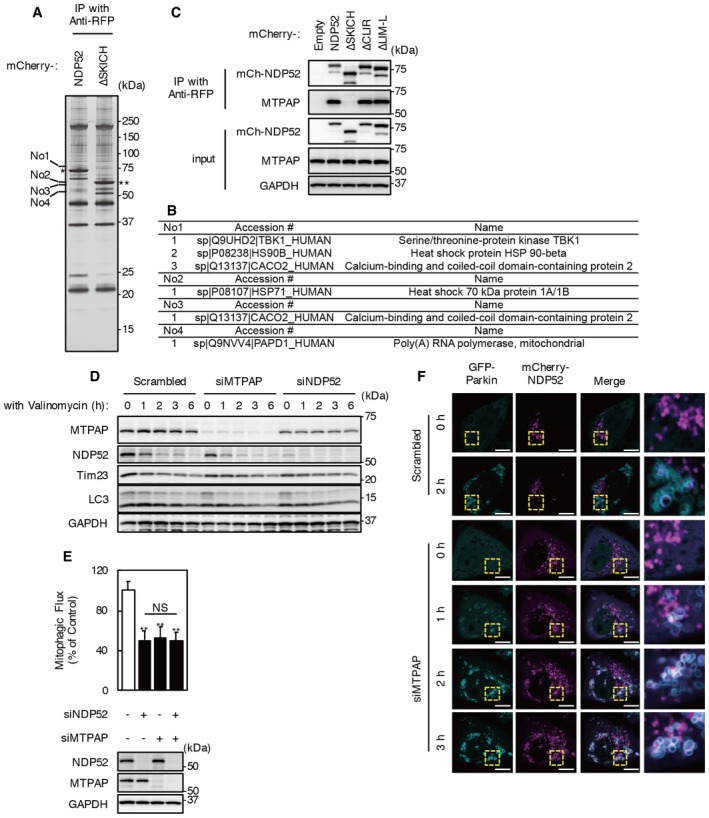
To evaluate the function of the SKICH domain, we sought to identify proteins other than TBK1 that bind to NDP52 via its SKICH domain by mass spectrometry (Fig 4A and B, Table EV1). We expressed mCherry‐NDP52 and mCherry‐NDP52 ∆SKICH in HeLa‐GFP‐Parkin cells and performed immunoprecipitation using an anti‐RFP antibody. By comparing NDP52‐ and NDP52 ∆SKICH‐expressing cells, we found four bands specific to the mCherry‐NDP52 immunoprecipitates (Fig 4A). LC‐MS/MS analysis identified five candidate SKICH domain‐binding proteins (Fig 4B), including NDP52 (CALCOCO2) itself and TBK1. In addition, two heat shock proteins and mitochondrial poly(A) polymerase (MTPAP) were co‐immunoprecipitated with the NDP52 SKICH domain. We also detected MTPAP as a SKICH domain‐interacting protein by shotgun proteomic analysis of anti‐RFP immunoprecipitates using iTRAQ labeling followed by mass spectrometry (Table EV1). Although this interaction was previously reported in a comprehensive proteomic analysis of the human innate immunity interactome for type I interferon, the function of the interaction has been unclear 28, 29. Together, these findings indicate MTPAP to be a strong SKICH domain‐binding candidate, and we confirmed that the interaction between NDP52 and MTPAP is SKICH domain‐dependent by co‐immunoprecipitation (Fig 4C).
Figure 4. Identification and analysis of SKICH domain‐binding protein MTPAP .
-
A, BAnti‐RFP immunoprecipitates from mCherry‐NDP52‐ and mCherry‐NDP52 ∆SKICH‐transfected cells were subjected to SDS–PAGE followed by silver staining. Four bands specific for mCherry‐NDP52 are numbered and were identified by mass spectrometric analysis. Asterisk (*) and double asterisk (**) indicate mCherry‐NDP52 and mCherry‐NDP52 ΔSKICH bands, respectively. The summary of mass spectrometric analysis is shown in (B).
-
CHeLa‐GFP‐Parkin cells expressing mCherry‐NDP52 mutants were incubated with 1 μM valinomycin and 100 nM bafilomycin A1 for 3 h. Cell lysates were subjected to immunoprecipitation using anti‐RFP magnetic beads. Immunoprecipitates were analyzed by Western blotting. Data are representative of three independent experiments.
-
DHeLa‐GFP‐Parkin cells transfected with siMTPAP were incubated with 1 μM valinomycin for the indicated times. Western blotting was performed using the indicated antibodies. Data are representative of three independent experiments.
-
EMitophagic flux in cells transfected with siNDP52, siMTPAP, and combinations of siRNAs. Cells were incubated with valinomycin for 3 h. Results are a summary of three independent experiments. Values are the means ± SEM. **P < 0.01 vs. scrambled oligo‐transfected cells; NS, not significant, determined with one‐way ANOVA followed by the Tukey–Kramer post hoc test.
-
FImages of MTPAP KD cells expressing mCherry‐NDP52 under valinomycin treatment. The images are from Movie EV7. Cyan, GFP‐Parkin; magenta, mCherry‐NDP52. Images are representative of two independent experiments. Scale bars, 10 μm.
Source data are available online for this figure.
To evaluate whether MTPAP is involved in Parkin‐mediated mitophagy, cells were treated with MTPAP siRNA. KD of MTPAP did not influence NDP52 degradation by valinomycin treatment (Fig 4D). However, mitophagic flux was significantly reduced by MTPAP KD, similar to that observed after NDP52 KD (Fig 4E). Cells with double KD of NDP52 and MTPAP showed a comparable level of mitophagic flux to cells treated with siNDP52 or siMTPAP alone. In addition, the number of mitophagosomes 2 h after valinomycin treatment was significantly reduced by MTPAP KD (Fig EV3A). These results indicate that MTPAP has an involvement in NDP52‐mediated mitophagosome formation.
Figure EV3. Intra‐mitochondrial localization of MTPAP does not change following valinomycin treatment.
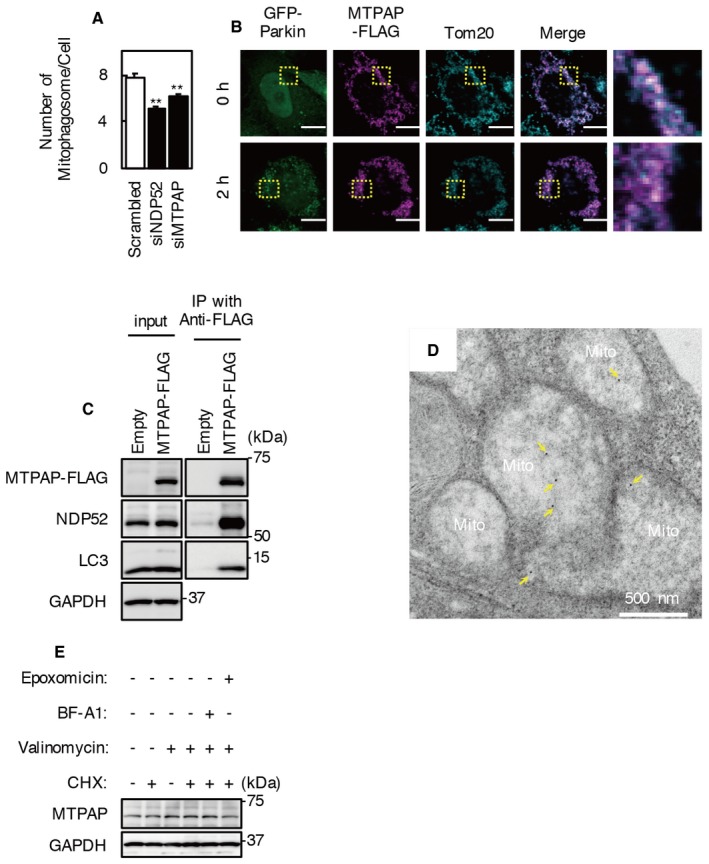
- The number of mitophagosomes per cell was counted in NDP52 KD, MTPAP KD, and control cells. Results are a summary of three independent experiments. Values are the means ± SEM. **P < 0.01 vs. control, determined with one‐way ANOVA followed by the Tukey–Kramer post hoc test.
- MTPAP‐FLAG was expressed in HeLa‐GFP‐Parkin cells. Cells were incubated with valinomycin for 0 or 2 h. Immunostaining was performed with anti‐FLAG and anti‐Tom20 antibodies. Scale bars, 10 μm.
- HeLa‐GFP‐Parkin cells transfected with pMTPAP‐FLAG or empty vector were incubated with valinomycin and bafilomycin A1 for 2 h. Cell lysates were immunoprecipitated with anti‐FLAG magnetic beads.
- HeLa‐GFP‐Parkin cells expressing MTPAP‐FLAG were incubated with 1 μM valinomycin for 2 h and then subjected to immunoelectron microscopy analysis using an anti‐FLAG antibody. Arrow, immunogold‐labeled FLAG‐MTPAP. Scale bar, 500 nm.
- HeLa‐GFP‐Parkin cells were incubated with or without valinomycin and cycloheximide for 2 h, and Western blotting was performed.
Source data are available online for this figure.
Knockdown of MTPAP did not influence mCherry‐NDP52 localization in cells without valinomycin treatment (Fig 4F, Movie EV7). However, upon valinomycin treatment, mCherry‐NDP52 accumulated with Parkin localized at mitochondria in MTPAP KD cells, as is the case for the NDP52∆SKICH mutant.
NDP52 irrupts into mitochondria and interacts with MTPAP
Mitochondrial poly(A) polymerase is a noncanonical poly(A) polymerase (ncPAP) that is involved in polyadenylation in the nucleus and other organelles 30, 31. MTPAP contains a mitochondrial targeting sequence in its N‐terminus and contributes to the polyadenylation of mitochondrial RNAs. MTPAP is also one of two ncPAPs that can oligouridylate histone mRNAs, which mediates the initiation of their degradation 32. As polyadenylation of mitochondrial mRNA presumably occurs in the mitochondrial matrix and NDP52 is localized in the cytosol, there seems to be little chance for a complex of NDP52 and MTPAP to form. Therefore, for NDP52 and MTPAP to interact, MTPAP must change its intra‐mitochondrial localization, or NDP52 has to enter mitochondria. Immunofluorescence microscopy revealed MTPAP localization in mitochondria not only in control but also in valinomycin‐treated cells (Fig 5A).
Figure 5. NDP52 irrupts into mitochondria and interacts with MTPAP .
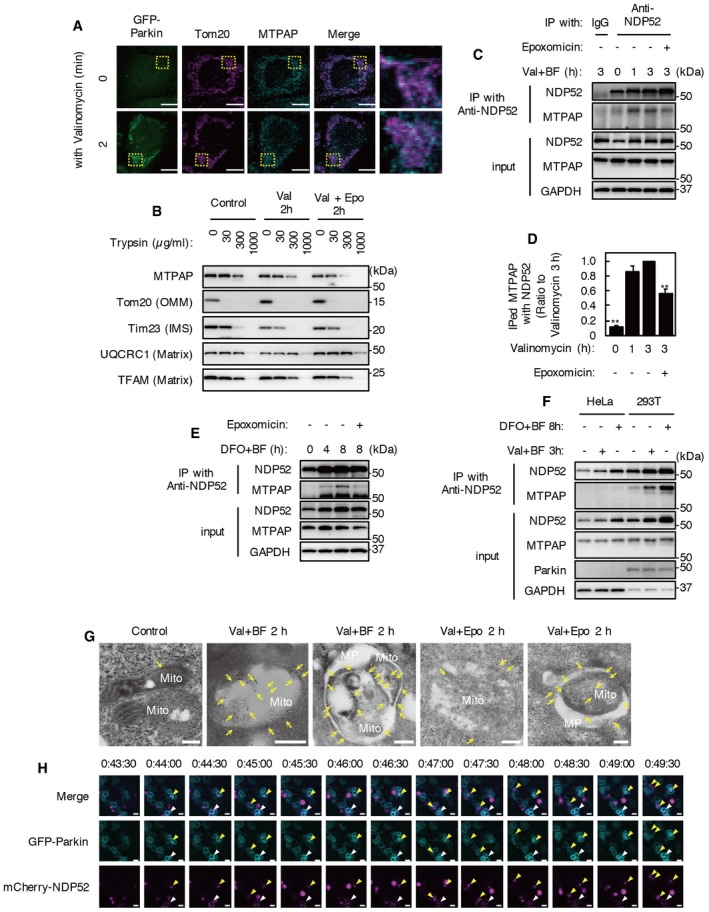
- HeLa‐GFP‐Parkin cells were incubated with valinomycin for 0 or 2 h. Immunostaining was performed with anti‐MTPAP and anti‐Tom20 antibodies. Images are representative of two independent experiments. Scale bar, 10 μm.
- Mitochondria‐rich fraction prepared from HeLa‐GFP‐Parkin cells treated with or without valinomycin and epoxomicin for 2 h was incubated with various concentrations of trypsin (0–1,000 μg/ml) for 30 min on ice. Protease protection was analyzed by Western blotting using antibodies for mitochondrial marker proteins (Tom20 for OMM, Tim23 for intermembrane space, and UQCRC1 and TFAM for mitochondrial matrix). Data are representative of five independent experiments.
- HeLa‐GFP‐Parkin cells were incubated with 1 μM valinomycin and 100 nM bafilomycin A1 for 0–3 h in the presence or absence of 10 μM epoxomicin. Cell lysates were subjected to immunoprecipitation using anti‐NDP52 antibody or control IgG. Immunoprecipitates were analyzed by Western blotting. Data are representative of five independent experiments.
- Quantification of MTPAP co‐immunoprecipitated with NDP52 in (C). Results are a summary of five independent experiments. Values are the means ± SEM. **P < 0.01 compared to cells treated with valinomycin and bafilomycin A1 for 3 h, determined with one‐way ANOVA followed by the Tukey–Kramer post hoc test.
- HeLa‐GFP‐Parkin cells were incubated with 100 μM DFO and 100 nM bafilomycin A1 for 0, 4, and 8 h in the presence or absence of epoxomicin. Cell lysates were subjected to immunoprecipitation using anti‐NDP52 antibody. Immunoprecipitates were analyzed by Western blotting. Data are representative of two independent experiments.
- HeLa cells and HEK293T cells were incubated with 1 μM valinomycin and 100 nM bafilomycin A1 for 3 h or 100 μM DFO and 100 nM bafilomycin A1 for 8 h. Cell lysates were subjected to immunoprecipitation using anti‐NDP52 antibody. Immunoprecipitates were analyzed by Western blotting. Data are representative of two independent experiments.
- Immunoelectron micrographs of HeLa‐GFP‐Parkin cells expressing FLAG‐NDP52. Cells treated for 2 h with valinomycin and bafilomycin A1 with or without epoxomicin were processed for immune‐electron microscopy with anti‐FLAG antibody. Images are representative of 10 cells. Arrow, immunogold‐labeled FLAG‐NDP52. Mito, mitochondrion; MP, mitophagosome. Scale bars, 200 nm.
- Selected frames from time‐lapse images of HeLa‐GFP‐Parkin expressing mCherry‐NDP52 under valinomycin and bafilomycin A1 treatment. The images are representative of two independent experiments and correspond to the boxed regions of Movie EV6. Cyan, GFP‐Parkin; magenta, mCherry‐NDP52. The white arrowheads indicate colocalization of GFP‐Parkin and mCherry‐NDP52. The yellow arrowheads indicate mCherry‐NDP existing inside GFP‐Parkin‐ring structures. Scale bars, 1 μm.
Source data are available online for this figure.
To assess intra‐mitochondrial localization of MTPAP, we performed immunoelectron microscopy with an anti‐FLAG antibody in MTPAP‐FLAG‐expressing cells (Fig EV3). As was the case with endogenous MTPAP, MTPAP‐FLAG was localized in mitochondria and co‐immunoprecipitated with endogenous NDP52 and LC3 (Fig EV3B and C). Gold particles representing MTPAP‐FLAG were mostly detected in the mitochondrial matrix and were rarely detected outside of mitochondria, even in valinomycin‐treated cells (Fig EV3D). We also evaluated the intra‐mitochondrial localization of MTPAP biochemically. We prepared mitochondria‐rich fractions from cells treated with or without valinomycin for 2 h and applied various concentrations of trypsin (Fig 5B). The trypsin digestion profile of MTPAP was similar to those of matrix proteins (UQCRC1 and TFAM) from mitochondria‐rich fractions of cells with or without valinomycin treatment. These results indicate that MTPAP localizes inside the IMM.
In normal conditions, PINK1 is constitutively imported to the IMM via TOM and TIM complexes and is degraded by several proteases containing PARL 9. TOM and TIM23 complexes contribute to nuclear‐encoded mitochondrial matrix protein import, and TIM23 complex activity depends on membrane potential 33, 34. Upon loss of mitochondrial membrane potential, import of PINK1 to the IMM is disturbed, and de novo synthesized PINK1 interacts with a subunit of the TOM complex and is stabilized on the OMM 35. To confirm whether MTPAP is stabilized on the OMM similarly to PINK1 in valinomycin‐treated cells, cells were treated with cycloheximide to inhibit de novo protein synthesis (Fig EV3E). However, cycloheximide did not influence the level of MTPAP in valinomycin‐treated cells. These results indicate that valinomycin treatment does not change the intra‐mitochondrial localization of MTPAP.
Recently, it has been reported that an IMM protein, prohibitin 2 (PHB2), binds with LC3 upon mitochondrial depolarization and proteasome‐dependent OMM rupture 36. We predicted that proteasomal OMM rupture might be involved in the interaction between NDP52 and MTPAP. The interaction of MTPAP with NDP52 was detected between 1 and 3 h after valinomycin and bafilomycin A1 treatment (Fig 5C and D) and reached a peak after 1 h. Epoxomicin, a proteasome inhibitor, significantly decreased the interaction but did not influence the intra‐mitochondrial localization of MTPAP (Fig 5B–D). In addition to mitochondrial uncoupler treatment, the interaction between NDP52 and MTPAP was also detected in cells treated with deferoxamine (DFO), an iron chelator that creates another mitophagy‐inducing condition (Fig 5E). Epoxomicin also decreased DFO‐induced NDP52–MTPAP interaction. These results indicate that the interaction between NDP52 and MTPAP is induced proteasome‐dependently not only by mitochondrial uncoupler treatment but also by iron chelator treatment. Iron chelator‐induced mitophagy is independent of PINK1 and Parkin 37. However, the interaction between NDP52 and MTPAP was not detected in parental HeLa cells, which do not express endogenous Parkin (Fig 5F). In addition, the interaction was detected in HEK293T cells, which express endogenous Parkin (Fig 5F). These results indicate that NDP52 interaction with MTPAP is Parkin‐ and proteasome‐dependent during mitophagy‐inducing conditions.
To confirm whether NDP52 actually irrupts into mitochondria, immunoelectron microscopy studies with an anti‐FLAG antibody were performed in HeLa‐GFP‐Parkin cells expressing FLAG‐NDP52 (Fig 5G). While immunogold labeling of FLAG‐NDP52 was rarely detected in mitochondria of control cells, mitochondria in valinomycin‐ and bafilomycin A1‐treated cells had FLAG‐NDP52 immunogold particles within and on the surface of mitochondria. FLAG‐NDP52 signals inside mitochondria sequestered by autophagosomes were especially numerous. In contrast, epoxomicin treatment decreased the number of FLAG‐NDP52 immunogold particles in mitochondria. These results indicate proteasome‐dependent NDP52 irruption into mitochondria during valinomycin treatment.
Some mCherry‐NDP52 signals were observed inside GFP‐Parkin‐localized mitochondria by time‐lapse imaging of valinomycin‐treated cells (Fig 2C). However, because mCherry signals accumulate in lysosomes, it is difficult to distinguish the invasion of NDP52 into mitochondria and fusion between mitophagosomes and lysosomes. To make this distinction, we performed time‐lapse imaging of mCherry‐NDP52‐expressing HeLa‐GFP‐Parkin cells in the presence of valinomycin and bafilomycin A1 (Fig 5H, Movie EV6). As for valinomycin treatment alone, mCherry‐NDP52 was initially recruited to the edge of GFP‐Parkin‐ring structures as dots, and then elongated along the Parkin rings and invaded inside mitochondria. These results indicate that NDP52 irrupts into mitochondria and interacts with MTPAP during valinomycin treatment.
MTPAP knockdown reduces mitophagosome formation
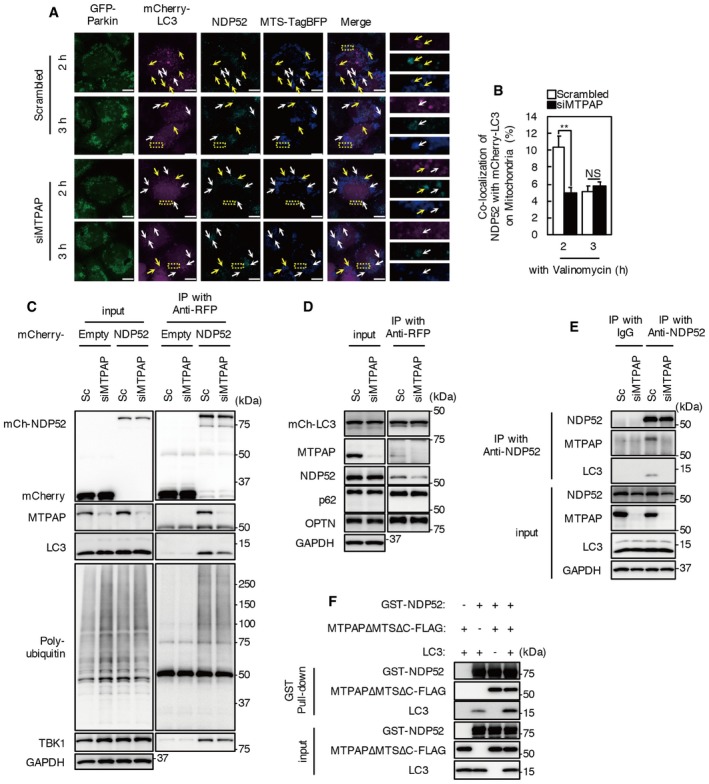
To clarify the effect of MTPAP KD on LC3 recruitment to mitochondria, we expressed mCherry‐LC3 and MTS‐TagBFP in MTPAP KD cells and immunostained with an anti‐NDP52 antibody (Fig 6A and B). After incubation with valinomycin for 2 h, approximately 10% of mCherry‐LC3 was colocalized with NDP52 on mitochondria, and the colocalization was reduced to 5% by treatment with valinomycin for 3 h in scrambled oligo‐treated cells. Colocalization of mCherry‐LC3 and NDP52 on mitochondria in MTPAP KD cells was significantly lower compared with that in control cells after incubation with valinomycin for 2 h, and remained at a low level after 3 h.
Figure 6. MTPAP knockdown reduces the colocalization and the interaction between NDP52 and LC3.
-
A, BmCherry‐LC3 and MTS‐TagBFP were expressed in MTPAP KD and control cells. Cells were incubated with valinomycin for the indicated times and immunostained with anti‐NDP52 antibody. Images are representative of two independent experiments. Yellow arrows indicate colocalization of MTS‐TagBFP, mCherry‐LC3, and NDP52. White arrows indicate colocalization of MTS‐TagBFP and NDP52 (not mCherry‐LC3). Scale bars, 10 μm. Colocalization of mCherry‐LC3 and NDP52 on mitochondria is quantified in (B). At least 10 cells from two independent experiments were quantified. Values are the means ± SEM. **P < 0.01 vs. control, determined with one‐way ANOVA followed by the Student's t‐test.
-
C, DMTPAP KD and control cells expressed mCherry‐NDP52 or empty vector (C) or mCherry‐LC3 (D). Lysates from cells treated with 1 μM valinomycin and 100 nM bafilomycin A1 for 2 h were subjected to immunoprecipitation using anti‐RFP beads. Immunoprecipitates were analyzed by Western blotting. Data are representative of three independent experiments.
-
EMTPAP KD and control cells were incubated with valinomycin and bafilomycin A1 for 2 h. Cell lysates were subjected to immunoprecipitation using an anti‐NDP52 antibody or control IgG. Immunoprecipitates were analyzed by Western blotting. Data are representative of three independent experiments.
-
FGST‐NDP52 conjugated with glutathione‐Sepharose resin was incubated with purified recombinant LC3 and MTPAP∆MTS∆C. The pulled‐down complex was subjected to Western blotting. Data are representative of three independent experiments.
Source data are available online for this figure.
To examine the effect of MTPAP KD on the interaction between NDP52 and LC3, co‐immunoprecipitation was performed in cells treated with valinomycin and bafilomycin A1 (Fig 6C–E). Interaction between NDP52 and LC3 was reduced by MTPAP KD in both mCherry‐NDP52‐ and mCherry‐LC3‐expressing cells (Fig 6C and D). In addition, co‐immunoprecipitation of LC3 with endogenous NDP52 was also reduced by MTPAP KD (Fig 6E). MTPAP KD did not affect the interaction between NDP52 and ubiquitin or TBK1, or the interaction between LC3 and other mitophagy receptors, such as p62 and OPTN (Fig 6C and D). These results indicate that MTPAP enhances the interaction between LC3 and NDP52.
To confirm the effect of MTPAP on the interaction between LC3 and NDP52, we performed pull‐down assays using recombinant proteins expressed in Escherichia coli (Fig 6F). Preparation of full‐length human MTPAP protein was not successful, as has been previously reported 38, 39. We, therefore, prepared a C‐terminal FLAG‐tagged version of MTPAP amino acid residues 44–547 (MTPAP∆MTS∆C‐FLAG). Recombinant LC3B and MTPAP∆MTS∆C‐FLAG were co‐precipitated with GST‐NDP52, which demonstrates that NDP52 binds directly to LC3B and MTPAP. Levels of co‐precipitated LC3B and GST‐NDP52 were increased in the presence of MTPAP∆MTS∆C‐FLAG compared with in the absence of MTPAP. These results clearly indicate that the interaction between NDP52 and MTPAP attracts the autophagosomal membrane protein LC3.
NDP52 interacts with MTPAP and irrupts into mitochondria independently of ubiquitin binding
Prohibitin 2 functions as an IMM‐anchored mitophagy receptor upon proteasomal OMM rupture during mitophagy 36. Therefore, the mitophagic function of PHB2 is very similar to that of the NDP52–MTPAP complex. To investigate whether PHB2 is involved in the interaction between NDP52 and MTPAP, we knocked down PHB2. As previously reported, KD of PHB2 significantly reduced mitophagic flux after valinomycin treatment for 3 h (Fig EV4A). Double KD of NDP52 and PHB2 reduced mitophagic flux to a significantly greater degree than siPHB2 or siNDP52 alone. In addition, KD of PHB2 did not influence the behavior of mCherry‐NDP52 during valinomycin treatment or the interaction between NDP52 and MTPAP (Fig EV4B and C, Movie EV8). These results indicate that PHB2 and NDP52–MTPAP contribute distinct mitochondrial recognition mechanisms of mitophagy.
Figure EV4. Knockdown of PHB2, Rab35, and TBK1 does not influence the interaction between NDP52 and MTPAP .
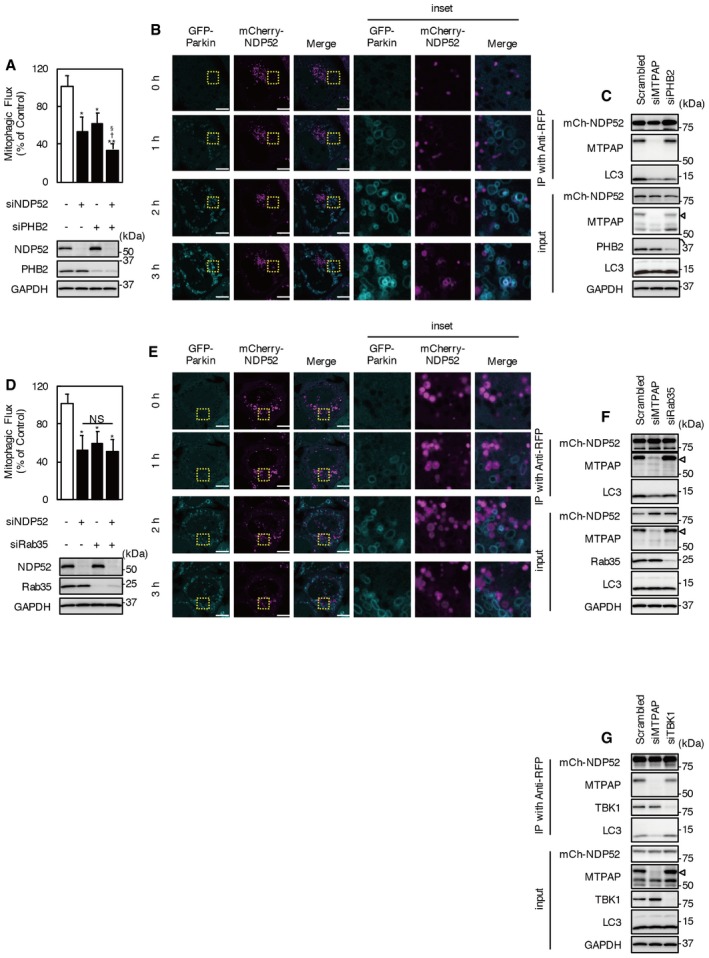
- Mitophagic flux in cells transfected with siNDP52, siPHB2, and a combination of siRNAs. Cells were incubated with valinomycin for 3 h. Results are a summary of three independent experiments. Values are the means ± SEM. *P < 0.05, **P < 0.01 vs. scrambled oligo‐transfected cells; †P < 0.05 vs. siNDP52‐transfected cells; §P < 0.05 vs. siPHB2‐transfected cells, determined with one‐way ANOVA followed by the Tukey–Kramer post hoc test.
- Images of PHB2 KD cells expressing mCherry‐NDP52 under valinomycin treatment. The images are from the upper movie of Movie EV8. Cyan, GFP‐Parkin; magenta, mCherry‐NDP52. Scale bars, 10 μm.
- mCherry‐NDP52 was expressed in MTPAP KD, PHB2 KD, and control cells. Lysates from cells treated with valinomycin and bafilomycin A1 for 2 h were subjected to immunoprecipitation using anti‐RFP beads. Immunoprecipitates were analyzed by Western blotting. The position of MTPAP is indicated by arrowheads.
- Mitophagic flux in cells transfected with combinations of siNDP52 and siRab35. Cells were incubated with valinomycin for 2 h. Results are a summary of three independent experiments. Values are the means ± SEM. *P < 0.05 vs. scrambled oligo‐transfected cells; NS, not significant.
- Images of Rab35 KD cells expressing mCherry‐NDP52 under valinomycin treatment. The images are from the lower movie of Movie EV8. Cyan, GFP‐Parkin; magenta, mCherry‐NDP52. Scale bars, 10 μm.
- mCherry‐NDP52 was expressed in MTPAP KD, Rab35 KD, and control cells. Lysates from cells treated with 1 μM valinomycin and 100 nM bafilomycin A1 for 2 h were subjected to immunoprecipitation using anti‐RFP beads. Immunoprecipitates were analyzed by Western blotting. The position of MTPAP is indicated by arrowheads.
- mCherry‐NDP52 was expressed in MTPAP KD, TBK1 KD, and control cells. Lysates from cells treated with 1 μM valinomycin and 100 nM bafilomycin A1 for 2 h were subjected to immunoprecipitation using anti‐RFP beads. Immunoprecipitates were analyzed by Western blotting. The position of MTPAP is indicated by arrowheads.
Source data are available online for this figure.
A small GTPase, Rab35, recruits NDP52 to damaged mitochondria 40. KD of Rab35 significantly reduced mitophagic flux after valinomycin treatment for 3 h (Fig EV4D), while cells with double KD of NDP52 and Rab35 showed a comparable level of mitophagic flux to cells treated with siRab35 or siNDP52 alone. KD of Rab35 did not influence the colocalization of mCherry‐NDP52 or GFP‐Parkin, or the invasion of mCherry‐NDP52 into mitochondria and the interaction between NDP52 and MTPAP (Fig EV4F). TBK1 facilitates the recruitment of NDP52 to damaged mitochondria by promoting the interaction of NDP52 with Rab35. We already concluded that NDP52 has TBK1‐independent function (Fig 4); however, TBK1 did phosphorylate NDP52 during valinomycin treatment. TBK1 KD did not influence the interaction between NDP52 and MTPAP, or the co‐precipitation of LC3 with NDP52 (Fig EV4G). These results indicate that the interaction between NDP52 and MTPAP is not regulated by Rab35 and TBK1.
Rab35 and TBK1 are involved in regulating the interaction between NDP52 and ubiquitin 40; therefore, we presumed that the NDP52–MTPAP interaction and irruption of NDP52 into mitochondria are part of a ubiquitin‐independent mechanism. Accordingly, we showed that NDP52∆LIM‐L, a ubiquitin‐binding‐deficient mutant of NDP52, interacts with MTPAP (Fig 2F). In addition, ubiquitin‐binding‐deficient mutants of NDP52 could partially restore mitophagic flux (Figs 2E and EV2D). To explore this mechanism further, we performed time‐lapse imaging of NDP52 D439R/C443K, a ubiquitin‐binding‐deficient point mutant, in the presence of valinomycin and bafilomycin A1 (Fig 7, Movie EV9). As with WT and NDP52∆LIM‐L, the NDP52 D439R/C443K mutant interacted with MTPAP (Fig 7A). mCherry‐NDP52 D439R/C443K was recruited to the edge of GFP‐Parkin‐ring structures as dots, but did not elongate along the mitochondria, although some mCherry‐NDP52 D439R/C443K entered mitochondria similarly to WT NDP52 (Fig 7B). These results indicate that NDP52 irrupts into mitochondria and interacts with MTPAP in a ubiquitin‐binding‐independent manner.
Figure 7. NDP52 irrupts into mitochondria in a ubiquitin‐binding‐independent manner.
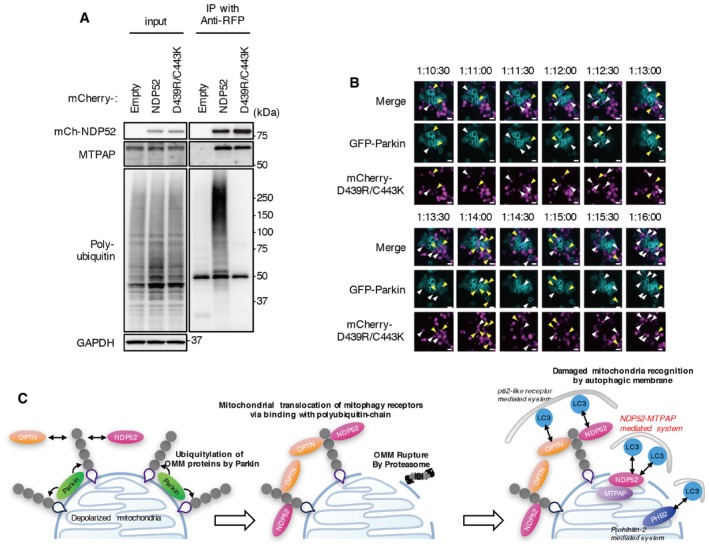
- HeLa‐GFP‐Parkin cells expressing mCherry‐NDP52 D439R/C443K mutant or WT NDP52 were incubated with valinomycin and nM bafilomycin A1 for 3 h. Cell lysates were subjected to immunoprecipitation using anti‐RFP magnetic beads. Immunoprecipitates were analyzed by Western blotting. Data are representative of two independent experiments.
- Selected frames from time‐lapse images of HeLa‐GFP‐Parkin cells expressing mCherry‐NDP52 D439R/C443K mutant under valinomycin and bafilomycin A1 treatment. The images are representative of two independent experiments and correspond to the boxed regions of Movie EV9. Cyan, GFP‐Parkin; magenta, mCherry‐NDP52 D439R/C443K. The white arrowheads indicate colocalization of GFP‐Parkin and mCherry‐NDP52. The yellow arrowheads indicate mCherry‐NDP existing inside GFP‐Parkin‐ring structures. Scale bars, 1 μm.
- Schematic model of damaged mitochondria recognition systems by autophagic membrane via NDP52–MTPAP interaction. On depolarized mitochondria, Parkin is activated and generates poly‐ubiquitin chains on the OMM. The accumulation of poly‐ubiquitin chains on the OMM induces the recruitment of mitophagy receptors and OMM rupture by proteasomes. NDP52 irrupts into mitochondria and interacts with MTPAP OMM rupture‐dependently. The autophagic membrane recognizes damaged mitochondria by (i) poly‐ubiquitin‐bound mitophagy receptors on the OMM (p62‐like receptor‐mediated system), (ii) PHB2 on the IMM (prohibitin‐2‐mediated system), and (iii) the NDP52–MTPAP complex (NDP52–MTPAP‐mediated system) via affinity with Atg8s (LC3 and GABARAP family).
Source data are available online for this figure.
Figure EV5. xLIR motif and WXXL motifs in human MTPAP.
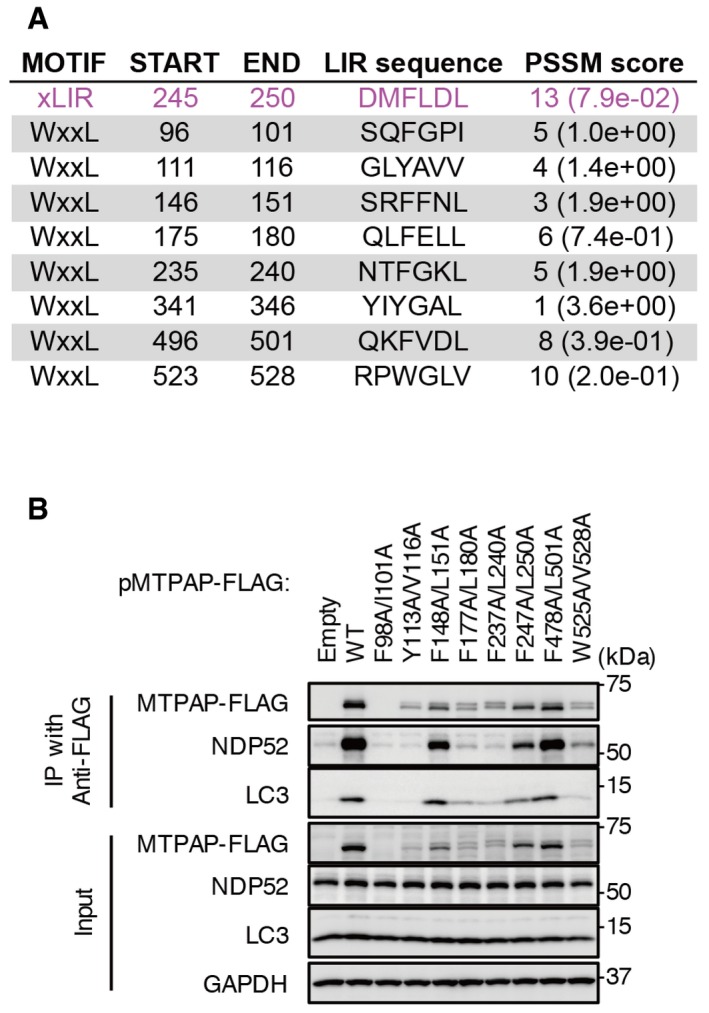
- One xLIR motif and nine WXXL motifs of human MTPAP were identified by the iLIR online server.
- HeLa‐GFP‐Parkin cells expressing xLIR mutant and WXXL mutants of MTPAP‐FLAG incubated with valinomycin and bafilomycin A1 for 3 h. Cell lysates were subjected to immunoprecipitation with anti‐FLAG magnetic beads. Immunoprecipitates were analyzed by Western blotting.
Discussion
Autophagy receptors contribute to the autophagic recognition of damaged or redundant mitochondria. Some OMM‐anchored proteins, such as Atg32 in yeast and NIX/Bnip3L, Bnip3, FUNDC1, and Bcl2‐L‐13 in mammals, function as mitophagy receptor proteins 41, 42, 43, 44, 45, 46, 47, 48. In addition to OMM‐anchored proteins, an IMM protein, PHB2, is a mitophagy receptor both for Parkin‐mediated mitophagy in mammalian cells and for paternal mitochondrial clearance in Caenorhabditis elegans 36. These adaptors directly interact with Atg8 family proteins on the surface of mitochondria via an LIR motif and recruit autophagic membranes.
In the process of Parkin‐mediated mitophagy, the poly‐ubiquitin chain produced by Parkin induces accumulation of p62‐like autophagic adaptors, which contain both ubiquitin and LIR motifs, and subsequently recruits autophagic machinery to depolarized mitochondria. OPTN and NDP52 (and TAX1BP1 to some extent) are essential for PINK1/Parkin‐mediated mitophagy, but nonessential adaptors, such as p62 and NBR1, also contribute to the efficiency of autophagic engulfment of damaged mitochondria 14. In addition to their adaptor roles, each adaptor has a distinct function in the autophagic process. For example, p62 mediates aggresome formation of misfolded proteins via its N‐terminal PB1 domain after ubiquitylation 49, as well as ubiquitylation‐dependent clustering of damaged mitochondria during mitophagy 50, 51. OPTN recruits TBK1 to protein aggregates or depolarized mitochondria 26, 52. NDP52 detects pathogens via an interaction with galectin 8, which functions as a receptor for vesicle‐damaging pathogens in xenophagy 18. Nevertheless, differences in their roles during the mitophagic process have not yet been reported.
In this study, we focused on the role of NDP52 in Parkin‐mediated mitophagy. Unlike OPTN, NDP52 partially localized to damaged mitochondria. Deletion mutagenesis revealed that two functional domains of NDP52, LIM‐L and SKICH, are required for NDP52 function in mitophagy (Fig 2E). The LIM‐L domain contains a ubiquitin‐binding zinc finger motif, and we clarified that the SKICH domain is required for binding with MTPAP (Fig 4C). Both of these NDP52 domains cooperate in the recognition of damaged mitochondria by autophagy.
Mitochondrial RNA poly(A) polymerase is a noncanonical poly(A) polymerase that polyadenylates mitochondrial RNAs. This polyadenylation is required to complete the stop codon (UAA) for some mitochondrial mRNAs, and to regulate RNA stability 53. MTPAP may also be important for the maturation of mitochondrial tRNAs. In addition, it was reported that a homozygous N478D missense mutation in the MTPAP gene causes an autosomal recessive spastic ataxia with optic atrophy (SPAX4) 39, 54.
In addition to its previously reported function, we show that NDP52 irrupts into mitochondria and interacts with MTPAP in a ubiquitin‐binding‐independent manner (Fig 7A and B). As is the case for the interaction between LC3 and PHB2, Parkin and proteasomal OMM rupture are required for the interaction (Fig 5C–E). In addition, the interaction between NDP52 and MTPAP is induced not only by mitochondria uncoupler treatment but also by iron chelator treatment (Fig 5E and F). However, how NDP52 irrupts into the mitochondrial matrix is still unclear. There may be two possible mechanisms involved in the irruption of NDP52 into the mitochondrial matrix: IMM rupture and an unknown transport mechanism. We do not have direct evidence to explain the molecular mechanism for NDP52 irruption. Future work is required to address how NDP52 irrupts into the mitochondrial matrix. The interaction intensifies the affinity with LC3 resulting in enhancement of mitophagosome formation. Both deletion of the NDP52 SKICH domain and KD of MTPAP increased the localization of NDP52 on depolarized mitochondria during valinomycin treatment, indicating that NDP52 interacting with MTPAP is quickly degraded by autophagy. However, KD of MTPAP did not influence valinomycin‐induced degradation of endogenous NDP52 (Fig 4D). Therefore, the interaction of NDP52 with MTPAP is not required for the degradation of NDP52 but is important for the recognition of damaged mitochondria by the autophagic machinery. Both NDP52 and MTPAP form homodimers 38, 23. Formation of an oligomeric complex consisting of NDP52 and MTPAP is presumably important for the autophagic recognition of damaged mitochondria; however, how MTPAP contributes to the interaction between LC3 and NDP52 is unclear. It is possible that MTPAP influences the steric structure of NDP52 via complex formation.
iLIR, a web resource for the prediction of Atg8‐family interacting proteins 55, revealed that human MTPAP has an extended LIR (xLIR) motif and eight WXXL motifs (Fig EV5A). MTPAP may contribute by attracting LC3 via one or some of these LIR motifs to increase mitophagy of NDP52‐positive mitochondria. We have tried to express MTPAP LIR mutants in mammalian cells and bacteria. However, expression of such mutants was not comparable to wild‐type MTPAP, and we could not conclude whether the LIR motifs contribute to the interaction between the NDP52–MTPAP complex and LC3 (Fig EV5B). Therefore, how MTPAP contributes to mitophagy is still uncertain.
Taken together, our data show a novel functional protein complex consisting of NDP52 and MTPAP, which contributes to the ubiquitin‐independent recognition of OMM‐ruptured mitochondria and facilitates the autophagic elimination of damaged mitochondria via autophagy (Fig 7C).
Materials and Methods
Antibodies and reagents
Anti‐NDP52 (#9036, for WB), anti‐Parkin (#4211), anti‐LC3A/B (#12741), anti‐phospho‐TBK1 (Ser172; #5483), anti‐TFAM (#8076), and anti‐ubiquitin (#3936) antibodies were obtained from Cell Signaling Technology (Boston, MA, USA). Anti‐OPA1 (612606) and anti‐Tim23 (61222) antibodies were obtained from BD Transduction Laboratories (San Jose, CA, USA). Anti‐p62 (GP62‐C) antibody was obtained from Progen (Heidelberg, Germany). Anti‐RFP antibody (M208‐3) and anti‐RFP magnetic beads (M165‐9) were obtained from MBL (Nagoya, Japan). Anti‐Tom20 (sc‐11415) and anti‐GAPDH (sc‐25778) antibodies were obtained from Santa Cruz Biotechnology (Dallas, TX, USA). Anti‐NDP52 (ab68588, for IF and IP), anti‐MTPAP (ab71618), and anti‐TBK1 (ab40676) antibodies were obtained from Abcam (Cambridge, UK). Anti‐MTPAP (NBP2‐43686) and anti‐Lamp2 (NBP2‐22217) antibodies were from Novus (Littleton, CO, USA). Anti‐NDP52 (66401‐1‐Ig, for WB), anti‐OPTN (10837‐1‐AP), anti‐PHB2 (66424‐1‐Ig), and anti‐Rab35 (11329‐2‐AP) antibodies were from Proteintech (Rosemont, IL, USA). Anti‐MFN1 (H00055669‐M04) antibody was obtained from Abnova (Taipei, Taiwan). Anti‐DYKDDDDK tag antibody and DYKDDDDK tag antibody magnetic beads were from Wako Laboratory Chemicals (017‐25151, Osaka, Japan). Alexa 594‐ and Alexa 647‐conjugated secondary antibodies were obtained from Thermo Fisher Scientific (Waltham, MA, USA). Anti‐phospho‐p62 (S403) antibody was a kind gift from Dr. Gen Matsumoto (Nagasaki University). Valinomycin, bafilomycin A1, and siRNA oligo for human Rab35 were obtained from Sigma‐Aldrich (St. Louis, MO, USA). Epoxomicin was obtained from Peptide Institute, Inc. (Osaka, Japan). ON‐TARGETplus human siRNA oligos for NDP52 (L‐010637‐00‐0005), OPTN (L‐016269‐00‐0005), TBK1 (L‐003788‐00‐0005), MTPAP (L‐016486‐01‐0005), FIP200 (L‐021117‐00‐0005), PHB2 (L‐018703‐00‐0005), and scrambled siRNA (D‐001810‐10‐20) were from GE Dharmacon (Lafayette, CO, USA).
Plasmid construction
Human NDP52 and MTPAP were cloned by PCR using HeLa cell cDNA as the template. To construct expression plasmids of NDP52, NDP52 mutants, or MTPAP, PCR products and mCherry‐ or FLAG‐tag were ligated into pcDNA3.1‐Hyg (+) (Life Technologies, Carlsbad, CA, USA). To construct pMTS‐TagBFP, the mitochondrial targeting sequence of human PINK1 was ligated into pTagBFP‐N (Evrogen, Moscow, Russia).
Cell culture and transfection
HeLa‐GFP‐Parkin cells were a kind gift from Dr. Noriyuki Matsuda (Tokyo Metropolitan Institute of Medical Science, Japan). Plasmid DNA was transfected into cells using Lipofectamine 2000 (Life Technologies), according to the manufacturer's instructions. Forty‐eight hours after transfection, cells were used for experiments. For RNA interference experiments, siRNA oligos were transfected into cells using Lipofectamine RNAiMAX (Life Technologies), according to the manufacturer's instructions. Seventy‐two hours after siRNA transfection, cells were used for experiments.
Immunofluorescence staining
Cells grown on glass‐chamber slides were fixed in 4% paraformaldehyde. For immunostaining, cells were incubated with appropriate primary antibodies followed by Alexa Fluor 594‐ or Alexa Fluor 647‐conjugated secondary antibodies. Fluorescence staining was visualized using an Olympus FV1000 confocal microscope or a Zeiss LSM880 microscope. Quantification of colocalization was performed using ImageJ software.
Time‐lapse imaging
Live‐cell fluorescence images were acquired using a Zeiss LSM880 confocal microscope with Airyscan (Carl Zeiss). Cells expressing fluorescent proteins were cultured in glass‐bottomed dishes. During live‐cell imaging, the dish was set in a chamber to maintain temperature, humidity, and atmosphere (37°C, 95, and 5% CO2/95% O2, respectively). To avoid Z position drifting, cells were observed on a single focal plane using Definite Focus.
Electron microscopy
Cells incubated with 1 μM valinomycin and 100 nM bafilomycin A1 were fixed with 2.5% glutaraldehyde in 0.1 M phosphate buffer (pH 7.4) for 2 h and then post‐fixed in 1% osmium tetroxide in 0.1 M phosphate buffer for 1 h. Fixed cells were dehydrated and embedded in Epon 812. For immunoelectron microscopy, cells were fixed with 2% paraformaldehyde and 0.05% glutaraldehyde in 0.1 M phosphate buffer (pH 7.4) and embedded in LR white resin. Ultrathin sections were stained with uranyl acetate and lead citrate and observed using a Hitachi HT7700 transmission electron microscope.
Mitophagy assay
For quantification of mitophagic flux, cells were treated with Mtphagy dye (Mitophagy Detection Kit; Dojindo Molecular Technologies, Rockville, USA) according to the manufacturer's protocol. Fluorescence intensity of Mtphagy dye (excitation 530 nm; emission 700 nm) was measured using a SpectraMax iD3 multi‐mode microplate reader (Molecular Devices). Increased Mtphagy dye fluorescence intensity during valinomycin treatment indicated the progression of mitophagy. For fluorescence quantification of mitophagosome formation, mCherry‐LC3‐ and MTS‐TagBFP‐expressing cells were seeded in SensoPlate glass‐bottom 24‐well plates (Greiner Japan, Tokyo, Japan). mCherry‐LC3 and MTS‐TagBFP colocalization was quantified using IN Cell Analyzer (GE Healthcare). For electron microscopy, the percentage of the mitophagosome (mitochondria sequestered within a double membrane) area within the total mitochondrial area was quantified.
Immunoprecipitation
HeLa‐GFP‐Parkin cells or cells expressing mCherry‐tagged or FLAG‐tagged protein (90% confluency) were treated with valinomycin and bafilomycin A1. Cells were washed with ice‐cold PBS and lysed in lysis buffer (50 mM Tris–HCl, 150 mM NaCl, 1 mM EDTA, 1% Triton X‐100, and 1% NP‐40) containing a protease and phosphatase inhibitor cocktail (Roche Diagnostics, 11873580001; 04906837001) for 20 min on ice. Protein concentration of supernatants obtained after centrifugation at 12,500 × g for 10 min at 4°C was determined by BCA protein assay. Cell lysates were incubated with anti‐RFP mAb magnetic beads, anti‐DYKDDDDK tag antibody magnetic beads, or anti‐NDP52 antibody followed by protein A‐conjugated magnetic beads for 2 h at 4°C with rotation. Immunoprecipitates were washed five times with lysis buffer and eluted in SDS–PAGE sample buffer.
Trypsin protection assay
Mitochondria‐rich fractions were prepared from HeLa‐GFP‐Parkin cells using Mitochondria Isolation Kit for Culture Cells (Thermo Scientific #89874). Mitochondria‐rich fractions were incubated with 0–1,000 μg/ml trypsin for 30 min on ice. To terminate the enzyme reaction, SDS–PAGE sample buffer was added and the samples boiled for 5 min. Trypsin digestion profiles were analyzed by Western blotting of mitochondrial marker proteins.
Pull‐down assay
Constructs including NDP52, LC3, and MTPAP aa44–547 were cloned into pGEX‐6P1, and transformed into E. coli Rosetta (DE3) pLysS competent cells (Novagen). The proteins were overexpressed overnight at 18°C in the presence of 0.4 mM isopropyl‐β‐D‐thiogalactopyranoside (IPTG). Proteins were purified using glutathione‐Sepharose 4B. GST‐tagged NDP52 bound to glutathione‐Sepharose 4B resin was used as a bait for pull‐down assays. For prey protein preparation, the GST‐tag was proteolytically removed by overnight incubation with PreScission protease at 4°C. GST‐tagged NDP52 bound to glutathione‐Sepharose 4B resin was incubated with prey proteins at 4°C for 2 h and then washed five times. Proteins bound to glutathione‐Sepharose 4B resin were suspended in SDS–PAGE sample buffer and subjected to Western blotting.
Western blotting
Cells were lysed in lysis buffer. Lysates were centrifuged at 12,500 × g for 10 min at 4°C to remove debris. Supernatants or immunoprecipitates were analyzed by SDS–PAGE followed by Western blotting. Densitometric analyses of proteins were performed as previously described 56. For the detection of phosphorylated proteins, Phos‐tag gel (Wako Laboratory Chemicals, Osaka, Japan) gel was used.
Mass spectrometry
Lysates from cells expressing mCherry‐NDP52 or mCherry‐NDP52 ∆SKICH were subjected to immunoprecipitation with anti‐RFP magnetic beads. Immunoprecipitates were separated by SDS–PAGE and visualized by silver staining. Specific bands from mCherry‐NDP52‐expressing cells were excised and digested in the gel with trypsin. The resulting peptide mixtures were analyzed using a TripleTOF 5600 mass spectrometer (AB SCIEX). For iTRAQ chemical labeling, anti‐RFP immunoprecipitates were digested with trypsin and then labeled with iTRAQ reagents according to the manufacturer's protocol (AB SCIEX, Framingham, MA, USA). The resulting peptide mixtures were analyzed on a TripleTOF 5600 mass spectrometer. Mass spectrometry data were analyzed with ProteinPilot 5.0 software (AB SCIEX) using the UniProt database. A confidence cutoff of 1% FDR (false discovery rate) was applied for protein identification.
Statistics
Data are expressed as the mean ± SD or the mean ± SEM. Differences between groups were examined for statistical significance using one‐way ANOVA followed by the Tukey–Kramer post hoc test or Student's t‐test. P‐values < 0.05 were considered statistically significant.
Author contributions
Conceptualization: NF; Investigation: NF, SKak, KS, MA, RN, AS, and SKaz; Writing—Original Draft: NF; Writing—Review & Editing: NF; Funding Acquisition: NF, SS, and NH; and Supervision: NF, SS, and NH.
Conflict of interest
The authors declare that they have no conflict of interest.
Supporting information
Expanded View Figures PDF
Table EV1
Movie EV1
Movie EV2
Movie EV3
Movie EV4
Movie EV5
Movie EV6
Movie EV7
Movie EV8
Movie EV9
Source Data for Expanded View
Review Process File
Source Data for Figure 1
Source Data for Figure 2
Source Data for Figure 3
Source Data for Figure 4
Source Data for Figure 5
Source Data for Figure 6
Source Data for Figure 7
Acknowledgements
We thank Dr. N. Matsuda, Dr. G. Matsumoto, and Dr. M. Ichimura for providing experimental materials, and Dr. T. Ueno and Dr. I. Tanida for helpful discussions. This work was supported by Grants‐in‐Aid for Scientific Research (C) (24500868, 15K09325 to N.F.), Grants‐in‐Aid for Scientific Research on Innovative Areas [23111003 (to N.H.), 25111007 (to S.S.)], Grants‐in‐Aid for Scientific Research (B) [24390224 (to N.H.), 15H04842 (to N.H.), 15H04843 (to S.S.)], and the MEXT‐supported Program for the Scientific Research Foundation at Private Universities, 2014–2017 (to N.F.). We thank Jeremy Allen, PhD, from Edanz Group (http://www.edanzediting.com/ac) for editing a draft of this manuscript.
EMBO Reports (2018) 19: e46363
Contributor Information
Norihiko Furuya, Email: nohuruya@juntendo.ac.jp.
Nobutaka Hattori, Email: nhattori@juntendo.ac.jp.
References
- 1. Mizushima N, Komatsu M (2011) Autophagy: renovation of cells and tissues. Cell 147: 728–741 [DOI] [PubMed] [Google Scholar]
- 2. Lamb CA, Yoshimori T, Tooze SA (2013) The autophagosome: origins unknown, biogenesis complex. Nat Rev Mol Cell Biol 14: 759–774 [DOI] [PubMed] [Google Scholar]
- 3. Pickrell AM, Youle RJ (2015) The roles of PINK1, parkin, and mitochondrial fidelity in Parkinson's disease. Neuron 85: 257–273 [DOI] [PMC free article] [PubMed] [Google Scholar]
- 4. Bratic A, Larsson NG (2013) The role of mitochondria in aging. J Clin Invest 123: 951–957 [DOI] [PMC free article] [PubMed] [Google Scholar]
- 5. Wallace DC (2012) Mitochondria and cancer. Nat Rev Cancer 12: 685–698 [DOI] [PMC free article] [PubMed] [Google Scholar]
- 6. Pagano G, Talamanca AA, Castello G, Cordero MD, d'Ischia M, Gadaleta MN, Pallardo FV, Petrovic S, Tiano L, Zatterale A (2014) Oxidative stress and mitochondrial dysfunction across broad‐ranging pathologies: toward mitochondria‐targeted clinical strategies. Oxid Med Cell Longev 2014: 541230 [DOI] [PMC free article] [PubMed] [Google Scholar]
- 7. Szendroedi J, Phielix E, Roden M (2012) The role of mitochondria in insulin resistance and type 2 diabetes mellitus. Nat Rev Endocrinol 8: 92–103 [DOI] [PubMed] [Google Scholar]
- 8. Lezi E, Swerdlow RH (2012) Mitochondria in neurodegeneration. Adv Exp Med Biol 942: 269–286 [DOI] [PMC free article] [PubMed] [Google Scholar]
- 9. Jin SM, Lazarou M, Wang C, Kane LA, Narendra DP, Youle RJ (2010) Mitochondrial membrane potential regulates PINK1 import and proteolytic destabilization by PARL. J Cell Biol 191: 933–942 [DOI] [PMC free article] [PubMed] [Google Scholar]
- 10. Kane LA, Lazarou M, Fogel AI, Li Y, Yamano K, Sarraf SA, Banerjee S, Youle RJ (2014) PINK1 phosphorylates ubiquitin to activate Parkin E3 ubiquitin ligase activity. J Cell Biol 205: 143–153 [DOI] [PMC free article] [PubMed] [Google Scholar]
- 11. Koyano F, Okatsu K, Kosako H, Tamura Y, Go E, Kimura M, Kimura Y, Tsuchiya H, Yoshihara H, Hirokawa T et al (2014) Ubiquitin is phosphorylated by PINK1 to activate parkin. Nature 510: 162–166 [DOI] [PubMed] [Google Scholar]
- 12. Ordureau A, Sarraf SA, Duda DM, Heo JM, Jedrychowski MP, Sviderskiy VO, Olszewski JL, Koerber JT, Xie T, Beausoleil SA et al (2014) Quantitative proteomics reveal a feedforward mechanism for mitochondrial PARKIN translocation and ubiquitin chain synthesis. Mol Cell 56: 360–375 [DOI] [PMC free article] [PubMed] [Google Scholar]
- 13. Stolz A, Ernst A, Dikic I (2014) Cargo recognition and trafficking in selective autophagy. Nat Cell Biol 16: 495–501 [DOI] [PubMed] [Google Scholar]
- 14. Lazarou M, Sliter DA, Kane LA, Sarraf SA, Wang C, Burman JL, Sideris DP, Fogel AI, Youle RJ (2015) The ubiquitin kinase PINK1 recruits autophagy receptors to induce mitophagy. Nature 524: 309–314 [DOI] [PMC free article] [PubMed] [Google Scholar]
- 15. Heo JM, Ordureau A, Paulo JA, Rinehart J, Harper JW (2015) The PINK1‐PARKIN mitochondrial ubiquitylation pathway drives a program of OPTN/NDP52 recruitment and TBK1 activation to promote mitophagy. Mol Cell 60: 7–20 [DOI] [PMC free article] [PubMed] [Google Scholar]
- 16. Thurston TL, Ryzhakov G, Bloor S, von Muhlinen N, Randow F (2009) The TBK1 adaptor and autophagy receptor NDP52 restricts the proliferation of ubiquitin‐coated bacteria. Nat Immunol 10: 1215–1221 [DOI] [PubMed] [Google Scholar]
- 17. von Muhlinen N, Akutsu M, Ravenhill BJ, Foeglein A, Bloor S, Rutherford TJ, Freund SM, Komander D, Randow F (2012) LC3C, bound selectively by a noncanonical LIR motif in NDP52, is required for antibacterial autophagy. Mol Cell 48: 329–342 [DOI] [PMC free article] [PubMed] [Google Scholar]
- 18. Thurston TL, Wandel MP, von Muhlinen N, Foeglein A, Randow F (2012) Galectin 8 targets damaged vesicles for autophagy to defend cells against bacterial invasion. Nature 482: 414–418 [DOI] [PMC free article] [PubMed] [Google Scholar]
- 19. Verlhac P, Gregoire IP, Azocar O, Petkova DS, Baguet J, Viret C, Faure M (2015) Autophagy receptor NDP52 regulates pathogen‐containing autophagosome maturation. Cell Host Microbe 17: 515–525 [DOI] [PubMed] [Google Scholar]
- 20. Matsuda N, Sato S, Shiba K, Okatsu K, Saisho K, Gautier CA, Sou YS, Saiki S, Kawajiri S, Sato F et al (2010) PINK1 stabilized by mitochondrial depolarization recruits Parkin to damaged mitochondria and activates latent Parkin for mitophagy. J Cell Biol 189: 211–221 [DOI] [PMC free article] [PubMed] [Google Scholar]
- 21. Gegg ME, Cooper JM, Chau KY, Rojo M, Schapira AH, Taanman JW (2010) Mitofusin 1 and mitofusin 2 are ubiquitinated in a PINK1/parkin‐dependent manner upon induction of mitophagy. Hum Mol Genet 19: 4861–4870 [DOI] [PMC free article] [PubMed] [Google Scholar]
- 22. Wong YC, Holzbaur EL (2014) Optineurin is an autophagy receptor for damaged mitochondria in parkin‐mediated mitophagy that is disrupted by an ALS‐linked mutation. Proc Natl Acad Sci USA 111: E4439–E4448 [DOI] [PMC free article] [PubMed] [Google Scholar]
- 23. Kim BW, Hong SB, Kim JH, Kwon DH, Song HK (2013) Structural basis for recognition of autophagic receptor NDP52 by the sugar receptor galectin‐8. Nat Commun 4: 1613 [DOI] [PubMed] [Google Scholar]
- 24. Inomata M, Niida S, Shibata K, Into T (2012) Regulation of Toll‐like receptor signaling by NDP52‐mediated selective autophagy is normally inactivated by A20. Cell Mol Life Sci 69: 963–979 [DOI] [PMC free article] [PubMed] [Google Scholar]
- 25. Xie X, Li F, Wang Y, Wang Y, Lin Z, Cheng X, Liu J, Chen C, Pan L (2015) Molecular basis of ubiquitin recognition by the autophagy receptor CALCOCO2. Autophagy 11: 1775–1789 [DOI] [PMC free article] [PubMed] [Google Scholar]
- 26. Matsumoto G, Shimogori T, Hattori N, Nukina N (2015) TBK1 controls autophagosomal engulfment of polyubiquitinated mitochondria through p62/SQSTM1 phosphorylation. Hum Mol Genet 24: 4429–4442 [DOI] [PubMed] [Google Scholar]
- 27. Richter B, Sliter DA, Herhaus L, Stolz A, Wang C, Beli P, Zaffagnini G, Wild P, Martens S, Wagner SA et al (2016) Phosphorylation of OPTN by TBK1 enhances its binding to Ub chains and promotes selective autophagy of damaged mitochondria. Proc Natl Acad Sci USA 113: 4039–4044 [DOI] [PMC free article] [PubMed] [Google Scholar]
- 28. Li S, Wang L, Berman M, Kong YY, Dorf ME (2011) Mapping a dynamic innate immunity protein interaction network regulating type I interferon production. Immunity 35: 426–440 [DOI] [PMC free article] [PubMed] [Google Scholar]
- 29. Newman AC, Kemp AJ, Drabsch Y, Behrends C, Wilkinson S (2017) Autophagy acts through TRAF3 and RELB to regulate gene expression via antagonism of SMAD proteins. Nat Commun 8: 1537 [DOI] [PMC free article] [PubMed] [Google Scholar]
- 30. Tomecki R, Dmochowska A, Gewartowski K, Dziembowski A, Stepien PP (2004) Identification of a novel human nuclear‐encoded mitochondrial poly(A) polymerase. Nucleic Acids Res 32: 6001–6014 [DOI] [PMC free article] [PubMed] [Google Scholar]
- 31. Nagaike T, Suzuki T, Katoh T, Ueda T (2005) Human mitochondrial mRNAs are stabilized with polyadenylation regulated by mitochondria‐specific poly(A) polymerase and polynucleotide phosphorylase. J Biol Chem 280: 19721–19727 [DOI] [PubMed] [Google Scholar]
- 32. Mullen TE, Marzluff WF (2008) Degradation of histone mRNA requires oligouridylation followed by decapping and simultaneous degradation of the mRNA both 5′ to 3′ and 3′ to 5′. Genes Dev 22: 50–65 [DOI] [PMC free article] [PubMed] [Google Scholar]
- 33. Truscott KN, Brandner K, Pfanner N (2003) Mechanisms of protein import into mitochondria. Curr Biol 13: R326–R337 [DOI] [PubMed] [Google Scholar]
- 34. Mokranjac D, Neupert W (2005) Protein import into mitochondria. Biochem Soc Trans 33: 1019–1023 [DOI] [PubMed] [Google Scholar]
- 35. Lazarou M, Jin SM, Kane LA, Youle RJ (2012) Role of PINK1 binding to the TOM complex and alternate intracellular membranes in recruitment and activation of the E3 ligase Parkin. Dev Cell 22: 320–333 [DOI] [PMC free article] [PubMed] [Google Scholar]
- 36. Wei Y, Chiang WC, Sumpter R Jr, Mishra P, Levine B (2017) Prohibitin 2 is an inner mitochondrial membrane mitophagy receptor. Cell 168: 224–238 e210 [DOI] [PMC free article] [PubMed] [Google Scholar]
- 37. Allen GF, Toth R, James J, Ganley IG (2013) Loss of iron triggers PINK1/Parkin‐independent mitophagy. EMBO Rep 14: 1127–1135 [DOI] [PMC free article] [PubMed] [Google Scholar]
- 38. Bai Y, Srivastava SK, Chang JH, Manley JL, Tong L (2011) Structural basis for dimerization and activity of human PAPD1, a noncanonical poly(A) polymerase. Mol Cell 41: 311–320 [DOI] [PMC free article] [PubMed] [Google Scholar]
- 39. Lapkouski M, Hallberg BM (2015) Structure of mitochondrial poly(A) RNA polymerase reveals the structural basis for dimerization, ATP selectivity and the SPAX4 disease phenotype. Nucleic Acids Res 43: 9065–9075 [DOI] [PMC free article] [PubMed] [Google Scholar]
- 40. Minowa‐Nozawa A, Nozawa T, Okamoto‐Furuta K, Kohda H, Nakagawa I (2017) Rab35 GTPase recruits NDP52 to autophagy targets. EMBO J 36: 3405 [DOI] [PMC free article] [PubMed] [Google Scholar]
- 41. Hanna RA, Quinsay MN, Orogo AM, Giang K, Rikka S, Gustafsson AB (2012) Microtubule‐associated protein 1 light chain 3 (LC3) interacts with Bnip3 protein to selectively remove endoplasmic reticulum and mitochondria via autophagy. J Biol Chem 287: 19094–19104 [DOI] [PMC free article] [PubMed] [Google Scholar]
- 42. Kanki T, Wang K, Cao Y, Baba M, Klionsky DJ (2009) Atg32 is a mitochondrial protein that confers selectivity during mitophagy. Dev Cell 17: 98–109 [DOI] [PMC free article] [PubMed] [Google Scholar]
- 43. Liu L, Feng D, Chen G, Chen M, Zheng Q, Song P, Ma Q, Zhu C, Wang R, Qi W et al (2012) Mitochondrial outer‐membrane protein FUNDC1 mediates hypoxia‐induced mitophagy in mammalian cells. Nat Cell Biol 14: 177–185 [DOI] [PubMed] [Google Scholar]
- 44. Okamoto K, Kondo‐Okamoto N, Ohsumi Y (2009) Mitochondria‐anchored receptor Atg32 mediates degradation of mitochondria via selective autophagy. Dev Cell 17: 87–97 [DOI] [PubMed] [Google Scholar]
- 45. Murakawa T, Yamaguchi O, Hashimoto A, Hikoso S, Takeda T, Oka T, Yasui H, Ueda H, Akazawa Y, Nakayama H et al (2015) Bcl‐2‐like protein 13 is a mammalian Atg32 homologue that mediates mitophagy and mitochondrial fragmentation. Nat Commun 6: 7527 [DOI] [PMC free article] [PubMed] [Google Scholar]
- 46. Sandoval H, Thiagarajan P, Dasgupta SK, Schumacher A, Prchal JT, Chen M, Wang J (2008) Essential role for Nix in autophagic maturation of erythroid cells. Nature 454: 232–235 [DOI] [PMC free article] [PubMed] [Google Scholar]
- 47. Schweers RL, Zhang J, Randall MS, Loyd MR, Li W, Dorsey FC, Kundu M, Opferman JT, Cleveland JL, Miller JL et al (2007) NIX is required for programmed mitochondrial clearance during reticulocyte maturation. Proc Natl Acad Sci USA 104: 19500–19505 [DOI] [PMC free article] [PubMed] [Google Scholar]
- 48. Zhu Y, Massen S, Terenzio M, Lang V, Chen‐Lindner S, Eils R, Novak I, Dikic I, Hamacher‐Brady A, Brady NR (2013) Modulation of serines 17 and 24 in the LC3‐interacting region of Bnip3 determines pro‐survival mitophagy versus apoptosis. J Biol Chem 288: 1099–1113 [DOI] [PMC free article] [PubMed] [Google Scholar]
- 49. Bjorkoy G, Lamark T, Brech A, Outzen H, Perander M, Overvatn A, Stenmark H, Johansen T (2005) p62/SQSTM1 forms protein aggregates degraded by autophagy and has a protective effect on huntingtin‐induced cell death. J Cell Biol 171: 603–614 [DOI] [PMC free article] [PubMed] [Google Scholar]
- 50. Narendra D, Kane LA, Hauser DN, Fearnley IM, Youle RJ (2010) p62/SQSTM1 is required for Parkin‐induced mitochondrial clustering but not mitophagy; VDAC1 is dispensable for both. Autophagy 6: 1090–1106 [DOI] [PMC free article] [PubMed] [Google Scholar]
- 51. Okatsu K, Saisho K, Shimanuki M, Nakada K, Shitara H, Sou YS, Kimura M, Sato S, Hattori N, Komatsu M et al (2010) p62/SQSTM1 cooperates with Parkin for perinuclear clustering of depolarized mitochondria. Genes Cells 15: 887–900 [DOI] [PMC free article] [PubMed] [Google Scholar]
- 52. Korac J, Schaeffer V, Kovacevic I, Clement AM, Jungblut B, Behl C, Terzic J, Dikic I (2013) Ubiquitin‐independent function of optineurin in autophagic clearance of protein aggregates. J Cell Sci 126: 580–592 [DOI] [PMC free article] [PubMed] [Google Scholar]
- 53. Chang JH, Tong L (2012) Mitochondrial poly(A) polymerase and polyadenylation. Biochim Biophys Acta 1819: 992–997 [DOI] [PMC free article] [PubMed] [Google Scholar]
- 54. Crosby AH, Patel H, Chioza BA, Proukakis C, Gurtz K, Patton MA, Sharifi R, Harlalka G, Simpson MA, Dick K et al (2010) Defective mitochondrial mRNA maturation is associated with spastic ataxia. Am J Hum Genet 87: 655–660 [DOI] [PMC free article] [PubMed] [Google Scholar]
- 55. Kalvari I, Tsompanis S, Mulakkal NC, Osgood R, Johansen T, Nezis IP, Promponas VJ (2014) iLIR: a web resource for prediction of Atg8‐family interacting proteins. Autophagy 10: 913–925 [DOI] [PMC free article] [PubMed] [Google Scholar]
- 56. Furuya N, Ikeda S, Sato S, Soma S, Ezaki J, Oliva Trejo JA, Takeda‐Ezaki M, Fujimura T, Arikawa‐Hirasawa E, Tada N et al (2014) PARK2/Parkin‐mediated mitochondrial clearance contributes to proteasome activation during slow‐twitch muscle atrophy via NFE2L1 nuclear translocation. Autophagy 10: 631–641 [DOI] [PMC free article] [PubMed] [Google Scholar]
Associated Data
This section collects any data citations, data availability statements, or supplementary materials included in this article.
Supplementary Materials
Expanded View Figures PDF
Table EV1
Movie EV1
Movie EV2
Movie EV3
Movie EV4
Movie EV5
Movie EV6
Movie EV7
Movie EV8
Movie EV9
Source Data for Expanded View
Review Process File
Source Data for Figure 1
Source Data for Figure 2
Source Data for Figure 3
Source Data for Figure 4
Source Data for Figure 5
Source Data for Figure 6
Source Data for Figure 7