

Abstract
Drought is the most significant environmental stress for agricultural production worldwide, and tremendous efforts have been made to improve crop yield under the increasing water scarcity. Transcription factors are major players in the regulation of water stress-related genes in plants. Recently, different MYB transcription factors were characterized for their involvement in drought response. A sugarcane R2R3-MYB gene (ScMYBAS1) and its four alternative forms of transcript (ScMYAS1-2, ScMYBAS1-3, ScMYBAS1-4 and ScMYBAS1-5) were identified in this study. The subcellular localization, in Nicotiniana benthamiana, of the TFs fused in frame with GFP revealed that ScMYBAS1-2-GFP and ScMYBAS1-3-GFP were observed in the nucleus. The overexpression of ScMYBAS1-2 and ScMYBAS1-3 spliced transcripts in rice promoted change in plant growth under both well-watered and drought conditions. The ScMYBAS1-2 and ScMYBAS1-3 transgenic lines revealed a higher relative water content (RWC) compared to the wild type before maximum stress under drought conditions. The ScMYBAS1-2 transgenic lines showed a reduction in biomass (total dry weight). Conversely, ScMYBAS1-3 showed an increased biomass (total dry weight) relative to the wild-type. The overexpression of ScMYBAS1-3 in rice transgenic lines showed involvement with drought tolerance and biomass and, for this reason, was considered a good target for plant transformation, particularly for use in developing genotypes with drought tolerance and biomass accumulation.
Introduction
Plants are often exposed to various environmental stresses, such as drought, extreme temperatures and high salinity. These abiotic stresses dramatically impact the crop yield and growth. Among these stresses, drought is the main factor that negatively influences sugarcane crop productivity [1]. One of the strategies to overcome this external factor involves generating genotypes with an increased tolerance to drought using advanced molecular breeding techniques and biotechnological approaches. Several efforts have been made to identify and manipulate candidate genes to obtain drought-tolerant plants [2].
Transcription factors (TFs) regulate most aspects of the plant life cycle by regulating the expression of specific genes, including stress-responsive genes [3]. Several TFs are involved in the response of plants to drought and often participate in gene activation cascades, which act together to increase drought tolerance [4]. TFs are grouped into large families, such as Apetala2 (AP2)/Ethylene Responsive Factor (ERF), Basic Leucine Zipper (bZIP), No Apical Meristem (NAM), Arabidopsis Transcription Activation Factor (ATAF), CUP/SHAPED Cotyledon (CUC), WRKY and Myeloblastosis (MYB), according to their protein structures and DNA binding sites [5]. Different MYB transcription factors have been characterized for their involvement in a variety of biological functions, including drought stress regulation [6]. Two distinct regions are found in MYB proteins: a non-conserved C-terminal modulator region and a N-terminal conserved MYB DNA-binding domain, which is responsible for the regulatory activity of the protein. The MYB DNA-binding domain has one to four imperfect repeats composed of 50–53 amino acids each and forms a helix-turn-helix fold with three regulatory spaced tryptophan residues [7]. Based on the number of imperfect repeats in the MYB DNA-binding domains, the MYB family is classified into four subfamilies: the 1R-, R2R3-, 3R- and 4R- MYB proteins [7, 8]. All four subfamilies are found in plants, so they represent the taxon with the highest diversity of MYB proteins. The 1R-MYB subfamily, also called the MYB-related group, is a heterogeneous group that contains proteins with an intact or partial repeat (such as R3 or R1/2). It is the second largest subfamily of MYB, and functional studies have demonstrated that they regulate plant development and stress responses [9]. The R2R3-MYB proteins are specific to plants and are the most abundant type in plants, with more than 100 R2R3-MYB members in the genomes of dicots and monocots [10, 11]. Over the past decade, the R2R3-MYB genes have been extensively studied, and members of this MYB family were found to be involved in regulating responses to drought, salt and cold [12]. The 3R-MYB (R1R2R3-MYB) subfamily is an evolutionarily conserved group in plants, whose members contain three repeats, each of which is similar to the vertebrate MYB repeats [13]. In contrast to the predominant roles of the 3R-MYB group in vertebrates, relatively few 3R-MYB proteins are present among the plant MYB proteins [14]. The smallest subfamily is 4R-MYB, whose members contain four R1/R2-like repeats. A single 4R-MYB protein is encoded in several plant genomes; for example, Arabidopsis has only one representative (At3g18100) in this class [12].
Recently, some MYB TFs in Arabidopsis and other plants were identified as being involved in drought responses [15]. The overexpression of AtMYB96 improves drought tolerance either by integrating ABA and auxin signals [16] or by activating cuticular wax biosynthesis [17]. AtMYB41 is induced by drought and may function as a transcription factor that modulates cell expansion and cuticle deposition during drought stress [18]. AtMYB44, AtMYB60 and AtMYB61 improve drought tolerance by regulating stomatal movement [19] [20, 21]. AtMYB96, AtMYB15 and AtMYB2, induced by drought, act as positive regulators of drought tolerance by activating the transcription of dehydration responsive genes, such as RD22 [16, 22–24]. Arabidopsis transgenic plants that overexpress AtMYB15 exhibit hypersensitivity to exogenous ABA and show improved tolerance to drought [24] and cold stress [25]. Rice transgenic plants that overexpress OsMYB2 exhibit enhanced tolerance to various stresses, conferred by a change in the expression levels of numerous genes involved in diverse functions in stress response [26]. The expression of OsMYB4 and OsMYB3R-2 is induced by drought in rice, and their ectopic expression promotes drought tolerance [27, 28]. The overexpression of sugarcane ScMYB18 in tobacco results in plants with a markedly improved tolerance to drought and salt stress [29]. The stress-related MYB TF, ScMYBAS1 (Alternative Splicing), which is a R2R3-MYB subfamily, is induced in response to water deficiency and salt stress in sugarcane seedlings of Co740 [30]. Another study, also carried out with the TF ScMYBAS1 but renamed as ScMYB2 (GenBank Accession Number KM387411), revealed its involvement in the leaf senescence signalling pathway and showed that it plays a positive role in response to drought-induced senescence in sugarcane. In addition, two alternatively spliced transcripts were identified: ScMYB2S1 and ScMYB2S2 [31].
In a previous experiment carried out by our team, a microarray data analysis using the RNA from the sugarcane leaves of two Brazilian sugarcane genotypes, with a differential response to drought, revealed several classes of TFs that were up- or downregulated under drought conditions [32]. Among these TFs, ScMYBAS1 was upregulated in response to drought. Therefore, based on previous evidence [33], we investigated in depth the involvement of ScMYBAS1 in response to drought stress. Here, we report the functional characterization of two alternatively spliced forms of ScMYBAS1 (ScMYBAS1-2 and ScMYBAS1-3) in rice transgenic lines. ScMYBAS1-2 and ScMYBAS1-3 overexpression promoted a higher relative water content (RWC) in the rice transgenic lines under drought conditions compared with the wild-type. Interestingly, the ScMYBAS1-3 transgenic lines showed an increase in biomass, while the ScMYBAS1-2 transgenic lines showed a reduction in biomass, both compared with the wild-type plants.
Materials and methods
Plant materials
The sugarcane genotypes IACSP94-2094 and IACSP97-7065, developed by the “Centro de Cana, Instituto Agronômico”—IAC, Brazil), were used to isolate the full-length coding DNA sequence (CDS) of the ScMYBAS1 gene (Saccharum spp.). These genotypes have a differential growth and yield in drought-prone areas, with 'IACSP94-2094' being more tolerant to low water availability than 'IACSP97-7065'. Both genotypes were grown under field conditions (Goiás, Brazil, 15°13’S; 48°56’), and at 6-months-old, they were grown under no rainfall for 3 months. The leaves (+1) from the stressed and non-stressed plants were used for RNA extraction and gene cloning. For more details about the field trials, see Andrade et al, 2016. Rice seeds (Oryza sativa L. ssp. japonica cv. Nipponbare) were used to generate the rice transgenic plants. The wild-type (WT) and rice transgenic plants were grown under greenhouse conditions.
Gene cloning, DNA sequencing and Phylogenetic analysis
The full-length CDS of ScMYBAS1 was accessed in Sugarcane Expressed Sequence Tag (SUCEST) [34] and the National Center for Biotechnology Information (NCBI). The primers were designed flanking the initiation codon ‘ATG’ (ScMYBAS1_CDS_F) and the stop codon ‘TGA’ (ScMYBAS1_CDS_R) for the amplification of the complete coding sequence (CDS) using template cDNAs from genotypes IACSP94-2094 and IACSP97-7065 (Table 1). The cloning was performed using pGEM-T Easy (Promega, Fitchburg, WI, USA) and the E. coli strain DH10b according to the manufacturer’s instructions. The clones obtained were sequenced, and the chromatograms generated by the 3730/3730xl Data Collection Software v3.0 program (Applied Biosystems, Foster City, CA, USA) were analysed by the DNA Baser Sequence Assembler v3.2.5 program (http://www.dnabaser.com/). The ‘FASTA’ files were obtained for each clone individually, forming contigs containing only the sequences of interest and with good quality. The consensus DNA sequences that were obtained by overlapping the forward and reverse sequences for each clone were aligned using the ClustalX 2.0 program [35] and were visualized in the BioEdit program [36].
Table 1. Information and characteristics of the primers used in CDS (Coding Domain Sequence) amplification of ScMYBAS1 for functional analysis; insertion of Gateway sites; analysis of expression in transgenic plants; confirmation of transgenics; and estimate the copy number of the transgene.
| Primers | Access N° | Sequence (5´-3´) | A (bp) | Tm (°C) | Reference |
|---|---|---|---|---|---|
| ScMYBAS1_CDS_F | SCSBAD1085B04 | ATTATGGTGACTGTGAGGGAGGAG | 670 | 58 | * |
| ScMYBAS1_CDS_R | TCACATCATGATTTCTTTATCTTCCA | ||||
| attB1ScMYBAS1 | SCSBAD1085B04 | GCAGGCTTCACCACCATGGTGACTGTG | 686 | 58 | * |
| attB2ScMYBAS1 | AAGCTGGGTCTCACATCATA | ||||
| BP1 | - | GGGGACAAGTTTGTACAAAAAAGCAGGCTTC | - | 57 | [44] |
| BP2 | - | GGGGACCACTTTGTACAAGAAAGCTGGGTC | - | 59 | [44] |
| hpt II_ PCR_F | pHb7m24GWa | GTGTATTGACCGATTCCTTG | 240 | 55 | * |
| hpt II_PCR_R | CGTTATGTTTATCGGCAGTT | ||||
| p35S_PCR_F | pHb7m24GWa | CGCAATGATGGCATTTGTAG | 597 | 55 | * |
| p35S_PCR_R | GCTGACCCACAGATGGTTAGA | ||||
| eEF1a_qPCR_F | AK061464 | AAGAACGGTGATGCTGGTATG | 88 | 60 | [45] |
| eEF1a_qPCR_R | AACGACCAAGAGGAGGGTACT | ||||
| ScMYBAS1_qPCR2_F | SCSBAD1085B04 | ACTGACATACCAAGCCTGCC | 75 | 60 | * |
| ScMYBAS1_qPCR2_R | CCACCATTGTGAGTGTCACC | ||||
| hpt II_Taqman_F | pHb7m24GWa | CGCAGCGATAGCATCCATAG | 70 | 60 | * |
| hpt II_Taqman_R | AGACCTGCCTGAAACCGAACT | ||||
| SPS_Taqman_F | U33175 | TGCGCCTGAACGGATAT | 81 | 60 | [46] |
| SPS_Taqman_R | CGGTTGATCTTTTCGGGATG | ||||
| Taqman Probe | |||||
| hptII_probe | pHb7m24GWa | VIC-CCGGCTGAAGAAC-MGBNFQ | * | ||
| SPS_probe | U33175 | 6FAM-GACGCACGGACGGCTCGGA-MGBNFQ | [46] |
A: amplicon in base pairs
Tm: Melting temperature
a Primes were drawn using a vector sequence as a template
* Primers developed in this work.
A dendrogram was constructed using the ScMYABS1 protein sequence for comparative search, using the Basic Local Alignment Search Tool (BLAST) [37] for monocot sequences with similarities above 70% in database sequences in the National Center for Biotechnology Information (NCBI), the Plant Genomics Resource (Phytozome v11) and the Grass Regulatory Information Server (GRASSIUS). The Arabidopsis sequences were obtained from The Arabidopsis Information Resource (TAIR). Multiple protein sequence alignments were performed using ClustalX 2.0 [35], while a phylogenetic tree was constructed by MEGA 7 [38], using a maximum parsimony method. A bootstrap analysis was performed using 100 replicates in MEGA 7 [39] to evaluate the reliability of the dendrogram.
Subcellular localization
The full-length CDS of ScMYBAS1, without the stop codon ‘TGA’, was cloned into the pDONR221 (Invitrogen, Carlsbad, CA, USA) vector using the Gateway BP Clonase II Enzyme Mix (Invitrogen, Carlsbad, CA, USA). To generate a ScMYBAS1-GFP fusion protein, the pENTR (with the full-length CDS of ScMYBAS1 without stop codon) was recombined with the pK7FWG2 vector (https://gateway.psb.ugent.be/search) using Gateway LR Clonase II Enzyme Mix (Invitrogen, Carlsbad, CA, USA) (Karime et al, 2007). The construct was used for transient transformation of the Nicotiana benthamiana leaves via Agrobacterium infiltration [40]. After an incubation for 3–5 days at 28°C, GFP fluorescence was observed under a Leica SP5 confocal microscope (Leica Microsystems, Wetzlar, DE). Leaves stained with 4',6-diamidino-2-phenylindole (DAPI) were used as a positive control of nuclei localization. In silico analyses, using MultiLoc online tools, were also employed for predicting the protein subcellular localization using the ScMYBAS1 sequence [41].
Generation of transgenic rice plants
To produce transgenic rice plants overexpressing ScMYBAS1, the full-length CDS of ScMYBAS1-2 and ScMYBAS1-3 were amplified by PCR using primers with the attB1 (attB1ScMYBAS1) and attB2 (attB2ScMYBAS1) Gateway sites (Invitrogen, Carlsbad, CA, USA) (Table 1). The sequences were confirmed by sequencing and cloned into the pDONR221 (Invitrogen) vector using the Gateway BP Clonase II Enzyme Mix (Invitrogen, Carlsbad, CA, USA), resulting in pENTR vectors. The overexpression vectors were obtained using multiple recombination among the pENTR (with ScMYBAS1-2 and ScMYBAS1-3), pHb7m24GW and pEN-L4-UBIL vectors (https://gateway.psb.ugent.be/search) using the Gateway LR Clonase II Enzyme Mix (Invitrogen, Carlsbad, CA, USA) [42]. All the constructs were transformed into the E. coli strain DH10b and, after sequencing confirmation, the overexpression vectors were transformed into the Agrobacterium tumefaciens strain EHA-105. The ScMYBAS1 overexpression vectors, driven by the maize Ubiquitin promoter (Ubi-1), were introduced into the rice via Agrobacterium tumefaciens-mediate transformation [43]. The Hygromycin phosphotransferase (hpt II) gene was used to screen for the positive rice transgenic plants. The transformed calli were placed on MS3 agar medium supplemented with 50 mg L-1 hygromycin (Sigma, Saint Louis, MO, USA) and were maintained at 26°C, with a photoperiod of 14/10 h (light/dark), with subcultures obtained every 15 days [43]. The T0 rice transgenic plants were confirmed by PCR using the 35S promoter (p35S_PCR_F and p35S_PCR_R) and the hpt II (hptII_ PCR_F and hptII_PCR_R) primers (Table 1).
RNA isolation, analysis of gene expression and estimation of transgene copy number
The total RNA was isolated from the leaves with the TRIzol reagent (Life Technologies, Carlsbad, CA, USA) following manufacturer’s instructions. Genomic DNA contamination in the total RNA samples was eliminated by RNAse-free DNAse I (Promega). The total RNA was then used as a template for first-strand cDNA synthesis by Superscript II (Invitrogen). For the transgene expression analysis, quantitative real-time PCR was performed on a StepOnePlus Real-Time PCR System (Applied Biosystems, Foster City, CA, USA) with the SYBR green qPCR Master Mix (Applied Biosystems). The cycling conditions were 10 min at 95°C followed by 40 cycles of amplification (95°C for 15 s, 60°C for 30 s, and 72°C for 30 s). Rice elongation factor 1 alpha (eEF1a) (primers eEF1a_qPCR_F and eEF1a_qPCR_R, Table 1) was used as an endogenous control for normalization [45], and the target gene was ScMYBSA1 (primers ScMYBAS1_qPCR2_F and ScMYBAS1_qPCR2_R, Table 1). The ΔΔCt method was used to analyse the expression level observed in the real-time PCR data [47]. To estimate the number of transgene copies, 24 rice transgenic lines were analysed by TaqMan-qPCR. Primers for the hpt II gene (hpt II_Taqman_F and hpt II_Taqman_R, Table 1) were designed from the pHb7m24GW vector sequence and for the endogenous Sucrose Phosphate Synthase (SPS) gene (SPS_Taqman_F and SPS_Taqman_R, Table 1), which has a single copy in the O. sativa genome [46]. They were used in the amplification reactions with the genomic DNA from the 12 ScMYBAS1-2 rice transgenic lines and the 12 ScMYBAS1-3 rice transgenic lines plus the respective control plants (WT). The TaqMan qPCR amplification reactions were performed in quintuplicate in a multiplex reaction for the hpt II and SPS gene, containing 20 ng of DNA, 0.6 μM of each primer, 187.5 nM of each probe (hpt II probe and SPS probe, Table 1), 10 μL of TaqMan Fast Advanced Master Mix (Applied Biosystems) and water qsp for 20 μL. The copy number estimation of the transgene was done as described by [48]. Standard curves were prepared for the hpt II gene and the endogenous SPS gene. The Cycle Threshold (CT) values were used to obtain the starting quantities (SQ) for the hpt II and SPS genes. The rline was obtained by the ratio between the SQhpt II and SQSPS for each rice transgenic line analysed. Based on the rline values, the r1 coefficient (called ‘virtual calibrator’) was calculated for the hpt II gene using the data from all the transgenic and control plants. The copy number estimation of the transgene for each rice transgenic line was determined by the ratio between rline and r1.
Screening the T1 transgenic plants
The T0 transgenic rice lines, by natural self-pollination, produced T1 seeds in the greenhouse. The seeds from the T1 transgenic rice lines were sterilized for 5 min with 70% ethanol (v/v) and for 20 min with 5% NaClO (v/v) followed by five rinses with sterile distilled water. The sterile seeds (100 for each transgenic lines) were placed on MS3 agar medium supplemented with 50 mg L-1 hygromycin (Sigma, Santi Louis, MO, USA) and were maintained at 26°C, with a photoperiod of 14/10 h (light/dark) for 10 days [43]. The resistance to hygromycin was used to screen for the positive T1 transgenic plants. The performance of the surviving T1 seedlings was evaluated under the drought conditions.
Drought treatment, plant water status and biometric analyses
Transgenic rice seedlings were transferred to polyvinyl chloride pots (5 L) containing a mixture (1:1, v/v) of soil and substrate (Carolina soil, São Paulo, SP, BR) and were grown in greenhouse conditions as follows: 25 ± 2/18 ± 2°C (day/night), 70 ± 5% relative humidity, 12/12 h (light/dark) photoperiod with natural light, 1100 μmol.m−2.s−1 average photosynthetic photon flux density (PPFD) (WatchDog Micro Station 1000 series, Spectrum Technologies, Aurora, IL, USA) across replications for daytime hours at Centro de Cana, Ribeirão Preto, São Paulo, Brazil (21.1704° S, 47.8103° W). Each pot contained one WT and one T1 transgenic rice seedlings, aiming to ensure that they were exposed to the same water availability [49]. When the plants were 30 days old, a water deficit was imposed by water withholding. A group of plants (control) was maintained in well-watered conditions through daily watering. After 10 days of a water deficit, the relative water content (RWC) was measured, using the leaf discs (1 cm2) collected at approximately 6 am [49]. For the biometric analysis, the wild-type and rice transgenic plants were harvested both at the beginning of the water deficit (one day after withholding) and at the maximum water deficit (10 days of water withholding), when plants presented a significant leaf wilting [50]. The soil water content was measured every two days during drought treatment, using a soil moisture sensor probe (ProCheck, Decagon Devices Inc, Pullman, WA, USA). The biometric traits, such as stalk length, root length, leaf length, tiller number and the dry weight of the root and shoots, were used for plant phenotyping.
Results
Sequences analysis of the ScMYBAS1 gene
Based on the SUCEST [34] and NCBI databases, the ScMYBAS1 coding DNA sequence (CDS) was cloned from the cDNA of the sugarcane genotypes ‘IACSP94-2094’ and ‘IACSP97-7065’ via PCR. These genotypes were chosen, in this study, because they exhibit differential yield performance in drought-prone areas, with 'IACSP94-2094' being more tolerant to low water availability than 'IACSP97-7065' [51]. Forty-eight clones were sequenced in both directions (forward and reverse), and the assembled sequences resulted in 33 consensus sequences. The nucleotide sequence alignment (S1 Appendix) allowed us to classify the transcripts into four groups according to their size as follows: ScMYBAS1-2 (716 bp); ScMYBAS1-3 (687 bp); ScMYBAS1-4 (813 bp) and ScMYBAS1-5 (799 bp) (Fig 1).
Fig 1. Schematic representation of the differently spliced transcripts of ScMYBAS1.
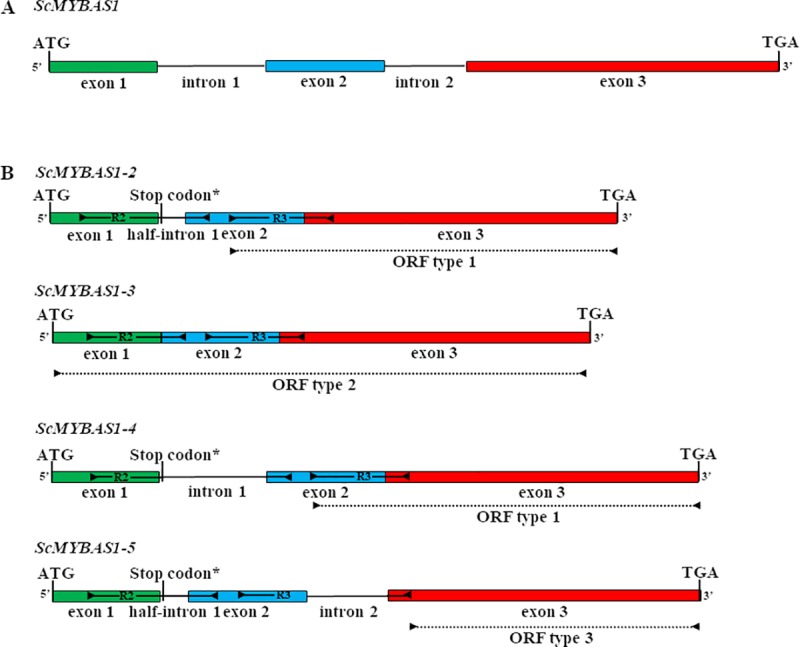
(A) genomic DNA containing three exons (exon 1: 122 bp; exon 2: 131 bp and exon 3: 131 bp) and two introns (intron 1: 126 bp and intron 2: 86 bp. (B) differently spliced transcripts of ScMYBAS1, ScMYBAS1-2 (MH052202), ScMYBAS1-3 (MH052205), ScMYBAS1-4 (MH052203) and ScMYBAS1-5 (MH052201). The start codon ‘ATG’ and stop codon ‘TGA’ of each transcript are shown. The two MYB domain repeats (R2 and R3) and putative ORFs (Type 1, 2 and 3) are indicated in differently spliced transcripts.
A dendrogram was built based on the translated amino acid sequences of ScMYBAS1-2, 3, 4, and 5 Arabidopsis members (AtMYB59-3 and AtMYB48-3) of a subgroup that was described as an alternative splicing/non-canonical intron subgroup [52] and the ScMYBAS1-2, 3, 4, and 5 first blast retrieved sequences of the monocots Sorghum bicolor (SbMYB23), Zea mays (ZmMYB88) and Oryza sativa (OsMYBSA1-1, OsMYBAS3–3) (Fig 2A). The monocot members clustered as more closely related than the Arabidopsis members. The ScMYBAS1-2, 3, 4, and 5 sequences showed an identity ranging from 64.2% to 95.1%, with other monocot members (S1 Table), and 53.5% and 58.1%, with the Arabidopsis AtMYB48-3 and AtMYB59-3 members, respectively. The c-terminus extremity of the ScMYBAS1-2, 3, 4, and 5 sequences had a YPMDQIWKEI conserved motif (Fig 2B), which is typical of Group 2 MYB family proteins classified according to Li, Li (53). The proteins encoded by ScMYBAS1-2 and ScMYBAS1-3 differed in only one amino acid at their C-terminus motif (I/M).
Fig 2. Dendrogram and sequence alignment of a subgroup of MYB protein sequences.

(A) Dendrogram of a subgroup of MYB protein sequences from monocots and A. thaliana: ScMYBAS1-2 (MH052202), ScMYBAS1-3 (MH052205), ScMYBAS1-4 (MH052203), ScMYBAS1-5 (MH052201), SbMYB23 (Sobic.005G224800.1), ZmMYB88 (AFW60113.1), OsMYBAS1-1 (Q53NK6-2), OsMYBAS1-3 (AK111626), AtMYB59-3 (AT5G59780.3) and AtMYB48-3 (AT3G46130.1). Dendrogram was constructed with the parsimony method using MEGA 7, with a bootstrap of 100 samples. The branch numbers represent percentages of bootstrap. Sequence alignment of the proteins shown in (B). Identical amino acids are shaded in black, conserved changes in grey. The two MYB domain repeats (R2 and R3) and Group 2 motif are indicated with sets of arrows, and nuclear localization signals (NLS1 and NLS2) are indicated with black bars.
The transcript groups differed in the presence/combination of three intron sequences (intron 1: 126 bp, half-intron 1: 29 bp and intron 2: 88 bp), which were not removed during transcription splicing. Transcripts ScMYBAS1-2 and ScMYBAS1-4 showed an open read frame (ORF) type 1 that was responsible for encoding a putative protein with 163 amino acids (AAs) and a single incomplete R3 MYB repeat. Transcript ScMYBAS1-3 had an ORF type 2, which encoded a protein with 228 AAs and two MYB repeats and was characteristic of an R2R3-MYB family gene. Transcript ScMYBAS1-5 has an ORF type 3 (120 AAs) that showed no domain region related to MYB family. The longest ORF for each transcript was adopted as the putative ORF (Type 2). The most common transcript was ScMYBAS1-2, followed by ScMYBAS1-5, ScMYBAS1-4 and ScMYBAS1-3 at the ratio 26:4:2:1. The ScMYBAS1-3 transcript was found only in the 'IACSP97-7065' genotype, and other transcripts were found in both genotypes. The transcripts ScMYBAS1-2 and ScMYBAS1-3 were chosen for the subsequent analyses. The transcripts ScMYBAS1-2 and ScMYBAS1-3 were chosen for the subsequent analyses. That because ScMYBAS1-2 showed higher transcripts abundance according to number of clones identified. In addition, it showed a premature stop codon, which encoded partial R2R2 MYB domain, similar to ScMYBAS1-4 and ScMYBAS1-5 transcripts (Fig 1), however, with lower clones abundance. Contrarily ScMYBAS1-3 showed the longest expected encoded protein (R2R3 MYB domain complete) and was identified only in the sensitive to drought genotype 'IACSP97-7065’.
Subcellular localization
Arabidopsis R2R3-MYB proteins have highly conserved basic amino acid regions, namely, ‘KHGR’ and ‘RKKAQEKKM’, which serve as bipartite nuclear localization signals (NLS 1 and NLS2, respectively) [54]. NLS1 and NSL2 are present only in ScMYBAS1-3 transcript (Fig 2B), with one amino acid replacement in NLS2 region (‘RKKAQErKM’) whereas ScMYBAS1-2, ScMYBAS1-4 and ScMYBAS1-5 transcripts lacks the NLS1 region. To examine the subcellular localization of the proteins encoded by ScMYBAS1-2 and ScMYBAS1-3, their coding sequences were cloned in frame to the 5´ N-terminus of the green fluorescent protein (GFP) reporter gene under the control of the cauliflower mosaic virus 35S promoter (CaMV 35S). Recombinant vectors (pScMYBAS1-2:GFP and pScMYBAS1-3:GFP) were introduced into Nicotiana benthamiana leaves via Agrobacterium infiltration. As shown in Fig 3, the ScMYBAS1-2:GFP and ScMYBAS1-3:GFP fusion proteins accumulated in the nucleus. Thus, they are both nuclear-localized proteins, which is consistent with their predicted function as a TF. ScMYBAS1-2:GFP was localized in the nucleus showing lower GFP fluorescence signal compared with ScMYBAS1-3:GFP (Fig 3B), problably due to the lack of NLS 1 in the ScMYBAS1-2. The MultiLoc online tool was used for an in silico subcellular localization. This tool shows the predicted targeting of proteins to different cell compartments, such as the nucleus, mitochondria, chloroplast, peroxisome and any other compartment [41]. The in silico analyses using the MultiLoc tool showed that ScMYBAS1-2 and ScMYBAS1-3 were possibly directed to the nucleus, with high scores of 0.61 and 0.86, respectively. Two other possibilities for the subcellular localization of ScMYBAS1-3 were extracellular and vacuolar, with scores of 0.05 and 0.02, respectively; and for ScMYBAS1-2, the possibilities were the peroxisome, cytoplasm and secretory pathway, with scores of 0.27, 0.21 and 0.18, respectively.
Fig 3. Subcellular localization of ScMYBAS1 proteins.
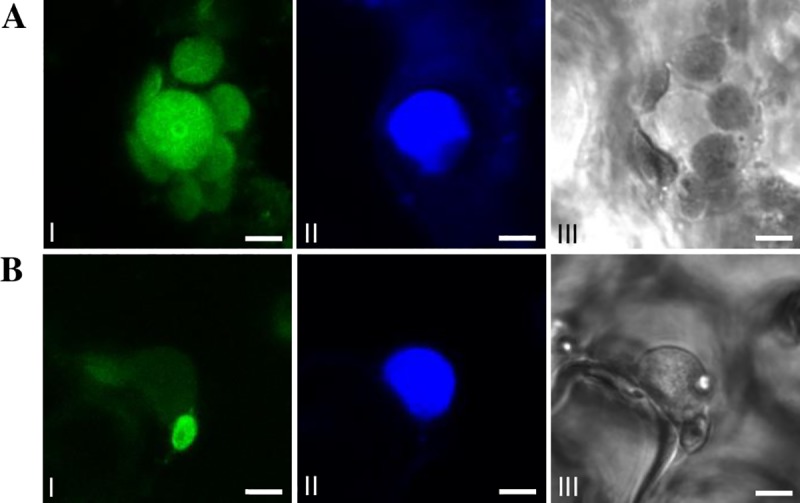
The fusion constructs for ScMYBAS1-3:GFP (A) and ScMYBAS1-2:GFP (B) were introduced into Nicotiana benthamiana leaves via Agrobacterium infiltration. In (A) and (B) it is possible to verify a nuclear localization. Subcellular localization was investigated by confocal microscopy: I—GFP fluorescence; II—nucleus labeled with DAPI fluorescence; III—bright field image. Bars = 12.5 μm.
Transgenic plants under a water deficit
Rice calli were transformed with two different overexpression vectors carrying the ScMYBAS1-2 and ScMYBAS1-3 coding sequences under the control of the maize Ubiquitin promoter. The transformation showed a high efficiency, i.e., 50–60%, as given by the ratio of the transgenic plants produced to the number of the inoculated calli with Agrobacterium. Several rice transgenic plants overexpressing ScMYBAS1-2 (30 independent events of plants) and ScMYBAS1-3 (25 independent events of plants) were obtained, and all the events were selected by hygromycin resistance and confirmed by PCR. Four ScMYBAS1-2 transgenic lines (identified as 15, 23, 32, and 41) and three ScMYBAS1-3 transgenic lines (identified as 7, 8 and 9) from the first segregate generation, containing a single copy of the transgene (Table 2) and showing different expression levels (Fig 4), were subjected to a water deficit treatment.
Table 2. Taqman qPCR estimates of copy number for hpt II transgene of ScMYBAS1-2 and ScMYBAS1-3 transgenic plants.
| Transgenic Lines | rline | rline/r1 | Copy Number hpt II | |
|---|---|---|---|---|
| ‘ScMYBAS1-2’ | 1 | 2.57 ± 0.156 | 4.28 | 4 |
| 3 | 0.60 ± 0.008 | 1.00 | 1 | |
| 7 | 6.40 ± 0.253 | 10.67 | 11 | |
| 8 | 8.22 ± 0.328 | 13.69 | 14 | |
| 15 | 0.57 ± 0.026 | 0.94 | 1 | |
| 16 | 1.30 ± 0.021 | 2.16 | 2 | |
| 20 | 0.78 ± 0.014 | 1.31 | 1 | |
| 23 | 0.55 ± 0.015 | 0.91 | 1 | |
| 32 | 0.59 ± 0.010 | 0.98 | 1 | |
| 34 | 0.42 ± 0.009 | 0.71 | 1 | |
| 38 | 0.16 ± 0.008 | 0.26 | 1* | |
| 41 | 0.79 ± 0.023 | 1.32 | 1 | |
| ‘ScMYBAS1-3’ | 4 | 1.40 ± 0.035 | 1.75 | 2 |
| 5 | 1.22 ± 0.082 | 1.52 | 2 | |
| 7 | 0.12 ± 0.028 | 0.15 | 1* | |
| 8 | 0.17 ± 0.019 | 0.21 | 1* | |
| 9 | 0.17 ± 0.036 | 0.21 | 1* | |
| 11 | 0.32 ± 0.036 | 0.40 | 1* | |
| 21 | 1.51 ± 0.067 | 1.88 | 2 | |
| 25 | 1.85 ± 0.065 | 2.31 | 2 | |
| 26 | 0.46 ± 0.070 | 0.58 | 1 | |
| 28 | 0.78 ± 0.035 | 0.98 | 1 | |
| 31 | 2.15 ± 0.054 | 2.69 | 3 | |
| 32 | 2.42 ± 0.093 | 3.08 | 3 | |
*Values assumed as a single copy.
Fig 4. Relative expression of ScMYBAS1 gene in transgenic rice lines and wild type (WT) under greenhouse conditions.
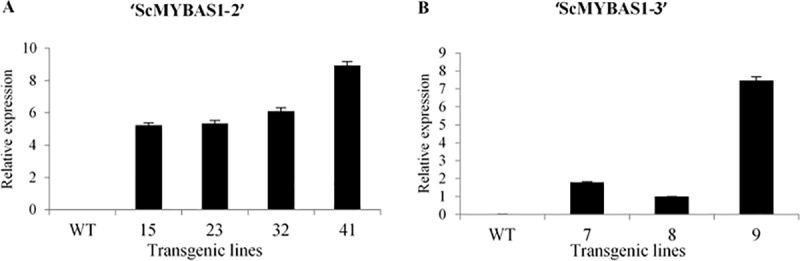
The leaves of 3-week-old seedling weres sampled for RNA extraction. Relative expression levels were obtained from the ratio of transgenic line with the lowest expression level and the other transgenic lines. Elongation factor 1 alpha (eEF1a) was used as a housekeeping gene. A, transgenic ScMYBAS1-2 lines; and B transgenic ScMYBAS1-3 lines used in physiological and biometric analyses. The values are mean ± SE (n = 3).
The ScMYBAS1-2 and ScMYBAS1-3 transgenic lines were tested at 30 days of age under varying water conditions. After 10 days of water withholding, transgenic and WT plants presented a significant leaf wilting and a significant reduction of soil water content (S1 Fig) characterizing the drought treatment. The RWC of the transgenic lines and controls (WT) was measured after drought treatment (Fig 5). Before stress, the ScMYBAS1-2 transgenic lines and WT did not show a significant difference in the leaf RWC, which ranging from 72% to 88%. Under drought conditions, all the ScMYBAS1-2 lines exhibited a higher RWC than did the WT (Fig 5). The ScMYBAS1-3 transgenic lines 8 and 9 showed a higher RWC than did the WT before and after water stress, while line 7 and the WT had a similar RWC (Fig 5).
Fig 5. Leaf relative water content (RWC) in wild type and transgenic lines under well-watered and drought stress condition.

The values are mean ± SE (n = 4). The letters on the bars indicate significant differences by Student’s t-test (P < 0.05).
The ScMYBAS1-2 transgenic lines showed a reduction in the biomass in the well-watered and drought treatments (Table 3). The biomass reduction (total dry weight) of the transgenic lines was more evident in the well-watered group than in the drought treatment group. Conversely, the transgenic lines 7, 8 and 9 of ScMYBAS1-3 showed an increased biomass (total dry weight) relative to the WT (Table 4), and this increase was higher in the drought treatment (Fig 6).
Table 3. Biometric parameters evaluated in the transgenic lines ScMYBAS1-2 under well-watered and drought conditions at maximum stress.
| Variables | 15 | 23 | 32 | 41 | ||||||||||||
|---|---|---|---|---|---|---|---|---|---|---|---|---|---|---|---|---|
| Well-watered | Drought | Well-watered | Drought | Well-watered | Drought | Well-watered | Drought | |||||||||
| WT | T | WT | T | WT | T | WT | T | WT | T | WT | T | WT | T | WT | T | |
| Tillers (units) | 6.0±1.4a | 3.3±0.8b | 7.0±0.8a | 4.0±0.1b | 5.7±1.7a | 4.0±0.0c | 5.2±1.2ab | 4.5±0.6bc | 6.2±1.2a | 3.0±0.0c | 5.2±0.5b | 4.5±0.6b | 4.7±0.5a | 4.2±0.5a | 4.7±0.5a | 4.5±1.7a |
| Leaf length (cm) | 19.4±3.3b | 15.0±3.7c | 22.2±4.2a | 24.4±6.4a | 22.1±5.7b | 24.5±2.8a | 22.6±5.3b | 26.7±7.0a | 20.6±2.6b | 21.6±3.1ab | 24.1±1.5ab | 25.0±6.2a | 24.4±5.0ab | 19.8±2.9b | 28.0±1.0a | 24.9±2.7ab |
| Stalk length (cm) | 38.6±0.7a | 28.5±2.3c | 34.5±3.1b | 26.3±4.0c | 37.1±5.4a | 34.6±0.7a | 34.3±0.4a | 29.0±2.2b | 37.4±1.9a | 29.5±3.0b | 35.4±0.4a | 29.5±3.1b | 35.6±2.9a | 30.5±2.4b | 34.8±3.0a | 30.6±1.6b |
| Root length (cm) | 42.8±0.6 | 43.8±9.4 | 39.9±7.6a | 36.5±6.6a | 39.2±4.8a | 35.9±3.5b | 38.6±2.0a | 41.0±3.0a | 42.4±4.6ab | 45.6±3.8a | 37.7±4.4b | 37.4±3.2b | 38.9±2.2a | 38.4±5.5a | 38.6±3.2a | 34.5±4.3b |
| Root dry matter (g) | 1.5±0.2a | 0.6±0.1b | 1.5±0.3a | 0.7±0.1b | 1.6±0.3a | 1.0±0.2b | 1.2±0.2a | 1.0±0.4b | 1.7±0.1a | 0.8±0.1c | 1.3±0.1b | 1.3±0.5b | 1.6±0.4a | 1.0±0.2c | 1.3±0.1b | 0.9±0.2c |
| Shoot dry matter (g) | 4.5±0.8b | 1.1±0.3d | 5.0±0.9a | 1.9±0.3c | 4.8±1.7a | 2.8±0.2b | 4.4±0.8a | 3.2±0.8b | 4.7±0.6a | 1.2±0.1c | 4.8±0.5a | 3.4±1.0b | 4.3±1.3a | 2.0±1.1c | 4.4±0.4a | 3.1±0.4b |
| Dry matter (g) | 6.0±0.9a | 1.7±0.3b | 6.6±1.1a | 2.6±0.3b | 6.3±2.0a | 3.8±0.3b | 5.7±1.0a | 4.2±1.1b | 6.4±0.7a | 2.0±0.2c | 6.5±1.2a | 3.7±1.9b | 5.9±1.7a | 3.0±0.2b | 5.7±0.4a | 3.9±0.6b |
The values are mean ± SE (n = 4). The letters on the same lines indicate significant difference by Student’s t-test (P < 0.05) within the same event.
Table 4. Biometric parameters evaluated in the transgenic lines ScMYBAS1-3 under well-watered and drought conditions at maximum stress.
| Variables | 7 | 8 | 9 | |||||||||
|---|---|---|---|---|---|---|---|---|---|---|---|---|
| Well-watered | Drought | Well-watered | Drought | Well-watered | Drought | |||||||
| WT | T | WT | T | WT | T | WT | T | WT | T | WT | T | |
| Tillers (units) | 10.0±0.8b | 13.2±2.4a | 8.7±1.9b | 11.5±2.4ab | 10.2±1.2ab | 11.5±1.9a | 8.7±1.2b | 8.5±2.4b | 11.2±1.7b | 15.0±3.5a | 8.2±2.0c | 10.0±1.4bc |
| Leaf length (cm) | 22.0±2.6bc | 28.0±1.8a | 17.0±4.2c | 25.0±6.2ab | 20.7±4.5b | 30.8±3.3a | 16.6±3.8b | 31.9±9.4a | 22.2±3.0b | 32.5±1.2a | 19.4±3.0b | 28.6±7.3a |
| Stalk length (cm) | 23.5±2.9b | 30.6±0.3a | 22.7±2.4b | 28.2±1.7a | 29.3±2.0 | 30.3±5.4 | 20.5±4.8b | 23.4±2.9a | 24.5±3.0ab | 28.7±4.0a | 21.8±2.4b | 25.8±6.2ab |
| Root length (cm) | 39.3±2.4a | 38.4±0.7a | 42.2±5.6a | 42.9±7.2a | 48.0±0.8a | 40.8±2.7b | 34.7±2.9c | 41.6±4.5b | 38.0±5.3a | 41.7±6.1a | 39.3±4.6a | 39.9±5.4a |
| Root dry matter (g) | 0.5±0.1b | 0.7±0.1a | 0.4±0.1c | 0.6±0.05b | 0.8±0.02a | 0.9±0.2a | 0.4±0.1a | 0.6±0.4a | 0.5±0.1bc | 0.9±0.3a | 0.4±0.04cd | 0.6±0.2b |
| Shoot dry matter (g) | 1.8±0.4b | 2.8±0.1a | 1.0±0.2c | 1.8±0.1b | 2.7±0.1b | 3.4±0.6a | 1.2±0.2d | 1.9±1.2c | 1.9±0.6b | 4.1±1.3a | 1.1±0.2c | 1.8±0.7b |
| Dry matter (g) | 2.4±0.5b | 3.5±0.1a | 1.4±0.3c | 2.4±0.2b | 3.5±0.1a | 4.2±0.8a | 1.7±0.3b | 2.5±1.6b | 2.5±0.7b | 5.0±1.6a | 2.5±0.7b | 5.0±1.6a |
The values are mean ± SE (n = 4). The letters on the same lines indicate significant difference by Student’s t-test (P < 0.05) within the same event.
Fig 6. Phenotypes of T1 transgenic rice overexpressing ScMYBAS1-2 and ScMYBAS1-3.
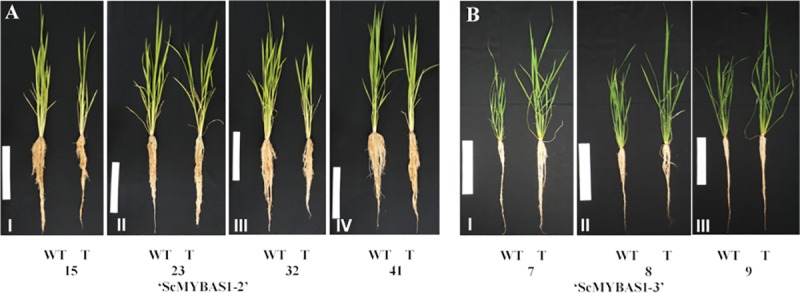
A: ScMYBAS1-2 transgenic lines after 45 days growth in greenhouse conditions, I—IV: 15, 23, 32 and 41. B: ScMYBAS1-3 transgenic lines after 30 days growth in greenhouse conditions, V—VII: 7, 8 and 9. Left: WT plants; Right: transgenic plants. White bar = 20 cm.
Discussion
In the present study, we identified four groups of ScMYBAS1 transcripts, including ScMYBAS-2, ScMYBAS-3, ScMYBAS-4 and ScMYBAS-5, which were putative splicing alternatives because they shared a similar alternative splicing pattern to Arabidopsis and rice transcription factors (AtMYB48, AtMYB59, OsMYBAS1 and OsMYBAS2) (Li et al. 2006a). In sugarcane, Guo, Ling (31) described a highly conserved splicing arrangement with three exons and two introns for ScMYBAS1 (named as ScMYB2). The introns found by Guo, Ling (31) and in our study have specific splice sites (GT-AG) [55]. Based on the results herein, it is possible that ScMYBAS1-4 and ScMYBAS1-5 also undergo the same conserved alternative splicing. ScMYBAS1 encodes an MYB protein with one or two MYB repeats (R2 and R3), which are known to bind to DNA. The proteins of the transcripts ScMYBAS-2, ScMYBAS-3 and ScMYBAS-4, encoded by ScMYBAS1, differ in their MYB domain repeats. Therefore, these three types of MYB proteins may have binding affinities to different target genes. The alternative splicing of transcripts is one of the most complex cellular processes in eukaryotes that leads to a large proportion of proteomic complexity without genome expansion [56]. Alternative splicing is documented for mRNAs originating from several plant transcription factor genes and is frequently associated with environmental stress [57, 58]. ScMYABS1 alternative spliced transcripts act differently in regulating the pathways involved in drought tolerance. Once exposed to drought conditions, the genotypes 'IACSP 97–7065' and 'IACSP94-2094', with a response profile that contrasts to drought stress, have different frequencies and types of ScMYBAS1 transcripts. The ScMYBAS1-3 transcript with an ORF type 2, encoding the longest protein (228 AAs), was identified only in the genotype 'IACSP97-7065' and was considered sensitive to drought, whereas the ScMYBAS1-5 variant with an ORF type 3 was observed only in the genotype 'IACSP94-2094' and was considered tolerant to drought conditions. Conversely, the most common ScMYBAS1-2 and ScMYBAS1-4 transcripts with an ORF type 1 (Fig 1B) were found in both sugarcane genotypes studied here. To our knowledge, ScMYBAS1-4 and ScMYBAS1-5 were identified for the first time herein, whereas ScMYBAS1-2 and ScMYBAS1-3 were first identified by Prabu and Theertha [30] in the sugarcane seedlings of the Co740 genotype under water-deficit and salt stress conditions. Recently, these same transcripts were identified in sugarcane exposed to drought and were named ScMYB2S1 and ScMYB2S2 [31]. According to the authors, ScMYB2S1 and ScMYB2S are involved in the ABA-mediated leaf senescence signalling pathway and play a positive role in response to drought-induced senescence in sugarcane.
The distribution of conserved AAs among the MYB DNA-binding domain (DBD) of sugarcane, sorghum, maize, and rice (phylogenetically related plants), including Arabidopsis, was very similar, indicating that the AA residues in this domain were highly conserved across plants (Fig 2). The amino acid residues of the DBD (R2 and R3 domains) are important functional domains of the MYB family. Despite the high similarity in the DBD (Fig 2), it was possible to cluster the MYB proteins according to the phylogenetic relationships between monocots and dicots. The dendrogram was composed of all translated AA sequences from the ScMYBAS1 transcripts and the sequences of sorghum (SbMYB23), maize (ZmMYB88) and rice (OsMYBAS1), revealing a higher similarity among monocot than dicot proteins. The Arabidopsis protein sequences probably represent orthologues to ScMYBAS1 [31]. The clustering was possible due the variability in the C-terminal region of the MYB proteins. Moreover, most plant MYB proteins are composed of a set of conserved motifs in the C-terminal, and the protein architectures are remarkably conserved within specific MYB subgroups. Members of the same MYB subgroups generally share one or more identical motifs outside the MYB DBD [8, 12, 59]. In general, the C-terminal regions of the MYB proteins often possess a protein-protein interaction domain. ScMYBAS1 contains the motif YPMDQIWKEI, in the C-terminus of the protein, and this is similar to motif 52 (W/Y-MDDIW) in Arabidopsis, which is reported to be a transcriptional activator [59]. This motif is a conserved sequence in the C-termini among the proteins, suggesting its functional importance.
It is well known that MYB proteins play important roles in multiple aspects of regulating responses to abiotic stress, plant growth and development [12, 13, 60–62]. To examine the response to drought stress in the transgenic lines, the T1 progenies of the ScMYBAS1-2 and ScMYBAS1-3 transgenic lines and WT plants were grown in a greenhouse under well-watered and water-withholding conditions. The ScMYBAS1-2 and ScMYBAS1-3 transgenic lines exhibited significant physiological differences in their RWC parameters compared to the WT plants. Surprisingly, the ScMYBAS1-3 transgenic lines showed an increased biomass, whereas the ScMYBAS1-2 transgenic lines revealed a decreased biomass under both the well-watering and drought stressed conditions, and there was a higher RWC in the transgenic lines compared with the WT. Although there was a reduction in the biomass in ScMYBAS1-2 transgenic lines in both water regimes, this reduction was lower in the drought-stressed treatment. This fact may be related to the high RWC in the transgenic lines exposed to drought. In ScMYBAS1-3 transgenic lines, the increase in the biomass was higher in the drought conditions. As in the ScMYBAS1-2 transgenic lines, the RWC in the ScMYBAS1-3 transgenic lines was higher than that of the WT. The RWC is a measure of the plant water status that reflects the metabolic activity in tissues, and it is used as the most meaningful index of water stress tolerance [63]. A decrease in the RWC in response to drought stress is noted in a wide variety of plants. Leaves subjected to drought exhibit large reductions in the RWC and water potential [62]. Transgenic plants that present a delay in water loss compared to non-transgenic plants are characterized as resistant to drought [64]. A delay in water loss during drought allows transgenic plants to maintain their homeostasis for a longer time than the WT plants, conferring an advantage over stress. This event was observed in the ScMYBAS1-2 transgenic lines 15, 23, 32 and 41 and the ScMYBAS1-3 transgenic lines 8 and 9, which presented a higher RWC than did the WT plants under drought conditions, thus characterizing the involvement of ScMYAS1-2 and ScMYBAS1-3 in the drought tolerance. However, from the agronomic point of view, a reduction in the biomass in the ScMYAS1-2 transgenic lines is a negative aspect for sugarcane cultivation. On the other hand, the ScMYBAS1-3 transgenic lines 8 and 9 exhibited an increase in biomass (more evident in the line 9, which coincides with the higher transgene expression level compared to the three transgenic lines evaluated) and a larger RWC in relation to the WT plants. The high relative RWC found in the transgenic lines suggests that ScMYAS1-3 plays a positive role in response to drought.
ScMYBAS1 was found to undergo alternative splicing and produced four distinctively spliced transcripts. Interestingly, the encoded proteins for ScMYBAS1-2 and ScMYBAS1-3 mainly differ in their MYB DBD repeat and in one amino acid in the C-terminus motif (I/W). Similarly, the ScMYBAS1 orthologues in Arabidopsis, AtMYB59 and AtMYB48, were found to undergo highly conserved alternative splicing [59], and the proteins encoded by the AtMYB59-1 and AtMYB59-3 transcripts were transcriptional activators, suggesting that these transcription factors may activate different groups of target genes by changing their DNA binding domains via alternative splicing [53]. ScMYBAS1-2 and ScMYBAS1-3 possibly act in a manner similar to their AtMYB59 and AtMYB48 orthologues by activating different groups of target genes, resulting in a high RWC and contrasting biomass in transgenic rice. The transcription factor AtMYB59 is an important regulator of the cell cycle [65]. The transgenic plants of Arabidopsis overexpressing this TF showed a reduction in root size relative to the wild-type plants. In contrast, mutant AtMYB59 lines showed an increase in root length also in relation to the wild-type plants. The transgenic lines overexpressing AtMYB59 presented 54% of the cells in metaphase, whereas the wild-type and mutant strains presented only 27% and 14% of the cells, respectively, in this phase. This extension in the metaphase phase during cell division resulted in slower root growth in the transgenic lines, thereby impairing their normal development. Further studies are needed to identify the possible targets of these distinctively spliced transcripts and the correlation between the MYB domain and the trans-activation activity.
Since drought tolerance and an increase in biomass are highly desirable traits in energy crops, the overexpression of ScMYBAS1-3 may be an excellent target to be explored in the generation of transgenic plants, such as sugarcane, energy cane and other bioenergy grasses. Indeed, the manipulation of only one gene contributes to an increase in the productivity per area, promoting the verticalization of crop production, inside a sustainable production context. Moreover, with the advent of technologies based on genome editing, ScMYBAS1-3 is considered suitable for precise genome editing, bypassing the biosafety and regulatory aspects that lie with genetically modified plants.
Supporting information
(PDF)
The values are mean ± SE (n = 4).
(TIF)
Protein sequences from monocots and A. thaliana: ScMYBAS1-2 (MH052202), ScMYBAS1-3 (MH052205), ScMYBAS1-4 (MH052203), ScMYBAS1-5 (MH052201), SbMYB23 (Sobic.005G224800.1), ZmMYB88 (AFW60113.1), OsMYBAS1-1 (Q53NK6-2), OsMYBAS1-3 (AK111626), AtMYB59-3 (AT5G59780.3) and AtMYB48-3 (AT3G46130.1).
(PDF)
Acknowledgments
The authors gratefully acknowledge the technical support by “Centro de Cana, Instituto Agronômico”–IAC, Brazil, Dr. Dilermando Perecin for helping with the statistical analyses and Dr. Paulo Eduardo Ribeiro Marchiori for helping with the physiological analyses.
Data Availability
All relevant data are within the paper and its Supporting Information files.
Funding Statement
This study was supported by the São Paulo Research Foundation (FAPESP Grant #2011/50661-8) and by the National Council of Scientific and Technological Development (CNPq Grant #141996/2012-9). The funders had no role in study design, data collection and analysis, decision to publish, or preparation of the manuscript.
References
- 1.Inman-Bamber NG, Smith DM. Water relations in sugarcane and response to water deficits. Field Crops Research. 2005;92(2):185–202. 10.1016/j.fcr.2005.01.023. [DOI] [Google Scholar]
- 2.Krannich CT, Maletzki L, Kurowsky C, Horn R. Network Candidate Genes in Breeding for Drought Tolerant Crops. International journal of molecular sciences. 2015;16(7):16378–400. 10.3390/ijms160716378 PMC4519955. [DOI] [PMC free article] [PubMed] [Google Scholar]
- 3.Seki M, Kamei A, Yamaguchi-Shinozaki K, Shinozaki K. Molecular responses to drought, salinity and frost: common and different paths for plant protection. Curr Opin Biotechnol. 2003;14(2):194–9. 10.1016/s0958-1669(03)00030-2 [DOI] [PubMed] [Google Scholar]
- 4.Vinocur B, Altman A. Recent advances in engineering plant tolerance to abiotic stress: achievements and limitations. Curr Opin Biotechnol. 2005;16(2):123–32. 10.1016/j.copbio.2005.02.001 . [DOI] [PubMed] [Google Scholar]
- 5.Wang H, Wang H, Shao H, Tang X. Recent Advances in Utilizing Transcription Factors to Improve Plant Abiotic Stress Tolerance by Transgenic Technology. Frontiers in plant science. 2016;7:67 10.3389/fpls.2016.00067 ; PubMed Central PMCID: PMC4746321. [DOI] [PMC free article] [PubMed] [Google Scholar]
- 6.Ambawat S, Sharma P, Yadav NR, Yadav RC. MYB transcription factor genes as regulators for plant responses: an overview. Physiology and molecular biology of plants: an international journal of functional plant biology. 2013;19(3):307–21. 10.1007/s12298-013-0179-1 ; PubMed Central PMCID: PMC3715649. [DOI] [PMC free article] [PubMed] [Google Scholar]
- 7.Dubos C, Stracke R, Grotewold E, Weisshaar B, Martin C, Lepiniec L. MYB transcription factors in Arabidopsis. Trends in plant science. 2010;15(10):573–81. 10.1016/j.tplants.2010.06.005 . [DOI] [PubMed] [Google Scholar]
- 8.Stracke R, Werber M, Weisshaar B. The R2R3-MYB gene family in Arabidopsis thaliana. Current Opinion in Plant Biology. 2001;4(5):447–56. 10.1016/s1369-5266(00)00199-0 [DOI] [PubMed] [Google Scholar]
- 9.Du H, Wang Y-B, Xie Y, Liang Z, Jiang S-J, Zhang S-S, et al. Genome-Wide Identification and Evolutionary and Expression Analyses of MYB-Related Genes in Land Plants. DNA Research: An International Journal for Rapid Publication of Reports on Genes and Genomes. 2013;20(5):437–48. 10.1093/dnares/dst021 PMC3789555. [DOI] [PMC free article] [PubMed] [Google Scholar]
- 10.Jiang C, Gu J, Chopra S, Gu X, Peterson T. Ordered origin of the typical two- and three-repeat Myb genes. Gene. 2004;326:13–22. Epub 2004/01/20. . [DOI] [PubMed] [Google Scholar]
- 11.Wilkins O, Nahal H, Foong J, Provart NJ, Campbell MM. Expansion and Diversification of the Populus R2R3-MYB Family of Transcription Factors. Plant Physiol. 2009;149(2):981–93. 10.1104/pp.108.132795 PMC2633813. [DOI] [PMC free article] [PubMed] [Google Scholar]
- 12.Yanhui C, Xiaoyuan Y, Kun H, Meihua L, Jigang L, Zhaofeng G, et al. The MYB transcription factor superfamily of Arabidopsis: expression analysis and phylogenetic comparison with the rice MYB family. Plant Mol Biol. 2006;60(1):107–24. 10.1007/s11103-005-2910-y . [DOI] [PubMed] [Google Scholar]
- 13.Ito M. Conservation and diversification of three-repeat Myb transcription factors in plants. Journal of plant research. 2005;118(1):61–9. 10.1007/s10265-005-0192-8 . [DOI] [PubMed] [Google Scholar]
- 14.Katiyar A, Smita S, Lenka SK, Rajwanshi R, Chinnusamy V, Bansal KC. Genome-wide classification and expression analysis of MYB transcription factor families in rice and Arabidopsis. BMC genomics. 2012;13:544–. 10.1186/1471-2164-13-544 PMC3542171. [DOI] [PMC free article] [PubMed] [Google Scholar]
- 15.Li C, Ng CKY, Fan L-M. MYB transcription factors, active players in abiotic stress signaling. Environ Exp Bot. 2015;114:80–91. 10.1016/j.envexpbot.2014.06.014 [Google Scholar]
- 16.Seo PJ, Xiang F, Qiao M, Park JY, Lee YN, Kim SG, et al. The MYB96 transcription factor mediates abscisic acid signaling during drought stress response in Arabidopsis. Plant Physiol. 2009;151(1):275–89. 10.1104/pp.109.144220 ; PubMed Central PMCID: PMC2735973. [DOI] [PMC free article] [PubMed] [Google Scholar]
- 17.Seo PJ, Lee SB, Suh MC, Park MJ, Go YS, Park CM. The MYB96 transcription factor regulates cuticular wax biosynthesis under drought conditions in Arabidopsis. The Plant cell. 2011;23(3):1138–52. 10.1105/tpc.111.083485 ; PubMed Central PMCID: PMC3082259. [DOI] [PMC free article] [PubMed] [Google Scholar]
- 18.Cominelli E, Sala T, Calvi D, Gusmaroli G, Tonelli C. Over-expression of the ArabidopsisAtMYB41gene alters cell expansion and leaf surface permeability. The Plant journal: for cell and molecular biology. 2008;53(1):53–64. 10.1111/j.1365-313X.2007.03310.x [DOI] [PubMed] [Google Scholar]
- 19.Cominelli E, Galbiati M, Vavasseur A, Conti L, Sala T, Vuylsteke M, et al. A guard-cell-specific MYB transcription factor regulates stomatal movements and plant drought tolerance. Current biology: CB. 2005;15(13):1196–200. Epub 2005/07/12. 10.1016/j.cub.2005.05.048 . [DOI] [PubMed] [Google Scholar]
- 20.Liang Y-K, Dubos C, Dodd IC, Holroyd GH, Hetherington AM, Campbell MM. AtMYB61, an R2R3-MYB Transcription Factor Controlling Stomatal Aperture in Arabidopsis thaliana. Current Biology. 2005;15(13):1201–6. 10.1016/j.cub.2005.06.041. [DOI] [PubMed] [Google Scholar]
- 21.Jung C, Seo JS, Han SW, Koo YJ, Kim CH, Song SI, et al. Overexpression of AtMYB44 enhances stomatal closure to confer abiotic stress tolerance in transgenic Arabidopsis. Plant Physiol. 2008;146(2):623–35. 10.1104/pp.107.110981 ; PubMed Central PMCID: PMC2245844. [DOI] [PMC free article] [PubMed] [Google Scholar]
- 22.Urao T, Noji M, Yamaguchi-Shinozaki K, Shinozaki K. A transcriptional activation domain of ATMYB2, a drought-inducible Arabidopsis Myb-related protein. The Plant journal: for cell and molecular biology. 1996;10(6):1145–8. . [DOI] [PubMed] [Google Scholar]
- 23.Abe H, Urao T, Ito T, Seki M, Shinozaki K, Yamaguchi-Shinozaki K. Arabidopsis AtMYC2 (bHLH) and AtMYB2 (MYB) function as transcriptional activators in abscisic acid signaling. The Plant cell. 2003;15(1):63–78. Epub 2003/01/02. 10.1105/tpc.006130 ; PubMed Central PMCID: PMCPmc143451. [DOI] [PMC free article] [PubMed] [Google Scholar]
- 24.Ding Z, Li S, An X, Liu X, Qin H, Wang D. Transgenic expression of MYB15 confers enhanced sensitivity to abscisic acid and improved drought tolerance in Arabidopsis thaliana. J Genet Genomics. 2009;36(1):17–29. 10.1016/S1673-8527(09)60003-5 [DOI] [PubMed] [Google Scholar]
- 25.Agarwal M, Hao Y, Kapoor A, Dong CH, Fujii H, Zheng X, et al. A R2R3 type MYB transcription factor is involved in the cold regulation of CBF genes and in acquired freezing tolerance. The Journal of biological chemistry. 2006;281(49):37636–45. 10.1074/jbc.M605895200 . [DOI] [PubMed] [Google Scholar]
- 26.Yang A, Dai X, Zhang WH. A R2R3-type MYB gene, OsMYB2, is involved in salt, cold, and dehydration tolerance in rice. Journal of experimental botany. 2012;63(7):2541–56. 10.1093/jxb/err431 ; PubMed Central PMCID: PMC3346221. [DOI] [PMC free article] [PubMed] [Google Scholar]
- 27.Dai X, Xu Y, Ma Q, Xu W, Wang T, Xue Y, et al. Overexpression of an R1R2R3 MYB gene, OsMYB3R-2, increases tolerance to freezing, drought, and salt stress in transgenic Arabidopsis. Plant Physiol. 2007;143(4):1739–51. 10.1104/pp.106.094532 ; PubMed Central PMCID: PMC1851822. [DOI] [PMC free article] [PubMed] [Google Scholar]
- 28.Pasquali G, Biricolti S, Locatelli F, Baldoni E, Mattana M. Osmyb4 expression improves adaptive responses to drought and cold stress in transgenic apples. Plant cell reports. 2008;27(10):1677–86. Epub 2008/08/06. 10.1007/s00299-008-0587-9 . [DOI] [PubMed] [Google Scholar]
- 29.Shingote PR, Kawar PG, Pagariya MC, Kuhikar RS, Thorat AS, Babu KH. SoMYB18, a sugarcane MYB transcription factor improves salt and dehydration tolerance in tobacco. Acta Physiologiae Plantarum. 2015;37(10):217 10.1007/s11738-015-1961-1 [Google Scholar]
- 30.Prabu GR, Theertha PD. STRUCTURE OF DNA BINDING MYB TRANSCRIPTION FACTOR PROTEIN (SCMYBAS1-3) FROM SUGARCANE? THREADING AND AB INITIO MODELLING. J Phytol. 2011;3(3):77–82. [Google Scholar]
- 31.Guo J, Ling H, Ma J, Chen Y, Su Y, Lin Q, et al. A sugarcane R2R3-MYB transcription factor gene is alternatively spliced during drought stress. Sci Rep. 2017;7:41922 Epub 2017/02/09. 10.1038/srep41922 ; PubMed Central PMCID: PMCPmc5294458. [DOI] [PMC free article] [PubMed] [Google Scholar]
- 32.Oliveira JFNC. Caracterização fisiológica e perfil de expressão gênica de cultivares de cana-de-açúcar (Saccharum spp) contrastantes para o déficit hídrico Piracicaba: Escola Superior de Agricultura “Luiz de Queiroz”, Universidade de São Paulo; 2012. [Google Scholar]
- 33.Prabu G, Kawar PG, Pagariya MC, Prasad DT. Identification of Water Deficit Stress Upregulated Genes in Sugarcane. Plant Mol Biol Rep. 2010;29(2):291–304. 10.1007/s11105-010-0230-0 [Google Scholar]
- 34.Vettore AL, da Silva FR, Kemper EL, Souza GM, da Silva AM, Ferro MI, et al. Analysis and functional annotation of an expressed sequence tag collection for tropical crop sugarcane. Genome research. 2003;13(12):2725–35. 10.1101/gr.1532103 ; PubMed Central PMCID: PMC403815. [DOI] [PMC free article] [PubMed] [Google Scholar]
- 35.Thompson JD, Higgins DG, Gibson TJ. Clustal-W—Improving the Sensitivity of Progressive Multiple Sequence Alignment through Sequence Weighting, Position-Specific Gap Penalties and Weight Matrix Choice. Nucleic acids research. 1994;22(22):4673–80. 10.1093/nar/22.22.4673 WOS:A1994PU19900018. [DOI] [PMC free article] [PubMed] [Google Scholar]
- 36.Thomas AH. BioEdit: a user-friendly biological sequence alignment editor and analysis program for Windows 95/98/NT. Nucleic Acids Symposium Series. 1999;41:95–8. [Google Scholar]
- 37.Altschul SF, Madden TL, Schaffer AA, Zhang J, Zhang Z, Miller W, et al. Gapped BLAST and PSI-BLAST: a new generation of protein database search programs. Nucleic acids research. 1997;25(17):3389–402. ; PubMed Central PMCID: PMC146917. [DOI] [PMC free article] [PubMed] [Google Scholar]
- 38.Kumar S, Stecher G, Tamura K. MEGA7: Molecular Evolutionary Genetics Analysis Version 7.0 for Bigger Datasets. Molecular biology and evolution. 2016;33(7):1870–4. 10.1093/molbev/msw054 [DOI] [PMC free article] [PubMed] [Google Scholar]
- 39.Tamura K, Dudley J, Nei M, Kumar S. MEGA4: Molecular Evolutionary Genetics Analysis (MEGA) software version 4.0. Molecular biology and evolution. 2007;24(8):1596–9. 10.1093/molbev/msm092 . [DOI] [PubMed] [Google Scholar]
- 40.Sparkes IA, Runions J, Kearns A, Hawes C. Rapid, transient expression of fluorescent fusion proteins in tobacco plants and generation of stably transformed plants. Nature protocols. 2006;1(4):2019–25. 10.1038/nprot.2006.286 . [DOI] [PubMed] [Google Scholar]
- 41.Hoglund A, Donnes P, Blum T, Adolph HW, Kohlbacher O. MultiLoc: prediction of protein subcellular localization using N-terminal targeting sequences, sequence motifs and amino acid composition. Bioinformatics. 2006;22(10):1158–65. 10.1093/bioinformatics/btl002 . [DOI] [PubMed] [Google Scholar]
- 42.Karimi M, Depicker A, Hilson P. Recombinational Cloning with Plant Gateway Vectors. Plant Physiol. 2007;145(4):1144–54. 10.1104/pp.107.106989 PMC2151728. [DOI] [PMC free article] [PubMed] [Google Scholar]
- 43.Toki S, Hara N, Ono K, Onodera H, Tagiri A, Oka S, et al. Early infection of scutellum tissue with Agrobacterium allows high-speed transformation of rice. The Plant journal: for cell and molecular biology. 2006;47(6):969–76. 10.1111/j.1365-313X.2006.02836.x . [DOI] [PubMed] [Google Scholar]
- 44.Hartley JL. DNA Cloning Using In Vitro Site-Specific Recombination. Genome research. 2000;10(11):1788–95. 10.1101/gr.143000 [DOI] [PMC free article] [PubMed] [Google Scholar]
- 45.Jain M, Nijhawan A, Tyagi AK, Khurana JP. Validation of housekeeping genes as internal control for studying gene expression in rice by quantitative real-time PCR. Biochemical and biophysical research communications. 2006;345(2):646–51. 10.1016/j.bbrc.2006.04.140 . [DOI] [PubMed] [Google Scholar]
- 46.Jiang L, Yang L, Zhang H, Guo J, Mazzara M, Van den Eede G, et al. International collaborative study of the endogenous reference gene, sucrose phosphate synthase (SPS), used for qualitative and quantitative analysis of genetically modified rice. Journal of agricultural and food chemistry. 2009;57(9):3525–32. 10.1021/jf803166p . [DOI] [PubMed] [Google Scholar]
- 47.Livak KJ, Schmittgen TD. Analysis of relative gene expression data using real-time quantitative PCR and the 2(-Delta Delta C(T)) Method. Methods. 2001;25(4):402–8. 10.1006/meth.2001.1262 . [DOI] [PubMed] [Google Scholar]
- 48.Mason G, Provero P, Vaira AM, Accotto GP. Estimating the number of integrations in transformed plants by quantitative real-time PCR. BMC Biotechnol. 2002;2(1):20 10.1186/1472-6750-2-20 [DOI] [PMC free article] [PubMed] [Google Scholar]
- 49.Verslues PE, Agarwal M, Katiyar-Agarwal S, Zhu J, Zhu JK. Methods and concepts in quantifying resistance to drought, salt and freezing, abiotic stresses that affect plant water status. The Plant journal: for cell and molecular biology. 2006;45(4):523–39. 10.1111/j.1365-313X.2005.02593.x . [DOI] [PubMed] [Google Scholar]
- 50.Hsiao TC, O'Toole JC, Yambao EB, Turner NC. Influence of Osmotic Adjustment on Leaf Rolling and Tissue Death in Rice (Oryza sativa L.). Plant Physiol. 1984;75(2):338–41. 10.1104/pp.75.2.338 [DOI] [PMC free article] [PubMed] [Google Scholar]
- 51.Andrade LM, Nobile PM, Ribeiro RV, de Oliveira JFNC, de Oliveira Figueira AV, Frigel T, et al. Characterization of PIP2 aquaporins in Saccharum hybrids. Plant Gene. 2016;5:31–7. 10.1016/j.plgene.2015.11.004 [Google Scholar]
- 52.Matus JT, Aquea F, Arce-Johnson P. Analysis of the grape MYB R2R3 subfamily reveals expanded wine quality-related clades and conserved gene structure organization across Vitis and Arabidopsis genomes. BMC plant biology. 2008;8:83–. 10.1186/1471-2229-8-83 PMC2507771. [DOI] [PMC free article] [PubMed] [Google Scholar]
- 53.Li J, Li X, Guo L, Lu F, Feng X, He K, et al. A subgroup of MYB transcription factor genes undergoes highly conserved alternative splicing in Arabidopsis and rice. Journal of experimental botany. 2006;57(6):1263–73. 10.1093/jxb/erj094 . [DOI] [PubMed] [Google Scholar]
- 54.Takemoto Y, Tashiro S, Handa H, Ishii S. Multiple nuclear localization signals of the B-mybgene product. FEBS Letters. 1994;350(1):55–60. 10.1016/0014-5793(94)00733-0 [DOI] [PubMed] [Google Scholar]
- 55.Kitamura–Abe S, Itoh H, Washio T, Tsutsumi A, Tomita M. CHARACTERIZATION OF THE SPLICE SITES IN GT–AG AND GC–AG INTRONS IN HIGHER EUKARYOTES USING FULL-LENGTH cDNAs. Journal of Bioinformatics and Computational Biology. 2004;02(02):309–31. 10.1142/s0219720004000570 [DOI] [PubMed] [Google Scholar]
- 56.Ali GS, Reddy ASN. Spatiotemporal Organization of Pre-mRNA Splicing Proteins in Plants. 2008;326:103–18. 10.1007/978-3-540-76776-3_6 [DOI] [PubMed] [Google Scholar]
- 57.Reddy AS. Alternative splicing of pre-messenger RNAs in plants in the genomic era. Annual review of plant biology. 2007;58:267–94. 10.1146/annurev.arplant.58.032806.103754 . [DOI] [PubMed] [Google Scholar]
- 58.Mazzucotelli E, Mastrangelo AM, Crosatti C, Guerra D, Stanca AM, Cattivelli L. Abiotic stress response in plants: When post-transcriptional and post-translational regulations control transcription. Plant Science. 2008;174(4):420–31. 10.1016/j.plantsci.2008.02.005 [Google Scholar]
- 59.Li J, Yang X, Wang Y, Li X, Gao Z, Pei M, et al. Two groups of MYB transcription factors share a motif which enhances trans-activation activity. Biochemical and biophysical research communications. 2006;341(4):1155–63. 10.1016/j.bbrc.2006.01.077 . [DOI] [PubMed] [Google Scholar]
- 60.Araki S, Ito M, Soyano T, Nishihama R, Machida Y. Mitotic cyclins stimulate the activity of c-Myb-like factors for transactivation of G2/M phase-specific genes in tobacco. The Journal of biological chemistry. 2004;279(31):32979–88. 10.1074/jbc.M403171200 . [DOI] [PubMed] [Google Scholar]
- 61.Jin HL, Martin C. Multifunctionality and diversity within the plant MYB-gene family. Plant Mol Biol. 1999;41(5):577–85. 10.1023/A:1006319732410 WOS:000084856200001. [DOI] [PubMed] [Google Scholar]
- 62.Kranz HD, Denekamp M, Greco R, Jin H, Leyva A, Meissner RC, et al. Towards functional characterisation of the members of the R2R3-MYB gene family from Arabidopsis thaliana. The Plant journal: for cell and molecular biology. 1998;16(2):263–76. . [DOI] [PubMed] [Google Scholar]
- 63.Nayyar H, Gupta D. Differential sensitivity of C3 and C4 plants to water deficit stress: Association with oxidative stress and antioxidants. Environmental and Experimental Botany. 2006;58(1–3):106–13. 10.1016/j.envexpbot.2005.06.021 [Google Scholar]
- 64.Lawlor DW. Genetic engineering to improve plant performance under drought: physiological evaluation of achievements, limitations, and possibilities. Journal of experimental botany. 2013;64(1):83–108. 10.1093/jxb/ers326 . [DOI] [PubMed] [Google Scholar]
- 65.Mu RL, Cao YR, Liu YF, Lei G, Zou HF, Liao Y, et al. An R2R3-type transcription factor gene AtMYB59 regulates root growth and cell cycle progression in Arabidopsis. Cell research. 2009;19(11):1291–304. Epub 2009/07/08. 10.1038/cr.2009.83 . [DOI] [PubMed] [Google Scholar]
Associated Data
This section collects any data citations, data availability statements, or supplementary materials included in this article.
Supplementary Materials
(PDF)
The values are mean ± SE (n = 4).
(TIF)
Protein sequences from monocots and A. thaliana: ScMYBAS1-2 (MH052202), ScMYBAS1-3 (MH052205), ScMYBAS1-4 (MH052203), ScMYBAS1-5 (MH052201), SbMYB23 (Sobic.005G224800.1), ZmMYB88 (AFW60113.1), OsMYBAS1-1 (Q53NK6-2), OsMYBAS1-3 (AK111626), AtMYB59-3 (AT5G59780.3) and AtMYB48-3 (AT3G46130.1).
(PDF)
Data Availability Statement
All relevant data are within the paper and its Supporting Information files.