Abstract
Continuous manufacturing, a gaining interest paradigm in the pharmaceutical industry, requires in-process monitoring of critical process parameters to ensure product consistency. This study demonstrated the application of Fourier transform near-infrared (FT-NIR) spectroscopy in conjunction with chemometrics modeling for in-line hot melt extrusion process monitoring. The obtained results suggested that inline FT-NIR analysis, along with a tailored NIR reflector, is a viable process analytical tool to monitor active pharmaceutical ingredient concentration as well as processing parameters.
Keywords: process analytical technology (PAT), NIR spectroscopy, continuous manufacturing, hot melt extrusion (HME)
INTRODUCTION
Continuous manufacturing, such as hot melt extrusion (HME), is gaining increasing interest in the pharmaceutical industry due to its high manufacturing efficiency and economic benefits. Hot melt extrusion (HME) has been utilized to develop versatile dosage forms especially for poorly soluble active pharmaceutical ingredients (API) (1,2). HME process operation parameters including screw design and rotational speed, zone temperature, and residence time must be controlled precisely to ensure the consistency and the product quality. In the new era of pharmaceutical process development, quality by design (QbD), one of the key initiatives from the FDA (3,4), requires a thorough understanding of all critical process parameters so that an effective process control strategy can be implemented for more uniform product quality and more efficient production operations.
As an invaluable in-process analytical tool, Fourier transform near-infrared (FT-NIR) spectroscopy in conjunction with multivariate analysis (MVA) techniques, most commonly principal component analysis (PCA) and partial least squares (PLS), has been used to provide near real-time chemical information. FT-NIR spectroscopy has been widely used as a process analytical technology (PAT) and QbD tool for process development and manufacturing in pharmaceutical industry to monitor and/or control such processes as drying, blending, and extrusion (5–7). It is a simple, fast, and nondestructive technique that provides multi-constituent analysis of virtually any matrix without the need for sample preparation and manipulation. More importantly, NIR provides molecular level chemical information through a direct measurement of the material being processed. It is sensitive to the API concentration in a blend, and the interactions between the API and its binding polymers.
In this technical note, we demonstrate the use of FT-NIR for in-line API concentration monitoring during an HME process. The considerations in deriving an appropriate PLS model are discussed. In addition, the feasibility of employing NIR spectral responses as an indicator for HME process stability is also explored.
MATERIALS AND METHODS
Materials
Ketoprofen was purchased from Sciencelab.com Inc. (Huston, Texas USA). Eudragit L100–55 (Eud) was generously gifted from Evonik (Essen, Germany). Stearic acid (SA) analytical grade was bought from VWR (Radnor, Pennsylvania, USA).
Extrusion
In this study, ketoprofen, SA, and Eud were used as a model drug, processing aid and matrix forming polymer, respectively. The extrusion process was aimed to manufacture ketoprofen delayed release pellets. The formulation was optimized by series of preliminary study and design of experiment (DOE) to minimize drug release in the gastric environment and maximize dissolution in simulated intestinal medium that fulfill USP requirements for delayed release dosage forms (<711> DISSOLUTION, USP 40 NF 35). The drug load was varied from 40 to 60% while the SA content was kept constant at 6.0% throughout the experiments.
The physical mixtures were prepared using mortar and pestle. The extrusion was performed on a co-rotating twin-screw extruder (Process 11™, Thermo Fisher Scientific, Karlsruhe, Germany) equipped with a 1.5-mm circular die attachment. A ventilation port was assembled at zone 7 on the barrel. The feed rate, screw speed, and temperature were set at 100 g/h, 100 rpm, and 120°C, respectively. The lowest allowable processing temperature of 120°C according to the material processing guideline was chosen to minimize thermal degradation. The feed rate and screw speed were experimentally determined to ensure adequate mixing between drug compounds and excipients while maintaining a steady-state extrusion.
NIR Spectra Collection
An Antaris II MDS FT-NIR spectrometer (Thermo Fisher Scientific, Wisconsin USA) equipped with a diffuse reflectance probe was used for spectral acquisition. The probe and a metal reflector were screwed opposite into sensor ports of the die with a gap of 2 mm. NIR spectra were collected in every 20 s with the spectral range of 4000–10,000 cm−1, 8 cm−1 spectral resolution, and 16 scans co-added (8 s scan time). A background reference spectrum was acquired using the transmission sampling module at the beginning of each experiment set.
Building a PLS Model to Monitor API Concentration
To build a calibration model to predict the API concentration during HME, the pre-blend API/polymer ratio was varied from 40 to 60%, bracketing the target API concentration of 50% (w/w). The normal process temperature was set at 120°C, but ± 10°C disturbances were introduced to simulate possible temperature variation in manufacturing process. The feed rate of 100 g/h remained constant throughout the experiment. After each API concentration change was introduced, adequate time was allowed to ensure a steady state was reached before spectral acquisition. The spectral data collected during steady states, including those at different temperatures, were used as calibration samples. The calibration sample set has a total of 85 spectra at seven concentration levels: 40, 45, 47.5, 50, 52.5, 55, and 60%. The spectra were divided into two groups: calibration (73 spectra) and validation (12 spectra). The Norris second derivative (8) was first applied to the raw spectra to remove the baseline drift, followed by a standard normal variant (SNV) to minimize the spectral path length variation. A PLS model (9) to estimate the ketoprofen concentration was then derived using the TQ Analyst™ software. All spectral data were mean-centered in the PLS regression, and the spectral range of 5500 to 6650 cm−1 was used for the correlation. PLS finds its significant model factors from the leave-one-out cross validation.
Building a PCA Model to Monitor Process Stability
To simulate potential process fluctuations during a manufacturing process, two process variables, feed rate and temperature, were introduced as process disturbances. The raw spectral data was processed with the second derivative and SNV to remove spectral baseline drift and variations in spectral path length, then analyzed using PCA (10). The spectral wavelength region used for the PCA calculation was from 9150 to 4710 cm−1.
RESULTS AND DISCUSSION
Building a PLS Model toMonitor API Concentration forHME
The overlaid NIR spectra of ketoprofen, Eud, and a 50% drug load extrudate were shown in the Fig. 1a. Both ketoprofen and Eud absorption spectra were measured at room temperature using an integration sphere module of the Antaris II spectrometer. The spectrum of the extrudate was acquired with an NIR probe during the extrusion process. All spectra had strong features in the first overtone C-H stretching region (~ 6000 cm−1). In addition, both Eud and the extrudate had noticeable peak features in the first overtone O-H stretching region (~ 6900 cm−1) (11).
Fig. 1.

a NIR spectra of ketoprofen, Eud, and 50% drug load extrudate. b NIR spectra acquired during the extrusion processes
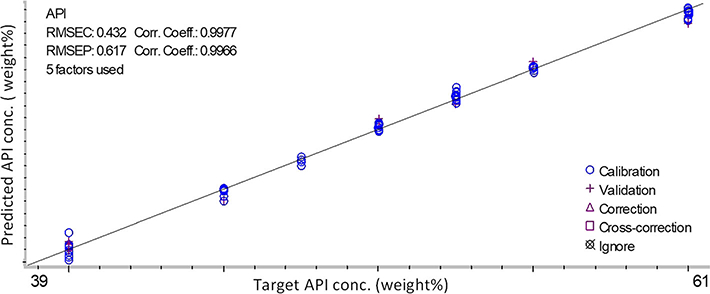
The overlaid NIR spectra of the calibration samples were presented in the Fig. 1b. There was a noticeable baseline up-drift in all spectra that might come from the scattering of the micro-size air bubbles formed during the HME process and the variation in effective path length. In the developed PLS model, five PLS model factors were used. The number of significant PLS factors represents the number of independent variables that affect sample spectral responses, such as concentration, impurities, density, opaqueness, or sample color. For example, both sample color and density could affect penetration distance or path length in reflectance and transflectance measurements, resulting in baseline drift and peak height variation, respectively. The developed PLS model (Fig. 2) has a correlation coefficient of 0.998 and a root mean squared error of calibration (RMSEC) of 0.43%. The root mean squared error of prediction (RMSEP) from the validation sample group was 0.62%.
Fig. 2.

Calibration result of drug load measurement
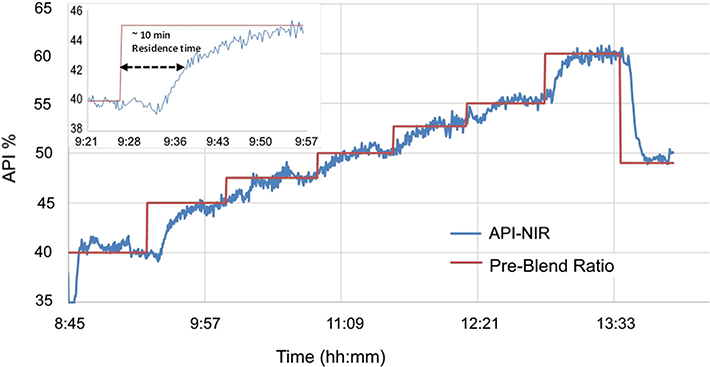
The calibration model was then applied to the spectra collected during the HME process and the results are shown in Fig. 3. As can be seen, the predicted API% tracks the preblend API profile. With a feed rate of 100 g/h, the process has a residence time of ~ 10 min, but it takes 2–3 multiples of the residence time (approximately 20–30 min) to establish a new steady state after the pre-blend ratio is introduced.
Fig. 3.

Overlay of the theoretical profile (red) and predicted drug load (blue) calculated from more than 1000 sample spectra using the PLS model
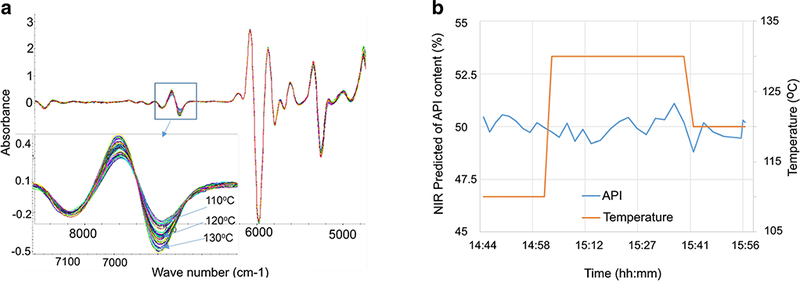
Extracting the relevant portion of the multivariate NIR spectral data is critical for a successful chemometrics model. For example, process temperature has a profound impact on measured NIR spectra because temperature can affect samples both physically (e.g., sample density) and chemically (e.g., the degree of hydrogen bonding). Figure 4a shows the second derivative NIR spectra collected at three process temperatures. There were prominent spectral changes around 6900 cm−1, likely due to the increased H-O bonding at elevated temperatures. However, this spectral region was purposely excluded from the current PLS model to ensure it keenly reflects the API concentration change without the interference from temperature induced spectral variation. The spectral range of 5500 to 6650 cm−1 was used instead for the correlation. Figure 4b shows the temperature ramping from 110 to 130°C, while maintaining a pre-blend API ratio of 50% (w/w) and feed rate of 100 g/h, simulating potential temperature variations in a real HME process. The predicted API% hovers around 49–51% throughout the experiment. The results suggest that the developed PLS model for API% prediction is robust with a ± 10°C temperature variation.
Fig. 4.

Process temperature robustness study. a Temperature impact on NIR spectra. b Predication of API% with a ± 10°C temperature variation
Process Stability Monitoring with PCA
Continuous manufacturing requires the production process to be controlled in its steady state to ensure smooth production and stable product quality. In an HME process, the controllable process variables include the speed of material flow, extrusion temperature distribution profile, and screw speed. Traditionally, an HME process is considered at its steady state when operational parameters such as torque, material temperature, and pressure reach their equilibria. NIR, on the other hand, not only provides chemical information of the samples, including blending ratio and interactions between the API and the binding material, but also is sensitive to many physical properties of the sample, such as color, temperature, and density.
PCA defines its principal component (PC) domain space through an iteration of information extraction from a calibration sample set, and converts each sample spectrum consisting of thousands of data points into a reduced, e.g., two- to three-dimensional, data point in a PC domain. The number of dimensions of a PC domain represents the number of independent process variables that affected sample spectra, such as concentration, degree of cross-link, sample color, and density. Generally, the first several principal components cover the majority of the spectral information. Scores, or coefficients, of principal components are projections of a measured sample spectrum in a PC domain. By converting a sample spectrum into a PC point, sample spectral responses during an HME process can be visually displayed in a two- or three-dimensional trend plot. Because NIR spectra are a direct measurement of the extrudate product, the trajectory of their PC coordinates movement in a PC domain should be a better representation of a HME process state. The trajectory of the PC points from one cluster to another offers an insight into the process dynamics so that a more comprehensive control strategy can be developed to make the HME process more stable.
Figure 5a is a PC score plot of the temperature experiment. The feed rate was maintained at 100 g/h. The process temperature started at 120°C. The sample spectra form a tight cluster of PC points (middle) in the PC domain. Once the process was stabilized, a 10°C temperature decrease was introduced in the temperature controller. The spectral response from the hot melts changed accordingly. As a result, the resulting PC data point moves away from the previous cluster. It took about six sampling times, or about 2 min, for the PC points to form a new cluster (right). The distance between the two clusters represents some property shift in the hot melt. Similar PC point movement was observed for the temperature change from 110 to 130°C (left cluster).
Fig. 5.

PC point plot of a temperature response and b feed rate response
Figure 5b is a PC score plot of the feed rate response experiment. The temperature was maintained at 120°C. The process started with a 100 g/h material feed rate. Once it was stabilized, the feed rate was increased to 120 g/h. Similar to the temperature experiment, it takes about 2 min for the PC data points to shift to a new location in response to the feed rate change.
CONCLUSIONS
Continuous manufacturing requires in-process monitoring of critical process parameters to ensure product consistency. In this technical note, FT-NIR in conjunction with chemometrics modeling for in-line HME process monitoring is demonstrated. In the first case, a PLS model was successfully developed for API concentration prediction by carefully selecting the relevant NIR spectral region. The developed model is also proven robust with a ± 10°C temperature fluctuation. The second case is concerned with the use of a PCA based model to monitor the process state shift in response to disturbances such as temperature and material feed rate. Because the NIR spectrum is a direct measurement of the extrudate product, the trajectory of the PC movement offers better insight to the process dynamics. Moreover, since the PCA method relies solely on an accumulation ofmultiple batches of good process spectral data to define the steady state, it does not require a calibration model. It is independent of the product formulation and is easy to implement. Finally, because NIR is nondestructive and fast, an NIR-based quality monitoring methodology can be easily transferred from process development to manufacturing.
ACKNOWLEDGEMENTS
The authors would like to thank Thermo Fisher Scientific for generously supporting this project.
FUNDING INFORMATION
This work was also partially supported by Grant Number P20GM104932 from the National Institute of General Medical Sciences (NIGMS), a component of the National Institutes of Health (NIH).
REFERENCES
- 1.Repka MA, Bandari S, Kallakunta VR, Vo, McFall H, Pimparade MB, et al. Melt extrusion with poorly soluble drugs—an integrated review. Int J Pharm. 2018;535(1–2):68–85. [DOI] [PMC free article] [PubMed] [Google Scholar]
- 2.Schaber SD, Gerogiorgis DI, Ramachandran R, Evans JMB, Barton PI, Trout BL. Economic analysis of integrated continuous and batch pharmaceutical manufacturing: a case study. Ind Eng Chem Res. 2011;50(17):10083–92. [Google Scholar]
- 3.Food, Administration D. Guidance for industry, PAT-A Framework for Innovative Pharmaceutical Development, Manufacturing and Quality Assurance. 2004. http://www.fda.gov/cder/guidance/published html.
- 4.Guideline IHT. Pharmaceutical development. Q8 (2R) as revised in August . 2009.
- 5.Markl D, Wahl PR, Menezes JC, Koller DM, Kavsek B, Francois K, et al. Supervisory control system for monitoring a pharmaceutical hot melt extrusion process. AAPS PharmSciTech. 2013;14(3):1034–44. [DOI] [PMC free article] [PubMed] [Google Scholar]
- 6.Chablani L, Taylor MK, Mehrotra A, Rameas P, Stagner WC. Inline real-time near-infrared granule moisture measurements of a continuous granulation-drying-milling process. AAPS PharmSciTech. 2011;12(4):1050–5. [DOI] [PMC free article] [PubMed] [Google Scholar]
- 7.Smith-Goettler B, Gendron C, MacPhail N, Meyer R, Phillips J. NIR monitoring of a hot-melt extrusion process. Spectroscopy. 2011;26(8). [Google Scholar]
- 8.Rinnan Å, Berg FV, Engelsen SB. Review of the most common pre-processing techniques for near-infrared spectra. TrAC Trends Anal Chem. 2009;28(10):1201–22. [Google Scholar]
- 9.Geladi P, Kowalski BR. Partial least-squares regression: a tutorial. Anal Chim Acta. 1986;185(Supplement C):1–17. [Google Scholar]
- 10.Abdi H, Williams LJ. Principal component analysis. Wiley Interdisciplinary Reviews: Computational Statistics. 2010;2(4):433–59. [Google Scholar]
- 11.Workman J Jr, Weyer L. Practical guide to interpretive near-infrared spectroscopy. Boca Raton: CRC press; 2007. [Google Scholar]


