

Abstract
Objectives
The relationship between obesity and grip strength, a key indicator of sarcopenia, has been inconsistently reported. We aimed to examine associations between grip strength and both body mass index (BMI), a clinical indicator of total adiposity, and waist circumference (WC), an indicator of central adiposity.
Design
Cross-sectional study.
Setting and Participants
Data collected from 8,441 men and women, aged 48–92 years old, who attended the third health examination of the European Prospective Investigation into Cancer-Norfolk study was used.
Measurements
Maximum grip strength (Smedley dynamometer), BMI (weight/height2) and WC (measured at the natural waist) were ascertained at a research clinic. The associations between grip strength and adiposity measures were explored using linear regression with adjustment for age, height, social class, physical activity, prevalent disease, smoking status and alcohol intake.
Results
Men and women were examined separately and those in the upper quartile of BMI were 2.70kg (95%CI 2.07, 3.33) and 1.46kg (95%CI 1.05, 1.86) stronger respectively than those in the bottom quartile (P trends <0.001). Grip strength also increased weakly with increasing WC. However, including both BMI and WC in the same regression model revealed an inverse association between grip strength and WC, whilst the previously observed association with BMI strengthened. For every 10cm increase in WC, grip strength was 3.56kg (95%CI 3.04, 4.08) lower in men and 1.00kg (95%CI 0.74, 1.24) lower in women.
Conclusions
Larger overall body mass, indicated by higher BMI, is associated with stronger grip strength but high WC, a clinical indicator of central obesity, is associated with lower grip strength. Abdominal fat is the most metabolically active adipose tissue and this provides a clue to potential mechanisms underlying relationships between fat and skeletal muscle. Additionally, it reinforces the recommendation to measure WC in clinical practice, especially when BMI is below obese ranges.
Key words: Grip strength, central obesity, sarcopenia, aging
Introduction
Sarcopenia, defined as the presence of low muscle mass and low function (1), is prevalent in an estimated 5-13% of 60-70 year olds and 11-50% of men and women over 80 years old and incurs considerable healthcare costs through its association with disability (2, 3, 4). Low grip strength (men: <30kg; women: <20kg), a correlate of general muscle strength, has been proposed as a key indicator of sarcopenia and lower grip strength has also been independently associated with important health outcomes such as an increased risk of institutionalisation and death (5, 6). Grip strength declines with age but within age groups considerable heterogeneity in function is evident (7). Therefore, understanding the determinants of grip strength is important if we are to understand the mechanisms that lead to poor muscle function in some older people and develop policies and interventions to optimise functional health in later life.
Obesity is a modifiable risk factor for poor health and is an attractive target for public health intervention due to its high population prevalence (8). Increasing adiposity has been proposed as a risk factor for sarcopenia and the relationship between adipose tissue and muscle is receiving increased scrutiny. Body fat distribution is known to change with age, with a reduction in subcutaneous fat and an increase in central adiposity and ectopic fat, e.g., fat deposition in muscle. Fatty infiltration of muscle is associated with reduced strength (9) but increasing central adiposity could also influence muscle function through increased levels of inflammation and insulin resistance (10).
However, the association between adiposity and grip strength has been described differently by different authors. Total body fat mass was inversely associated with grip strength and muscle quality (grip strength/arm lean mass) in a cross-sectional analysis of participants from the Health, Aging and Body Composition Study (11). Low grip strength was also associated with a history of obesity (defined as body mass index >30kg/m2) in Finnish men and women and with increased central adiposity (measured using waist circumference) in a British cohort (12, 13). However, obese women (body mass index >29kg/m2) in France did not differ from non-obese women in terms of hand grip or knee extension strength, with the exception of a sub-group of physically active older women. In these women, obesity was associated with stronger muscle strength (14). A meta-analysis of data from several UK cohorts also showed increasing grip strength with increasing body mass index (BMI) in men, but no significant difference in grip strength across BMI categories in women (15). Additionally, non-linear associations have been suggested (11).
The divergent conclusions reported to date reflect the challenging issues in the study of this association. Firstly, the most commonly used marker of obesity is body mass index (BMI), a measure which incorporates both fat and fat-free mass in its calculation. Therefore, increases in BMI indicate increases in lean as well as fat mass (16), which are additionally highly correlated measures (17). Co-variables used to account for lean mass in analyses differ between studies and may contribute to the inconsistency of results (12, 14, 18). Secondly, BMI does not indicate fat distribution. It is important to consider fat distribution since the properties of adipose tissue are not homogenous throughout the body and different associations of fat with health outcomes have been observed, based on the site of fat accumulation (19, 20). Centrally deposited adipose tissue is most closely associated with the metabolic consequences of obesity and increased waist circumference (WC) is a key criterion for identifying the metabolic syndrome (21).
This report examines the cross-sectional associations of BMI and WC with grip strength in 8,441 men and women who were enrolled in the European Prospective Investigation of Cancer-Norfolk cohort study and attended the third health examination (2004-2011). We focus on BMI and WC as the most widely available and clinically feasible measures of total and central adiposity and consider what each measure adds to our understanding of the relationship between obesity and muscle strength.
Methods
Study Population
Men and women participating in the EPIC-Norfolk study were invited to attend a third health examination (3HC). The initial study design and details of the 3HC are reported elsewhere (22, 23). In brief, 8 623 participants attended a central clinic in Norwich for a comprehensive health examination conducted by trained research nurses. Of these, 8 441 participants have complete data for grip strength, waist circumference and BMI (missing values: 150 grip strength, 20 BMI, 20 waist circumference). Older and female participants were more likely to have missing grip strength measurements (24).
Grip strength
Grip strength was measured using a Smedley dynamometer (Scandidact, Kvistgaard, Denmark) whilst the participant was standing with their forearm held out in front (25). Participants were allowed two trials with each hand and the maximum strength achieved was used in analyses.
Anthropometry
Height was measured to the nearest 0.1cm using a stadiometer (Chasemores, UK) and weight to the nearest 0.1kg using digital scales (Tanita, Middlesex, UK). BMI was calculated by dividing weight in kilograms by height in metres squared.
WC was measured to the nearest 0.1cm using a D-loop non-stretch fibreglass tape with the participant standing in a relaxed position. The narrowest point between the ribs and iliac crest was taken as the waist. If no natural waist was evident, measurement was made at the level of the umbilicus. Two measurements were made for each participant and the average value used.
Co-variables
At the 3HC participants completed a health and lifestyle questionnaire. Participants were asked ‘Do you currently smoke cigarettes?’ and ‘If you have stopped smoking, how old were you when you gave up?’ Based on answers to these questions participants were categorised as current/ex-smokers or never smokers. Participants were also asked ‘did you drink alcohol in the last week?’ and ‘If YES, during the last week how many of the following alcoholic drinks have you consumed?’ Participants were asked to enter the number of drinks of beer, cider, lager, wine, sherry and spirits consumed per day and this information was used to calculate alcohol intake in units/ week. A four point index describing total physical activity level was derived from self-reported activity at work and during leisure-time. This index has been validated against daily energy expenditure (26) and is predictive of future mortality (27).
At baseline (1993-1997) participants were asked to describe their current occupation (or previous occupation if retired) and this information was used to assign participants into one of six occupational social classes: I ‘professional’; II ‘managerial’; III-non manual (NM) ‘skilled non-manual’; III-manual (M) ‘skilled manual’; IV ‘partly skilled or V ‘unskilled’. Participants were also asked ‘Has the doctor ever told you that you have any of the following?’ after which a number of medical complaints were listed including ‘heart attack (myocardial infarction)’, ‘stroke’ and ‘cancer’. Participants ticked yes to indicate that they had suffered the condition. This information was combined with that from a subsequent health questionnaire, administered at the second health examination (2HC,1998-2000), and incident data captured over the follow-up period (through record linkage with hospital episode statistics) in order to estimate co-morbidity at the 3HC. After excluding non-melanoma skin cancer, those who had ever suffered a heart attack, stroke or cancer were identified.
Statistical Analyses
The 8,441 participants included in this study were divided into sex specific quartiles of BMI and participant characteristics were described using means (standard deviation), medians (interquartile range) and frequencies (%, number).
Data from men and women were analysed separately since muscle strength, body size and body shape differ markedly between sexes. Within sex categories, maximum grip strength, BMI and WC were normally distributed.
The relationship between obesity and grip strength was first explored using linear regression and sex-specific quartiles of BMI as the adiposity measure. All analyses were adjusted for height and age. Height is an important non-modifiable determinant of grip strength due to its correlation to lean mass and representation of skeletal size (28). Final models were also adjusted for smoking status, alcohol intake, physical activity level, occupational social class and co-morbidity. These potential confounding variables were identified a priori from the existing literature. Using similar regression models, the association between grip strength and sex-specific quartiles of WC was also examined. Regression coefficients represent the differences in grip strength in quartiles 2, 3 and 4 of the exposure variable compared to quartile 1.
Associations of grip strength with BMI were also explored using clinical categories of BMI based on the World Health Organisation (WHO) classification (underweight, normal weight, overweight, obese I, >obese II). This facilitated exploration of the association with grip strength at high levels of BMI (>30kg/m2), which were less well represented by the division of the cohort into sex-specific quartiles. Due to the small numbers of underweight participants, those with a BMI <20kg/m2 (instead of <18.5kg/m2) were categorised as underweight (15).
Subsequently, the independent associations of BMI and WC with grip strength were considered. To explore the shapes of any associations, age and height adjusted grip strength was explored by sex-specific tertile of WC after stratification of the cohort into sex-specific tertiles of BMI. Then, the associations were quantified using linear regression. Differences in grip strength per 10cm increase in WC and per 4.0kg/m2 increase in BMI were determined within tertiles of BMI and WC respectively and in all men and all women with mutual adjustment for BMI and WC, as well as other co-variables. The standard deviations (sd) for BMI and WC were 3.6kg/m2 and 9.8cm in men and 4.8kg/m2 and 12.0cm in women. Therefore, differences in grip strength per 10cm increase in WC and per 4.0kg/m2 increase in BMI were evaluated, to facilitate comparisons between sexes.
Although significant correlations are observed between WC and BMI (Pearson r=0.86 [p<0.001] in men and women) it is logical to include these measures in the same model, since BMI indicates total adiposity whereas WC indicates central obesity and individuals with similar BMI can vary greatly in body shape (Figure 1, Supplementary Data).
Figure 1.
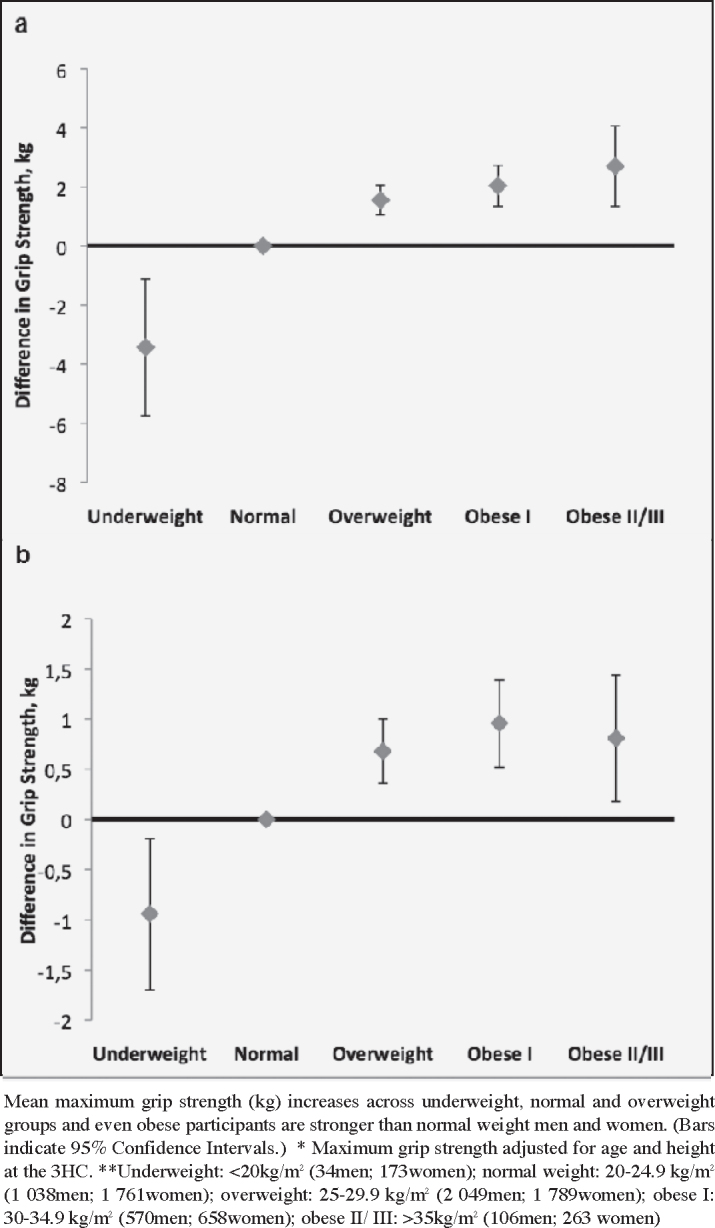
Maximum grip strength* (kg) by World Health Organisation BMI category** in men (a) and women (b)
Missing Data
Multivariable linear regression models included only those men and women with complete co-variable data. 163 men and 233 women had missing information (social class: 79; physical activity: 116; smoking: 55; alcohol intake: 322). These participants were older and tended to have lower grip strengths, although were not different in terms of BMI or WC from those with complete data (Table 1, Supplementary Data).
Table 1.
Characteristics of men and women attending the 3HC of EPIC-Norfolk*
| Variable | Quartiles of Body Mass Index (range, kg/m2) | ||||
|---|---|---|---|---|---|
| Q1 | Q2 | Q3 | Q4 | P value | |
| Men (n=3797) | (<24.7) | (24.7-26.7) | (26.7-28.9) | (>28.9) | |
| Age, years | 68.9 (8.3) | 69.7 (8.0) | 69.7 (8.0) | 69.5 (8.1) | 0.09 |
| Height, cm | 174.0 (6.8) | 173.4 (6.6) | 173.6 (6.4) | 173.1 (6.8) | 0.02 |
| Weight, kg | 69.8 (6.9) | 77.5 (6.1) | 83.8 (6.5) | 95.4 (11.1) | <0.001 |
| BMI, kg/m2 | 23.0 (1.4) | 25.7 (0.6) | 27.8 (0.7) | 31.8 (2.9) | <0.001 |
| Waist Circumference, cm | 90.7 (5.8) | 97.3 (4.9) | 102.2 (5.0) | 111.4 (8.1) | <0.001 |
| Grip strength, kg | 38.0 (8.0) | 38.8 (8.0) | 39.5 (8.1) | 40.1 (8.8) | <0.001 |
| Smoking status***, % (n) | |||||
| Never smoker | 51.4 (488) | 46.3 (440) | 42.7 (406) | 35.2 (334) | |
| Ever smoker | 47.9 (455) | 53.0 (503) | 56.7 (538) | 64.4 (612) | <0.001 |
| Physical activity***, % (n) | |||||
| Active | 20.8 (197) | 19.2 (182) | 18.0 (171) | 16.0 (152) | |
| Moderately active | 19.8 (188) | 18.9 (179) | 18.8 (178) | 16.1 (153) | |
| Moderately inactive | 27.7 (263) | 24.9 (236) | 23.6 (224) | 23.4 (222) | |
| Inactive | 30.0 (285) | 35.8 (340) | 38.4 (364) | 42.6 (405) | <0.001 |
| Social Class***, % (n) | |||||
| I-III non-manual | 65.5 (622) | 65.6 (623) | 62.0 (588) | 63.6 (604) | |
| III manual-V | 33.8 (321) | 33.4 (317) | 37.1 (352) | 36.2 (344) | 0.27 |
| Prevalent MI, % (n) | 4.7 (45) | 5.6 (53) | 4.7 (45) | 7.6 (72) | 0.02 |
| Prevalent cancer, % (n) | 9.8 (93) | 8.4 (80) | 10.9 (103) | 8.6 (82) | 0.24 |
| Prevalent stroke, % (n) | 2.5 (24) | 2.8 (27) | 3.2 (30) | 4.2 (40) | 0.18 |
| Alcohol (units/ week)** |
10 (2, 20) |
11 (2, 24) |
12 (4, 22) |
9 (0, 22) |
0.19 |
| Q1 | Q2 | Q3 | Q4 | ||
|
Women (n=4644) |
(<23.3) |
(23.3-25.8) |
(25.8-29.0) |
(>29.0) |
|
| Age, years | 67.2 (8.3) | 68.0 (8.0) | 68.8 (8.0) | 68.2 (7.6) | <0.001 |
| Height, cm | 161.5 (6.2) | 160.6 (6.1) | 160.3 (6.2) | 159.7 (6.2) | <0.001 |
| Weight, kg | 56.2 (5.7) | 63.5 (5.2) | 70.3 (5.8) | 84.3 (11.7) | <0.001 |
| BMI, kg/m2 | 21.5 (1.5) | 24.6 (0.7) | 27.3 (0.9) | 33.0 (3.9) | <0.001 |
| Waist Circumference, cm | 77.7 (6.5) | 85.3 (6.1) | 92.1 (6.4) | 103.4 (9.7) | <0.001 |
| Grip strength, kg | 24.1 (5.4) | 24.2 (5.4) | 24.4 (5.5) | 24.7 (5.8) | 0.04 |
| Smoking status***, % (n) | |||||
| Never smoker | 65.7 (763) | 66.6 (773) | 67.1 (779) | 60.2 (699) | |
| Ever smoker | 33.6 (390) | 32.1 (373) | 32.6 (379) | 39.1 (454) | 0.001 |
| Physical activity***, % (n) | |||||
| Active | 20.0 (197) | 13.9 (161) | 12.4 (144) | 11.3 (132) | |
| Moderately active | 20.1 (233) | 15.6 (181) | 16.9 (196) | 14.5 (168) | |
| Moderately inactive | 30.1 (350) | 35.2 (409) | 32.9 (383) | 29.0 (337) | |
| Inactive | 31.6 (367) | 36.9 (428) | 36.9 (428) | 44.1 (512) | <0.001 |
| Social Class***, % (n) | |||||
| I-III non-manual | 71.4 (829) | 66.9 (777) | 64.5 (749) | 62.4 (725) | |
| III manual-V | 27.6 (321) | 31.7 (368) | 34.5 (401) | 36.3 (421) | <0.001 |
| Prevalent MI, % (n) | 1.5 (17) | 2.0 (23) | 1.2 (14) | 3.5 (41) | <0.001 |
| Prevalent cancer, % (n) | 13.8 (160) | 13.1 (152) | 11.6 (135) | 12.1 (140) | 0.18 |
| Prevalent stroke, % (n) | 1.9 (22) | 1.0 (12) | 1.6 (18) | 1.5 (17) | 0.39 |
| Alcohol (units/ week)** |
6 (0, 13) |
4.5 (0, 12) |
4 (0, 12) |
2 (0, 10) |
<0.001 |
*data are presented as means and standard deviations unless otherwise stated; ** Median (inter-quartile range); MI=myocardial infarction; kg: kilograms; m: metres; cm: centimetres; % (n): frequency(number); ***percentages may not add up to 100% due to missing data;
Results
The characteristics of the 3 797 men and 4 644 women included in this study, aged 48-92 years old, are shown in Table 1 by quartile of body mass index. Mean BMI was 27.1 kg/m2 (sd 3.6 kg/m2) for men with participants ranging from 16.2-52.9 kg/m2. For women, mean BMI was 26.6 kg/m2 (sd 4.8 kg/m2) with participants ranging from 14.4-59.6 kg/m2. Although a large range of BMI was observed in men and women, only 12 (0.03%) men and 49 (1.1%) women had a BMI <18.5kg/m2. Additionally, extreme obesity was less well represented with 106 (2.8%) men and 263 (5.7%) women recording a BMI >35 kg/m2.
Grip strength increased across quartiles of BMI (Table 2). After multivariable adjustment, a difference of 2.70kg (95% CI 2.07, 3.33) was observed between the top and bottom BMI quartiles in men. In women, this difference was 1.46kg (95%CI 1.05, 1.86). Grip strength also increased with increasing WC in both sexes although the association was weak and attenuated after multivariable adjustment.
Table 2.
Difference in maximum grip strength (kg) over quartiles (Q) of body mass index (BMI) and waist circumference (WC) in men and women attending the 3HC of EPIC-Norfolk
| Regression Coefficient (95% Confidence Interval) | |||
|---|---|---|---|
| Obesity Indicator | Adjusted for Age | Adjusted for Age & Height | Multivariable Model** |
| Men* | |||
| BMI (n=3634) | |||
| Q1 | 0 | 0 | 0 |
| Q2 | 1.27 (0.63,1.91) | 1.39 (0.77,2.01) | 1.42 (0.80,2.05) |
| Q3 | 1.90 (1.26,2.55) | 1.98 (1.36,2.61) | 2.03 (1.41,2.66) |
| Q4 | 2.36 (1.72,3.01) | 2.57 (1.95,3.20) | 2.70 (2.07,3.33) P trend <0.001 |
| WC (n=3634) | |||
| Q1 | 0 | 0 | 0 |
| Q2 | 0.79 (0.14, 1.44) | 0.55 (-0.09, 1.18) | 0.60 (-0.04, 1.23) |
| Q3 | 1.21 (0.56, 1.86) | 0.58 (-0.06, 1.23) | 0.66 (0.01, 1.30) |
| Q4 | 1.00 (0.35, 1.66) | 0.19 (-0.45, 0.84) | 0.34 (-0.32, 0.99) P trend 0.32 |
| Women* | |||
| BMI (n=4411) | |||
| Q1 | 0 | 0 | 0 |
| Q2 | 0.42 (0.01,0.84) | 0.58 (0.18,0.99) | 0.62 (0.22,1.02) |
| Q3 | 0.86 (0.45,1.28) | 1.03 (0.63,1.43) | 1.08 (0.69,1.48) |
| Q4 | 0.97 (0.56,1.38) | 1.31 (0.90,1.71) | 1.46 (1.05,1.86) P trend <0.001 |
| WC (n=4411) | |||
| Q1 | 0 | 0 | 0 |
| Q2 | 0.28 (-0.14, 0.70) | 0.19 (-0.22, 0.59) | 0.23 (-0.17, 0.64) |
| Q3 | 0.55 (0.13, 0.96) | 0.35 (-0.05, 0.76) | 0.42 (0.02, 0.83) |
| Q4 |
0.45 (0.03, 0.86) |
0.22 (-0.18, 0.63) |
0.37 (-0.04, 0.78) P trend 0.05 |
*only participants with complete data for all co-variables are included in analyses; **adjusted for age at 3HC, height, social class (I, II, IIINM, IIIM, IV, V), physical activity level (active, moderately active, moderately inactive or inactive), prevalent myocardial infarction (yes, no) prevalent stroke (yes, no) prevalent cancer (yes, no), smoking status (current/former, never), alcohol intake (units per week); n: number; Waist Circumference quartiles- men: <94cm, 94-99.5cm, 99.5-106cm, >106cm; women: <81cm, 81-88.5cm, 88.5-97cm, >97cm
When BMI was classified according to WHO criteria (with modification of the underweight category), grip strength was lower in underweight men and women, increased through normal and overweight categories and then plateaued through obese BMI ranges (Figure 1). There was a suggestion that grip strength declined in extremely obese women, although grip strength was still higher than ‘normal’ weight individuals.
Although no strong associations were seen with WC in initial analyses (Table 2), within tertiles of BMI grip strength decreased with increasing WC. Additionally, the previously characterised association between higher BMI and stronger grip strength was preserved so that men and women with similar WC but higher BMI were stronger (Figure 2, Table 3). Overall, for every 10cm increase in waist circumference grip strength decreased by 3.56kg (95%CI 3.04, 4.08) in men and 1.00kg (95%CI 0.74, 1.24) in women, after adjustment for BMI and other co-variables. For every 4.0kg/m2 increase in BMI grip strength increased by 4.38kg (95%CI 3.84, 4.93) in men and 1.26kg (95%CI 1.02, 1.53) in women, after adjustment for WC and other co-variables (Table 3).
Figure 2.

Maximum grip strength* (kg) by tertile of BMI and WC in men (a) and women (b)
Table 3.
Differences in maximum grip strength (kg) associated with a standard deviation increase in waist circumference (WC, 10cm) or body mass index (BMI, 4.0kg/m2) in the whole cohort and within tertiles of BMI and WC respectively
| Regression Coefficient (95% Confidence Interval) | |||||
|---|---|---|---|---|---|
| Obesity Indicator | N | Adjusted for Age & Height | P value | Multivariable Model** | P value |
| Men | |||||
| WC (10cm) | |||||
| BMI T1 | 1265 | -0.46 (-1.12, 0.20) | 0.17 | - | |
| BMI T2 | 1266 | -2.96 (-3.78, -2.14) | <0.001 | - | |
| BMI T3 | 1266 | -1.11 (-1.61, -0.61) | <0.001 | - | |
| ALL* | 3634 | -3.65 (-4.17, -3.13) | <0.001 | -3.56 (-4.08, -3.04) | <0.001 |
| BMI (4.0kg/m2) | |||||
| WC T1 | 1261 | 3.91 (3.20, 4.64) | <0.001 | - | |
| WC T3 | 1267 | 4.00 (3.16, 4.86) | <0.001 | - | |
| WC T3 | 1269 | 1.18 (0.68, 1.68) | <0.001 | - | |
| ALL* | 3634 | 4.44 (3.90, 4.99) | <0.001 | 4.38 (3.84, 4.93) | <0.001 |
| Women | |||||
| WC (10cm) | |||||
| BMI T1 | 1548 | -0.46 (-0.82, -0.10) | 0.01 | - | |
| BMI T2 | 1548 | -0.81 (-1.20, -0.41) | <0.001 | - | |
| BMI T3 | 1548 | -0.48 (-0.74, -0.22) | <0.001 | - | |
| ALL* | 4411 | -1.02 (-1.27, -0.77) | <0.001 | -1.00 (-1.24, -0.74) | <0.001 |
| BMI (4.0kg/m2) | |||||
| WC T1 | 1525 | 1.06 (0.65, 1.46) | <0.001 | - | |
| WC T2 | 1569 | 1.23 (0.80, 1.65) | <0.001 | - | |
| WC T3 | 1550 | 0.36 (0.14, 0.59) | 0.002 | - | |
| ALL* |
4411 |
1.24 (0.99, 1.49) |
<0.001 |
1.26 (1.02, 1.53) |
<0.001 |
Participants are stratified by sex and tertile (T) of BMI and WC; ** adjusted for age at 3HC, height, body mass index or waist circumference, social class (I, II, IIINM, IIIM, IV, V), physical activity level (active, moderately active, moderately inactive or inactive), prevalent myocardial infarction (yes, no) prevalent stroke (yes, no) prevalent cancer (yes, no), smoking status (current/ former, never), alcohol intake (units per week).; *only participants with complete data for all co-variables are included in analyses and analyses adjusted for age and height were also adjusted for either BMI or WC, as appropriate.
Results were similar if the cohort was stratified by the presence of co-morbidity. In 3 060 men and 3 749 women who had not suffered a heart attack, stroke or cancer, grip strength decreased by 3.60kg (95%CI 3.01, 4.18) and 0.98kg (95%CI 0.72, 1.26) for every 10cm increase in WC and increased by 4.43kg (95%CI 3.82, 5.04) and 1.25kg (95%CI 0.96, 1.52) for every 4.0kg/m2 increase in BMI after multivariable adjustment. In the 574 men and 662 women included in multivariable models who had suffered a co-morbid event, grip strength decreased by 3.42kg (95%CI 2.25, 4.58) and 0.98kg (95%CI 0.36, 1.60) for every 10cm increase in WC and increased by 4.15kg (95%CI 2.92, 5.39) and 1.31kg (95%CI 0.68, 1.94) for every 4.0kg/m2 increase in BMI.
Discussion
Obesity is a known risk factor for poor health and sarcopenia is a significant cause of morbidity in later life. However, relationships between BMI and grip strength, a key indicator of sarcopenia, have been inconsistently reported. Furthermore, few studies have examined associations with other markers of obesity such as waist circumference.
We observed an increase in grip strength with increasing BMI in cross-sectional analyses of men and women attending the 3HC of EPIC-Norfolk. This relationship was robust over the normal and overweight ranges of BMI but plateaued at more obese levels, although obese participants were still stronger than normal weight individuals. However, BMI may not be the most appropriate marker of obesity in this context since it incorporates lean mass in its calculation, a determinant of muscle strength, and it is difficult to account for variations in lean mass in analyses. We adjusted analyses for height, since height is a correlate of lean mass and skeletal size is a strong determinant of grip strength (28). Although this was probably inadequate, others who have adjusted analyses for weight encounter problems with over-adjustment (29).
Additionally, BMI does not indicate body shape and different associations with health endpoints have been observed depending on the site of fat accumulation. Increased abdominal fat has been most closely associated with health outcomes such as the metabolic syndrome, cardiovascular disease and death (19, 21). Therefore, we considered the association of WC with grip strength and observed that within tertiles of BMI, grip strength decreased with increasing waist circumference. This concurs with previous observations (13, 15) but was only evident after accounting for BMI suggesting reverse confounding. Furthermore, when WC and BMI were included in the same linear regression model the positive association of grip strength with BMI strengthened. Therefore, when included together, BMI appeared to represent the differences in body size and composition associated with stronger grip strength, such as increases in lean mass, and WC differences associated with weaker strength, such as central obesity. Associations were unchanged after stratification of the cohort by the presence of major co-morbidity and effect sizes were clinically relevant, since just a 1kg increase in grip strength is associated with a 3% reduction in mortality (6).
Although our study cannot establish causality, the positive association between BMI and grip strength is consistent with reports that in older people overly restrictive diets are not advantageous (30), higher BMI is associated with lower mortality (31) and that chronic undernutrition plays an important role in the pathophysiology of sarcopenia and frailty (32, 33). In addition, it is plausible that increasing central obesity could negatively influence muscle strength. Abdominal fat secretes cytokines and hormones (adipokines) such as TNF-α, IL-6, adiponectin, leptin and resistin. Adipokines are important for immune-modulation, inflammatory responses, energy balance and fatty acid and glucose metabolism, all of which suffer dysregulation with increasing abdominal obesity. Observational studies have shown associations between both inflammation and increased fasting plasma glucose and low muscle strength (13, 34, 35). Additionally, molecular and physiological studies have demonstrated receptors to leptin and adiponectin on skeletal muscle cells and shown that their activation promotes fatty acid oxidation, decreases fatty acid deposition and increases the insulin sensitivity of muscle tissue (36). In obese individuals, skeletal muscle appears to develop resistance to leptin and adiponectin and circulating levels of adiponectin additionally decline (37). These effects increase skeletal muscle insulin resistance, an important factor in the development of type II diabetes, and demonstrate the close link between the metabolic functions of central adipose tissue and skeletal muscle. Considering adiponectin, leptin and resistin concentrations have also been associated with muscle strength (38) it is plausible that with central obesity and changes in the metabolic function of skeletal muscle, its mechanical function also changes.
We examined men and women separately and, although there was no difference in the direction of associations, differences in grip strength with increasing BMI or WC were three to four times larger in men compared to women which cannot be fully explained by the greater absolute strength of men. Greater variation in muscle mass amongst men may contribute to the larger differences in grip strength by BMI category, but the smaller differences in grip strength with increasing WC in women are difficult to explain. Differences in the levels of adipokines in men compared to women have been reported, along with differential associations with muscle parameters (38). However, much remains to be elucidated regarding the interplay of adipokines, inflammatory mediators and traditional endocrine factors such as levels of anabolic hormones.
We should consider the limitations of our study. We cannot be certain that the associations observed were not due to residual confounding. Socioeconomic factors or aspects of physical activity not captured by our co-variable measurements could be important. Additionally, all results are cross-sectional and although we have postulated that obesity and impaired metabolic function of muscle could lead to impaired mechanical function, it could also be true that low mechanical activity could promote undesirable metabolic consequences and obesity (39). Further work using longitudinal measures of adiposity and muscle strength are needed and longitudinal studies should specifically measure central obesity.
There is also likely to be a ‘healthy volunteer’ effect and consistent with this we had few participants who were underweight or at the extreme of obesity. Therefore, our conclusions are valid within the range of BMI and WC present in our study but we cannot generalise our findings to the whole population.
The strengths of this study include the large sample size and the measurement of different markers of ‘obesity’. Additionally, men and women could be examined separately and the cohort has been well characterised using validated measurement techniques allowing for control of important potential confounding factors.
In conclusion, the two most commonly used clinical measures of obesity: body mass index, a weight related measure of total adiposity, and waist circumference, a central adiposity measure, show different directions of association with grip strength. We have found that grip strength increases with increasing BMI and can conclude that low BMI is associated with low muscle strength. However, BMI represents both lean and fat mass and does not indicate fat distribution. In contrast, waist circumference is a reliable marker of central fat accumulation and we found that high waist circumference was associated with lower grip strength, after adjustment for BMI. This provides clues to the aetiological mechanisms driving the decline in muscle strength with age and supports recommendations to measure central obesity in clinical practice, especially when BMI is below ‘obese’ ranges.
Acknowledgements: The EPIC-Norfolk study is funded by programme grants from the Medical Research Council (G0401527) and Cancer Research UK (C864/A8257) whilst the 3HC clinic was funded by a grant from Research into Ageing (262). Dr Victoria L Keevil is funded by a Wellcome Trust Clinical Training Fellowship (092077/Z/10/Z). We would like to thank our study participants and the Norfolk General Practitioners who made the EPIC-Norfolk study possible. We would also like to thank all research and administrative staff, both those based in Cambridge and Norwich, for their dedication and hard work over the duration of the study.
Conflicts of Interest: VLK, RL, ND, SH, AAS, NJW & KK have no conflicts of interest to declare.
Ethics Statement: The EPIC-Norfolk study followed the principles of the Declaration of Helsinki and the Research Governance Framework for Health and Social Care. The study was approved by the Norfolk Local Research Ethics Committee (05/Q0101/191) and the East Norfolk and Waveney National Health Service (NHS) Research Governance Committee (2005EC07L). Signed, informed consent was obtained at baseline and at the 3HC for all participants.
References
- 1.Cruz-Jentoft AJ, Baeyens JP, Bauer JM, Boirie Y, Cederholm T, et al. Sarcopenia: European consensus on definition and diagnosis: Report of the European Working Group on Sarcopenia in Older People. Age Ageing. 2010;39:412–423. doi: 10.1093/ageing/afq034. 10.1093/ageing/afq034 PMCID 2886201; PubMed PMID: 20392703. [DOI] [PMC free article] [PubMed] [Google Scholar]
- 2.Morley JE. Sarcopenia: diagnosis and treatment. J Nutr Health Aging. 2008;12:452–456. doi: 10.1007/BF02982705. 10.1007/BF02982705 PubMed PMID: 18615226. [DOI] [PubMed] [Google Scholar]
- 3.Janssen I, Shepard DS, Katzmarzyk PT, Roubenoff R. The healthcare costs of sarcopenia in the United States. J Am Geriatr Soc. 2004;52:80–85. doi: 10.1111/j.1532-5415.2004.52014.x. 10.1111/j.1532-5415.2004.52014.x PubMed PMID: 14687319. [DOI] [PubMed] [Google Scholar]
- 4.Patel HP, Syddall HE, Jameson K, Robinson S, Denison H, et al. Prevalence of sarcopenia in community-dwelling older people in the UK using the European Working Group on Sarcopenia in Older People (EWGSOP) definition: findings from the Hertfordshire Cohort Study (HCS) Age Ageing. 2013;42:378–384. doi: 10.1093/ageing/afs197. 10.1093/ageing/afs197 PMCID 3633365; PubMed PMID: 23384705. [DOI] [PMC free article] [PubMed] [Google Scholar]
- 5.Cooper R, Kuh D, Cooper C, Gale CR, Lawlor DA, et al. Objective measures of physical capability and subsequent health: a systematic review. Age Ageing. 2011;40:14–23. doi: 10.1093/ageing/afq117. 10.1093/ageing/afq117 PMCID 3000177; PubMed PMID: 20843964. [DOI] [PMC free article] [PubMed] [Google Scholar]
- 6.Cooper R, Kuh D, Hardy R. Objectively measured physical capability levels and mortality: systematic review and meta-analysis. BMJ. 2010;341:c4467. doi: 10.1136/bmj.c4467. 10.1136/bmj.c4467 c4467, PMCID 2938886; PubMed PMID: 20829298. [DOI] [PMC free article] [PubMed] [Google Scholar]
- 7.Frederiksen H, Hjelmborg J, Mortensen J, McGue M, Vaupel JW, et al. Age trajectories of grip strength: cross-sectional and longitudinal data among 8,342 Danes aged 46 to 102. Ann Epidemiol. 2006;16:554–562. doi: 10.1016/j.annepidem.2005.10.006. 10.1016/j.annepidem.2005.10.006 PubMed PMID: 16406245. [DOI] [PubMed] [Google Scholar]
- 8.Finucane MM, Stevens GA, Cowan MJ, Danaei G, Lin JK, et al. National, regional, and global trends in body-mass index since 1980: systematic analysis of health examination surveys and epidemiological studies with 960 country-years and 9·1 million participants. Lancet. 2011;377:557–567. doi: 10.1016/S0140-6736(10)62037-5. 10.1016/S0140-6736(10)62037-5 PMCID 4472365; PubMed PMID: 21295846. [DOI] [PMC free article] [PubMed] [Google Scholar]
- 9.Marcus RL, Addison O, Dibble LE, Foreman KB, Morrell G, et al. Intramuscular adipose tissue, sarcopenia, and mobility function in older individuals. J Aging Res. 2012;2012:629637. doi: 10.1155/2012/629637. 10.1155/2012/629637 PMCID 3303569; PubMed PMID: 22500231. [DOI] [PMC free article] [PubMed] [Google Scholar]
- 10.Roubenoff R. Sarcopenic obesity: the confluence of two epidemics. Obes Res 12: 887–888. 10.1038/oby.2004.107. [DOI] [PubMed]
- 11.Newman A. Strength and Muscle Quality in a Well Functioning Cohort of Older Adults: The Health, Aging and Body Composition Study. J Am Geriatr Soc. 2003:323–330. doi: 10.1046/j.1532-5415.2003.51105.x. [DOI] [PubMed] [Google Scholar]
- 12.Stenholm S, Sallinen J, Koster A, Rantanen T, Sainio P, et al. Association between obesity history and hand grip strength in older adults-exploring the roles of inflammation and insulin resistance as mediating factors. J Gerontol A Biol Sci Med Sci. 2011;66:341–348. doi: 10.1093/gerona/glq226. 10.1093/gerona/glq226 PubMed PMID: 21310808. [DOI] [PMC free article] [PubMed] [Google Scholar]
- 13.Sayer AA, Syddall HE, Dennison EM, Martin HJ, Phillips DIW, et al. Grip strength and the metabolic syndrome: findings from the Hertfordshire Cohort Study. QJM. 2007;100:707–713. doi: 10.1093/qjmed/hcm095. 10.1093/qjmed/hcm095 PMCID 2292249; PubMed PMID: 17951315. [DOI] [PMC free article] [PubMed] [Google Scholar]
- 14.Rolland Y, Lauwers-Cances V, Pahor M, Fillaux J, Grandjean H, et al. Muscle strength in obese elderly women: effect of recreational physical activity in a crosssectional study. Am J Clin Nutr. 2004;79:552–557. doi: 10.1093/ajcn/79.4.552. PubMed PMID: 15051596. [DOI] [PubMed] [Google Scholar]
- 15.Hardy R, Cooper R. Aihie Sayer A, Ben-Shlomo Y, Cooper C, et al. Body mass index, muscle strength and physical performance in older adults from eight cohort studies: the HALCyon programme. PLoS One. 2013;8:56483. doi: 10.1371/journal.pone.0056483. 10.1371/journal.pone.0056483 [DOI] [PMC free article] [PubMed] [Google Scholar]
- 16.Lafortuna CL, Maffiuletti NA, Agosti F, Sartorio A. Gender variations of body composition, muscle strength and power output in morbid obesity. Int J Obes (Lond) 2005;29:833–841. doi: 10.1038/sj.ijo.0802955. 10.1038/sj.ijo.0802955 [DOI] [PubMed] [Google Scholar]
- 17.Gray DS, Bauer M. The relationship between body fat mass and fat-free mass. J Am Coll Nutr. 1991;10:63–68. doi: 10.1080/07315724.1991.10718128. 10.1080/07315724.1991.10718128 PubMed PMID: 2010581. [DOI] [PubMed] [Google Scholar]
- 18.Newman AB, Kupelian V, Visser M, Simonsick EM, Goodpaster BH, et al. Strength, But Not Muscle Mass, Is Associated With Mortality in the Health, Aging and Body Composition Study Cohort. J Gerontol A Biol Sci Med Sci. 2006;61:72–77. doi: 10.1093/gerona/61.1.72. 10.1093/gerona/61.1.72 PubMed PMID: 16456196. [DOI] [PubMed] [Google Scholar]
- 19.Pischon T, Boeing H, Hoffmann K, Bergmann M, Schulze MB, et al. General and abdominal adiposity and risk of death in Europe. N Engl J Med. 2008;359:2105–2120. doi: 10.1056/NEJMoa0801891. 10.1056/NEJMoa0801891 PubMed PMID: 19005195. [DOI] [PubMed] [Google Scholar]
- 20.Manolopoulos KN, Karpe F, Frayn KN. Gluteofemoral body fat as a determinant of metabolic health. Int J Obes (Lond) 2010;34:949–959. doi: 10.1038/ijo.2009.286. 10.1038/ijo.2009.286 [DOI] [PubMed] [Google Scholar]
- 21.Alberti G, Zimmet P, Shaw J, Grundy S. The IDF consensus worldwide definition of the metabolic syndrome. Brussels Int Diabetes Fed. 2006 [Google Scholar]
- 22.Hayat SA, Luben R, Keevil VL, Moore S, Dalzell N, et al. Cohort Profile: A prospective cohort study of objective physical and cognitive capability and visual health in an ageing population of men and women in Norfolk (EPIC-Norfolk 3) Int J Epidemiol. 2013:1–10. doi: 10.1093/ije/dyt086. [DOI] [PMC free article] [PubMed] [Google Scholar]
- 23.Day N, Oakes S, Luben R, Khaw KT, Bingham S, et al. EPIC-Norfolk: study design and characteristics of the cohort. European Prospective Investigation of Cancer. Br J Cancer. 1999;80(Suppl1):95–103. PubMed PMID: 10466767. [PubMed] [Google Scholar]
- 24.Keevil VL, Hayat S, Dalzell N, Moore S, Bhaniani A, et al. The physical capability of community-based men and women from a British cohort: the European Prospective Investigation into Cancer (EPIC)-Norfolk study. BMC Geriatr. 2013;13:93. doi: 10.1186/1471-2318-13-93. 10.1186/1471-2318-13-93 PMCID 3846689; PubMed PMID: 24020915. [DOI] [PMC free article] [PubMed] [Google Scholar]
- 25.Andersen-Ranberg K, Petersen I, Frederiksen H, Mackenbach JP, Christensen K. Cross-national differences in grip strength among 50+ year-old Europeans: results from the SHARE study. Eur J Ageing. 2009;6:227–236. doi: 10.1007/s10433-009-0128-6. 10.1007/s10433-009-0128-6 [DOI] [PMC free article] [PubMed] [Google Scholar]
- 26.Wareham NJ, Jakes RW, Rennie KL, Schuit J, Mitchell J, et al. Validity and repeatability of a simple index derived from the short physical activity questionnaire used in the European Prospective Investigation into Cancer and Nutrition (EPIC) study. Public Health Nutr. 2003;6:407–413. doi: 10.1079/PHN2002439. 10.1079/PHN2002439 PubMed PMID: 12795830. [DOI] [PubMed] [Google Scholar]
- 27.Khaw K-T, Jakes R, Bingham S, Welch A, Luben R, et al. Work and leisure time physical activity assessed using a simple, pragmatic, validated questionnaire and incident cardiovascular disease and all-cause mortality in men and women: The European Prospective Investigation into Cancer in Norfolk prospective pop. Int J Epidemiol. 2006;35:1034–1043. doi: 10.1093/ije/dyl079. 10.1093/ije/dyl079 PubMed PMID: 16709620. [DOI] [PubMed] [Google Scholar]
- 28.Bassey EJ, Harries UJ. Normal values for handgrip strength in 920 men and women aged over 65 years, and longitudinal changes over 4 years in 620 survivors. Clin Sci. 1993;84:331–337. doi: 10.1042/cs0840331. 10.1042/cs0840331 PubMed PMID: 8384956. [DOI] [PubMed] [Google Scholar]
- 29.Keevil VL, Khaw K-T. Overadjustment in Regression Analyses: Considerations When Evaluating Relationships Between Body Mass Index, Muscle Strength, and Body Size. J Gerontol A Biol Sci Med Sci. 2013 doi: 10.1093/gerona/glt186. [DOI] [PMC free article] [PubMed] [Google Scholar]
- 30.Hsiao PY, Mitchell DC, Coffman DL, Craig Wood G, Hartman TJ, et al. Dietary patterns and relationship to obesity-related health outcomes and mortality in adults 75 years of age or greater. J Nutr Health Aging. 2013;17:566–572. doi: 10.1007/s12603-013-0014-y. 10.1007/s12603-013-0014-y PMCID 4558554; PubMed PMID: 23732554. [DOI] [PMC free article] [PubMed] [Google Scholar]
- 31.Lang P-O, Mahmoudi R, Novella J-L, Tardieu E, Bertholon L, et al. Is obesity a marker of robustness in vulnerable hospitalized aged populations? Prospective, multicenter cohort study of 1 306 acutely ill patients. J Nutr Health Aging. 2014;18:66–74. doi: 10.1007/s12603-013-0352-9. 10.1007/s12603-013-0352-9 PubMed PMID: 24402392. [DOI] [PubMed] [Google Scholar]
- 32.Fried LP, Tangen CM, Walston J, Newmana B, Hirsch C, et al. Frailty in older adults: evidence for a phenotype. J Gerontol A Biol Sci Med Sci. 2001;56:146–156. doi: 10.1093/gerona/56.3.m146. 10.1093/gerona/56.3.M146 [DOI] [PubMed] [Google Scholar]
- 33.Morley JE, Argiles JM, Evans WJ, Bhasin S, Cella D, et al. Nutritional recommendations for the management of sarcopenia. J Am Med Dir Assoc. 2010;11:391–396. doi: 10.1016/j.jamda.2010.04.014. 10.1016/j.jamda.2010.04.014 PubMed PMID: 20627179. [DOI] [PMC free article] [PubMed] [Google Scholar]
- 34.Cesari M, Penninx BWJH, Pahor M, Lauretani F, Corsi AM, et al. Inflammatory markers and physical performance in older persons: the InCHIANTI study. J Gerontol A Biol Sci Med Sci. 2004;59:242–248. doi: 10.1093/gerona/59.3.m242. 10.1093/gerona/59.3.M242 PubMed PMID: 15031308. [DOI] [PubMed] [Google Scholar]
- 35.Schaap LA, Pluijm SMF, Deeg DJH, Harris TB, Kritchevsky SB, et al. Higher inflammatory marker levels in older persons: associations with 5-year change in muscle mass and muscle strength. J Gerontol A Biol Sci Med Sci. 2009;64:1183–1189. doi: 10.1093/gerona/glp097. 10.1093/gerona/glp097 PubMed PMID: 19622801. [DOI] [PMC free article] [PubMed] [Google Scholar]
- 36.Guerra B, Santana A, Fuentes T, Delgado-Guerra S, Cabrera-Socorro A, et al. Leptin receptors in human skeletal muscle. J Appl Physiol. 2007;102:1786–1792. doi: 10.1152/japplphysiol.01313.2006. 10.1152/japplphysiol.01313.2006 PubMed PMID: 17234799. [DOI] [PubMed] [Google Scholar]
- 37.Dyck D, Heigenhauser G, Bruce C. The role of adipokines as regulators of skeletal muscle fatty acid metabolism and insulin sensitivity. Acta Physiol. 2006;186:5–16. doi: 10.1111/j.1748-1716.2005.01502.x. 10.1111/j.1748-1716.2005.01502.x [DOI] [PubMed] [Google Scholar]
- 38.Bucci L, Yani SL, Fabbri C, Bijlsma AY, Maier AB, et al. Circulating levels of adipokines and IGF-1 are associated with skeletal muscle strength of young and old healthy subjects. Biogerontology. 2013 doi: 10.1007/s10522-013-9428-5. [DOI] [PubMed] [Google Scholar]
- 39.Bey L, Hamilton MT. Suppression of skeletal muscle lipoprotein lipase activity during physical inactivity: a molecular reason to maintain daily low-intensity activity. J Physiol. 2003;551:673–682. doi: 10.1113/jphysiol.2003.045591. 10.1113/jphysiol.2003.045591 PMCID 2343229; PubMed PMID: 12815182. [DOI] [PMC free article] [PubMed] [Google Scholar]