Abstract
In this study, we present a microfluidic array for high resolution imaging of individual pancreatic islets. The device is based on hydrodynamic trapping principles and enables real-time analysis of islet cellular responses to insulin secretagogues. This device has significant advantages over our previously published perifusion chamber device including significantly increased analytical power and assay sensitivity, as well as improved spatiotemporal resolution. The islet array, with live-cell multiparametric imaging intergration, provides a better tool to understand the physiological and pathophysiological changes of pancreatic islets through the analysis of single islet responses. This platform demonstrates the feasibility of array-based islet cellular analysis and opens up a new modality to conduct informative and quantitive evaluation of islets and cell-based screening for new diabetes treatments.
Introduction
Development of an optimal in vitro and ex vivo analytical tool is very important for understanding the complexity of the physiological and pathophysiological behavior of islets of Langerhans, for both basic science and for the evaluation of new therapeutic compounds. Islets are clusters of 1000-2000 cells (50 - 400 μm in diameter) found within the pancreas. The majority of these cells are hormone-producing and compromise approximately 2% of the total pancreatic mass. Within each islet, there are mainly a heterogeneous population of alpha and beta-cells, which act to maintain blood glucose homeostasis by responding to and controlling moment-to-moment changes of blood glucose levels through the secretion of glucagon and insulin, respectively. Permanent disruption of this regulatory system consequently results in the onset of diabetes, which is one of the most common metabolic diseases afflicting hundreds of millions of people worldwide.
In vivo, islets experience dynamic changes in their environment and secret the hormones in a biphasic and oscillatory pattern, which is controlled by complex and sequential metabolic events, channel modulation, and ion signaling. Traditionally, in vitro islet research is carried out using conventional static wells or plates. Secreted total insulin is then further analyzed by biological and biochemical approaches such as ELISA. A dynamic in vitro model would be advantageous as it could more accurately replicate in vivo physiological cues and islet physiological activities.
The islet perifusion concept was introduced in the 1970s.1 Since then many macro-scale perifusion apparatuses have been developed to understand hormone secretion kinetics and to develop anti-diabetic drugs. However, these apparatuses have many limitations, such as cumbersome operation, limited flow control, inadequate mimicking of in vivo microenvironment, and a lack of integration with conventional analytical techniques. These challenges have limited the broad adoption of macro-scale perifusion devices despite their obvious advantages over static conditions.2
In the last decade or so, microfluidic technology has emerged as a valuable tool for islet study, mainly due to its versatility, minimal consumption of reagents, and enhanced efficiency.3-8 Its small scale also allows for the leveraging of microscale flow phenomena (laminar flow and rapid diffusion), both of which are critical for understanding hormone secretion kinetics. In addition, microfluidics allows for easier integration of new experimental modalities, which can integrate multimodal assays and multiple tasking into a single device and improve experimental throughputs.
In our previous studies, we have developed several microfluidic devices, mainly used as islet microperifusion apparatus. These devices have been successfully integrated with live-cell multimodal imaging methods for dissecting islet cell physiological behavior.9-13 One of the major challenges of these devices is the limited number of islets that can be assessed in a single device. Another challenge is the inability to satisfactorily assess the heterogeneous property of individual islets, especially when testing a large quantity of islets simultaneously as data are often averaged from islet populations. Examination of heterogeneous properties at the individual islet level often provides more detailed physiological or pathophysiological information than averaging-based population methodologies. For example, it will enable better understanding of human islet functionality from a reasonable sample size and could provide a better predictive value for islet transplant outcomes if many individual islets can be individually assessed instead of averaging a bulk response.
In this report, our aim is to develop a microfluidic islet array, based on the hydrodynamic trapping principle, for investigating the complexity of physiological or pathophysiological behavior of individual islets in a larger population. Furthermore, we aim to explore the feasibility of array-based cellular analysis to provide more informative data on islets and to act as a high content screen platform.
Experiments
Design principle and device configuration
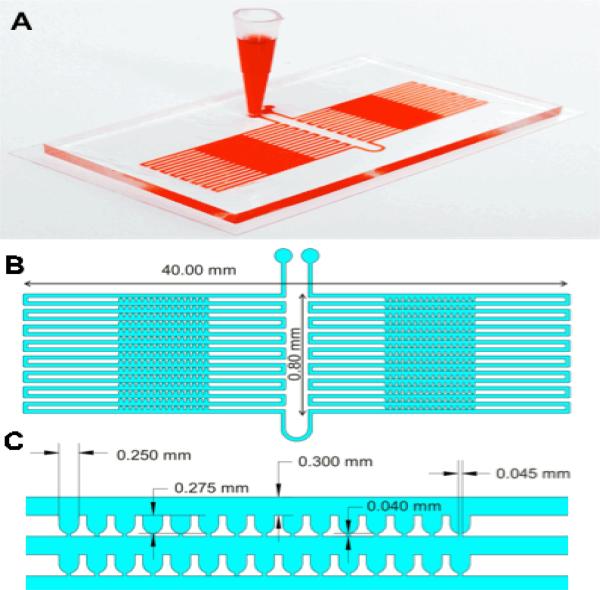
The array device utilizes the hydrodynamic trapping principle to immobilize individual islets in traps (Figure 1). The principle was first described in 2008 by Tan and Takeuchi.14 and again was applied by others.15,16 We have used the same principle to design a microfluidic device for encapsulated islets.15 However, designing an islet array using the same principle was a challenge and required careful design consideration due to the various sizes of islets. This was not an issue for microcapsules since they are uniform in size.
Figure 1. Microfluidic islet array.
(A) Photo image of the microfluidic islet array. (B) Schematic of the microfluidic islet array. (C) Geometrical dimension of the microfluidic islet array.
Calculation of pressure drop for designing microchannel geometry
In order to optimize the trapping efficacy for islets, flow resistance of the U-cup and the loop channel was calculated using the Dary-Weisbach equation, which was further modified by Poiseuille's Law for a rectangular channel. More detail can be found in Supplemental Information(SI).
Computer simulation
To better understand the flow characteristics around the microfluidic traps and determine the optimal parameters for microfluidic channel design, a computational fluid dynamics analysis was carried out using COMSOL 4.4 (COMSOL Multiphysics, Sweden). The results of fluid flow simulation were discussed in the SI.
Device Fabrication
The microfluidic array device was fabricated using standard soft lithography techniques as described previously.9-10 Device fabrication was provided in the SI.
Human and mouse islet isolation and hypoxia treatment
Human pancreata were obtained from organ procurement organizations following formal research consent. The islet isolation, purification, and culture were performed as previously described. 16-17 as depicted in the SI. Mouse islet isolations were performed as previously described.18 as depicted in the SI.
Human islet hypoxia was achieved by pelleting. In brief, 2,000 IEq of human islets were transferred into a 1.5 mL Eppendorf tube containing 1 mL culture media and then pelleted by brief centrifugation of the cells for 5 s at a speed of 1000 rpm.
Islet loading, stimulation, and retrieval
In order to achieve a high trapping efficacy with minimal shear force exerted on the islets, both islets and solutions containing insulin secretagogues were delivered into the device using a hydrostatic pressure-driven method. Detail of this method was described and illustrated in the SI.
Real-time fluorescence imaging
Imaging experiments were performed according to our previously established protocol.9, 19 Detailed imaging methods and protocols were provided in the SI.
Confocal imaging and data analysis
Islets were stained with CellTracker Green CMFDA for live cells (Invitrogen, USA), and propidium iodide (PI, Invitrogen, USA) for dead cells. Detail of dye incubation and confocal microscopy protocol is described in the SI.
Quantitative live/dead assay of human islets was also performed using ImageJ software (National Institutes of Health). To determine the level of fluorescence intensity in a given region(s) (e.g. islet), the regions of interest were selected using the drawing/selection tools in ImageJ software. The selected areas were then analyzed for areas, integrated density, and mean gray value. A region next to the islet that had no fluorescence was also selected as background. The following formula was used to calculate the corrected total cell fluorescence (CTCF). CTCF = Integrated Density – (Area of selected islet × Mean fluorescence of background readings).20
Statistics
Data were expressed as mean ± SD. Unpaired student's T test was performed to compare group difference. P < 0.05 was considered statistically significant.
Results and Discussion
1. Comparison of the perifusion chamber device and islet array device
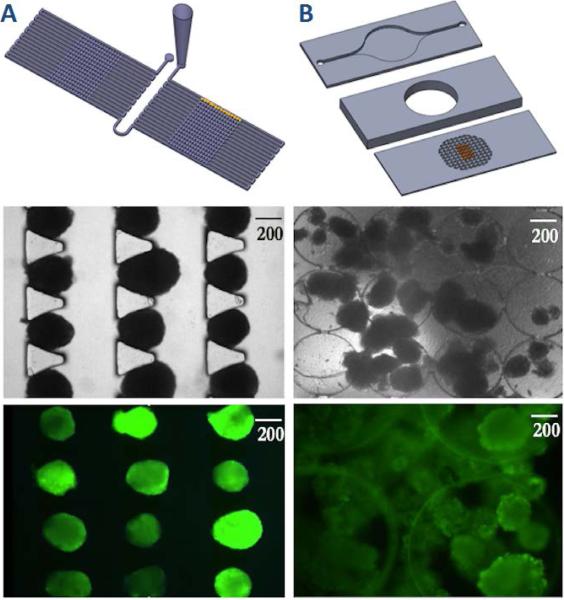
In order to demonstrate the superior characteristics of the microfluidic array design (Figure 2A-C), we compared it to previously designed three-layer microfluidic perifusion device (Figure 2D-F),9, 19 in which the media perifusates islets through a perifusion chamber.
Figure 2. Microfluidic islet array and microfluidic perifusion device.
(A) Schematic of the microfluidic islet array trapped human islets, and fluorescence labelled human islets. (B) Schematic of the microfluidic islet perifusion device trapped human islets, and fluorescence labelled human islets.
The top-layer of the perifusion device has an inlet and an outlet with dimensions of 20 mm × 2 mm × 500 μm. The perifusion chamber is 7 mm in diameter by 3 mm in depth with a total liquid volume of 115 μL. The bottom layer consists of an array of tiny circular wells (500 μm in diameter and 150 μm in depth) for islet immobilization (Figures 1D and 1E). The array of 500 μm wide by 100 μm deep circular wells has proven quite effective for islet immobilization up to a flow rate of 1.0 ml/min, with minimal physical stress; however efficient interaction of islets sitting in the circular wells with the microenvironment is dependent on flow dynamics in the perifusion chamber. Since the perifusion chamber is relatively large and falls in the macroscale category, it makes it challenging for effective mixing and diffusion, especially at a lower flow rate. While a higher flow rate (> 2.0 ml/min) may cause islets to disgorge from the circular wells.
Microfluidic systems are characterized by low Reynolds numbers, no turbulent flow is present to enhance mixing, and therefore simple diffusion adequately describes the transport of diffusive species within a microchannel. Simple-or Fickian - diffusion is described by , where J is the diffusive flux, D is the coefficient of diffusion for a chemical species in a given medium, and C is the concentration of the chemical species. The relationship x2 = 2Dt describes the mean square displacement of a particle in relation to time lapsed in the system. As time depends on the square of displacement, diffusion on the microscale occurs much faster than diffusion on the macroscale. Due to the small size of the islet array device (100 times smaller than the perifusion chamber device) and array format, diffusion and mixing are significantly faster and consequently more effective. Additionally, solution consumption can be reduced significantly during the experimental procedure using the newly designed device we present in this paper. The trapped islets in the array had direct and complete contact with flow independent of flow rate and the islets remained stable during dynamic perifusion with minimal movement. The previous perifusion design had a limited range of working flow rates since a slow flow rate (< 50 μL/min) prevented efficient mixing, while a higher flow rate (> 2 mL/min) disgorged many trapped islets. Additionally, the design reduced stimulation/washing times, which minimized shear stresses on islet cells.
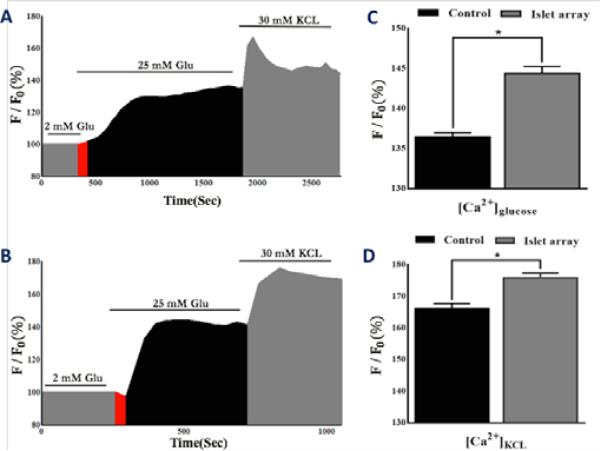
Importantly, the islet array design improved the precision and sensitivity of human islet calcium signaling by effectively detecting subtle changes such as phase 0 (Figure 3B), which is often not detectable in our previous perifusion based device (Figure 3A). The glucose-induced phase 0 is a gradual depolarization of the cell membrane and a decrease in intracellular calcium. Vanished (non-detectable) phase 0 is often caused by endoplasmic reticulum stress associated with a defect of islet cell function.21
Figure 3. Comparison of calcium signalling between the perifusion-device and the islet array.
(A) Calcium profile of human islets trapped in the perifusion device in response to glucose and KCI (n = 3, total of 300 islets). (B) Calcium profile of human islets trapped in the array device in response to glucose and KCI (n =3, total of 300 islets). (C) Statistical comparison of calcium in response to glucose between devices. (D) Statistical comparison of calcium in response to KCI between devices. Red area is indicative of phase 0.
Compared to the perifusion chamber design, the human islets in the islet array have superior maximal [Ca2+]glu response (144.2% ± 1.73 vs. 129.9% ± 2.42; p < 0.05) and superior maximal [Ca2+]KCL response (176.2% ± 1.54 vs. 166.9% ± 2.13; p < 0.05) (Figures 3C and 3D). Additionally, the array provided a faster transition from phase 0 to phase I (Slope: 14.84 vs. 2.65).
The islet array increased analytical power, not only by examining 100 islets individually, compared to 50 islets averaged in the perifusion device, but also by efficiently investigating individual islets, which was not achievable in the perifusion chamber as islets often aggregated or overlaid on each other (Figures 2E and 2F). Lastly, the one-layer array device had minimized dimension allowing a much shorter stimulation protocol to achieve comparable results performed by the perifusion device (sec vs. min) and consumed much smaller liquid volume (μL vs. mL).
The aforementioned advantages demonstrate that the array can be used as a new gold standard to study islet physiology and therapeutic screening.
2. Optimization of single-islet loading efficiency
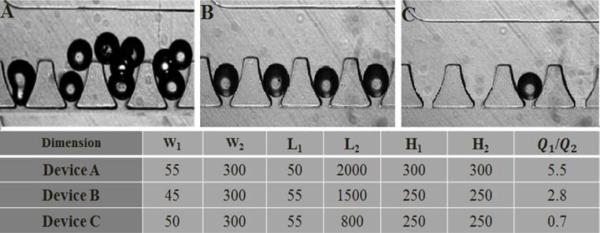
To allow high quantity and high resolution imaging of individual islets in an array, we further characterized the impact of geometries on trapping efficacy. As described previously, an islet directly prior to entering a trap experiences forces in two directions: mainstream flow (Q2) in the loop channel that moves the islet along the loop channel and a partial stream flow (Q1) in the cross-flow channel that pushes the islet into the trapping area. Combined effects of these two flow forces will determine the trapping efficacy of individual islets. We experimentally verified optimal geometry using varying lengths, widths, and depths of the trapping site and the loop channel (H) as shown in Figure 3. When Q1/Q2 was equal to 5.5, a high resistance ratio resulted in all traps being occupied, but at the cost of having multiple particles per trap (Figure 4A). When Q1/Q2 was equal to 0.7, the flow going through the trap was not sufficient for optimaloading, resulting in very few traps being occupied (Figure 4C). By optimizing the fluidic resistance of the cross-flow channel with respect to the resistance of the loop channel (Q1/Q2 = 2.8), single particle occupancy on single trap was achieved (Figure 4B). At this optimal ratio, 99% ± 2% of the traps are occupied with 95% ± 1% of the occupied traps containing a single particle.
Figure 4. Determination of optimal loading parameter.
(A) Loading efficacy at Q1/Q2 = 5.5. (B) Loading efficacy at Q1/Q2 = 2.8. (C) Loading efficacy at Q1/Q2 = 0.7.
Two additional factors that may influence trapping efficacy are particle concentration and flow rate. Our experience showed that trapping efficacy was independent of initial particle concentration, while particle concentration only affected loading time. For the concentration of 500 islets/mL, full loading of the array took less than a minute at a flow rate of 50 μL/min (data not shown). At a lower flow rate, loading time was longer and islets tended to settle in the inlet reservoir. For a flow rate above 1 mL/min, islets would experience high shear stresses and pressures and sometimes squeeze through the 45-μm narrow gaps, but the time saved was not significant (data not shown). We also observed that an additional benefit of this array design was the sequential capture of incoming islets (SIV1), preventing undesirable islet loss. Of a small number of islets entering the islet trap chip, all islets will be effectively captured. This could be especially useful for precious sample capturing, where the tolerance of islet loss is very low.
3. Fluid exchange efficiency
In order to make sure we achieved a uniform solution distribution and a fast rate of solution exchange in the array channel, a fluorescent intensity experiment using FITC was carried out. The rate of solution exchange was significantly faster (less than 10 second) as a result of small channel size and volume in comparison to our previous chamber design, which required 3 min to fully exchange.9 This allows faster stimulation, shorter washing time, and improved resolution. More detail can be found in the SI.
4. Microfluidic array serves as islet cell cytometry
Flow cytometry is a technology that has had a significant impact on basic cell biology and clinical medicine. Its key advantage is that a very large number of particles/cells can be evaluated individually in a very fast manner allowing accurate measurements of particle/cell properties under single-or multi-parameter and separate single particle/cell physically or biologically from mixed population to study heterogeneous populations and classification of subpopulation. Today's instruments have a capacity to measure almost all types of single cells; however, no such instrument for islets has been reported yet. Islets consist of a cluster of approximately 1000 – 2000 single cells and function as a basic unit. Therefore, it is more physiological relevant to analyze intact islets rather than dissociated islet single cells. Another advantage over flow cytometry is that our microfluidic chip coupled with real-time microscopy allows tracking of dynamic behavior of hundreds of islets, which cannot be measured by flow cytometry. With our chip, we are able to collect data on behavior of 300 individual islets at different time point under different stimulation therefore increasing the experimental throughput.
This microfluidic array can successfully capture and immobilize a large number of islets. With a low magnification optical objective, such as 10 × objective, 5 individual islets can be monitored in a field of view. Assisted by a motorized microcopy stage, we collected and analyzed 100 data points from individual islets with a 100 -islet array. It is worth noting that this array could be expanded as the channel has traps to hold up to 300 particles; however, the first 100 traps were used for this study, as there were limitations with how fast the stage could scan. These limitations could be overcome through the use of advanced stage setups.
4.1 Heterogeneous responses of human and rodent islets in response to secretagogues
Glucose-induced insulin secretion is a complex process controlled by beta-cell metabolic events, electrical activity, and ion signalling and displays biphasic and pulsatile kinetic profiles. In short, glucose metabolism increase ATP production, which consequently closes ATP-sensitive K+ channels, initiates plasma membrane depolarization, and increases [Ca2+]i via voltage-dependent calcium channels. This increase in [Ca2+]i triggers the fusion of insulin granules with cell membrane and, subsequently, results in insulin exocytosis. The dynamic visualization of physiological changes in individual islets has clear advantages because it provides detailed spatiotemporal information in a quantified manner. For example, the human islet isolation process for islet transplantation is a very complex and multistep process. Each manipulation step may be stressful and even detrimental to islets. The current standard assay to determine function and viability of human islets provides limited information on the islet physiological or pathophysiological changes. Using this microfluidic-based islet-trapping array, we can observe individual human islets and focus on several key insulin stimulator-secretion coupling pathways in response to secretagogues.
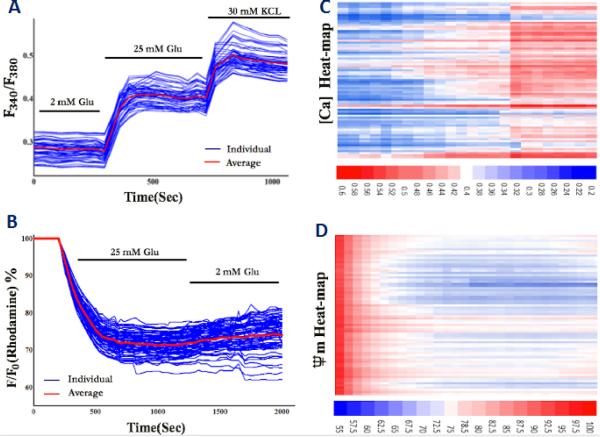
Variable responding profiles of islet calcium and mitochondrial potential changes were shown in Figures 5A and 5C. Human islets displayed variable calcium profiles in response to glucose and KCI (25 mM glucose: 144.2% ± 1.74, Max: 149.9%, Min: 139.9%; 30 mM KCI: 176.2% ± 1.54, Max: 179.1%, Min: 173.5%) and variable mitochondrial potential changes in response to glucose (25 mM glucose: 71.3% ± 2.02, Max: 76.8%, Min: 62.3%). The heat-map of calcium concentration and mitochondrial potential changes are depicted in Figures 5B and 5D and provide far richer sources of data compared to bulk averaging over multiple islets.
Figure 5. Variable responding profiles of human islets in response to secretagogues.
(A) Calcium signalling in response to 25 mM glucose and 30 mM KCI (n = 3, total of 300 islets). (B) Calcium concentration Heat-map in response to 25 mM glucose and 30 mM KCI (n = 3, total of 300 islets). (C) Mitochondrial potential changes in response to 25 mM glucose (n = 3, total of 300 islets). (D) Mitochondrial potential change Heat-map in response to 25 mM glucose (n = 3, total of 300 islets). Information about different response profiles of human and mouse islets in response to varying glucose concentrations and calcium-induced mitochondrial potential oscillation patterns have been presented in the SI Figures.
The microfluidic array clearly provides advantages over population-based approaches by providing more detailed and spatiotemporal analysis of individual islets, not only in a large cell population, but also variation values (maximal and minimal values) of individual islets, frequency of response, and percentage response profile. Additionally, the array may help to identify potential subgroups or sub phenotypes of an islet population, which is critically important for functional characterization of human islets used for islet transplantation and phenotype characterization of beta-cell like stem cells in their differentiation and maturation processes.
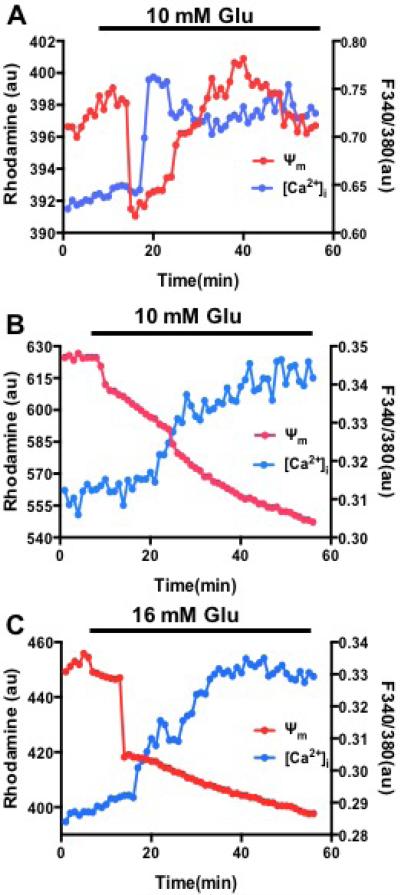
Previous studies indicated that glucose-induced cytoplasmic calcium signaling modulates mitochondrial membrane potentials in rodent islets, showing that the increased cytoplasmic calcium depolarizes mitochondrial potentials and subsequently regulates cytoplasmic calcium oscillation and insulin secretion.22,23 Here, we applied our microfluidic device to test whether our system is capable of observing similar results and further to confirm in isolated human islets. Our results in rodent islets showed that increased cytoplasmic calcium induced by 10 mM glucose depolarizes mitochondrial potentials (Figure 6A), which is similar to previously published data. On contrary, in isolated human islets no obvious mitochondrial potential depolarization induced by glucose-increased calcium have been observed under both 10 mM and 16 mM glucose (Figure 6B and 6C). The difference between rodent and human islets may be related to specie difference or low human islet quality since human islets often have much longer ischemia time (>8 hrs) and harsh isolation process. But further investigation is needed to clarify underlying causes.
Figure 6. Spatiotemporal relationship between cytoplasmic calcium and mitochondrial potentials under glucose stimulation.
(A) Representative traces of calcium and mitochondrial potentials from mice islets stimulated by 10 mM glucose (n=20). (B) Representative traces of calcium and mitochondrial potentials from human islets stimulated by 10 mM glucose (n=15 islets of two preparations). (C) Representative traces of calcium and mitochondrial potentials from human islets stimulated by 16 mM glucose (n =15 islets of two preparations).
4.2 Islet viability assay
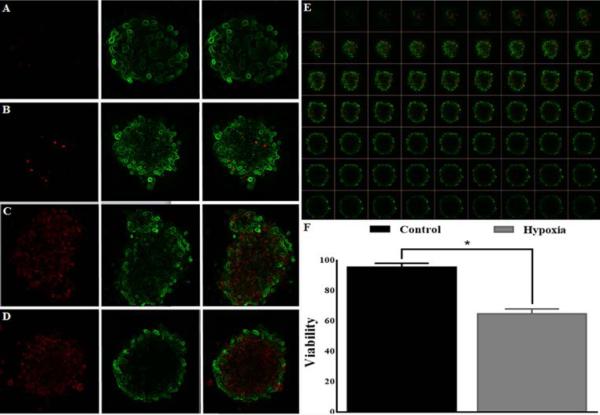
Low islet viability is one of the main obstacles limiting islet transplantation success. There are strong evidences indicating that islet stresses originated at the time of organ procurement, during isolation, and in culture have detrimental effects on islet yield and viability.24 The new microfluidic chip proposed here can be used as a tool to perform high-resolution analysis for islet viability and cell death. Since the trapped islets in the array device are directly located on a thin coverslip (60 × 24 mm and 0.13 mm in thickness), this enables high spatial resolution imaging of islets at high magnification such as confocal microscopy (Figure 7). This device also allows us to perform the assessment faster and in more automated fashion since the position and location of each trapped islet and trapping site are known therefore the imaging process can be performed in an automated way using a motorized stage. Additionally, fluorescence staining and washing processes can be performed on the chip without any difficulty.
Figure 7. Confocal imaging and quantification of live-cells and dead-cells of human islets in the array.
(A and B) Representative image of the control human islets. (C and D) Representative image of the hypoxia-treated human islets. (E) Representative images of a human islet were collected at 10 μm intervals to create a stack in Z axis (63 z-slices recorded with a 20x lens). (F) Statistical analysis of human islet viability from the control islets and the hypoxia-treated islets (n =3, total of 150 islets; * p < 0.01).
Figure 7 shows the results of the standard CMFDA/PI assay performed on human islets. Each sample contained 50 islets for each condition. Percentage of viable and dead cells aggregates over the total was determined by scoring green versus red fluorescence using the ImageJ software package as described under “Experimental Procedures”.
Quantitative comparisons showed that viability percentage of the control islets and the hypoxia treated islets was 96.1% ± 2.34 and 65.2% ± 3.21, respectively (p < 0.01).
Standard islet viability assay using lower optical objective only assesses cell viability of islet peripheral layers and surface areas, which often provides limited information of islet viability since islets are cluster of 1000-2000 single cells with diameter from 50 - 400 μm. Additionally, the manual approach is highly operator-dependent and subjective. The confocal evaluation of islet viability in the array assisted by imaging process software provides more informative and accurate analysis by assessing each layer of islet cells including islet core in a large islet population. Importantly, the approach can reduce the operator bias.
Conclusions
In this study, we presented a novel microfluidic array based on the hydrodynamic trapping mechanism. The unique device feature is the suitability of the microfluidic array for high-resolution analysis of individual islets. We have identified key design parameters controlling the trapping efficacy. This work demonstrates the enabling capability of quantitative analysis as islet cytometry that can be readily adopted for studying islet physiological and pathophysiological properties. In contrast to existing microfluidic perifusion devices, the presented array provides well-controlled flow dynamics with much improved flow exchange, faster flow delivery, a shortened stimulation protocol, and improved assay sensitivity and accuracy. Importantly, it is a first device that has an ability to monitor a large population at the single islet level that can be very useful for evaluation of human islet function and viability and screen potential anti-diabetes compounds. In future, we are planning to further optimize the system for the effective collection of perifusates for hormone measurements.
Supplementary Material
Acknowledgements
The authors thank the UIC human islet isolation and transplantation program for providing technical supports. This work was in part supported by NIH R01 DK091526 (JO, YW), JDRF Microfluidic-Based Functional Facility at UIC, and the Chicago Diabetes Project (CDP).
Footnotes
Electronic Supplementary Information (ESI) available: [SIV1: Islet loading. SIV2: Particle tracing simulation. SIV3: Solution exchange using fluorescein solutions.]
References
- 1.Lacy PE, Walker MM, Fink CJ. Diabetes. 1972;21:987–98. doi: 10.2337/diab.21.10.987. [DOI] [PubMed] [Google Scholar]
- 2.Wang Y, Lo JF, Mendoza-Elias JE, Adewola AF, Harvat TA, Kinzer KP, Lee D, Qi M, Eddington DT, Oberholzer J. Bioanalysis. 2010;2:1729–44. doi: 10.4155/bio.10.131. [DOI] [PubMed] [Google Scholar]
- 3.Shackman JG, Dahlgren GM, Peters JL, Kennedy RT. Lab on a chip. 2005;5:56–63. doi: 10.1039/b404974h. [DOI] [PubMed] [Google Scholar]
- 4.Roper MG, Shackman JG, Dahlgren GM, Kennedy RT. Analytical chemistry. 2003;75:4711–7. doi: 10.1021/ac0346813. [DOI] [PubMed] [Google Scholar]
- 5.Dishinger JF, Reid KR, Kennedy RT. Analytical chemistry. 2009;81:3119–27. doi: 10.1021/ac900109t. [DOI] [PMC free article] [PubMed] [Google Scholar]
- 6.Rocheleau JV, Walker GM, Head WS, McGuinness OP, Piston DW. Proceedings of the National Academy of Sciences of the United States of America. 2004;101:12899–903. doi: 10.1073/pnas.0405149101. [DOI] [PMC free article] [PubMed] [Google Scholar]
- 7.Silva PN, Green BJ, Altamentova SM, Rocheleau JV. Lab on a chip. 2013;13:4374–84. doi: 10.1039/c3lc50680k. [DOI] [PubMed] [Google Scholar]
- 8.Chen D, Du W, Liu Y, Liu W, Kuznetsov A, Mendez FE, Philipson LH, Ismagilov RF. Proceedings of the National Academy of Sciences of the United States of America. 2008;105:16843–8. doi: 10.1073/pnas.0807916105. [DOI] [PMC free article] [PubMed] [Google Scholar]
- 9.Mohammed JS, Wang Y, Harvat TA, Oberholzer J, Eddington DT. Lab on a chip. 2009;9:97–106. doi: 10.1039/b809590f. [DOI] [PMC free article] [PubMed] [Google Scholar]
- 10.Adewola AF, Lee D, Harvat T, Mohammed J, Eddington DT, Oberholzer J, Wang Y. Biomedical microdevices. 2010;12:409–417. doi: 10.1007/s10544-010-9398-1. [DOI] [PubMed] [Google Scholar]
- 11.Lo JF, Wang Y, Blake A, Yu G, Harvat TA, Jeon H, Oberholzer J, Eddington DT. Analytical chemistry. 2012;84:1987–93. doi: 10.1021/ac2030909. [DOI] [PMC free article] [PubMed] [Google Scholar]
- 12.Lee D, Wang Y, Mendoza-Elias JE, Adewola AF, Harvat TA, Kinzer K, Gutierrez D, Qi M, Eddington DT, Oberholzer J. Biomedical microdevices. 2012;14:7–16. doi: 10.1007/s10544-011-9580-0. [DOI] [PMC free article] [PubMed] [Google Scholar]
- 13.Wang Y, Lee D, Zhang L, Jeon H, Mendoza-Elias JE, Harvat TA, Hassan SZ, Zhou A, Eddington DT, Oberholzer J. Biomedical microdevices. 2012;14:419–26. doi: 10.1007/s10544-011-9618-3. [DOI] [PMC free article] [PubMed] [Google Scholar]
- 14.Tan WH, Takeuchi S. Lab on a chip. 2008;8:259–266. doi: 10.1039/b714573j. [DOI] [PubMed] [Google Scholar]
- 15.Nourmohammadzadeh M, Lo JF, Bochenek M, Mendoza-Elias JE, Wang Q, Li Z, Zeng L, Qi M, Eddington DT, Oberholzer J, Wang Y. Analytical chemistry. 2013;85:11240–9. doi: 10.1021/ac401297v. [DOI] [PMC free article] [PubMed] [Google Scholar]
- 16.Qi M, Barbaro B, Wang S, Wang Y, Hansen M, Oberholzer J. Journal of visualized experiments : JoVE. 2009 doi: 10.3791/1343. [DOI] [PMC free article] [PubMed] [Google Scholar]
- 17.Qi M, Barbaro B, Wang S, Wang Y, Hansen M, Oberholzer J. Journal of visualized experiments : JoVE. 2009 doi: 10.3791/1343. [DOI] [PMC free article] [PubMed] [Google Scholar]
- 18.Wang Y, Wang S, Harvat T, Kinzer K, Zhang L, Feng F, Qi M, Oberholzer J. Cell transplantation. 2015;24:25–36. doi: 10.3727/096368913X673441. [DOI] [PMC free article] [PubMed] [Google Scholar]
- 19.Adewola AF, Lee D, Harvat T, Mohammed J, Eddington DT, Oberholzer J, Wang Y. Biomedical microdevices. 2010;12:409–17. doi: 10.1007/s10544-010-9398-1. [DOI] [PubMed] [Google Scholar]
- 20.McCloy RA, Rogers S, Caldon CE, Lorca T, Castro A, Burgess A. Cell cycle. 2014;13:1400–12. doi: 10.4161/cc.28401. [DOI] [PMC free article] [PubMed] [Google Scholar]
- 21.Worley JF, 3rd, McIntyre MS, Spencer B, Mertz RJ, Roe MW, Dukes ID. The Journal of biological chemistry. 1994;269:14359–14362. [PubMed] [Google Scholar]
- 22.Krippeit-Drews P, Dufer M, Drews G. Biochemical and biophysical research communications. 2000;267:179–83. doi: 10.1006/bbrc.1999.1921. [DOI] [PubMed] [Google Scholar]
- 23.Kindmark H, Kohler M, Brown G, Branstrom R, Larsson O, Berggren PO. The Journal of biological chemistry. 2001;276:34530–6. doi: 10.1074/jbc.M102492200. [DOI] [PubMed] [Google Scholar]
- 24.Ricordi C, Strom TB. Nature reviews. Immunology. 2004;4:259–68. doi: 10.1038/nri1332. [DOI] [PubMed] [Google Scholar]
Associated Data
This section collects any data citations, data availability statements, or supplementary materials included in this article.


