

Abstract
Policy Points.
Patients with low socioeconomic status (SES) experience poorer survival rates after diagnosis of breast cancer, even when enrolled in Medicare and Medicaid.
Most of the difference in survival is due to more advanced cancer on presentation and the general poor health of lower SES patients, while only a very small fraction of the SES disparity is due to differences in cancer treatment.
Even when comparing only low‐ versus not‐low‐SES whites (without confounding by race) the survival disparity between disparate white SES populations is very large and is associated with lower use of preventive care, despite having insurance.
Context
Disparities in breast cancer survival by socioeconomic status (SES) exist despite the “safety net” programs Medicare and Medicaid. What is less clear is the extent to which SES disparities affect various racial and ethnic groups and whether causes differ across populations.
Methods
We conducted a tapered matching study comparing 1,890 low‐SES (LSES) non‐Hispanic white, 1,824 black, and 723 Hispanic white women to 60,307 not‐low‐SES (NLSES) non‐Hispanic white women, all in Medicare and diagnosed with invasive breast cancer between 1992 and 2010 in 17 US Surveillance, Epidemiology, and End Results (SEER) regions. LSES Medicare patients were Medicaid dual‐eligible and resided in neighborhoods with both high poverty and low education. NLSES Medicare patients had none of these factors. Measurements: 5‐year and median survival.
Findings
LSES non‐Hispanic white patients were diagnosed with more stage IV disease (6.6% vs 3.6%; p < 0.0001), larger tumors (24.6 mm vs 20.2 mm; p < 0.0001), and more chronic diseases such as diabetes (37.8% vs 19.0%; p < 0.0001) than NLSES non‐Hispanic white patients. Disparity in 5‐year survival (NLSES − LSES) was 13.7% (p < 0.0001) when matched for age, year, and SEER site (a 42‐month difference in median survival). Additionally, matching 55 presentation factors, including stage, reduced the disparity to 4.9% (p = 0.0012), but further matching on treatments yielded little further change in disparity: 4.6% (p = 0.0014). Survival disparities among LSES blacks and Hispanics, also versus NLSES whites, were significantly associated with presentation factors, though black patients also displayed disparities related to initial treatment. Before being diagnosed, all LSES populations used significantly less preventive care services than matched NLSES controls.
Conclusions
In Medicare, SES disparities in breast cancer survival were large (even among non‐Hispanic whites) and predominantly related to differences of presentation characteristics at diagnosis rather than differences in treatment. Preventive care was less frequent in LSES patients, which may help explain disparities at presentation.
Keywords: breast cancer, socioeconomic status, disparities, Medicare
Despite the safety net insurance programs of medicare and Medicaid, disparities in breast cancer survival by socioeconomic status (SES) persist in the United States.1, 2, 3, 4 There are well‐documented disparities in breast cancer survival by SES5, 6, 7, 8 and by race.2, 9 Education,5, 10, 11, 12, 13 occupation,14 census‐tract‐level poverty,2, 15, 16 and access to health insurance and preventive care17, 18, 19, 20, 21, 22 have all been shown to predict differential outcomes in survival from breast cancer. These disparities persist in the elderly population despite near universal insurance coverage through Medicare and Medicaid in the United States. It is also known that high‐ and low‐SES patients differ in their health status at the time of cancer diagnosis,2, 23 and that high‐ and low‐SES patients receive different treatments for their cancer once they have entered the health care system.1, 2, 13 However, the relative impacts of patients' baseline health and the cancer treatment they receive on disparities in breast cancer survival by SES and race are not clear.
There are logical contributors to these SES disparities in survival: (1) disparities in the timely diagnosis and presentation of patients developing breast cancer (such as differences in stage and tumor size at diagnosis); (2) disparities in the prevalence, diagnosis, and treatment of comorbidities, present or developing, when breast cancer is diagnosed (that is, disparities in the general health of patients when they are diagnosed with breast cancer); and (3) disparities in the treatment of breast cancer once patients have been diagnosed. Furthermore, there are important confounders keeping us from better understanding etiologic factors related to SES disparities in survival, the most important one being race, as the survival disparity often reported by SES is confounded by race, and the survival disparity by race is often confounded by SES.
The problem with most studies on SES and breast cancer survival is that race and SES are closely entwined.24 If both variables were added to a model, the coefficients on race and SES utilized for assessing the survival disparity would be difficult to interpret, and the determinants of the disparities would not be interpretable. In this study we present 3 series of matches that focus on the disparity in breast cancer survival experienced by 3 groups of disadvantaged women—low‐SES (LSES) non‐Hispanic white women, LSES black women, and LSES Hispanic white women—in order to better understand reasons for potential survival disparities in breast cancer.
Using these matches we ask the following types of questions: Do not‐low‐SES (NLSES) patients who presented with similar baseline health at diagnosis to LSES patients, but whose disease was treated like typical NLSES patients, have better outcomes than NLSES patients who both had similar baseline health at diagnosis and received treatment like their LSES counterparts? If treatment were contributing to the disparity in outcomes across SES levels, then NLSES patients with both similar presentation features at diagnosis and similar initial treatment to LSES patients should display worse survival than those NLSES patients who were similar on presentation features but whose cancer treatment was typical of the less disadvantaged NLSES patients. Other questions may include the following: Do LSES patients present with more advanced cancers at diagnosis? Do LSES patients present at diagnosis with more comorbid conditions, such as prior heart attacks? Do LSES patients receive inferior treatment, given their presentation? The answers to these questions contribute to understanding the disparity in survival that has been observed in many studies. This study examines these types of questions closely and reports on the impact of both presentation factors at diagnosis and initial treatment on the overall survival disparity observed between LSES and NLSES patients.
To answer these important questions, this study uses a recently introduced approach, tapered multivariate matching,25, 26, 27, 28 to examine the extent of observed disparities in breast cancer survival by SES level for older non‐Hispanic white, black, and Hispanic white women in Medicare and, more important, to understand how contributing factors relate to that disparity. In tapered matching, we sequentially match a fixed set of patients (usually the minority patients or patients with the worst outcomes—a group we call the “focal” population) to matched controls (usually those patient groups with the most advantages) on increasingly comprehensive sets of variables. The focal groups in this study will be LSES non‐Hispanic whites, LSES blacks, and LSES Hispanic whites (hereafter referred to as LSES Hispanics). For each match, controls will be drawn from a larger cohort of NLSES non‐Hispanic white patients (the most advantaged). Our goal is to understand the extent of, and reasons for, disparities in outcomes between the focal and control groups. As we incrementally match NLSES controls to the LSES focal group on additional covariates, we can directly observe how the matched NLSES cohort changes, both in terms of survival and in terms of unmatched covariates.
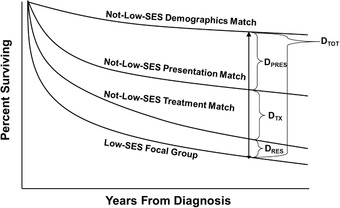
Figure 1 displays a hypothetical Kaplan‐Meier curve of breast cancer survival for LSES focal patients (bottom curve) and 3 matched NLSES control groups: (1) NLSES controls matched only on demographics (age, year of diagnosis, and Surveillance, Epidemiology, and End Results [SEER] site) (top curve); (2) NLSES controls matched on both presentation factors and demographics (eg, tumor stage, size, pathology, patient comorbidities like diabetes and heart failure as well as the demographic variables of age, year of diagnosis, SEER site); and finally (3) NLSES controls matched on treatment variables (eg, surgery, radiation, and chemotherapy) as well as presentation factors and demographic variables.
Figure 1.
Conceptual Model of Tapered Matching Analyses
Hypothetical Kaplan‐Meier Curves of Breast Cancer Survival for LSES Focal Patients (bottom) and Their 3 Matched NLSES Control Groups: (1) NLSES controls matched only on demographics (age, year of diagnosis, and SEER site) (top); (2) NLSES controls matched on both presentation factors and demographics (eg, tumor stage, size, pathology, patient comorbidities like diabetes and heart failure as well as the demographic variables); and finally (3) NLSES controls matched on treatment variables (eg, surgery, radiation, and chemotherapy) and both presentation factors and demographic variables. Note the size of the total disparity at a specified follow‐up time is DTOT; the disparity associated with differences in how patients present on admission is the DPRES, which is the difference in survival between the control group that is matched on demographics and the control group that is matched on both demographics and presentation factors. The disparity DTX is the difference in survival between the control group that is matched on presentation and demographics factors and the control group that is matched on treatment, presentation, and demographics. If there is any disparity noted after the treatment match, we refer to that as the residual disparity (DRES).
Note the total disparity at a specified follow‐up time is DTOT, representing the difference in survival between the NLSES group and the LSES focal group, matching just on demographics (year, SEER site, and age). The disparity associated with differences in how patients present at diagnosis is DPRES, which is the difference between the survival of the NLSES controls matched only on demographics and the NLSES controls matched on both demographics and presentation. Because the LSES focal group does not change between the demographics and presentation matches, and because the only change between the 2 matches is the addition of presentation variables, the change in the survival disparity can be attributed to the additional control for differences in presentation characteristics, and therefore, DPRES represents that share of the total disparity DTOT. The disparity component DTX is the difference in survival between the NLSES controls matched only on presentation and demographics and the NLSES controls matched on treatment, presentation, and demographics variables. Because the LSES focal group does not change between the presentation and treatment matches, and because the only change between the 2 matches is the addition of treatment variables, the change in the survival disparity can be attributed to the additional control for differences in treatment, and therefore, DTX represents that share of the total disparity DTOT. If there is any difference in survival noted after the treatment match, we refer to that as the residual disparity (DRES).
An advantage of tapered matching is that it allows for a transparent assessment of the contribution of DPRES and DTX to the total survival disparity DTOT by comparing controls matched for different characteristics. Furthermore, we can formally test the differences in outcomes between sets of controls matched for different variables at the 3 stages of the tapered match.26, 27, 29 In so doing, we can understand the point in the health care process at which the survival disparities are produced, in order to help policymakers determine the most effective approach to reducing these disparities.
For each focal group of LSES patients and set of matched NLSES controls, we will carefully examine the gap in baseline health at the point of diagnosis, as well as the gap in treatment rendered to each group. Furthermore, for each matched comparison we will also examine differences in the use of preventive services (both screening services and management of comorbid conditions) prior to diagnosis, in order to understand whether these may relate to subsequent presentation and survival disparities. Using tapered matching clearly displays specific clinical features of each patient group along the disparity pathway—such as differences in the rates of preexisting diabetes and heart failure between focal groups and matched patients of disparate socioeconomic status, or the differences in the use of radiation therapy after carefully matching patients for disease stage and tumor size.
With this methodology, we are able to examine the influence of socioeconomic factors without the confounder of race by matching NLSES non‐Hispanic white patients to LSES non‐Hispanic white patients. We further present 2 additional matching studies comparing NLSES non‐Hispanic white patients to both LSES black and LSES Hispanic patients to study the extent of combined racial, ethnic, and SES effects on breast cancer survival in those LSES patients. We use NLSES non‐Hispanic white patients for the control group in each analysis because they represent the group with the absence of apparent socioeconomic disadvantages and therefore can function to provide a reasonable expectation of a potential outcome that is as positive as possible. This also adheres to the principle that outcomes in disadvantaged groups should always be benchmarked to the least disadvantaged group.30, 31 As will be observed, even within just the white non‐Hispanic population, SES alone is associated with a very large survival disparity. Finally, we present other survival analyses in which we match NLSES patients to LSES patients stratified by race.
Methods
Patient Population
This research protocol was approved by the institutional review board of the Children's Hospital of Philadelphia. We acquired the SEER‐Medicare database containing patients who were newly diagnosed with breast cancer between 1992 and 2010 in 17 SEER sites throughout the United States and who were followed for mortality status up to December 31, 2013.32 Each SEER site records demographic, tumor biology, treatment, and survival data for every person diagnosed with cancer in the region. We merged each person's Patient Entitlement and Diagnosis Summary File (PEDSF) with their Medicare Inpatient, Outpatient, Carrier/Part B, Hospice, and Skilled Nursing Facility (SNF) files.
We excluded patients who were male; who were diagnosed with noninvasive breast cancer (ductal carcinoma in situ); whose diagnosis month in PEDSF was missing; who were not enrolled in Medicare; whose PEDSF record could not be linked to Medicare claims; who were less than 66 years old at diagnosis; or who were diagnosed before 1992. See online Appendix I for a complete summary of the cohort selection process.
Defining Patient Characteristics
We used the SEER race and ethnicity algorithm to identify non‐Hispanic white, black, and Hispanic breast cancer patients diagnosed during the study period. Patient comorbidities were defined with ICD‐9‐CM codes identified in Medicare claims in the 12 months before diagnosis (see online Appendix II for a list of comorbidities).26 We also calculated a risk score based on the Charlson Comorbidity Index.33
Defining Socioeconomic Status
We used 3 measures to define whether a patient was of LSES. Identification as LSES required Medicare‐Medicaid dual eligibility at the time of diagnosis according to PEDSF and residence in a neighborhood with over 20% of inhabitants below the federal poverty level and over 20% without a high school diploma. Controls must not have been dual‐eligible and not be living in a neighborhood with poverty or high school noncompletion levels above 20%.
Tumor Biology
Patient tumor characteristics, including stage, size in centimeters, grade, estrogen receptor (ER) status, and progesterone receptor (PR) status, were obtained from PEDSF. For patients diagnosed in 2010, we used the newly made available data on human epidermal growth factor receptor 2 (HER2) to define their breast cancer subtype in terms of all 3 hormone receptors (estrogen receptor, progesterone receptor, and HER2).
Treatment Variables
We determined patients’ initial treatment using Medicare claims supplemented by PEDSF. We defined surgery and chemotherapy using ICD‐9 and Current Procedure Terminology (CPT) billing codes from Medicare claims, with surgery divided into conserving and nonconserving subtypes. We also used the PEDSF to define nodal status as a proxy for the surgeon's aggressiveness in treatment (see online Appendix IV for nodal variables). For patients who received chemotherapy, we further defined whether they received doxorubicin only, taxanes, or other agents (eg, mitomycin), or if there was evidence that chemotherapy was received but no specific agent identified. Radiation therapy was determined using administrative codes. The analytic window for defining initial treatment was the first 6 months after diagnosis for surgery and chemotherapy and the first 9 months for radiation. See online Appendices III, IV, and V for complete, categorized surgery, radiation, and chemotherapy code lists.
Statistical Analysis
Matching Methodology
As described earlier, we used tapered matching to generate a series of matches for each comparison of LSES and NLSES patients.25, 26, 27, 28 The fixed focal group for all matches consisted of patients with LSES as defined previously, with matched controls always drawn from NLSES patients. For each focal group, we performed 3 matches that constructed sets of pairs of LSES and NLSES patients. First, the demographics match paired patients by their age at diagnosis, the SEER site where they were diagnosed, diagnosis year, and treatment era (between 1992 and 1998 [before the introduction of taxanes], between 1999 and 2004 [after taxanes were introduced], and between 2005 and 2010 [after 2005 changes in treatment guidelines, including the incorporation of trastuzumab/Herceptin]). Next, the presentation match controlled for all demographic factors, as well as characteristics of the patients upon diagnosis, including comorbidities, the Charlson score, and tumor characteristics (stage, size, grade, estrogen receptor status, and breast cancer subtype [HR+/HER2+, HR+/HER2‐, HR‐/HER2+, HR‐/HER2‐ −i.e., triple‐negative disease, and subtype missing] when available). We use the term presentation because it accounts for patient risk factors at the time patients presented to the health system with their first diagnosis of breast cancer. Finally, the treatment match controlled for all variables in the first 2 matches as well as the types of treatment patients received. Patients were matched exactly for crucial treatment variables, such as lack of treatment, type of surgery, and the presence of adjuvant radiation with breast‐conserving surgery (see online Appendix VI for detailed descriptions of all matching algorithms). Each match also included a score predicting LSES (a propensity score to be in the LSES population). The propensity scores used in each match came from logistic regressions predicting LSES using the variables to be controlled in that match, eg, demographics covariates in the demographics match. Matching on a propensity score tends to balance variables in the score.34, 35
As has been recommended by Rubin and others,36 matching was performed first, without viewing outcomes. Matching was accomplished using the MIPMatch package37 in R.38
While the accepted practice in disparities research is to benchmark disadvantaged groups to the least disadvantaged group (in our case, NLSES non‐Hispanic whites),30, 31 we also sought to better understand the effect of LSES within minority groups. Therefore, we also performed race‐stratified tapered matching analyses, comparing LSES black patients to NLSES black patients and comparing LSES Hispanic patients to NLSES Hispanic patients. Unfortunately, it is not easy to find large populations of NLSES minority patients to match to LSES minorities. To facilitate comparisons, we applied full matching to the tapered matching framework,39 performing all matches with the sets of covariates described earlier. Full matching enables us to generate matches even in challenging situations where the number of LSES focal patients is similar to the number of available NLSES controls, by using matched sets of varied sizes, and correcting for this using weights. Apart from deviating from the standard of comparing disadvantaged groups to the least disadvantaged group, the full matching approach comes at a cost of reduced analytic transparency and does not permit comparisons among control groups using the exterior match.29 For these reasons and the principle that disadvantaged groups should be compared to the least disadvantaged group, the matches that used NLSES non‐Hispanic whites as controls serve as our primary analyses. Full matching was accomplished using the Optmatch package40 in R.38
Statistical Tests and Outcomes
After matching, we tested to ensure the matches were balanced. For each variable, we calculated the standardized difference after matching, which is the difference in means between focal LSES patients and NLSES matched controls as a proportion of the variable's standard deviation before matching.41, 42, 43 An informal standard is to attain standardized differences below 0.2 for all variables, although we aimed to keep all standardized differences below 0.1 as has been achieved in recent work.27 We also assessed balance using 2‐sample randomization tests, specifically the Wilcoxon rank sum test for each continuous covariate and Fisher's exact test for each binary one, thereby comparing the balance achieved by matching to the balance expected from complete randomization.44 In a completely randomized experiment, 1 in every 20 covariates would be expected to exhibit a p ≤ 0.05 imbalance in such a randomization test.
The primary outcome was 5‐year survival from breast cancer diagnosis, although median survival in months is also reported. SEER reports diagnosis month, not date, so patients were assigned a diagnosis date of the 15th of the diagnosis month, unless a dated surgery bill preceded the 15th of the month. When testing the hypothesis of no difference in survival outcomes between the matched LSES and NLSES patients, we used the Prentice‐Wilcoxon statistic.45 We also examined the hazard ratio associated with LSES status after each match using the paired version of the Cox proportional hazards model.46 Paired Cox models were also used to examine LSES versus NLSES hazard ratios for black patients and Hispanic white patients after completing full matching. We also studied treatment as an outcome of the presentation match, including a composite outcome of inappropriate treatment, which consisted of no surgery in early‐stage disease, no treatment in late‐stage disease, or conserving surgery without radiation regardless of stage. These secondary continuous and binary outcomes were tested using the Wilcoxon sign‐rank statistic47 and McNemar statistic,48 respectively. We obtained standard errors and p‐values for paired differences in Kaplan‐Meier survival probabilities using the bootstrap method applied to matched pairs.49 Comparisons between NLSES controls in different matches were performed by applying the Prentice‐Wilcoxon test to an exterior match that constructed nonoverlapping control groups from 2 given groups of matched controls.29, 45, 50
We also analyzed measures of preventive care utilization before diagnosis by LSES populations and their matched NLSES controls. Using the methods developed by Bach and colleagues and Pham and colleagues,51, 52 we identified patients’ primary care visits and determined whether they had a usual source of primary care in the 6 to 18 months prior to diagnosis. In that same window, we also scanned the claims for evidence of screening mammography, as well as other preventive care services such as cholesterol and colon cancer screens. The assessment window of 6 to 18 months excluding the first 6 months before diagnosis improves the likelihood that the observed utilization reflects typical behaviors rather than activities related to the eventual diagnosis itself. We analyzed only those pairs where both patients in the pair had 18 months of look‐back with complete fee‐for‐service coverage. Differences in the binary primary and preventive care measures in qualifying pairs were tested using the McNemar statistic.48 See online Appendix VII for more details on the primary and preventive care algorithms.
Findings were considered significant if p ≤ 0.05 using a 2‐tailed test. All tests were calculated using either SAS software (Version 9.3 of the SAS system for UNIX)53 or R.38
Results
We identified 1,890 non‐Hispanic white, 1,824 black, and 723 Hispanic women who were diagnosed with invasive breast cancer between 1992 and 2010 and met our definition of LSES and all inclusion and exclusion criteria. The control population for matching comprised 60,307 non‐Hispanic white women who were NLSES and met all other criteria.
Table 1 demonstrates that SES characteristics were, as intentionally constructed, very different between SES groups. In fact, the groups were well differentiated even on SES variables not used to bifurcate LSES patients from NLSES patients. For example, regardless of race or ethnicity, NLSES patients came from neighborhoods with more than double the median income of neighborhoods where LSES patients resided. In aggregate, the entire control reservoir of NLSES non‐Hispanic whites, none of whom were Medicare‐Medicaid dual‐eligible, came from neighborhoods with a median income of $62,559, with 6.3% below the poverty level, and 89.7% with a high school diploma or GED. This stands in contrast to the LSES non‐Hispanic whites, all of whom were dual‐eligible, with neighborhood median income of $28,035, 23.1% below the poverty level, and 64.6% with a high school diploma; LSES blacks were from neighborhoods with a median income of $27,685, with 26.1% below the poverty level, and 62.0% with a high school diploma; and Hispanics were from neighborhoods with a median income of $27,665, with 27.5% below the poverty level and 52.6% with a high school diploma. All contrasts of LSES groups to NLSES non‐Hispanic whites were significant at p < 0.0001.
Table 1.
Socioeconomic Status (SES) Variable Values Across Populations and Matched Sets
| NLSES Non‐Hispanic Whites Matched for: | |||||
|---|---|---|---|---|---|
| Focal LSESa Non‐Hispanic Whites | Treatment +Presentation +Demographics | Presentation +Demographics | Demographics | All Whites | |
| LSES Non‐Hispanic Whites Matched to NLSES Non‐Hispanic Whites | n = 1,890 | n = 1,890 | n = 1,890 | n = 1,890 | n = 60,307 |
| Dual‐eligible (%) | 100.0 | 0.0 | 0.0 | 0.0 | 0.0 |
| Neighborhood % of residents below federal poverty level (mean) | 23.1 | 7.1 | 7.2 | 7.0 | 6.3 |
| 0 to <20% below FPL | 0.0 | 100.0 | 100.0 | 100.0 | 100.0 |
| ≥20% below FPL | 100.0 | 0.0 | 0.0 | 0.0 | 0.0 |
| Neighborhood % of residents with high school diploma/GED (mean) | 64.6 | 89.1 | 89.1 | 89.2 | 89.7 |
| ≥80% with diploma | 0.0 | 100.0 | 100.0 | 100.0 | 100.0 |
| <80% with diploma | 100.0 | 0.0 | 0.0 | 0.0 | 0.0 |
| Median income ($, mean) | 28,035 | 58,497 | 57,656 | 58,726 | 62,559 |
| Married (%) | 18.6 | 48.6 | 45.4 | 50.5 | 49.5 |
| NLSES Non‐Hispanic Whites Matched for: | |||||
|---|---|---|---|---|---|
| Focal LSESa Blacks | Treatment +Presentation +Demographics | Presentation +Demographics | Demographics | All Whites | |
| LSES Blacks Matched to NLSES Non‐Hispanic Whites | n = 1,824 | n = 1,824 | n = 1,824 | n = 1,824 | n = 60,307 |
| Dual‐eligible (%) | 100.0 | 0.0 | 0.0 | 0.0 | 0.0 |
| Neighborhood % of residents below federal poverty level (mean) | 26.1 | 6.6 | 6.7 | 6.7 | 6.3 |
| 0 to <20% below FPL | 0.0 | 100.0 | 100.0 | 100.0 | 100.0 |
| ≥20% below FPL | 100.0 | 0.0 | 0.0 | 0.0 | 0.0 |
| Neighborhood % of residents with high school diploma/GED (mean) | 62.0 | 88.9 | 89.1 | 89.5 | 89.7 |
| ≥80% with diploma | 0.0 | 100.0 | 100.0 | 100.0 | 100.0 |
| <80% with diploma | 100.0 | 0.0 | 0.0 | 0.0 | 0.0 |
| Median income ($, mean) | 27,685 | 59,583 | 60,614 | 61,526 | 62,559 |
| Married (%) | 11.0 | 44.0 | 45.0 | 46.6 | 49.5 |
| NLSES Non‐Hispanic Whites Matched for: | |||||
|---|---|---|---|---|---|
| Focal LSESa Hispanics | Treatment +Presentation +Demographics | Presentation +Demographics | Demographics | All Whites | |
| LSES Hispanics Matched to NLSES Non‐Hispanic Whites | n = 723 | n = 723 | n = 723 | n = 723 | n = 60,307 |
| Dual‐eligible (%) | 100.0 | 0.0 | 0.0 | 0.0 | 0.0 |
| Neighborhood % of residents below federal poverty level (mean) | 27.5 | 6.4 | 6.6 | 6.4 | 6.3 |
| 0 to <20% below FPL | 0.0 | 100.0 | 100.0 | 100.0 | 100.0 |
| ≥20% below FPL | 100.0 | 0.0 | 0.0 | 0.0 | 0.0 |
| Neighborhood % of residents with high school diploma/GED (mean) | 52.6 | 90.6 | 90.2 | 90.7 | 89.7 |
| ≥80% with diploma | 0.0 | 100.0 | 100.0 | 100.0 | 100.0 |
| <80% with diploma | 100.0 | 0.0 | 0.0 | 0.0 | 0.0 |
| Median income ($, mean) | 27,665 | 65,758 | 64,532 | 69,006 | 62,559 |
| Married (%) | 26.0 | 47.9 | 48.0 | 53.7 | 49.5 |
Abbreviations: FPL, federal poverty level; GED, general education diploma; LSES, low socioeconomic status; NLSES, not‐low socioeconomic status; SES, socioeconomic status.
Every difference between focal patients and matched controls (or all controls) was significant at p < 0.0001.
LSES patients must have been dual‐eligible and residing in neighborhoods with an FPL of 20% or more and with fewer than 80% of residents having a high school diploma or GED. To be NLSES, patients must not have been dual‐eligible and must have resided in neighborhoods that did not have an FPL of 20% or more, or fewer than 80% of residents having a high school diploma or GED.
The Quality of the Matches
Sections 2a, 2b, and 2c of Table 2, report the quality of the matches for selected covariates in the 3 different focal groups (LSES non‐Hispanic whites, LSES blacks, and LSES Hispanics, respectively), with each focal group always matched to NLSES non‐Hispanic whites. For each section, LSES patients (the focal groups) are in the far‐left column, with treatment‐, presentation‐, and demographics‐matched NLSES non‐Hispanic whites in each subsequent column going from left to right. Bolded results report covariates that were included in the match, and unbolded results represent covariates not included in the match. The demographics matches controlled for 49 covariates, the presentation matches added 55 presentation covariates for a total of 104 covariates, and the treatment matches added 65 treatment variables for a total of 169 covariates. After matching, the standardized differences of all covariates in the NLSES non‐Hispanic white demographics and presentation matches met the balance criteria, with significant p‐values for only a single SEER site in each match. In the treatment match, featuring the most comprehensive set of variables, all 169 standardized differences met the balance criteria, with just 2 variables having significant p‐values after matching. Thus, the number of imbalanced observed covariates was much lower than would be expected in a randomized trial with 169 covariates. Comparable balance was achieved in all LSES black and LSES Hispanic matches. See online Appendix Tables 6, 7, and 8 for complete matching results for LSES non‐Hispanic whites, LSES blacks, and LSES Hispanics, respectively.
Table 2.
The Quality of 3 Tapered Matched Samples of LSES Groups, Each With 3 Control Groups From NLSES Non‐Hispanic Whites (Demographics Match, Presentation Match, and Treatment Match)
| 2a. LSES Non‐Hispanic Whites Matched to NLSES Non‐Hispanic Whites | ||||
|---|---|---|---|---|
| NLSES Non‐Hispanic White Controls Matched for: | ||||
| Focal LSESb Non‐Hispanic Whites | Treatment +Presentation +Demographics | Presentation +Demographics | Demographics | |
| Variablea | n = 1,890 | n = 1,890 | n = 1,890 | n = 1,890 |
| Age at diagnosis (years, mean) | 75.3 | 75.0 | 75.4 | 75.3 |
| Diagnosis year (mean) | 2003.9 | 2003.9 | 2003.9 | 2003.9 |
| Selected Presentation Variables | ||||
| CHF % | 22.1 | 21.3 | 20.0 | 8.7**** |
| Diabetes % | 37.8 | 36.8 | 36.2 | 19.0**** |
| Stage I % | 38.2 | 38.2 | 38.2 | 51.8**** |
| Stage II % | 35.3 | 35.3 | 35.3 | 30.2*** |
| Stage III % | 9.7 | 9.7 | 9.7 | 7.7* |
| Late stage (stage IV) % | 6.6 | 6.6 | 6.6 | 3.6**** |
| Stage missing % | 10.1 | 10.1 | 10.1 | 6.8*** |
| Grade I % | 19.9 | 20.2 | 20.3 | 23.7** |
| Grade II % | 38.5 | 39.4 | 38.6 | 41.0 |
| Grade III % | 26.9 | 25.5 | 26.4 | 23.9* |
| Grade IV % | 1.4 | 1.9 | 1.5 | 1.1 |
| Grade missing % | 13.2 | 13.1 | 13.2 | 10.3** |
| ER positive % | 67.0 | 67.8 | 67.5 | 74.0**** |
| Tumor size 3 < 4 cm % | 12.1 | 11.7 | 10.7 | 8.6*** |
| Tumor size ≥ 4 cm % | 15.6 | 15.3 | 14.1 | 10.9**** |
| Selected Treatment Variables | ||||
| Nodes removed (mean) | 7.86 | 7.15 ** | 6.99*** | 6.75**** |
| Nodes positive (mean) | 1.47 | 1.48 | 1.52 | 1.16*** |
| Ratio of nodes positive to removed (mean) | 0.13 | 0.13 | 0.14 | 0.10** |
| No treatment % | 7.5 | 7.5 | 6.2 | 3.0**** |
| Inappropriate treatmentc % | 19.8 | 19.7 | 18.5 | 12.6**** |
| Mastectomy only % | 33.2 | 33.2 | 22.0**** | 22.0**** |
| Breast‐conserving surgery + radiation % | 19.5 | 19.6 | 28.1**** | 36.2**** |
| Breast‐conserving surgery only (without radiation) % | 9.8 | 9.7 | 10.1 | 7.8*** |
| Any radiation % | 33.3 | 34.4 | 46.3**** | 54.6**** |
| Any chemotherapy % | 35.5 | 36.4 | 42.5**** | 41.2**** |
| Chemo with doxorubicin but no taxane % | 4.2 | 4.6 | 5.1 | 5.3 |
| Chemo with doxorubicin + taxane % | 4.3 | 4.6 | 6.2** | 5.9* |
| Days from Dx to Tx, of those who were treated (mean) | 27.6 | 26.9 | 25.7 | 25.6 |
| 2b. LSES Blacks Matched to NLSES Non‐Hispanic Whites | ||||
|---|---|---|---|---|
| NLSES Non‐Hispanic White Controls Matched for: | ||||
| Focal LSESbBlacks | Treatment +Presentation +Demographics | Presentation +Demographics | Demographics | |
| Variablea | n = 1,824 | n = 1,824 | n = 1,824 | n = 1,824 |
| Age at diagnosis (years, mean) | 76.0 | 76.0 | 76.1 | 76.1 |
| Diagnosis year (mean) | 2002.4 | 2002.4 | 2002.4 | 2002.4 |
| CHF % | 21.3 | 21.0 | 20.3 | 10.6**** |
| Diabetes % | 42.5 | 41.7 | 41.9 | 19.2**** |
| Selected Presentation Variables | ||||
| Stage I % | 31.3 | 31.3 | 31.3 | 50.5**** |
| Stage II % | 35.9 | 35.9 | 35.9 | 28.9**** |
| Stage III % | 11.6 | 11.6 | 11.6 | 8.1*** |
| Late stage (stage IV) % | 8.2 | 8.2 | 8.2 | 4.1**** |
| Stage missing % | 13.0 | 13.0 | 13.0 | 8.3**** |
| Grade I % | 13.1 | 14.3 | 14.4 | 21.9**** |
| Grade II % | 32.1 | 32.0 | 31.5 | 38.6**** |
| Grade III % | 32.0 | 31.6 | 31.3 | 24.4**** |
| Grade IV % | 2.1 | 2.1 | 2.0 | 1.9**** |
| Grade missing % | 20.7 | 20.1 | 20.8 | 13.2**** |
| ER positive % | 57.0 | 57.0 | 58.6 | 69.5**** |
| Tumor size 3 < 4 cm % | 11.7 | 12.2 | 11.7 | 8.1**** |
| Tumor size ≥ 4 cm % | 22.3 | 21.3 | 21.7 | 12.1**** |
| Selected Treatment Variables | ||||
| Nodes removed (mean) | 7.58 | 7.46 | 7.61*** | 7.24**** |
| Nodes positive (mean) | 1.73 | 1.73 | 1.92 | 1.22*** |
| Ratio of nodes positive to removed (mean) | 0.17 | 0.16 | 0.16 | 0.11** |
| No treatment % | 11.4 | 11.4 | 7.6**** | 4.8**** |
| Inappropriate treatmentc % | 24.7 | 24.7 | 18.1**** | 16.1**** |
| Mastectomy only % | 28.8 | 29.2 | 24.2*** | 25.4* |
| Breast‐conserving surgery + radiation % | 18.0 | 18.0 | 25.1**** | 32.3**** |
| Breast‐conserving surgery only (without radiation) % | 9.5 | 9.5 | 8.0 | 9.6 |
| Any radiation % | 34.5 | 34.9 | 44.1**** | 49.4**** |
| Any chemotherapy % | 33.1 | 33.2 | 40.0**** | 35.0**** |
| Chemo with doxorubicin but no taxane % | 5.9 | 6.0 | 6.3 | 5.4 |
| Chemo with doxorubicin + taxane % | 4.8 | 5.1 | 7.1** | 5.2 |
| Days from Dx to Tx, of those who were treated (mean) | 31.6 | 30.6 | 24.6**** | 24.4**** |
| 2c. LSES Hispanics Matched to NLSES Non‐Hispanic Whites | ||||
|---|---|---|---|---|
| NLSES Non‐Hispanic White Controls Matched for: | ||||
| Focal LSESb Hispanics | Treatment +Presentation +Demographics | Presentation +Demographics | Demographics | |
| Variablea | n = 723 | n = 723 | n = 723 | n = 723 |
| Age at diagnosis (years, mean) | 75.1 | 75.4 | 75.4 | 75.0 |
| Diagnosis year (mean) | 2002.5 | 2002.5 | 2002.5 | 2002.5 |
| Selected Presentation Variables | ||||
| CHF % | 17.6 | 18.7 | 17.0 | 9.4**** |
| Diabetes % | 43.8 | 45.8 | 41.8 | 14.4**** |
| Stage I % | 35.4 | 35.4 | 35.4 | 54.2**** |
| Stage II % | 35.0 | 35.0 | 35.0 | 28.6* |
| Stage III % | 12.9 | 12.9 | 12.9 | 5.9**** |
| Late stage (stage IV) % | 5.8 | 5.8 | 5.8 | 2.8** |
| Stage missing % | 10.9 | 10.9 | 10.9 | 8.4 |
| Grade I % | 14.4 | 16.2 | 15.6 | 24.9**** |
| Grade II % | 36.1 | 33.9 | 35.8 | 42.6**** |
| Grade III % | 31.5 | 31.5 | 30.4 | 21.2**** |
| Grade IV % | –d | –d | –d | –d |
| Grade missing % | –d | –d | –d | –d |
| ER positive % | 62.9 | 65.8 | 62.8 | 72.2*** |
| Tumor size 3 < 4 cm % | 10.4 | 10.9 | 11.1 | 7.6 |
| Tumor size ≥ 4 cm % | 18.9 | 17.6 | 18.1 | 10.1**** |
| Selected Treatment Variables | ||||
| Nodes removed (mean) | 8.38 | 8.03 | 7.83 | 7.13*** |
| Nodes positive (mean) | 1.90 | 1.92 | 2.00 | 1.02**** |
| Ratio of nodes positive to removed (mean) | 0.16 | 0.16 | 0.16 | 0.09** |
| No treatment % | 8.4 | 8.4 | 5.4* | 4.4** |
| Inappropriate treatmentc % | 19.1 | 19.1 | 16.0 | 14.9* |
| Mastectomy only % | 24.9 | 27.1 | 20.3* | 21.0 |
| Breast‐conserving surgery + radiation % | 24.5 | 24.5 | 34.2**** | 38.2**** |
| Breast‐conserving surgery only (without radiation) % | 8.2 | 8.2 | 8.2 | 8.6 |
| Any radiation % | 41.1 | 41.4 | 54.6**** | 57.4**** |
| Any chemotherapy % | 39.1 | 37.1 | 37.2 | 32.6** |
| Chemo with doxorubicin but no taxane % | 5.3 | 4.1 | 5.1 | 4.4 |
| Chemo with doxorubicin + taxane % | 5.8 | 5.7 | 6.1 | 4.4 |
| Days from Dx to Tx, of those who were treated (mean) | 30.6 | 29.8 | 25.4* | 26.9 |
Abbreviations: CHF, congestive heart failure; Dx, Diagnosis; ER, estrogen receptor; LSES, low socioeconomic status; NLSES, not‐low socioeconomic status; SES, socioeconomic status; Tx, Treatment.
* p < 0.05; ** p < 0.01; *** p < 0.001; **** p < 0.0001. P‐values for bolded variables test for balance, while p‐values for non‐bolded numbers test differences in unmatched variables. See Statistical Tests and Outcomes for details.
a
Selected from 169 variables: see complete results in online Appendix Table 6. Variables whose values are displayed in bold were included in the column's match.
b
LSES patients must have been dual‐eligible and residing in neighborhoods with an FPL of 20% or more and with fewer than 80% of residents having a high school diploma or GED. To be NLSES, patients must not have been dual‐eligible and must have resided in neighborhoods that did not have an FPL of 20% or more, or fewer than 80% of residents having a high school diploma or GED.
c
Inappropriate treatment is defined as no surgery in early‐stage disease, no treatment in late‐stage disease, or conserving surgery without radiation at any stage.
d
These cells are masked to comply with CMS cell size suppression rules.
Examining Presentation and Treatment Differences by Socioeconomic Status
In Table 2 we see consistently worse presentation factors in the LSES patients. For example, 6.6% of LSES non‐Hispanic white patients were diagnosed with stage IV disease versus 3.6% of matched NLSES non‐Hispanic white patients (p < 0.0001) and 15.6% of LSES non‐Hispanic white patients had tumor sizes of 4 cm or more versus 10.9% of NLSES patients (p < 0.0001). LSES non‐Hispanic whites also had more comorbidities: for example, 37.8% had diabetes, compared to just 19% of NLSES whites matched for demographics (p < 0.0001). In general, similar patterns were observed across all 3 LSES focal groups, except that disparities in presentation were largest for blacks and smallest for Hispanics.
Even after controlling for differences in presentation factors, LSES patients had some important differences in treatment received relative to NLSES patients (Table 2). This is important because a treatment difference that merely reflects a difference in presentation is not a disparity; rather, a disparity is a treatment difference among patients with the same presentation. For example, LSES non‐Hispanic white patients received mastectomy with no other treatment far more frequently (33.2% vs 22.0%, p < 0.0001) and were less likely to receive conserving surgery with radiation (19.5% vs 28.1%, p < 0.0001); any radiation (33.3% vs 46.3%, p < 0.0001); or chemotherapy (35.5% vs 42.5%, p < 0.0001) than their presentation‐matched NLSES non‐Hispanic white controls. Other treatment differences were more modest but generally favored the NLSES group. Similar results were observed for LSES black and LSES Hispanic patients, who also had less radiation and chemotherapy. Importantly, LSES blacks were the only group that received significantly less surgery and also the only group that received a significantly higher rate of inappropriate treatment (24.7% vs 18.1%, p < 0.0001) compared to NLSES non‐Hispanic whites, despite similar presentation characteristics. See online Appendix Table 9 for analyses of additional treatment differences.
We also examined rates of diagnosis of triple‐negative breast cancer (TNBC) across SES levels among all patients diagnosed in 2010, stratified by racial/ethnic group. Here, we found no difference in TNBC rates between LSES and NLSES patients (see online Appendix Table 10).
Survival Results for LSES Non‐Hispanic Whites Compared to NLSES Non‐Hispanic Whites
In Table 3 we display survival differences between LSES patients and NLSES matched controls. Differences in survival were large and significant between LSES and NLSES non‐Hispanic white women closely matched for demographics (age, year, and SEER site). Median survival in the LSES group was 84 months versus 126 months in the NLSES group matched for demographics (p < 0.0001), corresponding to 5‐year survival rates of 61.4% versus 75.1%, respectively, or an overall disparity of 13.7% (95% confidence interval [CI]: 10.8%, 16.6%).
Table 3.
Breast Cancer Survival Outcomes for All Matches
| NLSES Non‐Hispanic White Controls Matched for: | ||||
|---|---|---|---|---|
| Focal LSESa Non‐Hispanic Whites | Treatment +Presentation +Demographics | Presentation +Demographics | Demographics | |
| NLSES Whites – LSES Whites Outcome Measure | n = 1,890 | n = 1,890 | n = 1,890 | n = 1,890 |
| Median survival (in months) | 84 | 101 | 100 | 126 |
| (80, 89) | (93, 108) | (91, 106) | (118, 137) | |
| NLSES – LSES difference (in months) | 17 | 16 | 42 | |
| (8, 25) | (7, 23) | (33, 52) | ||
| p = 0.0006 | p = 0.0008 | p < 0.0001 | ||
| 5‐year survival and confidence interval (%) | 61.4 | 66.0 | 66.4 | 75.1 |
| (59.1, 63.6) | (63.8, 68.1) | (64.1, 68.5) | (73.1, 77.1) | |
| NLSES – LSES difference (%) | 4.6 | 4.9 | 13.7 | |
| (1.7, 7.4) | (2.1, 7.8) | (10.8, 16.6) | ||
| p = 0.0014 | p = 0.0012 | p < 0.0001 | ||
| Prentice‐Wilcoxon survival difference p‐value | NA | p < 0.0001 | p < 0.0001 | p < 0.0001 |
| Paired Cox model hazard ratio using all follow‐up | NA | 1.278 | 1.225 | 1.846 |
| (1.148, 1.422) | (1.102, 1.363) | (1.649, 2.066) | ||
| p < 0.0001 | p = 0.0002 | p < 0.0001 | ||
| NLSES Non‐Hispanic White Controls Matched for: | ||||
|---|---|---|---|---|
| Focal LSESa Blacks | Treatment +Presentation +Demographics | Presentation +Demographics | Demographics | |
| NLSES Whites – LSES Blacks Outcome Measure | n = 1,824 | n = 1,824 | n = 1,824 | n = 1,824 |
| Median survival (in months) | 73 | 84 | 90 | 120 |
| (68, 77) | (79, 92) | (83, 97) | (111, 127) | |
| NLSES – LSES difference (in months) | 11 | 17 | 47 | |
| (5, 20) | (10, 25) | (38, 56) | ||
| p = 0.0020 | p < 0.0001 | p < 0.0001 | ||
| 5‐year survival and confidence interval (%) | 56.5 | 59.5 | 61.3 | 72.9 |
| (54.1, 58.7) | (57.2, 61.8) | (59.0, 63.5) | (70.8, 74.9) | |
| NLSES – LSES difference (%) | 3.1 | 4.8 | 16.4 | |
| (0.0, 5.9) | (1.9, 7.6) | (13.3, 19.5) | ||
| p = 0.0414 | p = 0.0012 | p < 0.0001 | ||
| Prentice‐Wilcoxon survival difference p‐value | NA | p = 0.0031 | p < 0.0001 | p < 0.0001 |
| Paired Cox model hazard ratio using all follow‐up | NA | 1.081 | 1.266 | 1.805 |
| (0.976, 1.196) | (1.141, 1.404) | (1.620, 2.010) | ||
| p = 0.1338 | p < 0.0001 | p < 0.0001 | ||
| NLSES Non‐Hispanic White Controls Matched for: | ||||
|---|---|---|---|---|
| Focal LSESa Hispanics | Treatment +Presentation +Demographics | Presentation +Demographics | Demographics | |
| NLSES Whites – LSES Hispanics Outcome Measure | n = 723 | n = 723 | n = 723 | n = 723 |
| Median survival (in months) | 106 | 108 | 110 | 145 |
| (92, 121) | (98, 120) | (97, 119) | (129, 156) | |
| NLSES – LSES difference (in months) | 2 | 4 | 39 | |
| (−15, 20) | (−15, 21) | (20, 57) | ||
| p = 0.6950 | p = 0.6738 | p = 0.0002 | ||
| 5‐year survival and confidence interval (%) | 68.4 | 67.0 | 70.5 | 79.8 |
| (64.8, 71.7) | (63.4, 70.3) | (66.9, 73.7) | (76.3, 82.6) | |
| NLSES – LSES difference (%) | −1.5 | 2.1 | 11.4 | |
| (−5.9, 3.0) | (−2.3, 6.5) | (7.1, 15.8) | ||
| p = 0.5180 | p = 0.3666 | p < 0.0001 | ||
| Prentice‐Wilcoxon survival difference p‐value | NA | p = 0.8264 | p = 0.5847 | p < 0.0001 |
| Paired Cox model hazard ratio using all follow‐up | NA | 0.925 | 1.015 | 1.565 |
| (0.778, 1.110) | (0.856, 1.205) | (1.306, 1.877) | ||
| p = 0.3781 | p = 0.8615 | p < 0.0001 | ||
Abbreviations: LSES, low socioeconomic status; NA, not applicable; NLSES, not‐low socioeconomic status.
All confidence intervals and p‐values for median and 5‐year NLSES – LSES survival differences were based on bootstrapped standard errors. The Prentice‐Wilcoxon test assessed the difference in the survival curves using all available follow‐up data.
LSES patients must have been dual‐eligible and residing in neighborhoods with an FPL of 20% or more and with fewer than 80% of residents having a high school diploma or GED. To be NLSES, patients must not have been dual‐eligible and must have resided in neighborhoods that did not have an FPL of 20% or more, or fewer than 80% of residents having a high school diploma or GED.
Five‐year survival was 75.1% for NLSES patients in the demographics match, reflecting survival in NLSES patients who both presented like NLSES patients and were treated like NLSES patients. In NLSES patients matched for presentation, reflecting NLSES patients who presented like LSES patients but were treated like NLSES patients, we see a drop in 5‐year survival to 66.4% (an absolute decline of 8.8%, p < 0.0001, using the exterior match), suggesting that presentation factors make up about two‐thirds of the overall disparity (8.8/13.7 = 64%). The treatment‐matched cohort also had a very similar 5‐year survival rate of 66.0%. The difference in survival between the NLSES non‐Hispanic whites matched to LSES non‐Hispanic whites for treatment and NLSES non‐Hispanic whites matched to LSES non‐Hispanic whites for presentation only was not significant (p = 0.6844, see online Appendix Table 11). In other words, NLSES patients who presented like LSES patients and were treated like NLSES patients fared no differently than NLSES patients who presented like LSES patients and were treated like LSES patients, implying treatment differences did not explain the observed survival disparity between LSES and NLSES non‐Hispanic white groups. Figure 2 presents the survival of the LSES non‐Hispanic white cohort and the 3 NLSES non‐Hispanic white cohorts described earlier. As the figure shows, the survival curves for the presentation‐ and treatment‐matched NLSES non‐Hispanic white cohorts are very similar.
Figure 2.
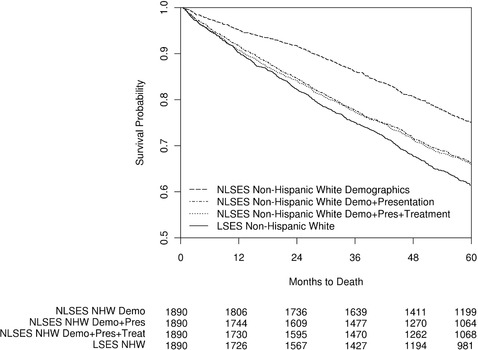
Kaplan‐Meier Curve for Breast Cancer Survival for LSES Non‐Hispanic Whites and 3 Matched NLSES Non‐Hispanic White (NHW) Populations Diagnosed Between 1992 and 2010
Survival Results for LSES Blacks Compared to NLSES Non‐Hispanic Whites
The median survival for LSES black women was 73 months, compared to 120 months for NLSES white women with comparable age at diagnosis, year of diagnosis, and SEER sites of residence, a difference of 47 months, or nearly 4 years (p < 0.0001) (see Table 3). In this same match, LSES black patients had a 5‐year survival estimate of 56.5%, compared to 72.9% for NLSES non‐Hispanic whites (p < 0.0001). Additional matching to control for presentation factors reduced median survival for NLSES non‐Hispanic whites to 90 months (p < 0.0001) and the 5‐year survival rate to 61.3% (p = 0.0012). Finally, matching for treatment reduced median survival to 84 months, still 11 months more than among LSES black women (p = 0.0020). Five‐year survival was also slightly higher for NLSES non‐Hispanic whites compared to LSES blacks (59.5% vs 56.5%, p = 0.0414) (see Figure 3). Unlike in the non‐Hispanic white matches, the difference in survival between NLSES non‐Hispanic whites matched to LSES blacks for treatment and NLSES non‐Hispanic whites matched to LSES blacks for presentation was significant (p = 0.0162; see online Appendix Table 11), suggesting that treatment differences between LSES blacks and NLSES non‐Hispanic whites did contribute to the overall survival disparity experienced by LSES blacks.
Figure 3.
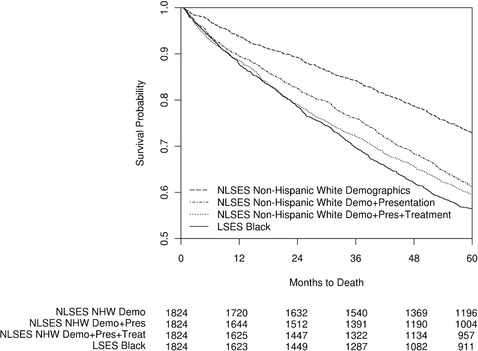
Kaplan‐Meier Curve for Breast Cancer Survival for LSES Blacks and 3 Matched NLSES Non‐Hispanic White (NHW) Populations Diagnosed Between 1992 and 2010
Survival Results for LSES Hispanics Compared to NLSES Non‐Hispanic Whites
The median survival for LSES Hispanic women was 106 months, compared to 145 months for NLSES white women with comparable age at diagnosis, year of diagnosis, and SEER sites of residence, a difference of 39 months, or more than 3 years (p = 0.0002) (see Table 3). In this same match, LSES Hispanic patients had a 5‐year survival estimate of 68.4%, compared to 79.8% for NLSES non‐Hispanic whites (p < 0.0001). Additional matching to control for presentation factors reduced median survival for NLSES non‐Hispanic whites to 110 months (p = 0.6738) and the 5‐year survival rate to 70.5% (p = 0.3666). Finally, matching for treatment reduced median survival to 108 months, still 2 months more than among LSES Hispanic women (p = 0.6950). Five‐year survival was slightly lower for NLSES non‐Hispanic whites compared to LSES Hispanics, though not significantly so (67.0% vs 68.4%, p = 0.5180) (see Figure 4). The difference in survival between NLSES non‐Hispanic whites matched to LSES Hispanics for treatment and NLSES non‐Hispanic whites matched to LSES Hispanics for presentation was not significant (p = 0.3596; see online Appendix Table 11), despite an apparent trend toward diverging survival beginning at 36 months after diagnosis.
Figure 4.
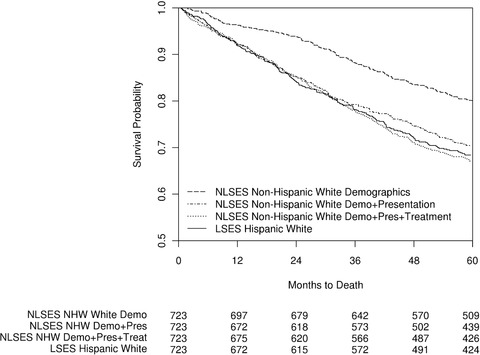
Kaplan‐Meier Curve for Breast Cancer Survival for LSES Hispanics and 3 Matched NLSES Non‐Hispanic White (NHW) Populations Diagnosed Between 1992 and 2010
Differences in Survival Between LSES Black Patients and NLSES Black Patients
In addition to the LSES black versus NLSES non‐Hispanic white analysis, we also performed full matches between the 1,824 LSES black patients and 1,754 NLSES black patients.39 To the extent that a full match has sets of varied sizes, a full match is less efficient than a paired study with the same number of people, and the “effective” sample size is the size of a paired study with the same sampling precision. The effective sample sizes after matching ranged from 1,250 pairs in the demographics match to 1,360 pairs in the treatment match. We then used stratified Cox models to examine differences in survival. All Cox models included adjustment for residual differences in SEER site, and Cox models for the presentation and treatment matches also added adjustment for residual differences in comorbidities. After matching for demographics, the hazard ratio associated with LSES was 1.482 (p < 0.0001), which was smaller than the 1.805 hazard ratio between LSES blacks and NLSES non‐Hispanic whites matched for demographics seen in Table 3. After additional matching for presentation factors, the hazard ratio associated with LSES declined to 1.353 (p < 0.0001), which was comparable to the 1.266 hazard ratio between LSES blacks and NLSES non‐Hispanic whites matched for presentation seen in Table 3. Finally, after additional matching for treatment factors, the hazard ratio associated with LSES was 1.381 (p < 0.0001), similar to the 1.353 hazard ratio between LSES blacks and NLSES blacks matched for presentation alone, but larger than the 1.081 hazard ratio between LSES blacks and NLSES non‐Hispanic whites matched for treatment seen in Table 3. See online Appendix Table 12 for full matching tables and online Appendix Table 14 for Cox model results.
Differences in Survival Between LSES Hispanics and NLSES Hispanics
In addition to the LSES Hispanic versus NLSES non‐Hispanic white analysis, we also performed full matches between the 723 LSES Hispanic patients and 1,194 NLSES Hispanic patients. We then used stratified Cox models to examine differences in survival. As with the LSES black versus NLSES black analysis of full matches, all Cox models included adjustment for residual differences in SEER site, and Cox models for the presentation and treatment matches also added adjustment for residual differences in comorbidities. The effective sample sizes ranged from 690 pairs in the demographics match to 715 pairs in the treatment match. After matching for demographics, the hazard ratio associated with LSES was 1.599 (p < 0.0001), which was comparable to the 1.565 hazard ratio between LSES Hispanics and NLSES non‐Hispanic whites matched for demographics seen in Table 3. After additional matching for presentation factors, the hazard ratio associated with LSES declined to 1.103 (p = 0.2700), which was comparable to the 1.105 hazard ratio between LSES Hispanics and NLSES non‐Hispanic whites matched for presentation seen in Table 3. Finally, after additional matching for treatment factors, the hazard ratio associated with LSES was 1.075 (p = 0.4120), which was slightly larger than the 0.925 hazard ratio between LSES Hispanics and NLSES non‐Hispanic whites matched for treatment seen in Table 3. See online Appendix Table 13 for full matching tables and online Appendix Table 15 for Cox model results.
Postmatch Adjustments for Differences in Estrogen Receptor (ER) Status
As a proxy for analysis of TNBC, we performed postmatch adjustments on the presentation match for ER status using paired Cox models and report these in online Appendix Table 16. The hazard ratio for LSES whites versus NLSES whites was 1.225 in our original results and 1.226 in the ER‐adjusted results; for LSES blacks versus NLSES whites, the hazard ratios were 1.266 versus 1.258; and for LSES Hispanics versus NLSES whites the hazard ratios were 1.015 versus 1.010. Given how close these results were, it would appear that ER status differences were not driving the survival disparities we reported from our matched analyses. See online Appendix Table 16 for results for all adjustments and matches.
Differences in Preventive Care Utilization by Socioeconomic Status
Table 4 reports preventive care utilization rates in the 6 to 18 months prior to diagnosis. There were large and significant disparities in utilization between LSES populations and NLSES controls, particularly in screening mammography. Of LSES non‐Hispanic whites, 17.5% had a screening mammography during the analysis window, compared to 39.1% of NLSES non‐Hispanic whites matched for demographics (p < 0.0001). Similarly, large differences in mammography use were also observed in the demographics match for black women (19.1% vs 38.4% in NLSES white controls, p < 0.0001) and for Hispanic women (16.6% vs 39.7% in NLSES whites, p < 0.0001). These differences remained after additional matching for eventual presentation and treatment factors. In addition to lower rates of mammography, all 3 LSES groups were significantly less likely to have had a primary care visit during the analysis window, with LSES rates for all groups below 85% and NLSES rates always being above 90% regardless of the match.
Table 4.
Differences in Preventive Care Utilization by Socioeconomic Status
| NLSES Non‐Hispanic Whites Matched For: | |||||||
|---|---|---|---|---|---|---|---|
| Variable | Focal LSESa Non‐Hispanic Whites | Treatment +Presentation +Demographics | Presentation +Demographics | Demographics | |||
| N | 1,737 | 1,641 | 1,641 | 1,737 | |||
| % | % | p‐value | % | p‐value | % | p‐value | |
| % with primary care visit | 84.3 | 92.1 | <0.0001 | 92.2 | <0.0001 | 91.1 | <0.0001 |
| % with breast cancer screen | 17.5 | 33.2 | <0.0001 | 33.4 | <0.0001 | 39.1 | <0.0001 |
| % with colon cancer screen | 14.3 | 20.9 | <0.0001 | 21.3 | <0.0001 | 22.5 | <0.0001 |
| % with cholesterol screen | 55.7 | 60.5 | 0.0005 | 61.4 | 0.0003 | 58.7 | 0.0641 |
| NLSES Non‐Hispanic Whites Matched For: | |||||||
|---|---|---|---|---|---|---|---|
| Variable | Focal LSESa Blacks | Treatment +Presentation +Demographics | Presentation +Demographics | Demographics | |||
| N | 1,678 | 1,581 | 1,585 | 1,678 | |||
| % | % | p‐value | % | p‐value | % | p‐value | |
| % with primary care visit | 82.0 | 91.6 | <0.0001 | 91.3 | <0.0001 | 91.7 | <0.0001 |
| % with breast cancer screen | 19.1 | 29.4 | <0.0001 | 29.9 | <0.0001 | 38.4 | <0.0001 |
| % with colon cancer screen | 13.9 | 20.8 | <0.0001 | 20.7 | <0.0001 | 25.7 | <0.0001 |
| % with cholesterol screen | 48.9 | 60.5 | <0.0001 | 60.8 | <0.0001 | 56.7 | <0.0001 |
| NLSES Non‐Hispanic Whites Matched For: | |||||||
|---|---|---|---|---|---|---|---|
| Variable | Focal LSESa Hispanics | Treatment +Presentation + Demographics | Presentation +Demographics | Demographics | |||
| N | 657 | 630 | 614 | 657 | |||
| % | % | p‐value | % | p‐value | % | p‐value | |
| % with primary care visit | 84.3 | 91.6 | <0.0001 | 90.4 | 0.0005 | 90.0 | 0.0033 |
| % with breast cancer screen | 16.6 | 34.1 | <0.0001 | 35.2 | <0.0001 | 39.7 | <0.0001 |
| % with colon cancer screen | 14.3 | 23.7 | <0.0001 | 22.5 | 0.0011 | 24.5 | <0.0001 |
| % with cholesterol screen | 56.9 | 59.2 | 0.4405 | 61.1 | 0.1101 | 57.8 | 0.7729 |
Abbreviations: LSES, low socioeconomic status; NLSES, not‐low socioeconomic status.
P‐values were calculated using McNemar's test. All matched comparisons only used pairs where each patient had 18 months of continuous Part B coverage prior to diagnosis.
LSES patients must have been dual‐eligible and residing in neighborhoods with an FPL of 20% or more and with fewer than 80% of residents having a high school diploma or GED. To be NLSES, patients must not have been dual‐eligible and must have resided in neighborhoods that did not have an FPL of 20% or more, or fewer than 80% of residents having a high school diploma or GED.
Discussion
Across racial and ethnic groups, patients with LSES have worse survival from breast cancer. Through tapered matching, we were able to transparently examine how differences in specific sets of patient factors contributed to the overall survival disparity. By sequentially controlling for differences in demographics, presentation, and treatment, we observed how overall survival changed in NLSES controls as compared to the fixed LSES group, after each match.
LSES Patients Present With More Advanced Disease and Comorbid Conditions
Tapered matching allowed us to directly see the differences in the way LSES and NLSES patients presented at diagnosis. The health of LSES patients was far worse than that of NLSES controls, both with respect to tumor characteristics and with respect to patient health as measured by comorbidities. We saw that all focal groups of LSES patients had higher rates of stage IV cancer at diagnosis than their NLSES demographics‐matched controls, with the LSES non‐Hispanic whites diagnosed at a rate of 6.6% versus 3.6% for NLSES controls, the LSES black population diagnosed at a rate of 8.2% versus 4.1% in NLSES controls, and the LSES Hispanic population diagnosed at a rate of 5.8% versus 2.8% in NLSES controls. We also saw higher rates of important comorbidities in the LSES populations than in the NLSES controls. For history of diabetes, we found the LSES non‐Hispanic white focal group had a diabetes rate of 37.8% versus 19.0% for NLSES controls. The focal black population had a 42.5% rate of diabetes versus 19.2% in NLSES controls, and the focal Hispanic population had a 43.8% rate versus 14.4% in NLSES controls.
Understanding the Relative Effects of Presentation and Treatment on Survival Disparities
We found that almost two‐thirds of the overall survival disparity between LSES and NLSES patients was due to conditions at presentation (variables describing the tumor and variables describing the patient's comorbidities at diagnosis). The survival statistics were sobering to consider. In non‐Hispanic whites, the LSES median survival was 84 months versus 126 months for NLSES non‐Hispanic whites. After matching the NLSES non‐Hispanic whites on variables at diagnosis (the presentation match), the NLSES survival fell to 100 months. For blacks, the survival disparities were even larger, with black LSES median survival of only 73 months versus 120 months in the matched NLSES non‐Hispanic white population, falling to 90 months when matched on presentation factors. LSES Hispanic patients, in an absolute sense, fared slightly better with a median survival of 106 months versus a matched NLSES non‐Hispanic white median survival of 145 months, falling to 110 months after presentation factors were matched. In each case, presentation factors explained most of the disparity between LSES and NLSES patients. Though differences in geography across LSES racial/ethnic populations make the differences in survival disparities between LSES focal groups difficult to interpret, it would appear that LSES black patients have the worst survival and experience the greatest total disparities among these groups.
After further matching LSES patients and NLSES controls on the treatment they received, along with demographics and presentation variables, we were able to compare survival between these NLSES controls and the NLSES controls matched only for demographics and presentation. For whites and Hispanics, treatment did not significantly affect the disparity; however, for black patients, we did observe important treatment differences and did find a significant treatment effect on the disparity, though this effect was small compared to the effect of presentation factors. Why treatment variables do not seem to have a great influence on the SES survival disparity is not clear, though it is possible that, as we previously reported in the case of racial disparities in cancer,4, 25, 26, 27, 28 treatment disparities matter less when patients present with more advanced disease and have a greater burden of comorbidities. Together, these findings should inform policymakers that attempts to reduce survival disparities across populations of different SES must concentrate on improving health at diagnosis. While we did see differences in treatment after controlling for presentation, these differences did not account for the large SES survival disparity.
Exploring the Effect of SES Independent of Race
While the standard in disparities research is to benchmark each disadvantaged group to the least disadvantaged group (in our case, NLSES non‐Hispanic whites),30, 31 we also investigated the effect of SES specifically among black patients, and among Hispanic patients, comparing LSES patients to NLSES patients within each racial/ethnic group. Because the number of NLSES black and Hispanic patients was similar to the number of LSES black and Hispanic patients, we applied full matching to the tapered matching framework to create matched sets that sequentially controlled for demographics, presentation, and then treatment. We found similar results in the LSES black versus NLSES black analysis to the LSES black versus NLSES non‐Hispanic white analysis, in that differences in presentation were more responsible for survival disparities than treatment differences. LSES black patients had significantly higher risk of mortality than NLSES black patients, with an additional control for treatment barely changing the LSES black versus NLSES black hazard ratio. We did see a larger total disparity when comparing LSES blacks to NLSES whites than when comparing LSES blacks to NLSES blacks, possibly because of both racial and SES disparities contributing to this apparently larger disparity, or due to a difference in the meaning of NLSES between white and black patients.
There was also a significant disparity in survival between LSES and NLSES Hispanics, which was no longer significant after controlling for differences in presentation characteristics. It appears that for all racial/ethnic stratified analyses (white vs white, black vs black, and Hispanic vs Hispanic), presentation differences play the largest role in explaining breast cancer survival disparities by SES.
Limitations
There are important limitations to our study. First, the analysis used only women who were residing in 17 SEER sites and who were age 66 or older at diagnosis, while the median age of breast cancer diagnosis for all women is 61.54 Although this limits generalizability to patients diagnosed at younger ages when aggressive tumors are more common, or to regions beyond SEER, use of these data did permit standardization of insurance status across SES levels and access to highly detailed data on baseline health status and cancer biology, as well as cancer treatment and preventive care utilization. Furthermore, because our study included only patients who were enrolled in and actively using the Medicare system, our analysis may underestimate the extent of the SES survival disparity. Additionally, our study was based on all‐cause mortality—better data on actual cause of death may have strengthened the study.
We did not have details on TNBC for most of the patients in the study, and black women are known to have a higher incidence of TNBC tumors.55 However, the relationship with SES is unclear. Bauer and colleagues did observe slightly higher odds of TNBC in LSES neighborhoods in California after adjusting for age, race, stage, and grade, although nearly half the patients in that study had incomplete tumor marker information.56 However, a more recent study by Akinyemiju and colleagues using the entire SEER database of patients diagnosed in 2010 found no association between TNBC and SES among non‐Hispanic white women after adjusting for age at diagnosis.57 In our study, we examined the distribution of TNBC by race/ethnicity and SES and saw that there was no relationship between TNBC and SES within any of the racial/ethnic groups (see online Appendix Table 10). Also, we found similar results to our primary analysis in the race‐stratified presentation analyses comparing LSES black patients to NLSES black patients using full matching, where TNBC rates should be similar between both black populations.
Additionally, we did not have data on hormonal therapy for most patients for defining treatment. Wang and Du recently reported only a small difference in the rates of hormonal therapy between high‐ and low‐SES women58 in their study population of 25,128 hormone receptor–positive breast cancer patients in SEER‐Medicare enrolled in Part D with information on prescribed hormonal therapy. After adjusting for race, stage, and other presentation factors, there was no difference in the probability of receiving hormonal therapy between the upper and lower quartile of neighborhood poverty among 4,771 patients who received chemotherapy. In 20,357 patients who did not receive chemotherapy, patients in the highest SES quartile did have a significantly elevated rate of hormonal therapy relative to the lowest quartile, but the absolute difference was small (69.9% in the upper quartile of SES vs 67.6% in the lowest quartile). This small difference could not explain the large disparity in survival that we report.
Finally, the survival disparities we observed may be susceptible to lead‐time bias, although our careful control for tumor size may have attenuated its effect.
Breast Cancer Survival Disparities and Health Care Policy
The precise effects of poverty and race on survival outcomes from breast cancer cannot be easily separated,59, 60, 61 as racial disparities are often correlated with SES disparities. Our study sheds new light on the relationship between race and SES when analyzing disparities because it addresses the effects of SES and race independently by analyzing the effect of SES within racial and ethnic groups and the combined effect of race and SES on survival relative to the least disadvantaged NLSES white patients. One especially important new finding presented here is that even within the non‐Hispanic white population, we see a very large SES effect on the presentation of patients diagnosed with breast cancer, as well as subsequent survival.
It is well known that socioeconomic status plays a significant role in health and life expectancy.12, 62, 63, 64, 65 We often think of Medicare and Medicaid as safety net programs that aim to bring equality in health care to Americans despite income differences brought on for any reason, including old age, disability, or poverty. Our results display survival disparities in breast cancer by SES in the United States that are large despite these safety net programs. It is interesting to contrast the recent findings of Sommers and colleagues with our work.65 The authors of that study concluded that while expansion of insurance via the Affordable Care Act (ACA) was perceived by racially and economically disadvantaged groups to be very helpful to them, insurance actually played a very small role in the attenuation of differences in perceived quality, cost, and access to care between disadvantaged and affluent populations. Importantly, Sommers examined a survey of 10,000 patients of varying insurance types conducted after the ACA went into effect in 2010, with no conditions on health status; in contrast, we examined only patients in the Medicare system diagnosed with breast cancer in 2010 or earlier. Since all our study population had insurance, we may have expected less of an effect from low SES than that noted by Sommers. Yet despite having Medicare and Medicaid, patients with low SES still had much lower survival. We suggested that the problem stems from inadequate preventive care, as patients with low SES had far worse disease on presentation, were in worse health, and had a history of receiving less health screening and less stable primary care providers. Sommers suggested that LSES patients perceived their care as poor. While there may be differences in the quality of care in our study, we could not explain the vast difference in survival by SES from our data on treatment after the diagnosis of breast cancer—because patients with NLSES who presented and were treated like LSES patients had the same survival as patients with NLSES who presented like LSES patients but were treated like NLSES patients. That is, treatment played only a minor role in explaining the survival disparity, especially among non‐Hispanic whites and Hispanics. For LSES black women, we did see a small but significant effect of treatment on the survival disparity relative to NLSES white women.
It was also worrisome that LSES black women showed high rates of inappropriate care. While our results suggest that changes to treatment will resolve only a small proportion of the survival disparity experienced by LSES black women, policy steps must be taken to ensure LSES black women are receiving proper treatment when they are diagnosed with breast cancer.
Prior to the diagnosis of breast cancer, we did see less preventive care in LSES patients despite their having insurance through Medicare, and the health of LSES patients who were newly diagnosed with breast cancer was far worse. This suggests that deficiencies in preventive care may relate not only to suboptimal screening patterns but also to the quality and thoroughness of preventive care for LSES patients in general in managing their comorbid conditions. Our finding that all LSES cohorts had significantly lower rates of primary care visits supports this possibility. The recent study of Sommers suggests that despite patients gaining insurance through the ACA, the expanded coverage alone may not be sufficient to improve outcomes or close gaps in quality across socioeconomic tiers or racial/ethnic groups. Our study of differences in breast cancer survival between insured patients of different SES levels and racial/ethnic groups corroborates the finding of Sommers—with which we completely agree. Our results strongly suggest that a large share of patients’ outcomes has already been decided before the patients are seen by the health care system for cancer treatment. Efforts to reduce survival disparities in breast cancer must concentrate on reaching patients to improve their health before diagnosis. Insurance itself may be necessary but is not sufficient for reducing the SES disparity. Creative approaches to better preventive care are clearly needed.
Furthermore, efforts needed to reduce disparities in presentation for patients with LSES in the non‐Hispanic white community may be very different from those efforts needed for the black or Hispanic communities. While we saw similar disparities in cancer screening and preventive care in LSES patients versus NLSES patients, our study does not explain why LSES patients do not seem to be fully taking advantage of the safety net programs that would pay for this screening. Such barriers to screening must be addressed if the overall SES survival disparity is to be addressed. What is clear is that concentrating only on treatment after diagnosis will not succeed in eliminating the observed SES disparity or the racial and ethnic disparities described herein.
Conclusion
In older patients in Medicare, SES disparities in breast cancer survival were large and significant. Generally, these differences in survival appear primarily to be caused by differences in presentation characteristics at diagnosis, and not by disparities in treatment, though treatment disparities were also apparent. Unfortunately, while insurance may be necessary to receive optimal preventive services and breast cancer treatment, insurance alone is not sufficient for reducing disparities linked to socioeconomic status, regardless of race or ethnicity.
Supporting information
Appendix I. Table 1: Patient Selection Summary
Appendix II. Table 2: Detailed Patient Characteristics
Appendix III. Table 3: Definitions of Breast Cancer Surgery Codes
Appendix IV. Table 4: Definitions of Breast Cancer Radiation Codes
Appendix V. Table 5: Definitions of Breast Cancer Chemotherapy Codes
Appendix VI: The Matching Methodology
Appendix VII: Codes for Analyses of Preventive Care
Appendix VIII. Table 6: Complete Matching Results: LSES Non‐Hispanic Whites vs NLSES Non‐Hispanic Whites
Appendix IX. Table 7: Complete Matching Results: LSES Blacks vs NLSES Non‐Hispanic Whites
Appendix X. Table 8: Complete Matching Results: LSES Hispanic Whites vs NLSES Non‐Hispanic Whites
Appendix XI. Table 9: Differences in Treatment Between Pairs Matched for Presentation and Demographics
Appendix XII. Table 10: 2010 Triple‐Negative Breast Cancer (TNBC) Diagnosis Rates Across SES Levels, Stratified by Race/Ethnicity
Appendix XIII. Table 11: Exterior Match Prentice‐Wilcoxon Tests
Appendix XIV. Tables 12 and 13: LSES vs NLSES Full Matching Tables for Black and Hispanic Patients
Appendix XV. Tables 14 and 15: Full Matching Cox Model Results for LSES vs NLSES Black and Hispanic Patients
Appendix XVI. Table 16: Paired Cox Models for LSES vs NLSES Non‐Hispanic White Matched Sets, Including Adjustments for ER and PR Status
Funding/Support
This research was funded through a grant from the National Institute on Minorities and Health Disparities, National Institutes of Health (Grant # R01 MD008915).
Conflict of Interest Disclosures: All authors have completed the ICMJE Form for Disclosure of Potential Conflicts of Interest. No disclosures were reported.
Acknowledgments: We thank Traci Frank, AA; Hong Zhou, MS; and Madhavi Muralidharan, BS (Center for Outcomes Research, the Children's Hospital of Philadelphia, Philadelphia, Pennsylvania); for their assistance with this research. All are full‐time employees of the Center for Outcomes Research. None of them were compensated for their contributions apart from salary.
References
- 1. Bradley CJ, Given CW, Roberts C. Race, socioeconomic status, and breast cancer treatment and survival. J Natl Cancer Inst. 2002;94(7):490‐496. [DOI] [PubMed] [Google Scholar]
- 2. Byers TE, Wolf HJ, Bauer KR, et al. The impact of socioeconomic status on survival after cancer in the United States: findings from the National Program of Cancer Registries Patterns of Care Study. Cancer. 2008;113(3):582‐591. [DOI] [PubMed] [Google Scholar]
- 3. Kish JK, Yu M, Percy‐Laurry A, Altekruse SF. Racial and ethnic disparities in cancer survival by neighborhood socioeconomic status in Surveillance, Epidemiology, and End Results (SEER) registries. J Natl Cancer Inst Monogr. 2014;2014(49):236‐243. [DOI] [PMC free article] [PubMed] [Google Scholar]
- 4. Sprague BL, Trentham‐Dietz A, Gangnon RE, et al. Socioeconomic status and survival after an invasive breast cancer diagnosis. Cancer. 2011;117(7):1542‐1551. [DOI] [PMC free article] [PubMed] [Google Scholar]
- 5. Pappas G, Queen S, Hadden W, Fisher G. The increasing disparity in mortality between socioeconomic groups in the United States, 1960 and 1986. N Engl J Med. 1993;329(2):103‐109. [DOI] [PubMed] [Google Scholar]
- 6. Link BG, Phelan J. Social conditions as fundamental causes of disease. J Health Soc Behav. 1995(Extra Issue):80‐94. [PubMed] [Google Scholar]
- 7. Krieger N, Chen JT, Waterman PD, Soobader MJ, Subramanian SV, Carson R. Geocoding and monitoring of US socioeconomic inequalities in mortality and cancer incidence: does the choice of area‐based measure and geographic level matter? The Public Health Disparities Geocoding Project. Am J Epidemiol. 2002;156(5):471‐482. [DOI] [PubMed] [Google Scholar]
- 8. Singh GK, Miller BA, Hankey BF, Edwards BK. Persistent area socioeconomic disparities in U.S. incidence of cervical cancer, mortality, stage, and survival, 1975–2000. Cancer. 2004;101(5):1051‐1057. [DOI] [PubMed] [Google Scholar]
- 9. Agency for Healthcare Research and Quality . National Healthcare Disparities Report 2012. AHRQ Publication No. 13‐0003. Rockville, MD: AHRQ; May 2013. https://archive.ahrq.gov/research/findings/nhqrdr/nhdr12/2012nhdr.pdf. Accessed September 6, 2013. [Google Scholar]
- 10. Kitagawa EM, Hauser PM. Differential Mortality in the United States: A Study in Socioeconomic Epidemiology. Cambridge, MA: Harvard University Press; 1973. [Google Scholar]
- 11. Dayal HH, Power RN, Chiu C. Race and socioeconomic status in survival from breast cancer. J Chronic Dis. 1982;35(8):675‐683. [DOI] [PubMed] [Google Scholar]
- 12. Braveman PA, Cubbin C, Egerter S, Williams DR, Pamuk E. Socioeconomic disparities in health in the United States: what the patterns tell us. Am J Public Health. 2010;100(Suppl 1):S186‐196. [DOI] [PMC free article] [PubMed] [Google Scholar]
- 13. Herndon JE, Kornblith AB, Holland JC, Paskett ED. Effect of socioeconomic status as measured by education level on survival in breast cancer clinical trials. Psycho‐Oncology. 2013;22(2):315‐323. [DOI] [PMC free article] [PubMed] [Google Scholar]
- 14. Marmot MG, Shipley MJ, Rose G. Inequalities in death—specific explanations of a general pattern? Lancet. 1984;1(8384):1003‐1006. [DOI] [PubMed] [Google Scholar]
- 15. Boyd C, Zhang‐Salomons JY, Groome PA, Mackillop WJ. Associations between community income and cancer survival in Ontario, Canada, and the United States. J Clin Oncol. 1999;17(7):2244‐2255. [DOI] [PubMed] [Google Scholar]
- 16. Singh GK, Miller BA, Hankey BF, Edwards BK. Area socioeconomic variations in U.S. cancer incidence, mortality, stage, treatment, and survival, 1975–1999 NCI Cancer Surveillance Monograph Series, Number 4. Bethesda, MD: National Cancer Institute; 2003. [Google Scholar]
- 17. Ward E, Halpern M, Schrag N, et al. Association of insurance with cancer care utilization and outcomes. CA Cancer J Clin. 2008;58(1):9‐31. [DOI] [PubMed] [Google Scholar]
- 18. McDavid K, Tucker TC, Sloggett A, Coleman MP. Cancer survival in Kentucky and health insurance coverage. Arch Intern Med. 2003;163(18):2135‐2144. [DOI] [PubMed] [Google Scholar]
- 19. Roetzheim RG, Pal N, Gonzalez EC, Ferrante JM, Van Durme DJ, Krischer JP. Effects of health insurance and race on colorectal cancer treatments and outcomes. Am J Public Health. 2000;90(11):1746‐1754. [DOI] [PMC free article] [PubMed] [Google Scholar]
- 20. Ayanian JZ, Kohler BA, Abe T, Epstein AM. The relation between health insurance coverage and clinical outcomes among women with breast cancer. N Engl J Med. 1993;329(5):326‐331. [DOI] [PubMed] [Google Scholar]
- 21. Smith JK, Ng SC, Zhou Z, et al. Does increasing insurance improve outcomes for US cancer patients? J Surg Res. 2013;185(1):15‐20. [DOI] [PubMed] [Google Scholar]
- 22. Roetzheim RG, Gonzalez EC, Ferrante JM, Pal N, Van Durme DJ, Krischer JP. Effects of health insurance and race on breast carcinoma treatments and outcomes. Cancer. 2000;89(11):2202‐2213. [DOI] [PubMed] [Google Scholar]
- 23. Sabatino SA, Coates RJ, Uhler RJ, Breen N, Tangka F, Shaw KM. Disparities in mammography use among US women aged 40–64 years, by race, ethnicity, income, and health insurance status, 1993 and 2005. Med Care. 2008;46(7):692‐700. [DOI] [PubMed] [Google Scholar]
- 24. Morris AM, Rhoads KF, Stain SC, Birkmeyer JD. Understanding racial disparities in cancer treatment and outcomes. J Am Coll Surg. 2010;211(1):105‐113. [DOI] [PubMed] [Google Scholar]
- 25. Daniel SR, Armstrong K, Silber JH, Rosenbaum PR. An algorithm for optimal tapered matching, with application to disparities in survival. J Comput Graph Stat. 2008;17(4):914‐924. [DOI] [PMC free article] [PubMed] [Google Scholar]
- 26. Silber JH, Rosenbaum PR, Clark AS, et al. Characteristics associated with differences in survival among black and white women with breast cancer. JAMA. 2013;310(4):389‐397. [DOI] [PubMed] [Google Scholar]
- 27. Silber JH, Rosenbaum PR, Ross RN, et al. Racial disparities in colon cancer survival: a matched cohort study. Ann Intern Med. 2014;161(12):845‐854. [DOI] [PubMed] [Google Scholar]
- 28. Silber JH, Rosenbaum PR, Kelz RR, et al. Examining causes of racial disparities in general surgical mortality: hospital quality versus patient risk. Med Care. 2015;53(7):619‐629. [DOI] [PMC free article] [PubMed] [Google Scholar]
- 29. Rosenbaum PR, Silber JH. Using the exterior match to compare two entwined matched control groups. Am Stat. 2013;67(2):67‐75. [Google Scholar]
- 30. Braveman P. Health disparities and health equity: concepts and measurement. Annu Rev Public Health. 2006;27:167‐194. [DOI] [PubMed] [Google Scholar]
- 31. Braveman P. What are health disparities and health equity? We need to be clear. Public Health Rep. 2014;129(Suppl 2):5‐8. [DOI] [PMC free article] [PubMed] [Google Scholar]
- 32. SEER‐Medicare linked database . National Cancer Institute Division of Cancer Control & Population Sciences website. https://healthcaredelivery.cancer.gov/seermedicare/. Last updated January 18, 2018. Accessed April 14, 2018.
- 33. Klabunde CN, Legler JM, Warren JL, Baldwin LM, Schrag D. A refined comorbidity measurement algorithm for claims‐based studies of breast, prostate, colorectal, and lung cancer patients. Ann Epidemiol. 2007;17(8):584‐590. [DOI] [PubMed] [Google Scholar]
- 34. Rosenbaum PR. Design of Observational Studies. New York, NY: Springer; 2010. [Google Scholar]
- 35. Rosenbaum PR. Matching techniques In Observation and Experiment: An Introduction to Causal Inference. Cambridge, MA: Harvard University Press; 2017:212‐233. [Google Scholar]
- 36. Rubin DB. The design versus the analysis of observational studies for causal effects: parallels with the design of randomized trials. Stat Med. 2007;26(1):20‐36. [DOI] [PubMed] [Google Scholar]
- 37. Zubizarreta JR. Using mixed integer programming for matching in an observational study of kidney failure after surgery. J Am Stat Assoc. 2012;107(500):1360‐1371. [Google Scholar]
- 38. R Development Core Team . R: A Language and Environment for Statistical Computing . 2018. http://www.R-project.org. Accessed April 20, 2018.
- 39. Hansen BB. Full matching in an observational study of coaching for the SAT. J Am Stat Assoc. 2004;99(467):609‐618. [Google Scholar]
- 40. Hansen BB, Frederickson M, Buckner J, Errickson J, Solenberger P. Package ‘optmatch’: functions for optimal matching. Version 0.9‐10. https://cran.r-project.org/web/packages/optmatch/optmatch.pdf. Published January 17, 2018. Accessed March 21, 2018.
- 41. Rosenbaum PR, Rubin DB. Constructing a control group using multivariate matched sampling methods that incorporate the propensity score. Am Stat. 1985;39(1):33‐38. [Google Scholar]
- 42. Cochran WG, Rubin DB. Controlling bias in observational studies: a review. Sankhya, Series A. 1973;35(4):417‐446. [Google Scholar]
- 43. Silber JH, Rosenbaum PR, Trudeau ME, et al. Multivariate matching and bias reduction in the surgical outcomes study. Med Care. 2001;39(10):1048‐1064. [DOI] [PubMed] [Google Scholar]
- 44. Rosenbaum PR. Various practical issues in matching: checking covariate balance In Design of Observational Studies. New York, NY: Springer; 2010:187‐190. [Google Scholar]
- 45. O'Brien PC, Fleming TR. A paired Prentice‐Wilcoxon test for censored paired data. Biometrics. 1987;43(1):169‐180. [Google Scholar]
- 46. Holt JD, Prentice RL. Survival analysis in twin studies and matched pair experiments. Biometrika. 1974;61(1):17‐30. [Google Scholar]
- 47. Hollander M, Wolfe DA. Nonparametric Statistical Methods. 2nd ed. New York, NY: John Wiley & Sons; 1999. [Google Scholar]
- 48. Bishop YMM, Fienberg SE, Holland PW. Analysis of square tables: symmetry and marginal homogeneity In Discrete Multivariate Analysis: Theory and Practice. Cambridge, MA: The MIT Press; 1975:281‐286. [Google Scholar]
- 49. Efron B, Tibshirani R. Bootstrap methods for standard errors, confidence intervals, and other measures of statistical accuracy. Stat Sci. 1986;1(1):54‐75. [Google Scholar]
- 50. Rosenbaum PR. Package ‘exteriorMatch’: constructs the exterior match from two matched control groups. Version 1.0.0. https://cran.r-project.org/web/packages/exteriorMatch/exteriorMatch.pdf. Published November 10, 2016. Accessed April 30, 2018.
- 51. Bach PB, Pham HH, Schrag D, Tate RC, Hargraves JL. Primary care physicians who treat blacks and whites. N Engl J Med. 2004;351(6):575‐584. [DOI] [PubMed] [Google Scholar]
- 52. Pham HH, Schrag D, O'Malley AS, Wu B, Bach PB. Care patterns in Medicare and their implications for pay for performance. N Engl J Med. 2007;356(11):1130‐1139. [DOI] [PubMed] [Google Scholar]
- 53. SAS Institute Inc . Version 9.3 of the Statistical Analytic Software System for UNIX. Cary, NC: 2014. [Google Scholar]
- 54. American Cancer Society . Breast Cancer Facts & Figures, 2015–2016. Atlanta, GA: American Cancer Society; 2015. https://www.cancer.org/content/dam/cancer-org/research/cancer-facts-and-statistics/breast-cancer-facts-and-figures/breast-cancer-facts-and-figures-2015-2016.pdf. Accessed March 22, 2018. [Google Scholar]
- 55. Howlader N, Altekruse SF, Li CI, et al. US incidence of breast cancer subtypes defined by joint hormone receptor and HER2 status. J Natl Cancer Inst. 2014;106(5):dju055. [DOI] [PMC free article] [PubMed] [Google Scholar]
- 56. Bauer KR, Brown M, Cress RD, Parise CA, Caggiano V. Descriptive analysis of estrogen receptor (ER)‐negative, progesterone receptor (PR)‐negative, and HER2‐negative invasive breast cancer, the so‐called triple‐negative phenotype: a population‐based study from the California cancer registry. Cancer. 2007;109(9):1721‐1728. [DOI] [PubMed] [Google Scholar]
- 57. Akinyemiju TF, Pisu M, Waterbor JW, Altekruse SF. Socioeconomic status and incidence of breast cancer by hormone receptor subtype. Springerplus. 2015;4(508):1‐8. [DOI] [PMC free article] [PubMed] [Google Scholar]
- 58. Wang X, Du XL. Socio‐demographic and geographic variations in the utilization of hormone therapy in older women with breast cancer after Medicare Part‐D coverage. Med Oncol. 2015;32(5):154. [DOI] [PubMed] [Google Scholar]
- 59. Braveman PA, Cubbin C, Egerter S, et al. Socioeconomic status in health research: one size does not fit all. JAMA. 2005;294(22):2879‐2888. [DOI] [PubMed] [Google Scholar]
- 60. Cross CK, Harris J, Recht A. Race, socioeconomic status, and breast carcinoma in the U.S.: what have we learned from clinical studies? Cancer. 2002;95(9):1988‐1999. [DOI] [PubMed] [Google Scholar]
- 61. Shariff‐Marco S, Yang J, John EM, et al. Impact of neighborhood and individual socioeconomic status on survival after breast cancer varies by race/ethnicity: the Neighborhood and Breast Cancer Study. Cancer Epidemiol Biomarkers Prev. 2014;23(5):793‐811. [DOI] [PMC free article] [PubMed] [Google Scholar]
- 62. Chetty R, Stepner M, Abraham S, et al. The association between income and life expectancy in the United States, 2001–2014. JAMA. 2016;315(16):1750‐1766. [DOI] [PMC free article] [PubMed] [Google Scholar]
- 63. Cutler D, Deaton A, Lleras‐Muney A. The determinants of mortality. J Econ Perspect. 2006;20(3):97‐120. [Google Scholar]
- 64. Marmot M. Social determinants of health inequalities. Lancet. 2005;365(9464):1099‐1104. [DOI] [PubMed] [Google Scholar]
- 65. Sommers BD, McMurtry CL, Blendon RJ, Benson JM, Sayde JM. Beyond health insurance: remaining disparities in US health care in the post‐ACA era. Milbank Q. 2017;95(1):43‐69. [DOI] [PMC free article] [PubMed] [Google Scholar]
Associated Data
This section collects any data citations, data availability statements, or supplementary materials included in this article.
Supplementary Materials
Appendix I. Table 1: Patient Selection Summary
Appendix II. Table 2: Detailed Patient Characteristics
Appendix III. Table 3: Definitions of Breast Cancer Surgery Codes
Appendix IV. Table 4: Definitions of Breast Cancer Radiation Codes
Appendix V. Table 5: Definitions of Breast Cancer Chemotherapy Codes
Appendix VI: The Matching Methodology
Appendix VII: Codes for Analyses of Preventive Care
Appendix VIII. Table 6: Complete Matching Results: LSES Non‐Hispanic Whites vs NLSES Non‐Hispanic Whites
Appendix IX. Table 7: Complete Matching Results: LSES Blacks vs NLSES Non‐Hispanic Whites
Appendix X. Table 8: Complete Matching Results: LSES Hispanic Whites vs NLSES Non‐Hispanic Whites
Appendix XI. Table 9: Differences in Treatment Between Pairs Matched for Presentation and Demographics
Appendix XII. Table 10: 2010 Triple‐Negative Breast Cancer (TNBC) Diagnosis Rates Across SES Levels, Stratified by Race/Ethnicity
Appendix XIII. Table 11: Exterior Match Prentice‐Wilcoxon Tests
Appendix XIV. Tables 12 and 13: LSES vs NLSES Full Matching Tables for Black and Hispanic Patients
Appendix XV. Tables 14 and 15: Full Matching Cox Model Results for LSES vs NLSES Black and Hispanic Patients
Appendix XVI. Table 16: Paired Cox Models for LSES vs NLSES Non‐Hispanic White Matched Sets, Including Adjustments for ER and PR Status