Abstract
The most typical expression of cystic fibrosis (CF)–related liver disease is a cholangiopathy that can progress to cirrhosis. We aimed to determine the potential impact of environmental and genetic factors on the development of CF‐related cholangiopathy in mice. Cystic fibrosis transmembrane conductance regulator (Cftr)−/− mice and Cftr +/+ littermates in a congenic C57BL/6J background were fed a high medium‐chain triglyceride (MCT) diet. Liver histopathology, fecal microbiota, intestinal inflammation and barrier function, bile acid homeostasis, and liver transcriptome were analyzed in 3‐month‐old males. Subsequently, MCT diet was changed for chow with polyethylene glycol (PEG) and the genetic background for a mixed C57BL/6J;129/Ola background (resulting from three backcrosses), to test their effect on phenotype. C57BL/6J Cftr −/− mice on an MCT diet developed cholangiopathy features that were associated with dysbiosis, primarily Escherichia coli enrichment, and low‐grade intestinal inflammation. Compared with Cftr +/+ littermates, they displayed increased intestinal permeability and a lack of secondary bile acids together with a low expression of ileal bile acid transporters. Dietary‐induced (chow with PEG) changes in gut microbiota composition largely prevented the development of cholangiopathy in Cftr −/− mice. Regardless of Cftr status, mice in a mixed C57BL/6J;129/Ola background developed fatty liver under an MCT diet. The Cftr −/− mice in the mixed background showed no cholangiopathy, which was not explained by a difference in gut microbiota or intestinal permeability, compared with congenic mice. Transcriptomic analysis of the liver revealed differential expression, notably of immune‐related genes, in mice of the congenic versus mixed background. In conclusion, our findings suggest that CFTR deficiency causes abnormal intestinal permeability, which, combined with diet‐induced dysbiosis and immune‐related genetic susceptibility, promotes CF‐related cholangiopathy.
Abbreviations
- CF
cystic fibrosis
- CFTR
cystic fibrosis transmembrane conductance regulator
- CK19
cytokeratin 19
- C. leptum
Clostridium leptum
- E. coli
Escherichia coli
- ELISA
enzyme‐linked immunosorbent assay
- FC
fold change
- FDR
false discovery rate
- FITC
fluorescein isothiocyanate
- MCT
medium‐chain triglyceride
- NF‐κB
nuclear factor kappa B
- PCR
polymerase chain reaction
- PEG
polyethylene glycol
- qPCR
quantitative polymerase chain reaction
Cystic fibrosis (CF) is a disease caused by genetic defects in cystic fibrosis transmembrane conductance regulator (CFTR), a chloride channel driving ion and fluid secretion in various epithelia, including the lungs, intestine, pancreas, and bile ducts. Liver disease is increasingly frequent and severe in patients with CF, which has been attributed, at least partly, to an increase in median survival.1, 2 Yet, the phenotypic expression and severity of CF liver disease is extremely variable, ranging from simple steatosis to cirrhosis.3, 4 A cholangiopathy in patients with CF, referred to as focal biliary cirrhosis, has been described as collagen deposition around irregular, proliferating bile ducts.5 It is considered the most typical and relevant hepatic lesion that, in some patients, progresses to multilobular cirrhosis and/or portal hypertension. Of unknown pathogenesis, CF‐related cholangiopathy has been classically attributed to defective chloride secretion in bile duct epithelial cells (i.e., cholangiocytes), the only CFTR‐expressing cell type in the liver.4 It has been speculated that this would cause a defect in fluid and bicarbonate secretion in bile ducts and a change in the composition of bile which, consequently, would become inspissated and cytotoxic for cholangiocytes.4 However, defective chloride secretion in cholangiocytes has been dismissed as the only explanation, notably because these cells possess alternative calcium‐dependent chloride channels.6, 7 The marked heterogeneity of CF liver disease has suggested that additional mechanisms were involved. Meconium ileus at birth has been identified as an independent risk factor for liver disease in several cohorts,2, 8, 9 indicating a potential role of the gut–liver axis. There is also evidence to indicate that the clinical expression of CF‐related liver disease is influenced by the genetic background,10 even though so far, a strong association has been demonstrated only between the Z‐allele of the 1‐antiprotease (SerpinA1) gene and severe CF liver disease.11
A number of CF mouse models have been generated—in particular, knockout models—in which the endogenous Cftr gene has been disrupted by homologous recombination in embryonic stem cells. Most of the Cftr−/− mice show severe intestinal obstruction, similar to the meconium ileus observed in infants with CF, but little or no pathological change in the other organs that are affected in human CF. The Cftr −/− mice usually die of intestinal obstruction soon after weaning unless they are maintained on a liquid diet with a high medium‐chain triglyceride (MCT) content or on polyethylene glycol (PEG), an osmotic laxative.12 Thus far, multiorgan pathology, including lung, liver, and pancreatic diseases characteristic of CF, has been reported only once in a CF mouse model (i.e., congenic C57BL/6J Cftr−/−mice fed an MCT diet).13 Bile duct proliferation was apparent by 3 to 5 months of age in these mice, and by 12 months, many had focal biliary cirrhosis.13 In contrast, in Cftr‐/‐ mice in a mixed C57BL/6J;129/Ola background, we found no bile duct abnormality.12, 14 Here, using Cftr‐/‐ mouse models with different diets and genetic backgrounds, we aimed to evaluate the effect of dietary and genetic factors on the development of CF‐related cholangiopathy.
Materials and Methods
Animal Experiments
All experiments were approved by the Institutional Animal Care and Use Department (DSV, Paris, Agreement No. 75‐12‐01). B6‐129P2‐Cftr tm1Unc (Cftr −/−) mice harboring homozygous S489X Cftr mutation15 and their wild‐type (Cftr +/+) littermates were bred to maintain the C57BL/6J congenic background using heterozygous breeding pairs provided by Peter Durie.13 The same S489X Cftr mutation was maintained in a mixed C57BL/6J;129/Ola genetic background, as a result of three backcrosses of 129/Ola‐Cftr tm1Unc mice with C57BL/6J mice, performed at CDTA‐TAAM (Orléans, France).12, 14 At weaning (21‐25 days of age), mice were fed an MCT liquid diet (Peptamen, Nestlé Health Science, France)12 or a standard solid chow (AO3, Safe, Augy, France), in which case PEG (Macrogol 4000, Beaufour‐Ipsen, Dreux, France) was continuously supplied at a concentration of 4.5% in the drinking water.14 Additional C57BL/6J wild‐type mice were fed Peptamen or AO3 chow (with or without PEG supply), up until the age of 3 months, for the study of fecal microbiota. The composition of Peptamen and AO3 chow is provided in Supporting Table S1. Mice were maintained on corncob pellet bedding in specific pathogen‐free conditions, following the 2014 Federation for Laboratory Animal Science Associations guidelines, in individually ventilated cages. Only males were investigated at the age of 3 months. Feces were collected in sterile Petri dishes and stored at −80°C. Laparotomy was performed in animals in the nonfasted state, except for intestinal permeability assay, under isoflurane anesthesia. Gallbladder bile was collected by aspiration, and bile volumes were determined gravimetrically as described.14 The liver and small intestine were ablated for analyses.
Bile Acids
Total and individual bile acid concentrations in bile were measured using high‐performance liquid chromatography coupled with tandem mass spectrometry, as described.14
Fecal Microbiota
DNA was extracted from 200 mg of feces and subjected to quantitative polymerase chain reaction (qPCR) analysis of dominant bacterial taxa, as described16 (see Appendix for details).
(Immuno)histology, Reverse‐Transcription qPCR, Intestinal Permeability, Fecal Lipocalin 2, and RNA Sequencing
See Appendix.
Statistical Analysis
Comparisons were performed using a Mann‐Whitney nonparametric U test and GraphPad Prism Software (La Jolla, CA). Normalization and differential analysis of RNA sequencing data were performed with the DESeq2 package. Enrichment pathway analysis was performed with the Enrichr package. Analyses and graphical outputs were performed in R version 3.3.2. A P value of less than 0.05 was considered significant.
Results
Mouse Model of CF‐Related Cholangiopathy
First, we investigated male Cftr −/− mice and their Cftr +/+ littermates in the congenic C57BL/6J background. At weaning, all mice were fed a liquid diet with a high MCT content. At the age of 3 months, Cftr −/− mice weighed less than their Cftr +/+ littermates, in keeping with the growth failure caused by CFTR deficiency (Fig. 1A, left panel). In addition, consistent with the occurrence of liver damage, liver‐to‐body weight ratio was increased in Cftr −/− mice compared with their Cftr +/+ counterparts (Fig. 1A, right panel). Standard histology showed the presence of mild portal fibro‐inflammatory lesions in the liver of Cftr−/− mice (Fig. 1B). The expansion of ductular reactive cells characteristic of bile duct damage was evident in Cftr‐/‐ mice, as shown by cytokeratin 19 (CK19) immunostaining (Fig. 1C, left panel). Quantitative analyses confirmed that CK19‐immunostained area was significantly increased in Cftr−/− compared with Cftr +/+ mice (Fig. 1C, right panel). Liver fibrosis assessed by sirius red staining was also detected in the knockout mice (Fig. 1D, left panel). In these animals, fibrosis was restricted to the portal and periportal area, ranging from F0 to F2, according to the staging used in the most common scoring systems.17 (Fig. 1D, right panel) Combined, these features were typical of CF‐related cholangiopathy at an early stage. The age of mice at the time of analysis (i.e., 3 months) was indeed shown to be an early time point in the development of cholangiopathy in this model.13
Figure 1.
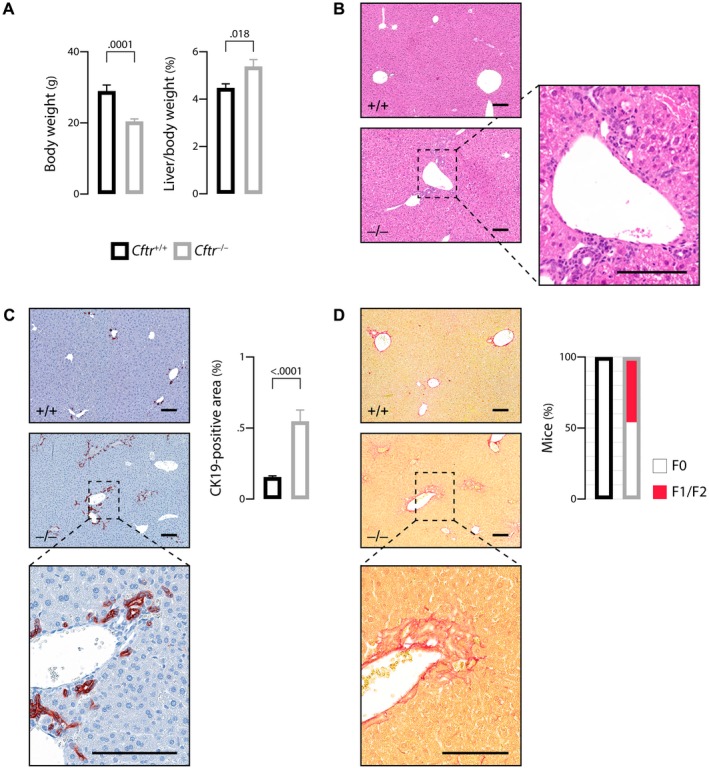
Mouse model of CF‐related cholangiopathy. C57BL/6J Cftr‐/‐ mice and Cftr+/+ littermates on an MCT diet were subjected to the following phenotypic analyses at the age of 3 months: body weight (A, left panel) and liver‐to‐body weight ratio (A, right panel); hematoxylin and eosin staining of liver tissue sections (B, a portal fibro‐inflammatory infiltrate is shown in inset); CK19 immunostaining of liver tissue sections (C, left panel) and morphometric analysis of CK19‐immunostained areas (C, right panel); sirius red staining of liver tissue sections (D, left panel) and count of mice according to the staging of fibrosis17 (F0: none; F1: portal fibrosis; F2: periportal fibrosis without bridging) (D, right panel). Scale bar: 100 µm; means ± SEM of at least 7 animals.
Gut–Liver Axis in the Mouse Model of CF‐Related Cholangiopathy
Previous studies highlighted a possible role of the gut–liver axis in the pathogenesis of CF‐related cholangiopathy.18 Therefore, we analyzed the fecal microbiota of Cftr −/− mice with CF‐related cholangiopathy and Cftr +/+ littermates by means of qPCR targeting bacteria 16S ribosomal RNA gene. Total bacterial counts were not significantly different between the two groups (Fig. 2A, left panel). However, differences were observed in the relative abundance of species, the most significant being a higher proportion of Escherichia coli (E. coli) in Cftr −/− versus Cftr +/+ mice (Fig. 2A, right panel).
Figure 2.
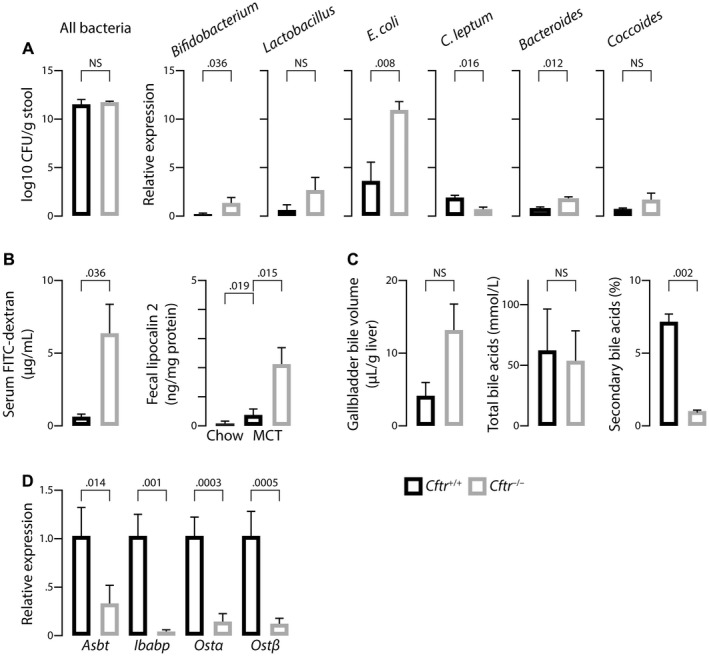
Gut–liver axis in the mouse model of CF‐related cholangiopathy. C57BL/6J Cftr‐/‐ mice and Cftr+/+ littermates on an MCT diet were subjected to the following analyses at the age of 3 months: quantification of fecal bacteria by qPCR targeting bacteria 16S ribosomal RNA (A); dosage of FITC–dextran in portal blood, following gavage (B, left panel) and enzyme‐linked immunosorbent assay (ELISA) of fecal lipocalin 2 (B, right panel); measurement of gallbladder bile volume after overnight feeding (C, left panel), total bile acid concentrations (C, middle panel), and proportion of secondary bile acids (deoxycholic acid, hyodeoxycholic acid, lithocholic acid, and their conjugates) (C, right panel) in gallbladder bile; and reverse‐transcription qPCR analyses of bile acid transporters in the terminal ileum (D). Means ± SEM of at least 4 animals.
Furthermore, consistent with previous reports,19 Cftr −/− mice exhibited increased intestinal permeability as assessed by a 6‐fold increase in portal blood fluorescein isothiocyanate (FITC)–dextran following gavage, compared with Cftr +/+ littermates (Fig. 2B, left panel). Fecal lipocalin 2, a sensitive biomarker of intestinal inflammation in mice,20 was slightly increased in Cftr +/+ mice under MCT diet compared with those under standard chow diet and, to an even greater extent, in Cftr −/− mice under MCT diet (Fig. 2B, right panel). This latter result suggested that MCT diet promoted low‐grade intestinal inflammation, which was even further aggravated by CFTR deficiency, in C57BL/6J mice.
The gut–liver axis is critical for bile acid homeostasis. We showed that gallbladder emptying was deficient in other CF mouse models, causing a disruption in the enterohepatic circulation of bile acids and a cholecystohepatic shunt, which ultimately decreased the formation of secondary, toxic bile acids.14 Therefore, we hypothesized that such a mechanism could be protective and explain the absence of liver tissue alteration in these models. In the present model, MCT diet fostered gallbladder emptying, and no significant difference in postprandial gallbladder volumes was observed between Cftr +/+ and Cftr −/− mice (Fig. 2C, left panel). Nevertheless, the proportion of secondary bile acids in bile remained much lower in the latter (Fig. 2C, right panel). The expression of genes encoding ileal bile acid transporters (i.e., apical sodium–dependent bile salt transporter [Asbt], ileal bile acid–binding protein [Ibabp], and organic solute transporter α/β [Ost α/β]) were all profoundly down‐regulated in Cftr −/− mice compared with Cftr +/+ littermates (Fig. 2D). Therefore, the lack of secondary bile acids was attributable to ileal malabsorption and did not support the hypothesis of increased bile acid cytotoxicity against cholangiocytes in mice with CF‐related cholangiopathy.
Although the possibility of increased bile acid toxicity was ruled out, mice with CF‐related cholangiopathy displayed abnormal intestinal permeability and gut dysbiosis characterized by an overgrowth of E. coli, consistent with the translocation of proinflammatory bacterial products from the gut lumen into the portal circulation.
Effects of Dietary Intervention on the Gut and Liver Phenotype in CF Mice
We then asked whether the gut microbiota dysbiosis was involved in the development of cholangiopathy. To address this question, we performed a dietary intervention to modify the gut microbiota and assess its effect on liver disease. At weaning, C57BL/6J Cftr +/+ and Cftr −/− mice were transferred to a chow diet combined with PEG supply instead of MCT. PEG was required to prevent intestinal obstruction in Cftr −/− mice. At first, we determined the effect of the two diets (i.e., MCT and chow plus PEG versus standard chow) on the gut microbiota in C57BL/6J wild‐type mice. The major finding was that MCT diet, compared with either chow or chow plus PEG, provoked a significant enrichment in E. coli (Fig. 3A). Accordingly, the feeding of Cftr −/− mice with chow plus PEG instead of MCT diet caused a marked depletion in E. coli (Fig. 3B). This prevented intestinal inflammation, as shown by lower levels of fecal lipocalin 2 and less inflammatory infiltrates than in MCT‐fed animals (Fig. 3C). Cftr −/− mice under chow plus PEG displayed growth failure but no increase in liver‐to‐body weight ratio as opposed to those under MCT diet (Fig. 3D, left and middle panels). They also showed no evidence of liver tissue alterations on standard histology (Fig. 3D, right panel). CK19 immunostaining revealed a small increase in ductular structures, although to a much lesser extent than in MCT‐fed Cftr −/− mice (Fig. 3E). Furthermore, no significant fibrosis was detected by sirius red staining (Fig. 3F). These data demonstrated that, through gut microbiota modulation, dietary intervention, to a large extent, prevented intestinal inflammation and cholangiopathy features in Cftr −/− mice. Supporting Fig. S1 shows the comparison of MCT‐fed Cftr −/− mice with Cftr +/+ mice.
Figure 3.
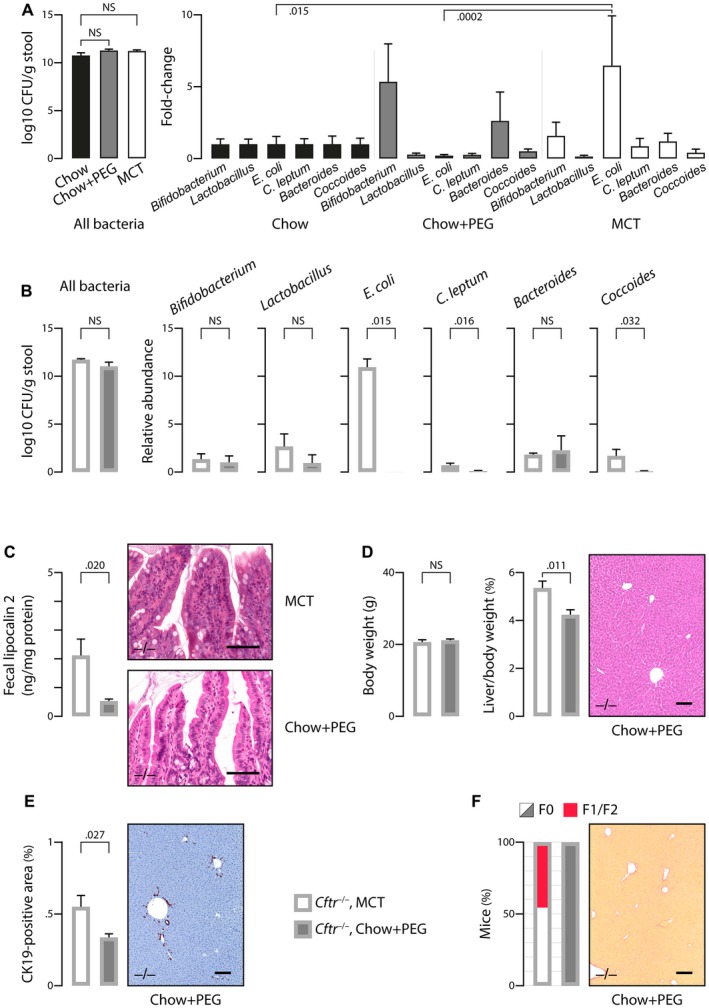
Diet‐induced changes in the gut microbiota and CF mouse phenotype. (A) The effect of diet was evaluated in C57BL/6J wild‐type mice that were fed a chow diet with or without PEG or a high MCT diet (n = 8/group) and were subjected to fecal microbiota analyses by qPCR targeting bacteria 16S ribosomal RNA at the age of 3 months. (B‐F) C57BL/6J Cftr‐/‐ mice that were fed an MCT diet as in Figs. 1 and 2, or a chow diet with PEG supply, were subjected to the following analyses at the age of 3 months: quantification of fecal bacteria by qPCR targeting bacteria 16S ribosomal RNA (B); ELISA of fecal lipocalin 2 (C, left panel) and hematoxylin and eosin staining of intestinal tissue sections (C, right panel, showing an inflammatory infiltrate in MCT‐fed mice as opposed to those under PEG); body weight and liver‐to‐body weight ratio (D, left and middle panels) and hematoxylin and eosin staining of liver tissue sections (D, right panel, showing normal histology in mice under PEG); CK19 immunostaining of liver tissue sections (E, right panel, showing minimal ductular reaction in mice under PEG) and morphometric analysis of CK19‐immunostained areas (E, left panel); sirius red staining of liver tissue sections (F, right panel, showing the absence of fibrosis in mice under PEG) and count of mice according to the staging of fibrosis17 (F0: none; F1: portal fibrosis; F2: periportal fibrosis without bridging) (F, left panel). Scale bar: 100 µm; means ± SEM of at least 4 animals.
Genetic Susceptibility to CF‐Related Cholangiopathy
To address the relative effect of genetic background and diet on CF‐related cholangiopathy, we used Cftr −/− mice in a mixed C57BL/6J;129/Ola genetic background. Cftr −/− mice and their Cftr +/+ littermates in the mixed background were randomly assigned at weaning to chow plus PEG or MCT diet. Regardless of diet, Cftr ‐/‐ in the mixed background displayed growth failure with normal liver‐to‐body weight ratio (Fig. 4A). Standard histology of the liver showed simple steatosis in MCT‐fed Cftr+/+ and Cftr ‐/‐ mice and no pathological change in those under chow plus PEG (Fig. 4B, left panel). Steatosis was assessed by the percentage of hepatocytes containing large or medium‐sized intracytoplasmic lipid droplets, using a validated scale of 0 to 3 (S0: <5%; S1: 5%‐33%; S2: 34%‐66%; S3: >66%).21 Steatosis of at least 5%, which is required to define fatty liver disease, was observed essentially in C57BL/6J;129/Ola mice under MCT diet. In these animals, the score of steatosis ranged from S0 to S3, with the same distribution among Cftr+/+ and Cftr−/− mice (Fig. 4B, right panel). These findings indicated that MCT diet caused steatosis in mice harboring 129/Ola haplotypes, through CFTR‐independent mechanisms. CK19 immunostaining and sirius red staining further indicated that Cftr−/− mice in the mixed genetic background did not develop ductular reaction (Fig. 4C) or liver fibrosis (Fig. 4D).
Figure 4.
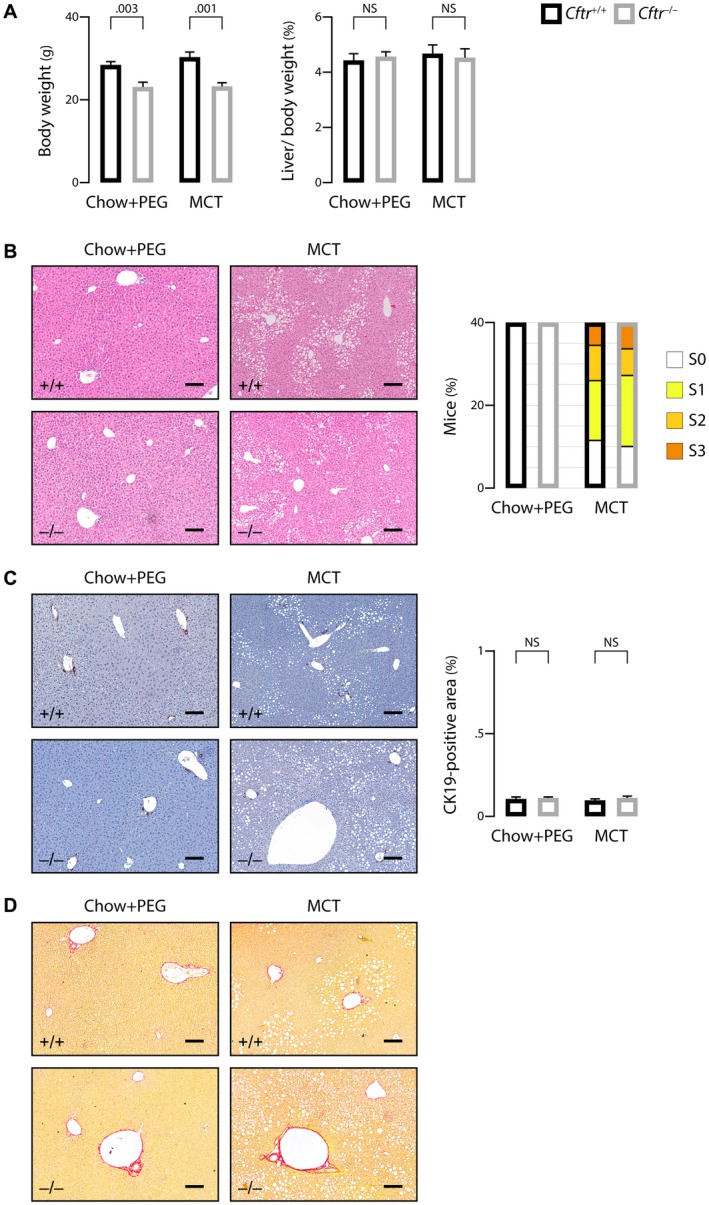
Effect of genetic background on liver phenotype in CF mice. C57BL/6J;129/Ola Cftr‐/‐ mice and Cftr+/+ littermates were randomly assigned at weaning to high MCT diet or chow diet with PEG supply and subjected to the following analyses at the age of 3 months: body weight (A, left panel) and liver‐to‐body weight ratio (A, right panel); hematoxylin and eosin staining of liver tissue sections (B, left panel) and count of animals in each group according to the score of steatosis (S0: <5%; S1: 5%‐33%; S2: 34%‐66%; S3: >66%) (B, right panel); CK19 immunostaining of liver tissue sections (C, left panel) and morphometric analysis of CK19‐immunostained areas (C, right panel); and sirius red staining (F0 according to the staging of fibrosis17 in all mice) (D). Scale bar: 100 µm; means ± SEM of at least 7 animals.
Next, we aimed to determine whether the absence of cholangiopathy features in C57BL/6J;129/Ola Cftr−/− mice could be explained by a potential effect of the genetic background on gut microbiota or intestinal barrier function. MCT‐fed Cftr−/− mice in the mixed background displayed a similar enrichment of the gut microbiota in E. coli as those in the congenic background (Fig. 5A). Regardless of diet, Cftr−/− mice in the mixed background also showed a similar increase in intestinal permeability as those in the congenic background (Fig. 5B). However, despite a similar enrichment of their microbiota in E. coli, MCT‐fed Cftr−/− mice in the mixed background, unlike those in the congenic background, developed no intestinal inflammation, as attested by low levels of fecal lipocalin 2 (Fig. 5C). Overall, these data indicated that the C57BL/6J genome conferred susceptibility to gut and liver inflammation in response to diet‐induced changes of the gut microbiota in CFTR‐deficient mice, whereas the 129/Ola sequences conferred susceptibility to diet‐induced fatty liver regardless of Cftr status.
Figure 5.
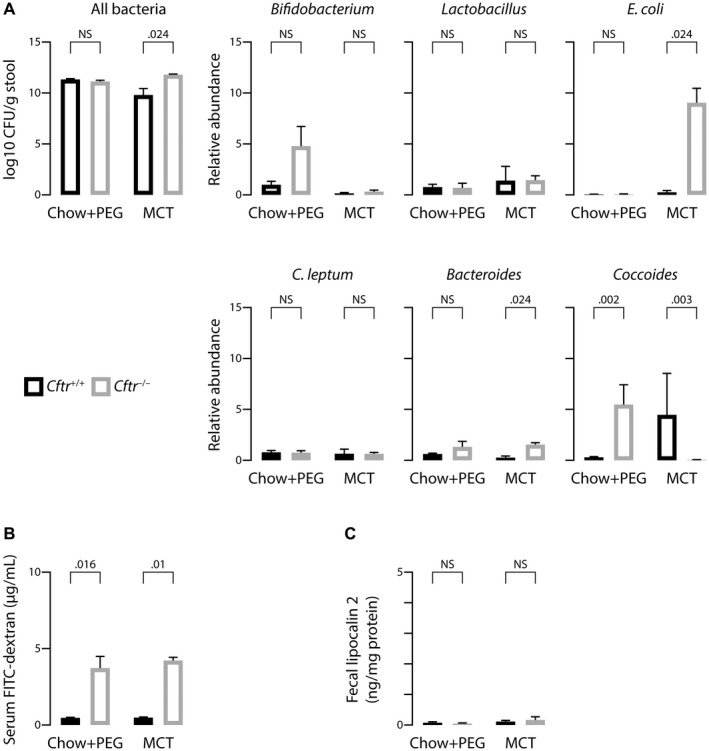
Effect of genetic background on features of the gut–liver axis in CF mice. C57BL/6J;129/Ola Cftr‐/‐ mice and Cftr+/+ littermates were randomly assigned at weaning to high MCT diet or chow diet with PEG supply and subjected to the following analyses at the age of 3 months: quantification of fecal bacteria by qPCR targeting bacteria 16S ribosomal RNA (A); dosage of FITC–dextran in portal blood following gavage (B); and ELISA of fecal lipocalin 2 (C). Means ± SEM of at least 4 animals.
Immune‐Related Pathways Underlying Genetic Susceptibility to CF‐Related Cholangiopathy
To gain insight into the mechanisms through which genetic background provides susceptibility to CF‐related cholangiopathy, we performed RNA sequencing analyses of the liver from MCT‐fed Cftr −/− mice in the congenic (susceptible) and mixed (nonsusceptible) background. At the time of analysis, mice were 3 months old, which is an early time point of CF‐related cholangiopathy in congenic mice.13 Bioinformatics procedures identified 415 genes with significant differential expression, among which 271 were overexpressed in the congenic mice, and 144 in mice with the mixed background (Fig. 6A and Supporting Table S2). The most discriminant of all genes was CD1d2, expressed only in the latter. CD1 are major histocompatibility complex class I–like antigen‐presenting molecules. They are encoded by two homologous genes in mice: CD1d1 and CD1d2. The two CD1d molecules present a different repertoire of self‐antigens, which affect the selection of invariant natural killer T cells, in lymphoid organs and in the liver.22 In C57BL/6J mice, the CD1d2 gene contains a frame‐shift mutation that abolishes its expression.23 As a result, no expression of CD1d2 was found in the liver of congenic mice, which contrasted with high levels of expression in the liver of all C57BL/6J;129/Ola mice. Other immune‐related genes were expressed at lower levels in the liver of congenic mice compared with those in the mixed background (Fig. 6B), such as hepcidin (Hamp), a peptide with bactericidal activity against E. coli 24; scavenger receptor A5 (Scara5) and toll‐like receptor 5 (Tlr5), which both participate in the clearance of bacteria25, 26; Mannan‐binding lectin‐associated serine protease‐1 (Masp‐1), a complement lectin pathway enzyme that enhances the antimicrobial immune response27; Chitinase 3‐Like 1 (Chil1), a protein increased in the circulation during E. coli endotoxemia,28 which promotes host resistance and tolerance to bacteria29; or tumor necrosis factor receptor superfamily, member 14 (Tnfrsf14), a susceptibility loci for primary sclerosing cholangitis,30 critical for the development of protective mucosal CD8 T‐cell memory.31 Sushi domain‐containing protein 4 (Susd4), a complement inhibitor that presumably limits beneficial complement activation (e.g., in pathogens removal) to the local site,32 was also underexpressed by more than 58‐fold in the liver of congenic mice. Overexpressed genes in the liver of congenic mice consisted of nucleotide‐binding leucine‐rich repeat and pyrindomain‐containing receptor 12 (Nlrp12), a negative regulator of nuclear factor kappa B (NF‐κB) signaling resulting in the enhancement of intracellular bacterial survival33; chemokines (Cxcl5, Cxcl9, Cx3cl1, Ccl5, Ccl2); chemokine receptors (Cxcr3, Cxcr4, C5ar2); caspases (Casp4, Casp12); and the NF‐κB family member Relb. These results suggested that the immune response to gut‐derived pathogens was inefficient and inflammation was exacerbated in the liver of C57BL/6J mice as compared with C57BL/6J;129/Ola mice. CD45 immunostaining provided further evidence for the chemoattraction of leukocytes to the liver, notably around bile ducts, in C57BL/6J Cftr −/− mice (Fig. 6C). Protein–protein interactions predicted by the analysis of genes overexpressed in the liver of these mice formed a large network (Fig. 7), providing links among (a) inflammation (lower left node), (b) fibrosis (upper left node), and (c) cell (presumably cholangiocyte) proliferation (right node).
Figure 6.
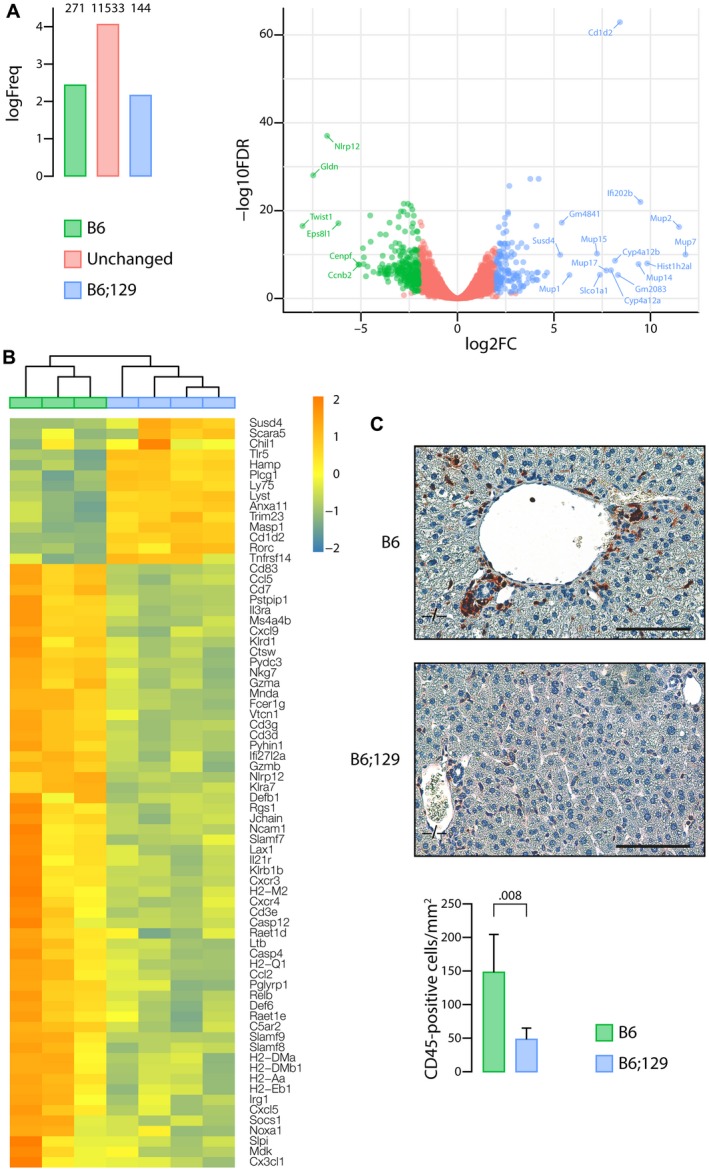
Immune‐related pathways underlying the genetic susceptibility to CF‐related cholangiopathy. Liver tissue samples from MCT‐fed Cftr −/− mice in the C57BL/6J (B6) (n = 3) or C57BL/6J;129/Ola (B6;129) (n = 4) background were subjected to RNA sequencing analyses. (A) Number of genes overexpressed in C57BL/6J (green) or in C57BL/6J;129/Ola (blue) or expressed at similar levels in both groups (red) (left panel) and volcano plot (right panel). The x axis represents the log2 of fold‐changes (log2[FC]), and the y axis represents the log10 of corrected P values (false discovery rate [FDR]) for differential gene expression analysis of the two groups (‐log10FDR). Significant overexpression of transcripts in one group versus the other was defined by a log of fold change (FC) >2 and a corrected P value <5.10‐2. (B) Heat map of differentially expressed genes with FDR <5%, related to immunity and inflammation. (C) CD45 immunostaining of liver tissue sections (upper and middle panels) and count of CD45‐positive cells (lower panel). Scale bar: 100 µm; means ± SEM of 5 animals.
Figure 7.
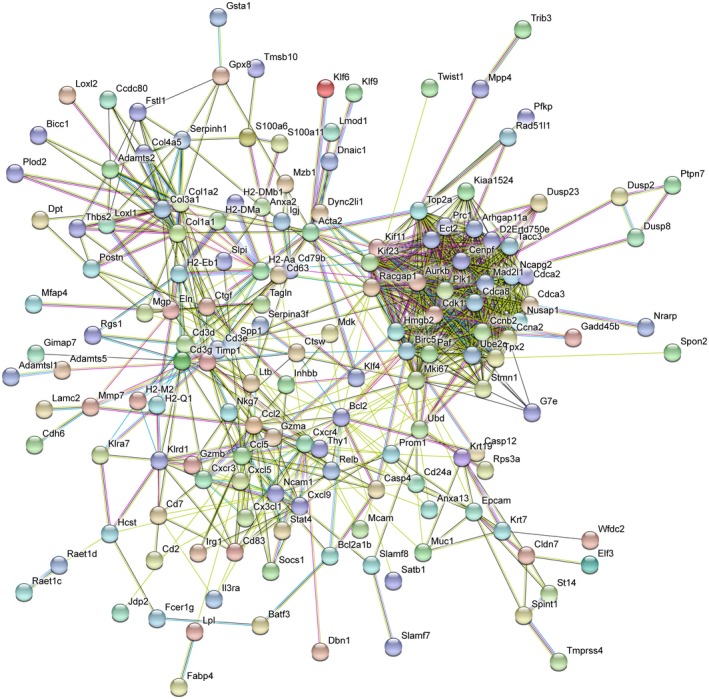
Protein–protein association networks underlying CF‐related cholangiopathy. The 10.5 version of the STRING database51 was used to search for protein–protein association networks among genes overexpressed in the liver of MCT‐fed Cftr −/− mice in the congenic C57BL/6J background (Fig. 6A). Proteins with only one or no association were removed.
Discussion
The reason why some patients with CF develop focal biliary cirrhosis, a cholangiopathy that can progress to severe liver disease, has been enigmatic so far. The present findings indicate that the pathogenesis of CF‐related cholangiopathy is multifactorial and influenced by the gut–liver axis. They reveal that, in the absence of CFTR, intestinal permeability is increased, which, in conjunction with diet‐induced dysbiosis and a genetic‐based ill‐adapted immune response, promotes bile duct damage (Fig. 8).
Figure 8.
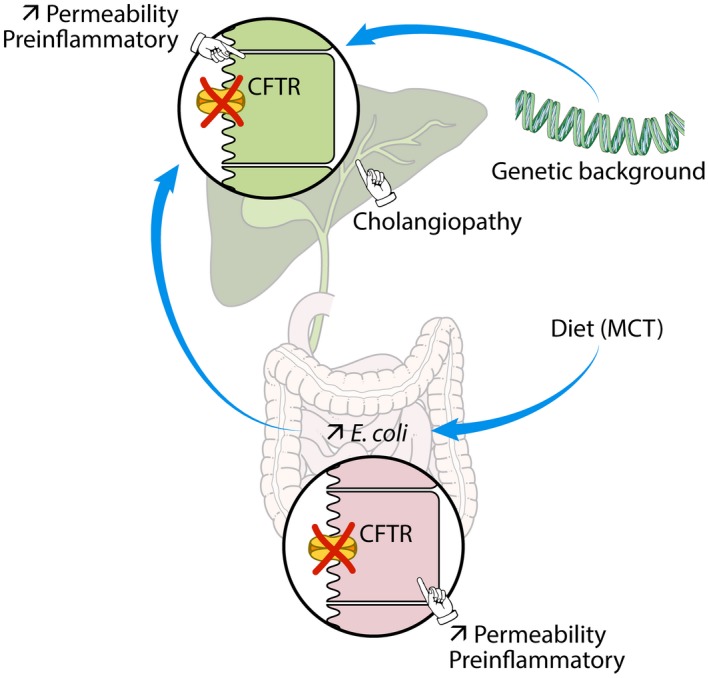
Mechanistic model of CF‐related cholangiopathy. The absence of apical CFTR triggers abnormal permeability and a pre‐inflammatory status both in cholangiocytes and enterocytes. The genetic background promotes an ill‐adapted response to gut‐derived pathobiont, which is aggravated by diet‐induced dysbiosis. The combined failure of CFTR‐deficient cholangiocytes and host immunity in this response leads to bile duct damage.
In addition to its channel function, CFTR was also recently shown to operate as a hub for cytoskeletal elements, transmembrane proteins, and signaling molecules.34 In cholangiocytes, CFTR promotes the assembly of a protein complex that maintains the tyrosine kinase Rous sarcoma oncogene cellular homolog (Src) in an inactive state.35 Thus, in the absence of CFTR at the apical membrane, this complex does not assemble, resulting in the self‐activation of Src and subsequent increase in TLR4 and NF‐B signaling in response to endotoxins.35 Nonetheless, CF mouse models in which these abnormalities were demonstrated did not develop bile duct damage or portal inflammation unless a second hit (i.e., dextran sodium sulfate–induced colitis) was applied.18, 36 The current findings are fully consistent with an aberrant response of CFTR‐deficient cholangiocytes to gut‐derived bacterial products.
The intestinal mucosal barrier is important to protect the organism from the large number of bacteria that inhabit the intestine. Impaired intestinal barrier function has been reported both in patients with CF and in CF mouse models.19, 37 We found that intestinal permeability was increased to a similar extent in all Cftr knockout mice investigated in the present study, regardless of their diet or genetic background. Likewise, it has been reported that intestinal permeability was abnormal in virtually all (i.e., 96%) CF subjects.37 Acting as a hub, CFTR also stabilizes the apical junction complex through actin‐dependent interactions in epithelial cells so that the loss of apical protein networks orchestrated by CFTR has emerged as a common mechanism of increased permeability in CF epithelia, including gut and bile ducts.35, 38, 39 A disruption of tight junctions that could explain increased permeability has thus been demonstrated in the small intestine of CF mice.39
Increased intestinal permeability is expected to allow the passage of bacterial components from the intestine through the portal vein to the liver. It is therefore of particular interest that, in the present study, cholangiopathy developed in Cftr knockout mice with microbiota enriched in E. coli. Such dysbiosis was observed at a very early stage of cholangiopathy, long before the onset of cirrhosis, which can affect the gut microbiome by itself.40 The change in gut microbiota was largely dietary‐induced, but also aggravated by the lack of CFTR. It was prevented by dietary intervention, and as a result, bile duct alterations were minimized. The central role of diet in modulating the gut microbiota is well established.41 Effects of dietary MCT on the intestinal ecosystem were described,42 but this is the first report on Peptamen, an MCT‐rich diet used in ill subjects, including those with CF. E. coli dysbiosis has also been described in young children with CF,43 who noticeably in this latter study were more often formula‐fed than the healthy controls, although the formula composition was not provided in this study. The role of dysbiosis in the development of cholangiopathy was evidenced by the effect of PEG, known to alter gut microbiota44; and of all taxa, E. coli was the most likely involved,45 although we cannot exclude the contribution of others.
Another abnormality in the gut of Cftr knockout mice was a marked decrease in the expression of bile acid transporters. Unlike dysbiosis or intestinal inflammation, but like increased permeability, this abnormality was independent of either diet or genetic background. Such a down‐regulation of bile acid transporters likely accounts for the increase in fecal bile acid excretion that most studies reported in patients with CF and in CF mouse models46, 47 as well as for the reduced formation of secondary bile acids that we reported in Cftr knockout mice under PEG.14 A defect in gallbladder emptying promotes a cholecystohepatic shunt of bile acids, which amplifies the lack of secondary bile acids in this latter model.14 We found that, compared with PEG, MCT diet alleviated gallbladder emptying defect, but the amount of secondary bile acids was still abnormally low in Cftr knockout mice. Consistent with a previous report,47 bile hydrophobicity was also abnormally low in Cftr knockout mice under MCT diet (not shown) and therefore could not account for the development of cholangiopathy.
The present work also demonstrates the effect of genetic factors on CF liver disease. Liver phenotype was different in MCT‐fed Cftr knockout mice, depending on whether their background was C57BL/6J congenic or mixed with 129/Ola. The comparison of common mouse strains showed that the 129/Ola strain was more susceptible than the C57BL/6J strain to store fat in the liver in response to a high‐fat diet.48 Accordingly, mice in the C57BL/6J;129/Ola background essentially developed fatty liver in the present study, indicating that, in conjunction with diet, the genetic background is instrumental in the development of liver steatosis, whereas CFTR deficit per se had no effect. This suggests that hepatic steatosis, even though frequent, is not a specific feature of CF.4
The genetic background was determinant in the pathogenesis of CF‐related cholangiopathy, which, unlike steatosis, occurred only in the C57BL/6J congenic mice. Combinatorial effects of diet and genetics occur in the setting of inflammatory bowel diseases.49 Here, we showed that genetic susceptibility significantly influenced the effect of diet‐induced dysbiosis on both intestinal and bile duct inflammation. In the C57BL/6J background, the effect of the MCT diet on dysbiosis surpassed a potential anti‐inflammatory effect of MCT that was reported in the intestine.49 To gain insight into how genetics cooperated with diet to promote CF cholangiopathy, we compared the transcriptomic profile of the liver from MCT‐fed Cftr knockout mice in the C57BL/6J and C57BL/6J;129/Ola background. We identified several genes that were overexpressed in the liver of C57BL/6J mice and conveyed the hyperinflammatory state observed in this background. We also identified genes related to innate and adaptive immunity, which were underexpressed in the liver of C57BL/6J mice. The effect of mouse genomic variation on gene regulation among different strains was reported,50 from which we inferred that allele‐specific expression bias contributed to different expressions in the liver, notably to the underexpression of immune‐related genes, unlikely to be a consequence of tissue damage. Of unquestionable genetic origin was the absence of CD1d2 expression in C57BL/6J mice,23 although probably more than one gene conferred the C57BL/6J strain its susceptibility to CF cholangiopathy.
We conclude from previous and present work that CF‐related cholangiopathy results from a combined failure of CFTR‐deficient cholangiocytes and host immunity in responding to gut‐derived pathobiont. Diet acting on gut microbiota further potentiates these disorders. Importantly, diet is a controllable factor in the pathogenesis of CF liver disease. This opens new therapeutic perspectives through dietary manipulation in a disease for which no treatment has proven effective so far.2, 4
Potential conflict of interest
Dr. Sokol is a cofounder of Nextbiotix. He consults for Enterome, Maat, Takeda, AbbVie, MSD, Astellas, Tillotts, and Amgen.
Supporting Methods
(Immuno)histology
Paraffin‐embedded formalin‐fixed 4‐μm‐thick liver tissue sections were subjected to hematoxylin and eosin staining, sirius red staining, or immunostaining. For immunostaining, tissue sections were incubated in sodium citrate 10 mmol/L, pH 6, for 20 minutes at 95°C, to unmask epitopes. Incubations with primary antibodies were performed using anti‐CK19 rat monoclonal antibody (TROMA III; Developmental Studies Hybridoma Bank, University of Iowa, Iowa City, IA; ready‐to‐use, overnight at 4°C) or anti‐CD45 rat monoclonal antibody (30‐F11; Invitrogen by Thermo Fisher Scientific, San Diego, CA; dilution 1/30, overnight at 4°C). Incubations were then performed using horseradish peroxidase–conjugated antibodies raised against rat immunoglobulin G (Vector Laboratories, Burlingame, CA) or rabbit immunoglobulin G (Novo‐Link, Leica, Nanterre, France) and 3‐amino‐9‐ethylcarbazole (Vector Laboratories) as a substrate. Tissue sections were counterstained with Novocastra (Leica) hematoxylin. Stained sections were scanned on a virtual slide scanner (Hamamatsu, (Tokyo, Japan) 2.0 HT using a 3‐charge‐coupled device, time‐delay integration camera with a resolution of 1.84 µm/pixel (×20 objective) and 0.92 µm/pixel (×40 objective). Morphometric analyses were performed using ImageJ analysis software (National Institutes of Health, Bethesda, MD). The counting of labeled cells was performed using NDP.view2 software (Hamamatsu).
Reverse‐Transcription PCR
After RNA extraction from ileum samples and reverse‐transcription qPCR was performed with the Sybr Green Master Mix (Applied Biosystems, Courtaboeuf, France) on an Mx3000P (Agilent Technologies, Massy, France) device, primer sequences were reported.14 All reactions were run with 200 nmol/L of each target forward and reverse primer and 50 nmol/L of each 18S forward and reverse primer. Target gene messenger RNA (mRNA) levels were normalized with respect to 18S ribosomal RNA and expressed as relative levels (2‐ΔΔCt).
Intestinal Permeability Assay
After overnight fasting, mice were given 150 µL of a solution containing 15 mg of FITC–dextran (10 kDa; Sigma, St Louis, MO) by gavage. Five hours later, mice were killed and portal blood was collected. Fluorescence in serum was measured on a fluorimeter (Tecan Infinite M200, Männedorf, Switzerland), and the concentrations of FITC–dextran were determined using a standard curve of known FITC–dextran concentrations.
Fecal Lipocalin 2 Assay
Frozen fecal samples were reconstituted in phosphate‐buffered saline containing 0.1% Tween 20 (100 mg/mL) and vortexed for 20 minutes to get a homogenous fecal suspension, which was then centrifuged at 12,000 rpm and 4°C for 10 minutes. Lipocalin 2 concentrations were measured in the supernatants using Duoset murine lipocalin 2 ELISA kit (R&D Systems, Minneapolis, MN) as described.20
Analyses of Fecal Microbiota
DNA was extracted from 200 mg of feces as described.16 Nucleic acids were precipitated by isopropanol for 10 minutes at room temperature, followed by incubation for 15 minutes on ice and centrifugation at 15,000g and 4°C for 30 minutes. Pellets were suspended in 112 µL of phosphate buffer and 12 µL of potassium acetate. After RNase treatment and DNA precipitation, nucleic acids were recovered by centrifugation at 15,000g and 4°C for 30 minutes. The DNA pellet was finally suspended in 100 µL of tris‐ethylenediaminetetraacetic acid buffer.
The quantitative analysis of dominant bacterial taxa was performed on fecal DNA through real‐time qPCR using an ABI 7000 Sequence Detection System apparatus with 7000 system software version 1.2.3 (Applied Biosystems, Foster City, CA). Amplification and detection were achieved in 96‐‐well plates with a Takyon SYBR Green PCR kit (Eurogentec, Liege, Belgium). Each reaction was performed in duplicate in a final volume of 25 µL with 10 µL of appropriate dilutions of the DNA sample. Primers and amplification protocol were described.16 Bacterial counts were transformed to logarithms (i.e., Log10 of colony forming units) for statistical analysis.
RNA Sequencing Analyses
Liver tissue samples from Cftr ‐/‐ mice under MCT diet, four in the C57BL/6J;129/Ola background and three in the C57BL/6J background, were qualified for RNA sequencing analyses. Total RNA was extracted following the RNeasy protocol (Qiagen, Courtaboeuf, France). The quality of RNA was analyzed on a Tapestation (Agilent, Les Ulis, France). Libraries were generated from total RNA and constructed according to manufacturer protocols (Kapa mRNA stranded kit for ILLUMINA). Paired‐end sequencing (2 × 75 bp) was performed on a NextSeq 500 machine using the High Output Kit (ILLUMINA). Raw sequencing data were quality controlled with the FastQC program. Low‐quality reads were trimmed or removed using Trimmomatic (minimum length: 40 bp). Paired reads were aligned to the mouse reference genome (mm10 build) with the STAR software (option for no multihits). Mapping results were quality checked using RNA‐SeQC. Gene counts were obtained by using RSEM tools (rsem‐calculate‐expression, option for paired‐end and stranded). The 10.5 version of STRING database51 was used to search for protein–protein association networks, with a confidence cutoff ≥ 0.7.
Supporting information
Acknowledgment
The authors thank Lydie Humbert and Tatiana Ledent (CRSA), Stéphane Fouquet (Institut de la Vision), Yannick Marie and Delphine Bouteiller (ICM sequencing facility), and Emmanuel Gomas (Envigo) for their contribution to this work; Peter Durie (University of Toronto, Canada), who provided the congenic C57BL/6J Cftr +/‐ breeding pairs; and Karine Maillard and Marie‐Laure Dessain (CDTA‐TAAM), who provided the mixed C57BL/6J;129/Ola Cftr −/− and Cftr +/+ mice.
Supported by the Cystic Fibrosis Patients Association Vaincre La Mucoviscidose, the Microbiome Foundation, and INSERM Contrat d’Interface Hospitalier (to C.H.).
References
Author names in bold designate shared co‐first authorship.
- 1. Koh C, Sakiani S, Surana P, Zhao X, Eccleston J, Kleiner DE, et al. Adult‐onset cystic fibrosis liver disease: diagnosis and characterization of an underappreciated entity. Hepatology 2017;66:591‐601. [DOI] [PMC free article] [PubMed] [Google Scholar]
- 2. Boelle PY, Debray D, Guillot L, Clement A, Corvol H; French CF Modifier Gene Study Investigators . Cystic fibrosis liver disease: outcomes and risk factors in a large cohort of French patients. Hepatology 2018. 10.1002/hep.30148. [DOI] [PMC free article] [PubMed] [Google Scholar]
- 3. Lindblad A, Glaumann H, Strandvik B. Natural history of liver disease in cystic fibrosis. Hepatology 1999;30:1151‐1158. [DOI] [PubMed] [Google Scholar]
- 4. Debray D, Narkewicz MR, Bodewes F, Colombo C, Housset C, de Jonge HR, et al. Cystic fibrosis‐related liver disease: research challenges and future perspectives. J Pediatr Gastroenterol Nutr 2017;65:443‐448. [DOI] [PubMed] [Google Scholar]
- 5. Lindblad A, Hultcrantz R, Strandvik B. Bile‐duct destruction and collagen deposition: a prominent ultrastructural feature of the liver in cystic fibrosis. Hepatology 1992;16:372‐381. [DOI] [PubMed] [Google Scholar]
- 6. Dray‐Charier N, Paul A, Scoazec JY, Veissiere D, Mergey M, Capeau J, et al. Expression of delta F508 cystic fibrosis transmembrane conductance regulator protein and related chloride transport properties in the gallbladder epithelium from cystic fibrosis patients. Hepatology 1999;29:1624‐1634. [DOI] [PubMed] [Google Scholar]
- 7. Dutta AK, Khimji AK, Kresge C, Bugde A, Dougherty M, Esser V, et al. Identification and functional characterization of TMEM16A, a Ca2+‐activated Cl‐ channel activated by extracellular nucleotides, in biliary epithelium. J Biol Chem 2011;286:766‐776. [DOI] [PMC free article] [PubMed] [Google Scholar]
- 8. Colombo C, Battezzati PM, Crosignani A, Morabito A, Costantini D, Padoan R, et al. Liver disease in cystic fibrosis: a prospective study on incidence, risk factors, and outcome. Hepatology 2002;36:1374‐1382. [DOI] [PubMed] [Google Scholar]
- 9. Lamireau T, Monnereau S, Martin S, Marcotte JE, Winnock M, Alvarez F. Epidemiology of liver disease in cystic fibrosis: a longitudinal study. J Hepatol 2004;41:920‐925. [DOI] [PubMed] [Google Scholar]
- 10. Castaldo G, Fuccio A, Salvatore D, Raia V, Santostasi T, Leonardi S, et al. Liver expression in cystic fibrosis could be modulated by genetic factors different from the cystic fibrosis transmembrane regulator genotype. Am J Med Genet 2001;98:294‐297. [DOI] [PubMed] [Google Scholar]
- 11. Bartlett JR, Friedman KJ, Ling SC, Pace RG, Bell SC, Bourke B, et al. Genetic modifiers of liver disease in cystic fibrosis. JAMA 2009;302:1076‐1083. [DOI] [PMC free article] [PubMed] [Google Scholar]
- 12. Cottart CH, Bonvin E, Rey C, Wendum D, Bernaudin JF, Dumont S, et al. Impact of nutrition on phenotype in CFTR‐deficient mice. Pediatr Res 2007;62:528‐532. [DOI] [PubMed] [Google Scholar]
- 13. Durie PR, Kent G, Phillips MJ, Ackerley CA. Characteristic multiorgan pathology of cystic fibrosis in a long‐living cystic fibrosis transmembrane regulator knockout murine model. Am J Pathol 2004;164:1481‐1493. [DOI] [PMC free article] [PubMed] [Google Scholar]
- 14. Debray D, Rainteau D, Barbu V, Rouahi M, El Mourabit H, Lerondel S, et al. Defects in gallbladder emptying and bile acid homeostasis in mice with cystic fibrosis transmembrane conductance regulator deficiencies. Gastroenterology 2012;142:1581‐1591, e1586. [DOI] [PMC free article] [PubMed] [Google Scholar]
- 15. Snouwaert JN, Brigman KK, Latour AM, Malouf NN, Boucher RC, Smithies O, et al. An animal model for cystic fibrosis made by gene targeting. Science 1992;257:1083‐1088. [DOI] [PubMed] [Google Scholar]
- 16. Sokol H, Seksik P, Furet JP, Firmesse O, Nion‐Larmurier I, Beaugerie L, et al. Low counts of Faecalibacterium prausnitzii in colitis microbiota. Inflamm Bowel Dis 2009;15:1183‐1189. [DOI] [PubMed] [Google Scholar]
- 17. Standish RA, Cholongitas E, Dhillon A, Burroughs AK, Dhillon AP. An appraisal of the histopathological assessment of liver fibrosis. Gut 2006;55:569‐578. [DOI] [PMC free article] [PubMed] [Google Scholar]
- 18. Blanco PG, Zaman MM, Junaidi O, Sheth S, Yantiss RK, Nasser IA, et al. Induction of colitis in cftr‐/‐ mice results in bile duct injury. Am J Physiol Gastrointest Liver Physiol 2004;287:G491‐G496. [DOI] [PubMed] [Google Scholar]
- 19. De Lisle RC, Mueller R, Boyd M. Impaired mucosal barrier function in the small intestine of the cystic fibrosis mouse. J Pediatr Gastroenterol Nutr 2011;53:371‐379. [DOI] [PMC free article] [PubMed] [Google Scholar]
- 20. Chassaing B, Srinivasan G, Delgado MA, Young AN, Gewirtz AT, Vijay‐Kumar M. Fecal lipocalin 2, a sensitive and broadly dynamic non‐invasive biomarker for intestinal inflammation. PLoS One 2012;7:e44328. [DOI] [PMC free article] [PubMed] [Google Scholar]
- 21. Bedossa P, Consortium FP. Utility and appropriateness of the fatty liver inhibition of progression (FLIP) algorithm and steatosis, activity, and fibrosis (SAF) score in the evaluation of biopsies of nonalcoholic fatty liver disease. Hepatology 2014;60:565‐575. [DOI] [PubMed] [Google Scholar]
- 22. Sundararaj S, Zhang J, Krovi SH, Bedel R, Tuttle KD, Veerapen N, et al. Differing roles of CD1d2 and CD1d1 proteins in type I natural killer T cell development and function. Proc Natl Acad Sci U S A 2018;115:E1204‐E1213. [DOI] [PMC free article] [PubMed] [Google Scholar]
- 23. Park SH, Roark JH, Bendelac A. Tissue‐specific recognition of mouse CD1 molecules. J Immunol 1998;160:3128‐3134. [PubMed] [Google Scholar]
- 24. Jiang XF, Liu ZF, Lin AF, Xiang LX, Shao JZ. Coordination of bactericidal and iron regulatory functions of hepcidin in innate antimicrobial immunity in a zebrafish model. Sci Rep 2017;7:4265. [DOI] [PMC free article] [PubMed] [Google Scholar]
- 25. Ojala JR, Pikkarainen T, Elmberger G, Tryggvason K. Progressive reactive lymphoid connective tissue disease and development of autoantibodies in scavenger receptor A5‐deficient mice. Am J Pathol 2013;182:1681‐1695. [DOI] [PubMed] [Google Scholar]
- 26. Etienne‐Mesmin L, Vijay‐Kumar M, Gewirtz AT, Chassaing B. Hepatocyte toll‐like receptor 5 promotes bacterial clearance and protects mice against high‐fat diet‐induced liver disease. Cell Mol Gastroenterol Hepatol 2016;2:584‐604. [DOI] [PMC free article] [PubMed] [Google Scholar]
- 27. Jani PK, Schwaner E, Kajdacsi E, Debreczeni ML, Ungai‐Salanki R, Dobo J, et al. Complement MASP‐1 enhances adhesion between endothelial cells and neutrophils by up‐regulating E‐selection expression. Mol Immunol 2016;75:38‐47. [DOI] [PubMed] [Google Scholar]
- 28. Johansen JS, Krabbe KS, Moller K, Pedersen BK. Circulating YKL‐40 levels during human endotoxaemia. Clin Exp Immunol 2005;140:343‐348. [DOI] [PMC free article] [PubMed] [Google Scholar]
- 29. Marion CR, Wang J, Sharma L, Losier A, Lui W, Andrews N, et al. Chitinase 3‐like 1 (Chil1) regulates survival and macrophage‐mediated interleukin‐1beta and tumor necrosis factor alpha during Pseudomonas aeruginosa pneumonia. Infect Immun 2016;84:2094‐2104. [DOI] [PMC free article] [PubMed] [Google Scholar]
- 30. Liu JZ, Hov JR, Folseraas T, Ellinghaus E, Rushbrook SM, Doncheva NT, et al. Dense genotyping of immune‐related disease regions identifies nine new risk loci for primary sclerosing cholangitis. Nat Genet 2013;45:670‐675. [DOI] [PMC free article] [PubMed] [Google Scholar]
- 31. Desai P, Abboud G, Stanfield J, Thomas PG, Song J, Ware CF, et al. HVEM imprints memory potential on effector CD8 T cells required for protective mucosal immunity. J Immunol 2017;199:2968‐2975. [DOI] [PMC free article] [PubMed] [Google Scholar]
- 32. Blom AM. The role of complement inhibitors beyond controlling inflammation. J Intern Med 2017;282:116‐128. [DOI] [PubMed] [Google Scholar]
- 33. Zaki MH, Man SM, Vogel P, Lamkanfi M, Kanneganti TD. Salmonella exploits NLRP12‐dependent innate immune signaling to suppress host defenses during infection. Proc Natl Acad Sci U S A 2014;111:385‐390. [DOI] [PMC free article] [PubMed] [Google Scholar]
- 34. Kunzelmann K, Mehta A. CFTR: A hub for kinases and crosstalk of cAMP and Ca2+. FEBS J 2013;280:4417‐4429. [DOI] [PubMed] [Google Scholar]
- 35. Fiorotto R, Villani A, Kourtidis A, Scirpo R, Amenduni M, Geibel PJ, et al. The cystic fibrosis transmembrane conductance regulator controls biliary epithelial inflammation and permeability by regulating Src tyrosine kinase activity. Hepatology 2016;64:2118‐2134. [DOI] [PMC free article] [PubMed] [Google Scholar]
- 36. Fiorotto R, Scirpo R, Trauner M, Fabris L, Hoque R, Spirli C, et al. Loss of CFTR affects biliary epithelium innate immunity and causes TLR4‐NF‐kappaB‐mediated inflammatory response in mice. Gastroenterology 2011;141:1498‐1508, e1491–e1495. [DOI] [PMC free article] [PubMed] [Google Scholar]
- 37. Flass T, Tong S, Frank DN, Wagner BD, Robertson CE, Kotter CV, et al. Intestinal lesions are associated with altered intestinal microbiome and are more frequent in children and young adults with cystic fibrosis and cirrhosis. PLoS One 2015;10:e0116967. [DOI] [PMC free article] [PubMed] [Google Scholar]
- 38. Castellani S, Favia M, Guerra L, Carbone A, Abbattiscianni AC, Di Gioia S, et al. Emerging relationship between CFTR, actin and tight junction organization in cystic fibrosis airway epithelium. Histol Histopathol 2017;32:445‐459. [DOI] [PubMed] [Google Scholar]
- 39. De Lisle RC. Disrupted tight junctions in the small intestine of cystic fibrosis mice. Cell Tissue Res 2014;355:131‐142. [DOI] [PMC free article] [PubMed] [Google Scholar]
- 40. Qin N, Yang F, Li A, Prifti E, Chen Y, Shao L, et al. Alterations of the human gut microbiome in liver cirrhosis. Nature 2014;513:59‐64. [DOI] [PubMed] [Google Scholar]
- 41. David LA, Maurice CF, Carmody RN, Gootenberg DB, Button JE, Wolfe BE, et al. Diet rapidly and reproducibly alters the human gut microbiome. Nature 2014;505:559‐563. [DOI] [PMC free article] [PubMed] [Google Scholar]
- 42. Zhou S, Wang Y, Jacoby JJ, Jiang Y, Zhang Y, Yu LL. Effects of medium‐ and long‐chain triacylglycerols on lipid metabolism and gut microbiota composition in C57BL/6J mice. J Agric Food Chem 2017;65:6599‐6607. [DOI] [PubMed] [Google Scholar]
- 43. Hoffman LR, Pope CE, Hayden HS, Heltshe S, Levy R, McNamara S, et al. Escherichia coli dysbiosis correlates with gastrointestinal dysfunction in children with cystic fibrosis. Clin Infect Dis 2014;58:396‐399. [DOI] [PMC free article] [PubMed] [Google Scholar]
- 44. Tropini C, Moss EL, Merrill BD, Ng KM, Higginbottom SK, Casavant EP, et al. Transient osmotic perturbation causes long‐term alteration to the gut microbiota. Cell 2018;173:1742‐1754. [DOI] [PMC free article] [PubMed] [Google Scholar]
- 45. Jeffery HC, van Wilgenburg B, Kurioka A, Parekh K, Stirling K, Roberts S, et al. Biliary epithelium and liver B cells exposed to bacteria activate intrahepatic MAIT cells through MR1. J Hepatol 2016;64:1118‐1127. [DOI] [PMC free article] [PubMed] [Google Scholar]
- 46. O’Brien S, Mulcahy H, Fenlon H, O’Broin A, Casey M, Burke A, et al. Intestinal bile acid malabsorption in cystic fibrosis. Gut 1993;34:1137‐1141. [DOI] [PMC free article] [PubMed] [Google Scholar]
- 47. Bodewes FA, van der Wulp MY, Beharry S, Doktorova M, Havinga R, Boverhof R, et al. Altered intestinal bile salt biotransformation in a cystic fibrosis (Cftr‐/‐) mouse model with hepato‐biliary pathology. J Cyst Fibros 2015;14:440‐446. [DOI] [PubMed] [Google Scholar]
- 48. Kahle M, Horsch M, Fridrich B, Seelig A, Schultheiss J, Leonhardt J, et al. Phenotypic comparison of common mouse strains developing high‐fat diet‐induced hepatosteatosis. Mol Metab 2013;2:435‐446. [DOI] [PMC free article] [PubMed] [Google Scholar]
- 49. Dixon LJ, Kabi A, Nickerson KP, McDonald C. Combinatorial effects of diet and genetics on inflammatory bowel disease pathogenesis. Inflamm Bowel Dis 2015;21:912‐922. [DOI] [PMC free article] [PubMed] [Google Scholar]
- 50. Keane TM, Goodstadt L, Danecek P, White MA, Wong K, Yalcin B, et al. Mouse genomic variation and its effect on phenotypes and gene regulation. Nature 2011;477:289‐294. [DOI] [PMC free article] [PubMed] [Google Scholar]
- 51. Szklarczyk D, Morris JH, Cook H, Kuhn M, Wyder S, Simonovic M et al. The STRING database in 2017: quality‐controlled protein‐protein association networks, made broadly accessible. Nucleic Acids Res 2017;45:D362‐D368. [DOI] [PMC free article] [PubMed] [Google Scholar]
Associated Data
This section collects any data citations, data availability statements, or supplementary materials included in this article.
Supplementary Materials


