Abstract
Histone H3 lysine 9 methylation (H3K9me) mediates heterochromatic gene silencing and is important for genome stability and regulation of gene expression1–4. The establishment and epigenetic maintenance of heterochromatin involve the recruitment of H3K9 methyltransferases to specific sites on DNA followed by the recognition of pre-existing H3K9me by the methyltransferase and methylation of proximal histone H35-11. This positive feedback loop must be tightly regulated to prevent deleterious epigenetic gene silencing. Extrinsic anti-silencing mechanisms involving histone demethylation or boundary elements help limit inappropriate H3K9me spreading12–15. However, how H3K9 methyltransferase activity is locally restricted or prevented from initiating random H3K9me leading to aberrant gene silencing and epigenetic instability is not fully understood. Here we reveal an autoinhibited conformation in the conserved fission yeast S. pombe H3K9 methyltransferase Clr4/Suv39h that plays a critical role in preventing aberrant heterochromatin formation. Biochemical and X-ray crystallographic data show that an internal loop in Clr4 inhibits its catalytic activity by blocking the histone H3K9 substrate-binding pocket, and that automethylation of specific lysines in this loop promotes a conformational switch that enhances Clr4 H3K9 methylation activity. Mutations predicted to disrupt this regulation lead to aberrant H3K9me, loss of heterochromatin domains, and growth inhibition, demonstrating the importance of Clr4 intrinsic inhibition and auto-activation in regulating H3K9me deposition and preventing epigenetic instability. Conservation of the Clr4 autoinhibitory loop in other H3K9 methyltransferases, and automethylation of a corresponding lysine in the human SUV39H2 homolog16, suggest that the mechanism described here is broadly conserved.
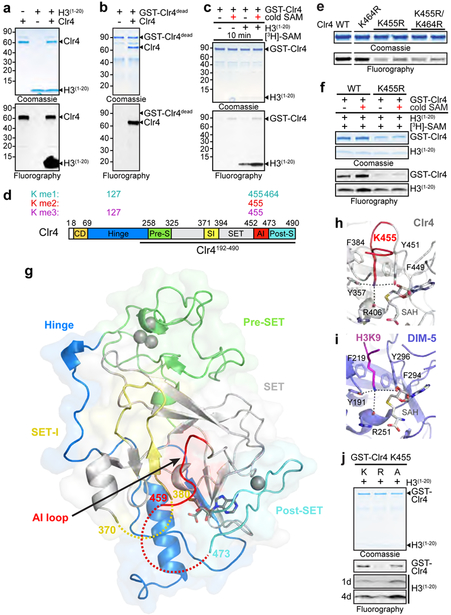
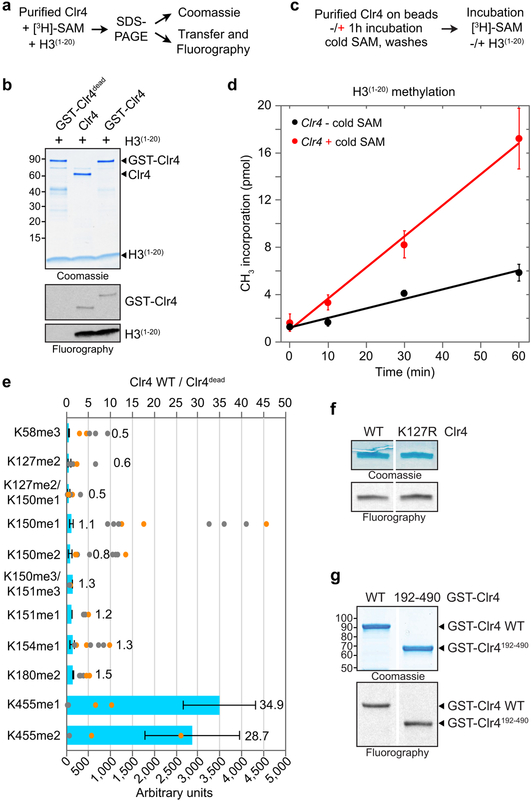
While examining the in vitro methyltransferase activity of Clr4 (Extended Data Fig. 1a), we noticed that Clr4 methylated itself in the presence or absence of its canonical histone H3(1−20) substrate (Fig. 1a, Extended Data Fig. 1b). Whereas wild-type Clr4 readily methylated itself, it was unable to methylate a catalytically inactive GST-Clr4 (GST-Clr4dead) in trans, suggesting that Clr4 undergoes intra-molecular automethylation (Fig. 1b, Extended Data Fig. 1b). Moreover, Clr4 automethylation produced a more active enzyme, since pre-incubation of Clr4 with non-radioactive S-Adenosyl-L-methionine (SAM) to allow automethylation, prior to performing methylation reactions with 3H-SAM and histone H3(1−20), increased its activity on H3(1−20) (Fig. 1c, Extended Data Fig. 1c, d).
Figure 1 ∣. Clr4 automethylation and the structural basis of its autoinhibition.
a, Clr4 undergoes automethylation in the absence (−) or presence (+) of histone H3(1−20) peptide. Coomassie-stained gel (top) and fluorography (bottom). Experiment repeated more than ten times with similar results. b, Purified GST-Clr4dead mutant (Clr4-Y451N) is not methylated in trans by the purified Clr4 WT protein. Experiment repeated twice with similar results. c, Clr4 automethylation increases its methyltransferase activity. Experiment repeated five times with similar results. d, Domain organization of S. pombe Clr4 protein (bottom) and the position of methylated lysines (K) identified by LC-MS/MS (top). Mono- (me1), di- (me2) and tri-methylated (me3) states are indicated. Bold line indicates Clr4 protein (Clr4192−490) used for crystallization. e, In vitro methyltransferase assay showing that substitution of Clr4-K455 with arginine (R) decreased automethylation, while substitution of Clr4-K464 with arginine (K464R) alone or in combination with K455R did not further decrease automethylation. Experiment repeated three times with similar results. f, Unlike wild-type (WT) Clr4, Clr4-K455R mutant methyltransferase activity is not stimulated after automethylation (red +). Experiment repeated twice with similar results. g, Structure of S. pombe Clr4192−490 autoinhibited conformation with the SET (methyltransferase domain) and other domains presented in the indicated colors. Clr4192−490, SAH and zinc cations are shown in cartoon representation, sticks, and grey spheres, respectively. h-i, K455 is located in the Clr4 catalytic pocket in proximity to the sulfur atom of SAH (h), in a similar position to lysine 9 of histone H3 substrate (H3K9) bound to DIM-5 (PDB ID 1PEG, purple) (i); see Extended Data Fig. 3f for overlay. j, Clr4-K455R and Clr4-K455A mutant proteins have decreased and increased methyltransferase activity towards the H3 peptide (1–20) substrate, respectively. Exposure times are indicated (d, day). Experiment repeated twice (Clr4-K455R) or four times (Clr4-K455A) with similar results. See Supplementary Figure 1 for the uncropped gels.
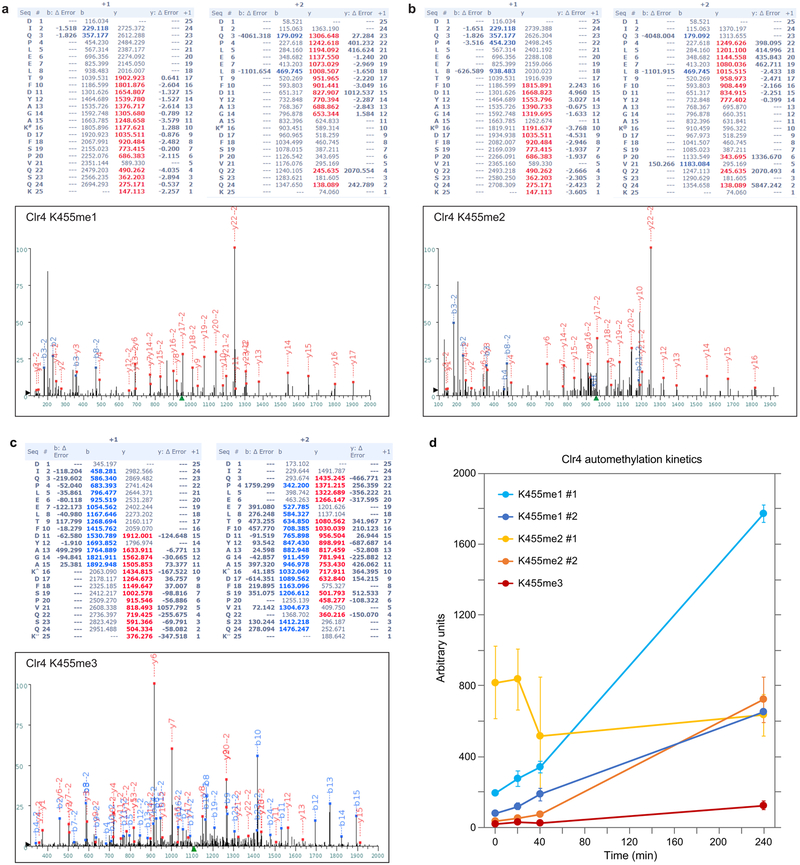
To identify the automethylated lysine(s) in Clr4, we incubated Clr4 with non-radioactive SAM for different time points followed by tandem mass spectrometry (LC-MS/MS) analysis. A purified catalytically dead Clr4 protein was also analyzed by quantitative mass spectrometry to rule out lysines methylated by E. coli enzymes. We consistently identified methylation of Clr4 K127 (me1 and me3) and K455 (me1, me2, and me3) in wild-type relative to catalytic dead Clr4, K127 (me2) in both wild-type and catalytically dead Clr4, and K464 (me1) in some preparations (Fig. 1d; Extended Data Fig. 1e, Extended Data Fig. 2). Among these lysines, only the substitution of K455 with arginine (K455R), a lysine mimic that cannot be methylated by SET domain methyltransferases such as Clr4, greatly diminished Clr4 automethylation while its combination with K464R substitution did not further decrease Clr4 automethylation (Fig. 1e; Extended Data Fig. 1f, g). Clr4-K455 was also the only lysine that showed increased time-dependent methylation upon Clr4 incubation with SAM (Extended Data Fig. 2d). Furthermore, in contrast to wild-type Clr4, pre-incubation of Clr4-K455R with non-radioactive SAM did not stimulate its ability to methylate H3(1−20) (Fig. 1f). Thus, Clr4-K455 is a primary target of automethylation and its substitution with arginine inhibits Clr4 autoactivation.
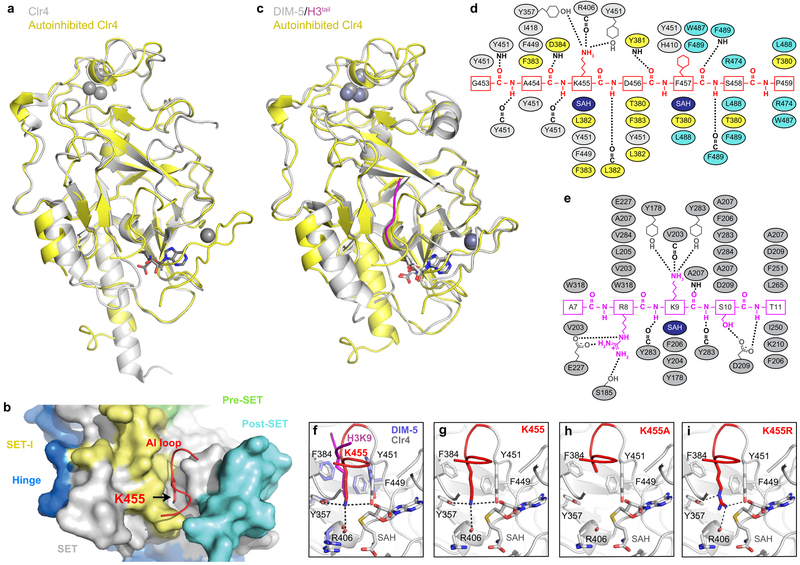
The previously solved crystal structure of Clr4 lacks cofactor, and K455 and surrounding residues point away from the active site17. We therefore solved the crystal structure of Clr4 (Clr4192−490) in complex with the methyl donor analog S-Adenosyl-L-homocysteine (SAH)(Fig. 1d). The 2.4 Å resolution Clr4192−490 structure displayed a similar overall conformation to the previously described Clr4192−490 structure, but contained additional density allowing us to model the post-SET domain and SAH (Fig. 1g; Extended Data Fig. 3a)17. Moreover, the catalytic pocket of Clr4192−490 was occluded by K455, whether our crystallization conditions included histone H3 peptide or not (Fig. 1h, Extended Data Fig. 3b). Clr4-K455 is located in a loop (aa 453 to aa 473) that connects the SET and post-SET domains, henceforth referred to as autoinhibitory (AI) loop (Fig. 1d; highlighted in red). Alignment of our Clr4192−490 structure with the published structure of DIM-5 in complex with a histone H3 peptide18 showed that the histone H3 peptide and the backbone of Clr4 AI loop occupied similar positions (root-mean-square deviation = 0.761 Å) but were stabilized through distinct contacts with the respective catalytic pockets (Extended Data Fig. 3c-e). More importantly, Clr4-K455 occupied a similar position to that of lysine 9 of the histone H3 substrate in DIM-5 near the sulfur of SAH and interacted almost identically with residues of the catalytic site (Fig. 1h, i; Extended Data Fig 3f). Thus, consistent with the biochemical and mass spectrometry identification of Clr4-K455 as a target of automethylation, it was located in Clr4 active site where it can block access to the histone substrate and could itself act as a methyl group acceptor. To directly test this hypothesis, Clr4-K455 was substituted with arginine, a lysine mimic which cannot be methylated by Clr4 or with alanine, a small non-polar side chain that cannot interact with the active site and should disfavor the autoinhibited conformation (Extended data Fig. 3g-i). Consistent with our hypothesis, while Clr4-K455R displayed reduced Clr4 activity on the H3 substrate relative to wild-type Clr4, Clr4-K455A increased histone H3(1−20) methylation (Fig. 1j).
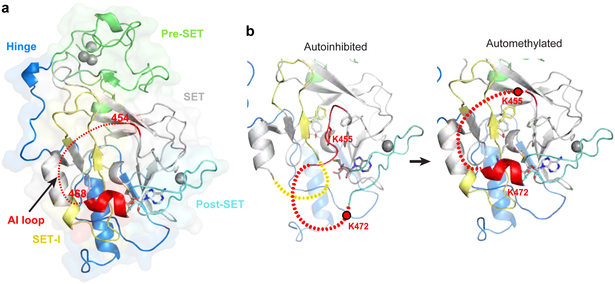
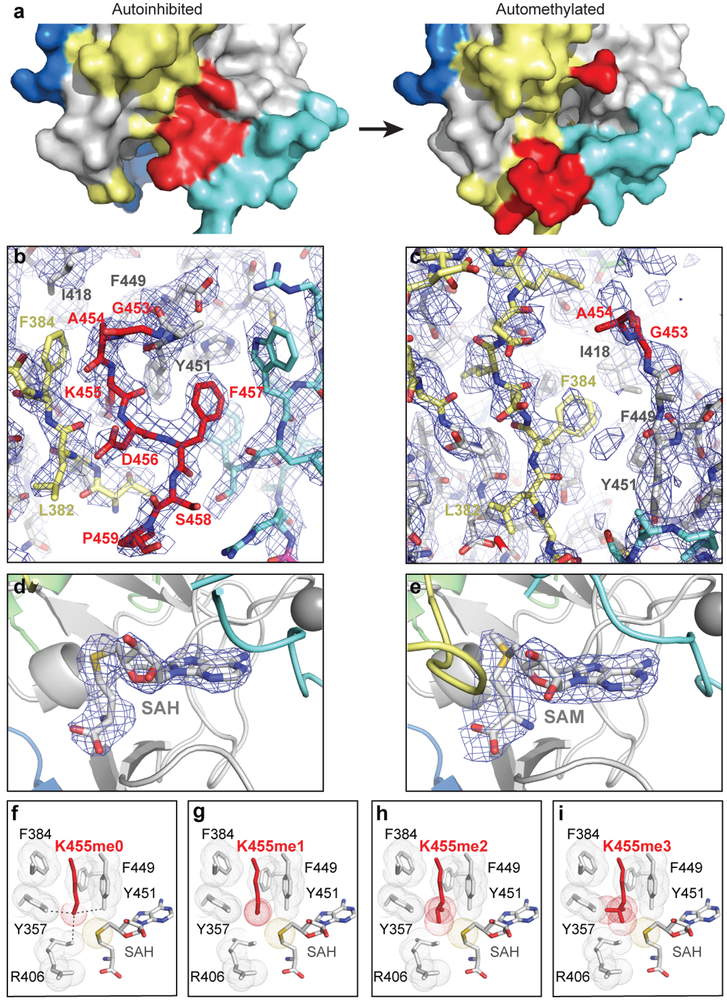
To evaluate the consequences of automethylation on Clr4 conformation, we solved the crystal structure of automethylated Clr4192–490. The 2.8 Å structure revealed a dramatic conformational rearrangement in Clr4 (Fig. 2a). In contrast to the autoinhibited conformation (Fig. 2b, left), in the automethylated Clr4, K455 and C-terminal amino acids were disordered and therefore no longer occluded the catalytic pocket (Fig. 2b, right; Extended Data Fig. 4a-e). Conversely, the C terminal residues in the AI loop (residues 468 to 472), which were disordered in the autoinhibited structure (Fig. 2b, left), formed a helix that interacted with and stabilized the SET insertion (SET-I, residues 371 to 379) domain (Fig. 2b, right), which was also partially disordered in the autoinhibited structure (Fig. 2b, left). The SET-I domain has been proposed to play a conserved role in substrate recognition and cofactor binding and its conformation is also modulated by protein-protein interactions in other SET domain methyltransferases19,20. Clr4 therefore exists in an inhibited conformation, which is reversed by an automethylation-induced conformational switch.
Figure 2 ∣. Crystal structure of automethylated Clr4192−490 reveals a conformational switch.
a, Crystal structure of automethylated Clr4192−490 with bound SAM. See Fig. 1g legend for details. b, Expanded view of the active site showing that auto-methylation (right) results in a conformational switch that creates an open catalytic pocket and stabilization of SET-I residues 371–379 which are disordered in the autoinhibited conformation (left). See Extended Data Fig. 4a and b for surface presentations.
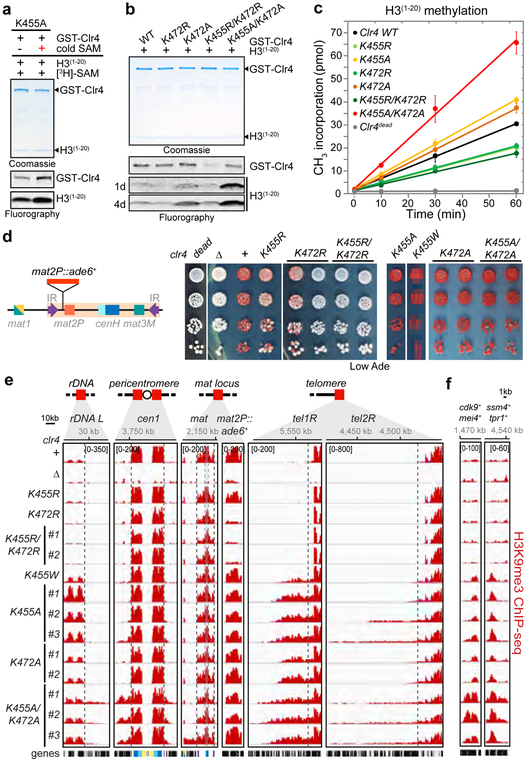
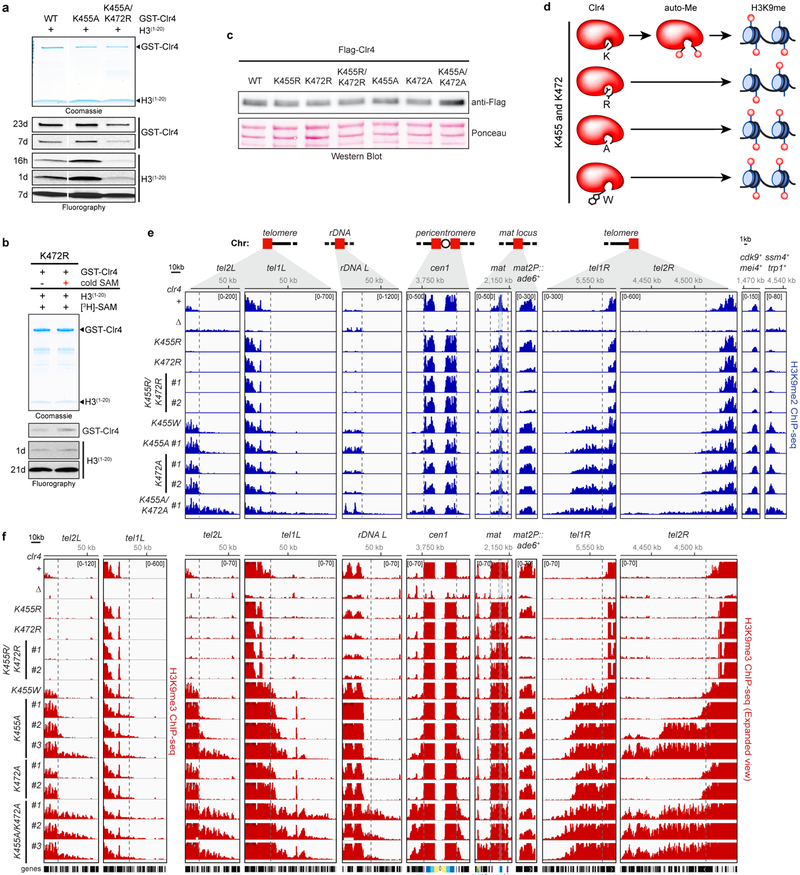
Similar to wild-type Clr4, we detected stimulation of Clr4-K455A methyltransferase activity on histone H3(1−20) following preincubation with non-radioactive SAM (Fig. 1c; Fig. 3a). This observation suggested that, in addition to K455, methylation of at least one other lysine contributed to the relief of Clr4 autoinhibition. In addition to K455, Clr4 AI loop contains lysines at positions 464, which we already ruled out as a major target of automethylation (Fig. 1e), and 472. In vitro methyltransferase assays showed that Clr4-K472A had increased H3 substrate methylation activity, which was greatly enhanced in combination with K455A (Fig. 3b). In contrast, Clr4-K472R had slightly reduced automethylation activity and reduced H3 peptide substrate methylation activity, which was further reduced in combination with K455R (Fig. 3b). The addition of K472R mutation to the hyperactive Clr4-K455A protein also greatly reduced both Clr4-K455A automethylation and methyltransferase activity toward H3(1−20) (Extended Data Fig. 5a). Together these findings suggest that Clr4 full activation requires methylation of both K455 and K472. Consistently, Clr4-K472R H3(1−20) methylation activity was not stimulated after pre-incubation with non-radioactive SAM (Extended Data Fig. 5b) and kinetic analysis indicated faster and slower rates of histone H3(1−20) methylation for single and double Clr4-K455A or -K472A and Clr4-K455R or -K472R substitutions, relative to wild-type Clr4, respectively (Fig. 3c). Analysis of automethylated Clr4 by LC-MS/MS (Fig. 1d; Extended Data Fig. 1 and 2) did not uncover Clr4-K472 methylation probably because trypsin or LysC digestion generated K472 peptides that were not readily detectable by LC-MS/MS. However, the lysine corresponding to Clr4-K472 was recently reported to be automethylated in the human SUV39H2 (K392)16, which together with our findings supports an evolutionarily conserved role for this automethylation event. We note that in contrast to our findings, which reveal an activating role for automethylation of Clr4-K472, automethylation of the corresponding human SUV39H2-K392 was proposed to inhibit its methyltransferase activity16. This apparent contradiction is likely due to dilution of 3H-SAM by excess non-radioactive SAM, which was not removed prior to histone peptide methylation assays with SUV39H216.
Figure 3 ∣. Autoinhibitory loop lysines regulate Clr4 histone H3K9 methylation in vitro and heterochromatin formation in vivo.
a, In vitro methyltransferase assay showing that Clr4-K455A mutant methyltransferase activity can be stimulated after automethylation (red +). Experiment repeated twice with similar results. b, Clr4-K472R and Clr4-K472A mutants have decreased and increased methyltransferase activity towards the H3(1−20) peptide compared to Clr4 WT protein, respectively. Exposure times are indicated (d, day). Experiment repeated twice with similar results. c, Time course of Clr4 WT and AI loop mutant proteins methyltransferase activity towards H3(1−20) peptide substrate measured by scintillation counts of [3H]-SAM incorporation. Data are means ± s.d. from three biological replicates. d, Left, map of the mat2P::ade6+ locus. Right, silencing assays of mat2P::ade6+ on low-adenine medium (Low Ade) to assess ade6+ silencing in the indicated genotypes. Experiment repeated at least three times with two to three independent clones with similar results. e, f, Examples of H3K9me3 ChIP-seq reads mapped to different heterochromatin regions (e) or meiotic genes (f) in the indicated genotypes are presented as reads per million (number in bracket in the first row of each ChIP-seq data). Top, chromosome coordinates. For the pericentromeric repeat regions on chromosome 1 (cen1) the innermost repeats (imr1R), outermost dg and dh repeats, and inverted repeat centromere (IRC) sequences are indicated in yellow, light and dark blue, and purple, respectively. Reads at cenH in the mat locus (blue shaded area) are shared with those at the pericentromeric dg and dh repeats. Black boxes indicate genes. Vertical dashed lines show the boundaries of H3K9me regions in clr4+. mat2P::ade6+ is not shown to scale. # indicates independent clones. Sequencing repeated twice with two to three independent clones with similar results. See Supplementary Figure 1 for the uncropped gels.
To investigate effect of Clr4 autoregulation on heterochromatin formation and silencing, we constructed S. pombe cells expressing endogenous Clr4 mutant proteins with single or double substitutions at K455 and K472 (Extended Data Fig. 5c). We predicted that silencing would be weakened in cells expressing hypoactive Clr4 with lysine to arginine substitutions and strengthened in cells expressing hyperactive Clr4 with lysine to alanine substitutions (Fig. 3c, Extended Data Fig. 5d), or substitution with tryptophan, which is too bulky to fit into the active site and should destabilize the autoinhibited conformation. Gene silencing was examined using an ade6+ reporter transgene inserted within the heterochromatic mat locus (mat2P::ade6+; Fig. 3d, left). Silencing of ade6+ depends on heterochromatin spreading from surrounding regions and results in growth of red colonies on medium with limiting adenine. The lysine to arginine clr4 mutant cells displayed partial or complete loss of mat2P::ade6+ silencing relative to clr4+ cells, as they formed a greater percentage of white colonies, with the strongest effect observed in the double mutant clr4-K455R/K472R (Fig. 3d, middle). Conversely, substitutions of lysine to alanine or tryptophan (for K455) resulted in increased mat2P::ade6+ silencing as indicated by growth of a higher percentage of red colonies (Fig. 3d, right). Clr4 autoinhibition therefore plays a critical role in heterochromatin-dependent transgene silencing.
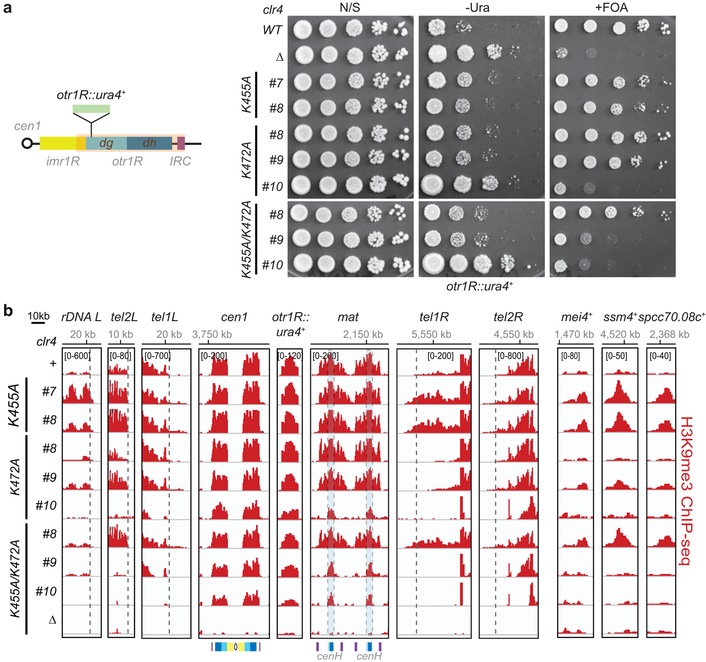
In order to gain insight into possible genome-wide changes in H3K9me in the Clr4 activity mutants, we performed chromatin immunoprecipitation combined with high throughput sequencing (ChIP-seq). In agreement with the silencing data, ChIP-seq analysis in hypoactive clr4-K455R and -K472R mutant cells, showed reduction or loss of H3K9me levels at rDNA, subtelomeric and pericentromeric DNA repeats (Fig. 3e; Extended Data Fig. 5e, f). More strikingly, several clones expressing hyperactive Clr4 enzymes (K to A or W substitutions) showed variable increase in H3K9me levels and spreading, beyond the restricted H3K9me domains in wild-type cells, at all heterochromatin regions, with dramatic increases in spreading at tel2R, spanning over 100 kb in some clones, and gained H3K9me3 at all meiotic genes and other euchromatic genes (Fig. 3e, f; Extended Data Fig. 5e, f, Supplementary Table 1 and 2), while other clones showed loss of reporter gene silencing and severely diminished or loss of H3K9me3 levels, particularly at the mat locus (Extended Data Fig. 6a, b). In addition, the hyperactive clr4 mutant cells grew slower than clr4+ or clr4Δ cells, suggesting that inappropriate heterochromatin formation in the hyperactive mutant cells inactivates genes that are required for growth (Extended Data Fig. 7a). Thus, disruption of Clr4 autoregulation results in illegitimate spreading of heterochromatin beyond its normal boundaries, ectopic gain of H3K9me at euchromatic loci, and growth inhibition.
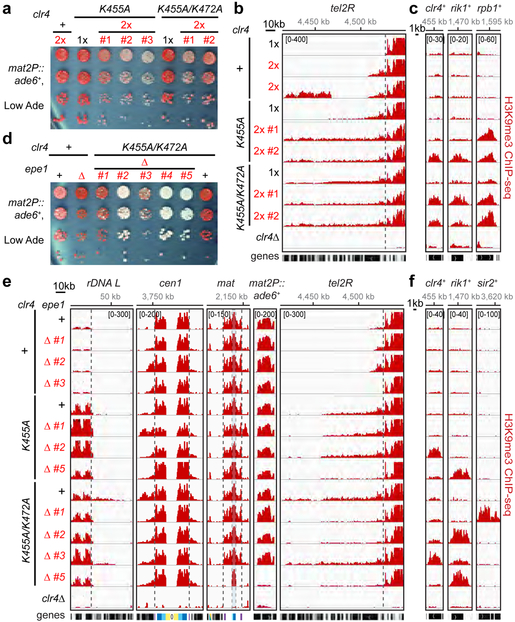
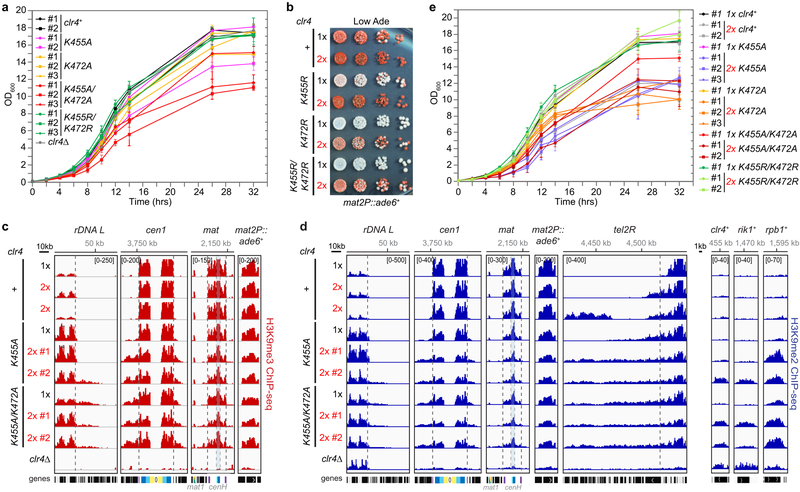
We next asked whether Clr4 intrinsic autoinhibition acts in parallel with other anti-silencing pathways. We first tested whether a limitation in the cellular concentration of Clr4 contributes to anti-silencing by increasing the dosage of wild-type or mutant Clr4 enzymes. Relative to cells carrying one copy (1x), cells carrying two copies of clr4+ (2x) displayed stronger mat2P::ade6+ silencing, indicating that the dosage of clr4+ indeed influenced the strength of silencing at the mat locus (Extended Data Fig. 7b, first two rows). Moreover, increased dosage of hypoactive clr4 single and double mutants, partially suppressed their mat2P::ade6+ silencing defect (Extended Data Fig. 7b). In contrast, when we increased the dosage of hyperactive clr4-K455A or clr4-K455A/K472A mutants, we observed variable and decreased silencing as indicated by the appearance of pink and white colonies (Fig. 4a). Consistent with the hypothesis that a balance between Clr4 levels and activation potential regulates silencing in vivo, ChIP-seq analysis of H3K9me indicated that two independent clones carrying an extra copy of clr4+ displayed increased H3K9me spreading (e.g. tel2R) and gained de novo domains of H3K9me (Fig. 4b; Extended Data Fig. 7c, d; Supplementary Table 1). Furthermore, increased dosage of the hyperactive clr4 mutants exacerbated their growth defect, increased H3K9me spreading at rDNA, subtelomeric, and pericentromeric and resulted in the appearance of several de novo peaks of H3K9me, including at rpb1+, which encodes the largest subunit of RNA polymerase I, rik1+, and clr4+ (Fig. 4b, c; Extended Data Fig. 7c-e; Supplementary Table 1). The latter two genes encode subunits of the Clr4 methyltransferase complex, suggesting that epigenetic adaptation, previously observed in other mutant backgrounds that promote deleterious heterochromatin spreading21, may allow cells to overcome the toxicity of unchecked Clr4 hyperactivity.
Figure 4 ∣. Disruption of Clr4 auto-inhibition results in growth defects and epigenetic instability.
a, Silencing assay of mat2P::ade6+ on low-adenine medium (Low Ade) with one (1x) or two (2x) copies of Clr4 WT or mutant genes. # indicates independent clones. See main text for details. Experiment performed once with two to three independent clones. b, c, H3K9me3 ChIP-seq reads mapped to representative heterochromatin regions (b) or euchromatic genes (c) in the indicated genotypes are presented as reads per million (number in bracket in the first row of each ChIP-seq data). See Fig. 3 legend for abbreviations. Sequencing performed once with two independent clones. d, Silencing assay of mat2P::ade6+ on Low Ade showing that the combination of epe1+ deletion (∆) with Clr4 hyperactive mutant results in clone to clone variegation of ade6+ silencing defect. Experiment performed once with five independent clones as shown. e, f, H3K9me3 ChIP-seq reads mapped to representative heterochromatin regions (e) or euchromatic genes (f) in the indicated genotypes are presented as reads per million (number in bracket in the first row of each ChIP-seq data). Sequencing performed once with three to four independent clones.
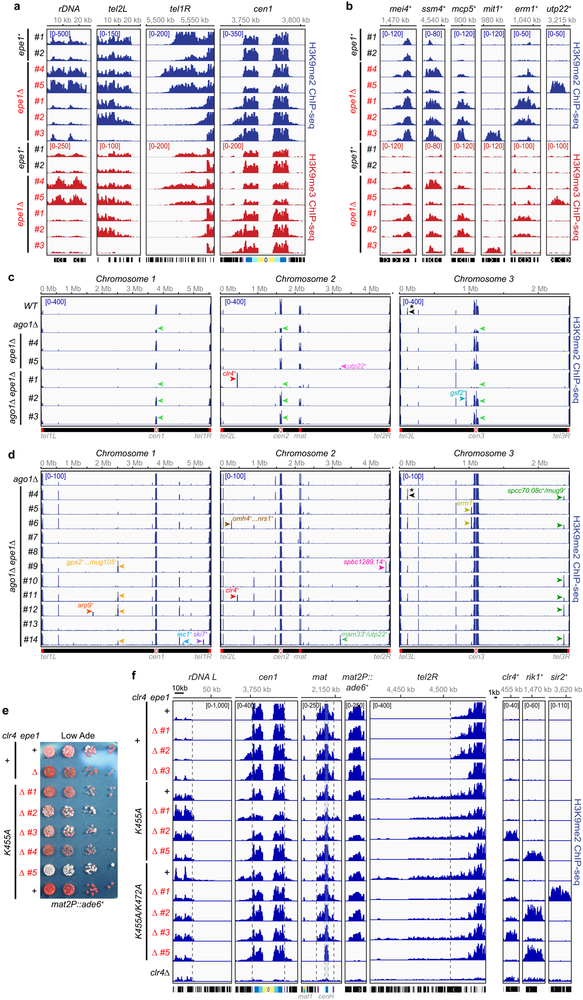
We next investigated whether Clr4 intrinsic autoinhibition acts in parallel with Epe1, a putative H3K9 demethylase that limits heterochromatin spreading13–15. Consistent with previous studies, genome-wide analysis of H3K9me in epe1Δ cells revealed variations in the levels of H3K9me levels at native heterochromatic loci, increased H3K9me spreading at some heterochromatic loci, and higher levels of H3K9me at meiotic genes14,15 (Extended Data Fig. 8a, b; Supplementary Table 2). In addition, we observed ectopic peaks of H3K9me at several non-meiotic genes in epe1Δ cells (Extended Data Fig. 8a, b; Supplementary Table 2). Such ectopic H3K9me peaks became more prevalent in epe1Δ ago1Δ double mutant cells with some clones also displaying signatures of epigenetic adaptation, such as gain of H3K9me at clr4+ itself (Extended Data Fig. 8c, d), similar to Clr4 hyperactive mutants at increased dosage (Fig. 4c). The enhancement of the epe1Δ phenotype in the epe1Δ ago1Δ double mutant cells is likely to result from an increase in free Clr4 concentration due to its release from pericentromeric and telomeric DNA repeats, where heterochromatin formation is Ago1-dependent22. To more directly test the relationship between Epe1-mediated anti-silencing and Clr4 autoinhibition, we deleted epe1+ in clr4 hyperactive mutant cells. Surprisingly, and in contrast to epe1∆ clr4+ cells, epe1∆ clr4 hyperactive mutant cells displayed reduced, rather than increased, mat2P::ade6+ silencing phenotypes, which were more drastic in some epe1∆ clr4-K455A/K472A mutant clones (Fig. 4d; Extended Data Fig. 8e). ChIP-seq analysis of different clones with variable silencing defects showed that loss of mat2P::ade6+ silencing in a representative epe1∆ clr4-K455A/K472A clone was accompanied by loss of H3K9me at ade6+ and the mat locus (clone #5; Fig. 4e; Extended Data Fig. 8f). Remarkably, the loss or reduced silencing in epe1∆ clr4 hyperactive double mutants was often accompanied by gain of de novo peaks of H3K9me at genes that encode heterochromatin proteins, such as clr4+ itself, rik1+, or sir2+ (Fig. 4f; Extended Data Fig. 8f right; Supplementary Table 2), suggesting that the survival of cells lacking both intrinsic Clr4 autoinhibition and extrinsic H3K9me demethylation depends on epigenetic downregulation of factors required for heterochromatin formation. Thus, Clr4 intrinsic autoinhibition acts in parallel with extrinsic (Clr4 levels and Epe1-promoted demethylation) anti-silencing mechanisms to maintain accurate H3K9me domains and epigenetic stability. Our results also raise the possibility that Clr4 is a target of Epe1-mediated demethylation. However, since combining epe1∆ with Clr4 hyperactive mutants resulted in more severe growth and silencing phenotypes than that of the hyperactive mutants by themselves (Fig. 4), Epe1 is likely to have substrates beyond Clr4 K455 or K472.
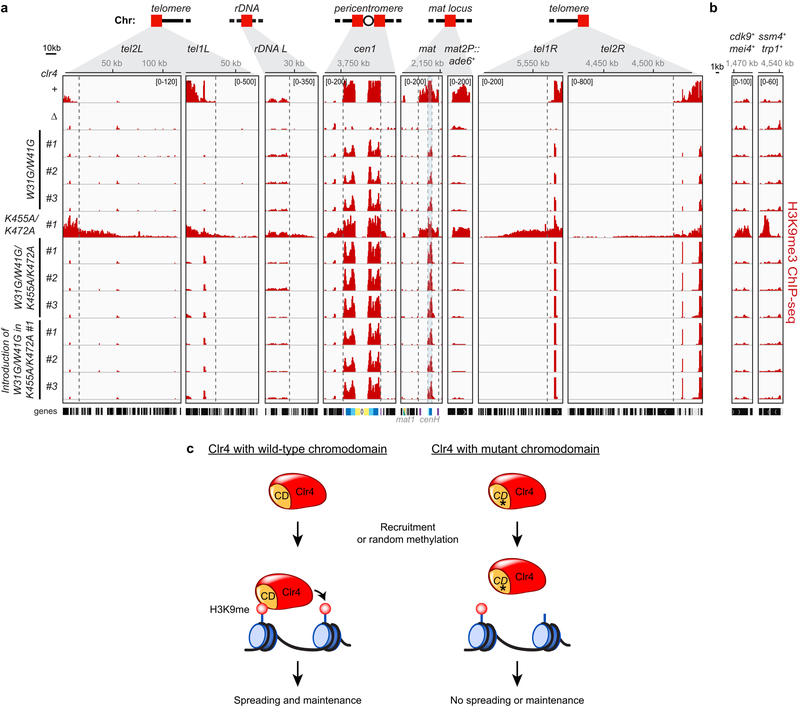
Finally, combining mutations in the chromodomain of Clr4 (W31G/W41G), which disrupt its ability to recognize H3K9me, with Clr4 hyperactive mutants (K455A/K472A) suppressed the illegitimate heterochromatin formation phenotype of the hyperactive mutants (Extended Data Fig. 9a, b), indicating that autoregulation counteracts feedback-mediated methylation leading to aberrant heterochromatin formation (Extended Data Fig. 9c).
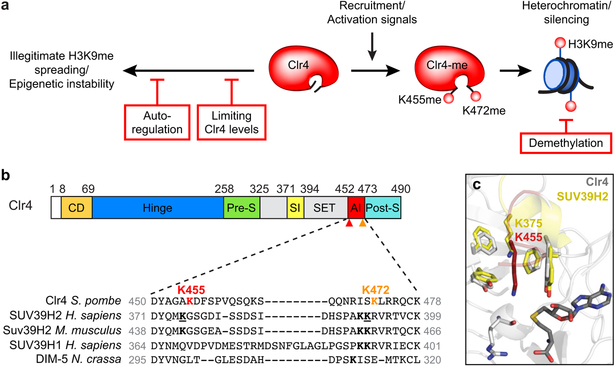
The intrinsic enzyme inhibition mechanism described here adds a new layer of control that complements extrinsic anti-silencing mechanisms involving Epe1-promoted H3K9 demethylation, boundary elements, and appropriate Clr4 levels (Extended Data Fig. 10a). Previous structural analysis of SET domain methyltransferases suggests that intrinsic inhibition is broadly conserved19,20,23,24. The autoinhibitory loop described here appears to be conserved in the mammalian Clr4 homologs23, although its physiological significance in mammals has not been addressed. In the crystal structure of human SUV39H2, K375, which corresponds to Clr4-K455 (Extended Data Fig. 10b), is located in a similar position between the SET and post-SET domains as Clr4-K455. But unlike Clr4-K455, SUV39H2-K375 is inserted only halfway into the catalytic pocket (Extended Data Fig. 10c)23. This lysine is also conserved in the mouse Suv39h2, and both the mouse and human SUV39H1 and SUV39H2 contain a lysine in analogous positions that may correspond to Clr4-K472, the second inhibitory lysine in the Clr4 AI loop, which was recently reported to be automethylated in human SUV39H2 (Extended Data Fig. 10b)16. The fission yeast Clr4 and mammalian SUV39H are components of positive feedback loops that can mediate sequence-independent spreading and epigenetic inheritance of histone modifications8,9,25,26. We propose that intrinsic enzyme inhibition, first described for cyclin-dependent kinases27, plays a critical role in preventing positive feedback-coupled chromatin-modifying enzymes from initiating illegitimate epigenetic inactivation of the genome.
Methods
Strains and plasmids construction
S. pombe strains used in this study and their genotypes are listed in Supplementary Table 3. Plasmids are listed in Supplementary Table 4. To generate pGEX-6P-1-Clr4 (pDM2113) and pGEX-6P-1-Clr4 192–490 (pDM1906), the coding sequence of Clr4 full length (amino acids 1–490) and Clr4 sequence encoding amino acids 192–490 were amplified from S. pombe genomic DNA and cloned into an EcoRI/XhoI and BamHI/XhoI digested pGEX-6P-1 plasmid backbone (GE Healthcare), respectively. pGEX-6P-1-Clr4-Y451N (GST-Clr4dead, pDM2142) contains Y451N amino acid substitutions in the catalytic SET domain28. Mutagenesis was performed by partial overlap PCR and plasmids sequences were verified by DNA sequencing.
All strains, except SPY7249-SPY7260, were constructed by transformation using a PCR-based targeting method and lithium acetate protocol29 and selected on yeast extract plus adenine (YEA) plates containing appropriate antibiotic. SPY7249-SPY7260 strains (ago1Δ epe1Δ strains #4–14 in Extended Data Figure 9) were constructed by crossing SPY2352 and SPY3216 followed by random spore analysis. Integrations were confirmed by colony PCR and clr4+ and mutant sequences were verified by DNA sequencing. All Flag-tagged Clr4 or mutant genes were expressed under the control of their endogenous promoters and terminators. SPY8363–5 strains were constructed by integrating full length 3xFlag-clr4-W31G/W41G/K455A/K472A mutants open reading frames in place of 3xFlag-clr4-K455A/K472A in SPY7361. SPY7363–4, SPY7374–6, SPY7384–5, SPY7366–7, SPY7368–9, and SPY7371–2 strains were constructed by integrating full length clr4+ or mutants open reading frames and the endogenous clr4+ promoter and terminator sequences about 450 bp upstream of the trp1+ gene in the SPY3 strain.
Silencing assays
Silencing of the ade6+ reporter gene was assessed by growth on YE plates at 32 °C followed by incubation at 4 °C 1–2 days to enhance the red pigmentation prior to imaging. The plates were incubated for 3–5 days at 32 °C and photographed. Ura4 silencing was assessed by growth on the drug FOA, which is toxic to cells expressing ura4. Cells were grown at 30 °C overnight in 5 ml of YEA medium. A concentration of 1 × 10⁷ cells/ml was harvested, washed once with sterile water, suspended in 200 µl of sterile water, and then serially diluted 10 fold. Three µl of each dilution was spotted on the appropriate growth medium (YEA, EMM-Ura, YEA+FOA, containing 1 mg/ml of 5-fluoro-orotic acid, FOA).
Protein purification and methyltransferase assay
BL21(DE3) strains expressing GST-Clr4 and mutant proteins were grown at 37 °C to OD600 between 0.6–0.8. Protein expression was induced for 16 hrs at 18 °C with 0.2 mM of IPTG. GST-Clr4 and mutant fusion proteins were then purified on glutathione-Sepharose 4B beads (GE Healthcare) in the presence of 0.2% Triton X-100 as previously described30. GST fusion proteins were eluted either by addition of 15 mM glutathione or by addition of PreScission Protease.
Methyltransferase activity on Clr4 WT and mutant proteins was typically carried out with approximately 1.8 µM Clr4 with or without 18 µM H3 (1–20) peptide (Anaspec) in HMT buffer (50 mM Tris-HCl, pH 8, 20 mM KCl, 10 mM MgCl2, 1 mM DTT, 0.02% Triton, 5% glycerol, 1 mM PMSF) in the presence of 0.42 µM 3H-S-Adenosylmethionine (3H-SAM, Perkin Elmer) and 70 µM cold SAM for 1 hr at 30 °C with mild agitation. Samples were boiled for 5 min, separated in two halves and loaded on 4–20% gradient SDS-PAGE (Biorad). Gels were either stained with Coomassie blue to visualize protein or transfered onto a PVDF membrane (Immobilon®-PSQ, Millipore), sprayed with EN3HANCE spray (Perkin Elmer) and exposed on Hyperfilm™ (Amersham) at −80 °C for 1 to several days for analysis of 3H incorporation. Kinetic analysis of Clr4 methyltransferase activity (Fig. 3c) was performed as described above except that 10.8 μM of biotinylated histone H3 (1–21) peptide (Anapspec, #61702) was used instead of H3 (1–20) peptide. Samples were taken at different time intervals and the reaction was stopped by the addition of 1x sample buffer. Samples were then spotted on a streptavidin matrix (SAM2® biotin capture membrane; Promega, #V2861), which was washed 3 times with 1M NaCl followed by two times with deionized water. After the membrane was fully dried, each membrane square was placed in a scintillation vial containing Ultima Gold scintillation cocktail (Perkin Elmer) and scintillation counting was performed on a Tri-Carb® 2910 TR scintillation counter (Perkin Elmer).
In vitro methyltransferase assays with unmethylated and automethylated Clr4 were performed by first incubating GST-Clr4 immobilized on beads in HMT buffer in the absence or presence of 250 µM cold SAM, respectively, for 1 hr at 30 °C with mild agitation. Unmethylated and automethylated GST-Clr4 beads were then washed three times in HMT buffer and used for methyltransferase assays with histone H3 (1–20) peptide as described above except that reactions were incubated for 10 minutes. Kinetic analysis of Clr4 methyltransferase activity following automethylation (Extended data Fig. 1d) was performed as described above except that unmethylated and automethylated GST-Clr4 beads were used for methyltransferase assays with 10.8 μM biotinylated histone H3 (1–21) peptide (Anapspec, #61702) in the presence of 70 μM cold SAM and 0.42 μM 3H-SAM. Samples were taken at different time intervals and the reaction was stopped by the addition of 1x sample buffer. Samples were then spotted on a streptavidin matrix (SAM2® biotin capture membrane; Promega, #V2861), which was washed 3 times with 1M NaCl followed by two washes with deionized water. After the membrane was fully dried, each membrane square was placed in a scintillation vial containing Ultima Gold scintillation cocktail (Perkin Elmer) and scintillation counting was performed on a Tri-Carb® 2910 TR scintillation counter (Perkin Elmer).
Mass spectrometry analysis for identification of Clr4 methylated lysines
For mass spectrometry analysis of Clr4 methylated lysines, a methyltransferase assay was performed as described above except that 2.4 μM recombinant Clr4 was incubated with 250 µM cold SAM for 4 hrs followed by trichloroacetic acid (TCA) precipitation and protein digestion. In brief, 100% TCA was added to each designated sample to achieve a final concentration of 12.5%. The sample was vortexed, incubated on ice for 1 hr, and centrifuged at 20,000 rpm for 30 min at 4°C. The supernatant was aspirated and the sample was washed once with 1 ml of acetone. The sample was centrifuged at 20,000 rpm for 10 min at 4°C. The supernatant was aspirated and the sample was washed once with 1 ml of methanol and allowed to air-dry.
Samples were digested with either trypsin or LysC at a 100:1 protein-to-protease ratio overnight at 37 °C. Samples were subsequently vacuum centrifuged to near dryness, acidified to 1% formic acid, desalted via StageTip, and dried via vacuum centrifugation. The desalted peptides were reconstituted in 5% acetonitrile, 5% formic acid for LC-MS/MS processing. Mass spectrometry data were collected using an Orbitrap Fusion Lumos mass spectrometer (ThermoFisher Scientific, San Jose, CA) coupled to a Proxeon EASY-nLC 1200 liquid chromatography (LC) pump (Thermo Fisher Scientific). Peptides were separated on a 100 μm inner diameter microcapillary column packed with 35 cm of Accucore C18 resin (2.6 μm, 150 Å, ThermoFisher). For each analysis, we loaded ~2 μg desalted peptides onto the column. Separation was in-line with the mass spectrometer and was performed using a 3 hr gradient of 5 to 22% acetonitrile in 0.125% formic acid at a flow rate of ∼450 nL/min. Each analysis used an SPS-MS3-based TMT method31,32, which has been shown to reduce ion interference compared to MS2 quantification33. The scan sequence began with an MS1 spectrum (Orbitrap analysis; resolution 120,000; mass range 400−1400 m/z; automatic gain control (AGC) target 5 × 10⁵; maximum injection time 100 ms). Precursors for MS2/MS3 analysis were selected using a Top20 method. MS2 analysis consisted of collision-induced dissociation (CID); AGC 2.0 × 10⁴; normalized collision energy (NCE) 35; maximum injection time 120 ms; and isolation window of 1.2 Da. Mass spectra were processed using a SEQUEST-based in-house software pipeline34. Spectra were converted to mzXML using a modified version of ReAdW.exe.
Database searching included only the Clr4 protein and the sequence coverage was up to 86%. This database was concatenated with one composed of all protein sequences in the reversed order. Searches were performed using a 50 ppm precursor ion tolerance for total protein level analysis. The product ion tolerance was set to 0.9 Da. These wide mass tolerance windows were chosen to maximize sensitivity in conjunction with Sequest searches and linear discriminant analysis34,35. We searched for the following modifications: Oxidized methionine (+15.9949), mono-methylated lysine (+14.0157), di-methylated lysine (+28.0313), and trimethylated lysine (+42.0470). Candidate peptides were manually triaged with mass errors limited to >−10 and <10 ppm, XCorr values >2, and with the requirement of trypsin specificity.
For quantitative mass spectrometry analysis of kinetics of Clr4 lysine methylation (Extended Data Fig. 2d), methyltransferase assays were performed twice in triplicate as described above except that 150 μg of recombinant Clr4 at a concentration of 6 μM was incubated with 640 µM cold SAM for 0, 20, 40, and 240 minutes followed by trichloroacetic acid (TCA) precipitation and protein digestion as described above. For quantitative mass spectrometry analysis of methylated lysines in wild-type versus catalytically dead Clr4 (Extended Data Fig. 1e), the experiment was performed twice in triplicate using 150 μg of E. coli purified recombinant wild-type and catalytically dead Clr4, which were precipitated using trichloroacetic acid (TCA) followed by protein digestion as described above. Tandem mass tag (TMT) reagents (0.8 mg) were dissolved in anhydrous acetonitrile (40 μL) of which 10 μL was added to the peptides (100 µg) with 30 μL of acetonitrile to achieve a final acetonitrile concentration of approximately 30% (v/v). Following incubation at room temperature for 1 h, the reaction was quenched with hydroxylamine to a final concentration of 0.3% (v/v). The TMT-labeled samples were pooled across all samples. The pooled sample was vacuum centrifuged to near dryness and subjected to C18 solid-phase extraction (SPE) (Sep-Pak, Waters).
All samples were analyzed on an Orbitrap Fusion mass spectrometer (Thermo Fisher Scientific, San Jose, CA) coupled to a Proxeon EASY-nLC 1000 liquid chromatography (LC) pump (Thermo Fisher Scientific). Peptides were separated on a 100 μm inner diameter microcapillary column packed with 35 cm of Accucore C18 resin (2.6 μm, 150 Å, ThermoFisher). For each analysis, we loaded approximately 2 μg onto the column. Peptides were separated using a 150 min gradient of 3 to 25% acetonitrile in 0.125% formic acid with a flow rate of 450 nL/min. Each analysis used an MS3-based TMT method31, which has been shown to reduce ion interference compared to MS2 quantification36. Prior to starting the analysis, we perform two injections of trifluoroethanol (TFE) to elute any peptides that may be bound to the analytical column from prior injections to limit carry over. The scan sequence began with an MS1 spectrum (Orbitrap analysis, resolution 120,000, 350−1,400 Th, automatic gain control (AGC) target 5E5, maximum injection time 100 ms). The top ten precursors were then selected for MS2/MS3 analysis. MS2 analysis consisted of: collision-induced dissociation (CID), quadrupole ion trap analysis, automatic gain control (AGC) 2E4, NCE (normalized collision energy) 35, q-value 0.25, maximum injection time 120 ms), and isolation window at 0.7. Following acquisition of each MS2 spectrum, we collected an MS3 spectrum in which multiple MS2 fragment ions are captured in the MS3 precursor population using isolation waveforms with multiple frequency notches. MS3 precursors were fragmented by HCD and analyzed using the Orbitrap (NCE 65, AGC 1.5E5, maximum injection time 150 ms, resolution was 50,000 at 400 Th). For MS3 analysis, we used charge state-dependent isolation windows: For charge state z=2, the isolation window was set at 1.3 Th, for z=3 at 1 Th, for z=4 at 0.8 Th, and for z=5 at 0.7 Th. Mass spectra were processed using a Sequest-based pipeline34. Spectra were converted to mzXML using a modified version of ReAdW.exe. Database searching included only the Clr4 protein. This database was concatenated with one composed of the protein sequence in the reversed order. Searches were performed using a 3 Da precursor ion tolerance for total protein level analysis. The product ion tolerance was set to 0.9 Da. TMT tags on lysine residues and peptide N termini (+229.163 Da) and carbamidomethylation of cysteine residues (+57.021 Da) were set as static modifications, while oxidation of methionine residues (+15.995 Da) was set as a variable modification. Candidate peptides were manually triaged with mass errors limited to >−10 and <10 ppm, XCorr values >2, and with the requirement of trypsin specificity.
Chromatin immunoprecipitation and high throughput sequencing (ChIP-seq)
ChIP was performed essentially as described11. Briefly, 50 ml of logarithmically growing cells were fixed with 1% formaldehyde for 15 min at room temperature, quenched with 130 mM glycine for 5 min, harvested and washed twice with 1x TBS (50 mM Tris-HCl, pH 7.5, 150 mM NaCl). Cells were resuspended in 500 µl lysis buffer (50 mM Hepes-KOH, pH 7.5, 500 mM NaCl, 1mM EDTA, 1% Triton X-100, 0.1% SDS, and protease inhibitors) in 2 ml screw-cap tubes and lysed by bead beating with 1 ml acid-washed 0.5 mm glass beads with 6 cycles of 30 sec at 5000 rpm on a MagNA Lyser Instrument (Roche). Extracts were sonicated for 3×20 sec at 50% amplitude using a sonicator (Branson Digital Sonifier). For H3K9me2 ChIP, 2 µg of anti-H3K9me2 antibody (Abcam, ab1220) coupled to 30 µl Dynabeads Protein A (Invitrogen) was used for each immunoprecipitation. For H3K9me3 ChIP, 1 µg of anti-H3K9me3 antibody (Diagenode, C15500003) was first incubated with 30 µl Dynabeads M-280 Streptavidin beads (Invitrogen), followed by blocking with 5 µM biotin, according to the manufacturer’s instructions, prior to using for each immunoprecipitation. Half (250 µl for ChIP-seq) or one fifth (100 µl for ChIP-qPCR) of sheared chromatin lysate was added to the antibody-bead mixture and incubated for 2 hrs at 4 °C on a rotating device.
After reversing cross-links and DNA clean-up, libraries for Illumina sequencing were constructed as previously described11 following the manufacturer’s protocols, starting with 1 to 10 ng of immunoprecipitated DNA fragments. Briefly, each library was generated with custom-made adapters carrying unique barcode sequences at the ligating end37. Barcoded libraries were pooled and sequenced with Illumina HiSeq2000. Raw reads were separated according to their barcodes and mapped to the S. pombe genome using Bowtie’s default parameters. Reads that mapped to repeated regions were randomly assigned to the dg and dh repeats of each chromosome and therefore the reads at cenH in the mat locus are shared with those at the pericentromeric dg and dh repeats (with which cenH shares 98% sequence identity). Mapped reads were normalized to reads per million, tiled with igvtools, and visualized in IGV (http://www.broad.mit.edu/igv/). The raw and processed ChlP-seq data are publicly available at the NCBI Gene Expression Omnibus under accession number GSE102905.
Expression and purification of Clr4 SET domain for crystallization
The GST-Clr4 fusion protein containing amino acids 192 to 490 (Clr4192−490) was expressed in BL21-CodonPlus (Agilent technologies) cells. One liter cultures of Luria Burtani media supplemented with 100 μg/mL ampicillin were inoculated with overnight cultures and shaken at 37°C until they reached an OD600 of 0.6–1.0. Cultures were then cooled to 16 °C and ethanol, ZnSO4, and IPTG were added to a final concentration of 2%, 20 μM, and 0.2 mM, respectively. Cultures were shaken at 16 °C for an additional 16 hrs and then harvested by centrifugation. Cell pellets were resuspended in Buffer A (50 mM Tris-HCl, pH 8.0, and 500 mM NaCl) and 1 mg/mL DNAse, 1 mg/mL Lysozyme, and 1 mM MgCl2 and incubated at 4 °C with mixing for 1 hr. The suspension was subsequently sonicated and centrifuged at 32,000 × g for 20 min. The supernatant was nutated with Glutathione Sepharose 4B resin that had been preequilibrated in Buffer A for 1 hr at 4°C. The resin was washed with Buffer A and eluted with Buffer A containing 10 mM reduced glutathione. The eluted protein was dialysed overnight, with PreScission Protease (GE Healthcare) to cleave the GST tag, into Buffer B (5 mM Tris-HCl, pH 8.0, 200 mM NaCl, 1 mM DTT). The protein was again incubated with Glutathione Sepharose 4B resin equilibrated in Buffer B. The unbound fraction was further purified using a HiTrap Q (GE Healthcare) column and a High Load 16/60 Sephadex 200 pg column (GE Healthcare) equilibrated in Buffer B. Fractions containing Clr4192−490 were concentrated to 10 mg/mL for crystallization.
Crystallization
Clr4192−490 crystals were produced by the sitting drop vapor diffusion method at 25 °C. Clr4192−490 at a concentration of 10 mg/mL was preincubated with a threefold molar excess of SAH for 15 min on ice and mixed in an equal volume of reservoir solution containing 200 mM calcium acetate, 100 mM Imidazole, pH 7.5, 15% PEG 8,000. Clr4: SAH complex crystals were cryoprotected in reservoir solution containing 20 % glycerol. Automethylated Clr4192−490 was prepared for crystallization by incubating the protein at a concentration of 0.5 μM with 80 μM SAM at 25 °C. The buffer was exchanged extensively three times and replenished with fresh SAM after 8, 24, and 32 hours. The protein was concentrated to 10 mg/mL, supplemented with stoichiometric excess of SAM, and mixed with an equal volume of reservoir solution containing 0.1 M magnesium formate dihydrate and 20 % PEG 3350. Crystals of the automethylated Clr4 were cryoprotected in reservoir solution containing 30 % PEG 3,350. Another crystal was isolated from the same drop as the one used for data collection, washed three times in water, digested with Trypsin and LysC, and subjected to mass spectrometry analysis as described above (Supplementary Table 5).
Crystallographic data collection and structure determination
X-ray diffraction data was collected at The Northeastern Collaborative Access Team (NE-CAT) beamline 24-ID-E at The Advanced Photon Source (APS) at Argonne National Laboratory at a wavelength of 0.97918 Å38. All structural biology software was accessed through the SBGrid consortium. Data was processed using XDS39 and the CCP4 suite40. The data for the automethylated form of Clr4 was corrected for anisotropy using the Staraniso server (http://staraniso.globalphasing.org) developed by Global Phasing Ltd. Molecular replacement was performed with Phaser41 and coordinates from PDB entry 1MVH. Phenix was used for refinement and generating omit maps42 and model building was carried out using COOT43. Ramachandran statistics for the autoinhibited and automethylated Clr4 structures were 95.98% favored, 3.82% allowed, and 0.19% outliers and 90.86% favored, 8.96% allowed, 0.19% outliers, respectively. All structure alignments and figures were generated using PyMOL Molecular Graphics System, Version 1.8.0.3, Schrödinger, LLC. Structure coordinates were submitted to the Protein Data Base (PDB) and crystallographic data collection and refinement statistics are presented in Supplementary Table 6.
Extended Data
Extended Data Figure 1 ∣. Analysis of Clr4 automethylation.
a, Outline of the in vitro methyltransferase activity assays. b, In vitro methyltransferase assay showing that Clr4dead (Clr4-Y451N) has no methyltransferase activity toward itself or histone H3(1−20) peptide and that wild-type (WT) Clr4 with or without an N-terminal GST tag displays similar methyltransferase activities. The GST tag was left on Clr4dead mutant allowing the slower migrating GST-Clr4dead to be distinguished from WT Clr4. Experiment repeated twice with similar results. c, Outline of the in vitro methyltransferase assay with unmethylated or automethylated Clr4. d, Time course of GST-Clr4 methyltransferase activity towards H3(1−20) peptide substrate (10.8 μM) following a 1 hr incubation of GST-Clr4 with 512 μM cold SAM (+) or without SAM (−) showing that Clr4 automethylation increases its methyltransferase activity on the H3(1−20) substrate. Incorporation of [3H]-SAM on H3(1−20) was assessed by scintillation counting. Data are means ± s.d. from three biological replicates. e, Quantitative mass spectrometry analysis of E. coli purified GST-Clr4 WT and GST-Clr4dead showing that Clr4-K455 is the sole target of automethylation detected in our experiments and that the remaining sites were methylated by E.coli enzymes. Data are means ± s.e.m. from three (wild-type, orange circles) or six (Clr4dead, grey circles) biological replicates. Data are presented as a ratio (upper axis) of values for each peptide (lower axis) of Clr4 WT vs GST-Clr4dead containing the indicated methylated lysine. f-g, In vitro methyltransferase assays showing that Clr4-K127 is not a major target of automethylation since substitution of K127 (K127R) (f), or deletion of part of the hinge and the chromodomain (Clr4192−490), containing K127 (g), did not affect the level of Clr4 automethylation. Experiment performed once (f) and more than three times with similar results (g). See Supplementary Figure 1 for the uncropped gels.
Extended Data Figure 2 ∣. Clr4-K455 is a target of automethylation.
a-c, LC-MS/MS analysis showing mono-methylation (a), di-methylation (b) and tri-methylation (c) of Clr4 at K455. The peptide sequence (amino acids 440–464) with theoretical masses of MS/MS fragments (top) and the MS/MS spectrum corresponding to the mono-methylated (a), di-methylated (b) and tri-methylated (c) Clr4 K455 are shown (bottom). Experiment repeated more than four times (with either LysC or Trypsin digestion) with similar results. d, Kinetics of in vitro GST-Clr4 automethylation followed by quantitative mass spectrometry analysis showing an increase of Clr4-K455 automethylation at the indicated time points. In the case of K455me1 and me2, two different size peptides were quantified and are indicated by #1 and #2. The lower levels of K455me3 relative to K455me1 and K455me2 are likely to reflect faster rates of mono- and di-methylation relative to tri-methylation. The small increase in K455me3 without a corresponding decrease in K455me1/2 suggests that automethylation did not reach saturation in our reactions. Data are means ± s.e.m from six biological replicates.
Extended Data Figure 3 ∣. Comparison of Clr4 structure with other SUV39H methyltransferases.
a, Alignment of the autoinhibited Clr4192–490 (yellow) and the previously determined Clr4192–490 structure lacking post-SET domain and cofactor (grey) (PDB ID 1MVH). b, Close up view of S. pombe Clr4192–490 autoinhibited conformation (surface) showing that K455 (red stick) in the AI loop (red) is located within the active site pocket. c, Alignment of autoinhibited Clr4192–490 (yellow) and DIM-5 (grey) in complex with histone H3 peptide (magenta) and SAH (PDB ID 1PEG). d-e, Schematic representation of residues that engage in interactions between Clr4 (grey, yellow and cyan) and Clr4 AI loop (red) (d) and DIM-5 (grey) and histone H3 (magenta) (e). Hydrogen bonds and salt bridge interactions are shown as dashed lines. Color assignments are as in Fig. 1d; residues in the SET-I, SET, and post-SET domain are shown in yellow, grey and cyan, respectively. SAH is shown in dark blue. f, Alignment of the catalytic pockets of Clr4192–490 and DIM-5 (PDB ID 1PEG) showing that Clr4-K455 (red) and lysine 9 of the histone H3 substrate (magenta) occupy similar positions. g-i, Close up view of the autoinhibited conformation of Clr4 active site (g, as in Fig. 1h, shown here for comparison) and modeling the K455A (h) and K455R (i) mutants in the active site. Possible bonding interactions are shown as dashed lines.
Extended Data Figure 4 ∣. Automethylation-induced conformational change in Clr4.
a, Surface representation of Clr4 active site area of autoinhibited Clr4 (left) and automethylated Clr4 (right) showing the automethylation-induced opening of the catalytic pocket with the methyl group of SAM visible in the active site tunnel. b, Simulated annealing composite omit map for the AI loop occupied active site of Clr4 contoured at 1.0 σ. The protein is colored as in Fig. 1d and the electron density is shown in blue. c, Simulated annealing composite omit map of the same region in the automethylated Clr4 crystal structure contoured at 1.0 σ lacks density for AI loop residues. d-e, Polder omit map for the bound cofactors of the autoinhibited (d) and automethylated (e) crystal structures contoured at 3.5 σ. f-i, Close up view of the autoinhibited conformation of Clr4 active site (f, as in Fig. 1h, shown here for comparison) and modeling the K455me1 (g), K455me2 (h), and K455me3 (i) within the active site. Since Clr4-K455 can be mono-, di-, and tri-methylated (Extended Data Fig. 2), the disruption of active site contacts by K455me1 and K455me2 must be partial.
Extended Data Figure 5 ∣. Analysis of Clr4 AI loop mutant proteins and their effect on histone H3K9me2 or me3 in vitro and in vivo.
a, In vitro methyltransferase assay showing that the addition of K472R mutation to hyperactive Clr4-K455A protein reduced both its automethylation and methyltransferase activity towards the H3(1−20) peptide compared to Clr4-K455A protein. Exposure time is indicated (h, hour; d, day). Experiment repeated twice with similar results. b, Clr4-K472R mutant methyltransferase activity is not stimulated after automethylation (red +). Exposure times are indicated (d, day). Experiment performed once. c, Western blot of N-terminal 3 × Flag-tagged Clr4 showing that AI loop mutations (K455 and K472) do not affect Clr4 protein stability (top). The same blot stained with Ponceau dye is shown as a loading control (bottom). Experiment performed once. d, Diagram of Clr4 with K455 and K472, with arginine (R), alanine (A), or tryptophan (W) (for K455) substitutions and their expected effect on Clr4 methyltransferase activity. e, H3K9me2 ChIP-seq reads mapped to different heterochromatin regions in the indicated genotypes are presented as reads per million (number in bracket in the first row of each ChIP-seq data) and highlight increased or decreased spreading of H3K9me2 in the Clr4-K455 and -K472 mutants. Top, chromosome coordinates. Sequencing performed twice with similar results with two independent clones. f, Same as in (e), but showing H3K9me3 ChIP-seq of tel1L and tel2L (left) and an expanded view of H3K9me3 ChIP-seq (right). See Fig. 3 legend for abbreviations. Sequencing repeated twice with two to three independent clones with similar results. See Supplementary Figure 1 for the uncropped gels.
Extended Data Figure 6 ∣. Clr4 hyperactive mutants promote epigenetic instability.
a, Left, map of the right arm of centromere 1 (cen1) with the insertion of the ura4+ reporter gene at the pericentromeric otr1R repeat (otr1R::ura4+). Right, otr1R::ura4+ silencing assay in the indicated genotypes showing clone to clone variation of ura4+ silencing in clr4 hyperactive mutants. N/S, nonselective medium; −Ura, minus uracil medium; +FOA, 5-FOA-containing medium. Experiment performed twice with similar results with two to three independent clones as shown. b, H3K9me3 ChIP-seq reads mapped to different heterochromatin regions (left) or euchromatic genes (right) in the indicated genotypes are presented as reads per million (number in bracket in the first row of each ChIP-seq data) and highlight increased or decreased spreading of H3K9me2 or me3 in Clr4-K455 mutants. S. pombe h+ cells used for the ChIP-seq experiments have a duplicated mat locus. Top, chromosome coordinates. See Fig. 3 legend for abbreviations. Sequencing performed once with two to three independent clones as shown.
Extended Data Figure 7 ∣. Disruption of Clr4 auto-inhibition results in growth defects, inappropriate H3K9me spreading and formation of new H3K9me domains.
a, Growth assays showing that cells expressing the indicated Clr4 hyperactive mutants have growth defects. Data are means ± s.d. from three biological replicates. b, Silencing assay of mat2P::ade6+ on low-adenine medium (Low Ade) with one (1x) or two (2x) copies of clr4+ or mutant clr4 genes. See main text for details. Experiment performed twice with at least two independent clones with similar results. c-d, H3K9me3 (c) or H3K9me2 (d) ChIP-seq reads mapped to different heterochromatin regions (left) or euchromatic genes (right) in the indicated genotypes are presented as reads per million (number in bracket in the first row of each ChIP-seq data). Top, chromosome coordinates. See Fig. 3 legend for abbreviations. Sequencing performed once with two independent clones as shown. (e) Growth assays showing that the addition of a second copy (2x) of the clr4 gene encoding hyperactive Clr4 mutants exacerbate growth defects. Data are means ± s.d. from three biological replicates.
Extended Data Figure 8 ∣. Deletion of the Epe1 anti-silencing pathway leads to epigenetic instability.
a-b, H3K9me2 (top, blue) and H3K9me3 (bottom, red) ChIP-seq reads mapped to different heterochromatin regions (a) or euchromatic genes (b) in the indicated genotypes are presented as reads per million (number in bracket in the first row of each ChIP-seq data). Top, chromosome coordinates. See Fig. 3 legend for abbreviations. mit1+ encodes a Clr3 HDAC-associated factor required for efficient heterochromatic silencing; erm1+ encodes an endoplasmic reticulum peptidase; utp22+ encodes a ribosomal RNA processing factor. Note that epe1+ #1 and epe1Δ #4–5 clones were constructed in the SPY137 background (which has an insertion of ura4+ at the pericentromeric region of chromosome 1) and epe1+ #2, epe1Δ #1–3 clones were constructed in the SPY3 background (which has an insertion of ade6+ at the mat locus, see Supplementary Table 3 for detailed genotypes). Sequencing performed once with the indicated independent clones (#) for each genotype. c-d, H3K9me2 ChIP-seq in the indicated genotypes showing clone to clone variation in the appearance of H3K9me2 peaks throughout the S. pombe genome (colored arrowheads). H3K9me2 ChIP-seq reads mapped to all 3 S. pombe chromosomes in the indicated genotypes are presented as reads per million (number in bracket in the first row of each ChIP-seq data). Top, chromosome coordinates. Black arrowhead with asterisk indicates the location of the ura4+ gene. Strains were constructed by crossing cells with and without ura4+ insertion at pericentromeric repeats. Therefore, not all progeny of the cross show H3K9me2 mapping to ura4+ (highlighted with asterisk on the left arm of chromosome 3). See Supplementary Table 2 for a list of H3K9me peaks. Sequencing performed once with the indicated independent clones (#) for each genotype. e, Silencing assay of mat2P::ade6+ on Low Ade showing that the combination of epe1+ deletion (∆) with Clr4 hyperactive mutant results in clone to clone variegation of ade6+ silencing defect. Experiment performed once with five independent clones as shown. f, H3K9me2 ChIP-seq reads mapped to different heterochromatin regions (left) or euchromatic genes (right) in the indicated genotypes are presented as reads per million (number in bracket in the first row of each ChIP-seq data). Top, chromosome coordinates. See Fig. 3 legend for abbreviations. Sequencing performed once with three to four independent clones.
Extended Data Figure 9 ∣. Clr4 autoregulation prevents illegitimate heterochromatin formation mediated by the Clr4 read-write positive feedback mechanism.
a-b, H3K9me3 ChIP-seq reads mapped to different heterochromatin regions (a) or euchromatic genes (b) in the indicated genotypes are presented as reads per million (number in bracket in the first row of each ChIP-seq data). Top, chromosome coordinates. See Fig. 3 legend for abbreviations. Sequencing performed once with the indicated independent clones (#) for each genotype. c, Schematic summary showing Clr4 chromodomain (CD)-dependent spreading and maintenance of histone H3K9me. The CD-dependent positive feedback loop is critical even with hyperactive Clr4.
Extended Data Figure 10 ∣. Clr4 automethylation-dependent heterochromatin regulation and evidence for its evolutionary conservation.
a, Schematic summary of the role of AI loop lysine automethylation in preventing illegitimate heterochromatin formation and epigenetic instability (left). Intrinsic regulation of Clr4 by automethylation (K455 and likely K472) acts in parallel with other anti-silencing mechanisms involving regulation of Clr4 levels and H3K9 demethylation (red boxes). See main text for additional discussion. b, Top, diagram illustrating the domain organization of the S. pombe Clr4 protein and the location of Clr4 K455 (red arrowhead) and K472 (orange arrowhead). Bottom, sequence alignment of Clr4 AI loop containing K455 (red) and K472 (orange) in the indicated methyltransferases. SUV39H2-K375 and SUV39H2-K392 are indicated in underlined bold. H. sapiens, Homo sapiens; M. musculus, Mus musculus; N. crassa, Neurospora crassa. c, Overlay of S. pombe Clr4 in grey (this study, PDB ID 6BOX) and human SUV39H2 in yellow (PDB ID 2R3A) showing that S. pombe Clr4-K455 (shown as red stick) and human SUV39H2-K375 (shown as yellow stick) occupy partially overlapping positions inside the catalytic pocket.
Supplementary Material
Reporting Summary
Supplementary Figure 1 The uncropped gels for panels used in Figure 1a, b, c, e, f, j, Figure 3a, b, Extended Data Figure 1b, f, g, and Extended Data Figure 5a, b, c.
Supplementary Table 1 H3K9me peak in the indicated strains containing one or two copies of clr4 wt or mutants are summarized.
Supplementary Table 2 H3K9me peak in the indicated epe1+ and epe1Δ genotypes are summarized.
Supplementary Table 3 A list of fission yeast S. pombe strains used in this study.
Supplementary Table 4 A list of plasmids used in this study.
Supplementary Table 5 Quantitative mass spectrometry analysis of Clr4 K455 methylation states in crystal.
Supplementary Table 6 Crystallographic data collection and refinement statistics.
Acknowledgments
We are grateful for assistance from the staff at NE-CAT at Argonne National Laboratory, the SBGrid consortium at Harvard Medical School, and Simon Jenni for useful discussions, Haejin Yoon for help with the scintillation counter, Zarmik Moqtaderi and Ruby Yu for Python scripts, Gergana Shipkovenska, Antonis Tatarakis, Xiaoyi Wang, Andy Yuan, and Haining Zhou for comments on the manuscript, and members of the Moazed lab for discussion. This work used NE-CAT beamlines (GM103403), a Pilatus detector (RR029205), a Eiger detector (OD021527) and APS Synchrotron source (DE-AC02–06CH11357). This work was supported by an EMBO long-term fellowship and a Swiss National Science Foundation postdoctoral fellowship (N.I.), K01 DK098285 (J.A.P.), NIH P50 GM107618 (M.K., S.P.G.), and NIH RO1 GM072805 (D.M.). D.M. is a Howard Hughes Medical Institute Investigator.
Footnotes
The authors declare no competing interests.
Code availability
The Python script used in this study is available upon request.
Data availability
Genome-wide datasets are deposited in the Gene Expression Omnibus (GEO) under the accession number GSE102905. Structure coordinates were deposited in the Protein Data Base (PDB ID 6BOX and 6BP4).
References
- 1.Rea S et al. Regulation of chromatin structure by site-specific histone H3 methyltransferases. Nature 406, 593–599. (2000). [DOI] [PubMed] [Google Scholar]
- 2.Lachner M, O’Carroll D, Rea S, Mechtler K & Jenuwein T Methylation of histone H3 lysine 9 creates a binding site for HP1 proteins. Nature 410, 116–120. (2001). [DOI] [PubMed] [Google Scholar]
- 3.Bannister AJ et al. Selective recognition of methylated lysine 9 on histone H3 by the HP1 chromo domain. Nature 410, 120–124. (2001). [DOI] [PubMed] [Google Scholar]
- 4.Nakayama J, Rice JC, Strahl BD, Allis CD & Grewal SI Role of histone H3 lysine 9 methylation in epigenetic control of heterochromatin assembly. Science 292, 110–113. (2001). [DOI] [PubMed] [Google Scholar]
- 5.Moazed D Mechanisms for the inheritance of chromatin states. Cell 146, 510–518, doi:10.1016/j.cell.2011.07.013 (2011). [DOI] [PMC free article] [PubMed] [Google Scholar]
- 6.Zhang K, Mosch K, Fischle W & Grewal SI Roles of the Clr4 methyltransferase complex in nucleation, spreading and maintenance of heterochromatin. Nat Struct Mol Biol (2008). [DOI] [PubMed] [Google Scholar]
- 7.Al-Sady B, Madhani HD & Narlikar GJ Division of labor between the chromodomains of HP1 and Suv39 methylase enables coordination of heterochromatin spread. Mol Cell 51, 80–91, doi:10.1016/j.molcel.2013.06.013 (2013). [DOI] [PMC free article] [PubMed] [Google Scholar]
- 8.Ragunathan K, Jih G & Moazed D Epigenetics. Epigenetic inheritance uncoupled from sequence-specific recruitment. Science 348, 1258699, doi:10.1126/science.1258699 (2015). [DOI] [PMC free article] [PubMed] [Google Scholar]
- 9.Audergon PN et al. Epigenetics. Restricted epigenetic inheritance of H3K9 methylation. Science 348, 132–135, doi:10.1126/science.1260638 (2015). [DOI] [PMC free article] [PubMed] [Google Scholar]
- 10.Wang X & Moazed D DNA sequence-dependent epigenetic inheritance of gene silencing and histone H3K9 methylation. Science 356, 88–91, doi:10.1126/science.aaj2114 (2017). [DOI] [PMC free article] [PubMed] [Google Scholar]
- 11.Jih G et al. Unique roles for histone H3K9me states in RNAi and heritable silencing of transcription. Nature 547, 463–467, doi:10.1038/nature23267 (2017). [DOI] [PMC free article] [PubMed] [Google Scholar]
- 12.Thon G, Bjerling P, Bunner CM & Verhein-Hansen J Expression-state boundaries in the mating-type region of fission yeast. Genetics 161, 611–622 (2002). [DOI] [PMC free article] [PubMed] [Google Scholar]
- 13.Trewick SC, Minc E, Antonelli R, Urano T & Allshire RC The JmjC domain protein Epe1 prevents unregulated assembly and disassembly of heterochromatin. EMBO J 26, 4670–4682, doi:10.1038/sj.emboj.7601892 (2007). [DOI] [PMC free article] [PubMed] [Google Scholar]
- 14.Wang J et al. Epe1 recruits BET family bromodomain protein Bdf2 to establish heterochromatin boundaries. Genes Dev 27, 1886–1902, doi:10.1101/gad.221010.113 (2013). [DOI] [PMC free article] [PubMed] [Google Scholar]
- 15.Zofall M & Grewal SI Swi6/HP1 recruits a JmjC domain protein to facilitate transcription of heterochromatic repeats. Mol Cell 22, 681–692, doi:10.1016/j.molcel.2006.05.010 (2006). [DOI] [PubMed] [Google Scholar]
- 16.Piao L et al. Automethylation of SUV39H2, an oncogenic histone lysine methyltransferase, regulates its binding affinity to substrate proteins. Oncotarget 7, 22846–22856, doi:10.18632/oncotarget.8072 (2016). [DOI] [PMC free article] [PubMed] [Google Scholar]
- 17.Min J, Zhang X, Cheng X, Grewal SI & Xu RM Structure of the SET domain histone lysine methyltransferase Clr4. Nat Struct Biol 9, 828–832, doi:10.1038/nsb860 (2002). [DOI] [PubMed] [Google Scholar]
- 18.Zhang X et al. Structural basis for the product specificity of histone lysine methyltransferases. Mol Cell 12, 177–185 (2003). [DOI] [PMC free article] [PubMed] [Google Scholar]
- 19.Li Y et al. Structural basis for activity regulation of MLL family methyltransferases. Nature 530, 447–452, doi:10.1038/nature16952 (2016). [DOI] [PMC free article] [PubMed] [Google Scholar]
- 20.Moritz LE & Trievel RC Structure, mechanism, and regulation of polycomb repressive complex 2. J Biol Chem, doi:10.1074/jbc.R117.800367 (2017). [DOI] [PMC free article] [PubMed] [Google Scholar]
- 21.Wang J, Reddy BD & Jia S Rapid epigenetic adaptation to uncontrolled heterochromatin spreading. Elife 4, doi:10.7554/eLife.06179 (2015). [DOI] [PMC free article] [PubMed] [Google Scholar]
- 22.Volpe TA et al. Regulation of heterochromatic silencing and histone H3 lysine-9 methylation by RNAi. Science 297, 1833–1837 (2002). [DOI] [PubMed] [Google Scholar]
- 23.Wu H et al. Structural biology of human H3K9 methyltransferases. PLoS One 5, e8570, doi:10.1371/journal.pone.0008570 (2010). [DOI] [PMC free article] [PubMed] [Google Scholar]
- 24.Southall SM, Wong PS, Odho Z, Roe SM & Wilson JR Structural basis for the requirement of additional factors for MLL1 SET domain activity and recognition of epigenetic marks. Mol Cell 33, 181–191, doi:10.1016/j.molcel.2008.12.029 (2009). [DOI] [PubMed] [Google Scholar]
- 25.Bintu L et al. Dynamics of epigenetic regulation at the single-cell level. Science 351, 720–724, doi:10.1126/science.aab2956 (2016). [DOI] [PMC free article] [PubMed] [Google Scholar]
- 26.Hathaway NA et al. Dynamics and memory of heterochromatin in living cells. Cell 149, 1447–1460, doi:10.1016/j.cell.2012.03.052 (2012). [DOI] [PMC free article] [PubMed] [Google Scholar]
- 27.Morgan DO Principles of CDK regulation. Nature 374, 131–134, doi:10.1038/374131a0 (1995). [DOI] [PubMed] [Google Scholar]
- 28.Shan CM et al. A histone H3K9M mutation traps histone methyltransferase Clr4 to prevent heterochromatin spreading. Elife 5, doi:10.7554/eLife.17903 (2016). [DOI] [PMC free article] [PubMed] [Google Scholar]
- 29.Bahler J et al. Heterologous modules for efficient and versatile PCR-based gene targeting in Schizosaccharomyces pombe. Yeast 14, 943–951 (1998). [DOI] [PubMed] [Google Scholar]
- 30.Iglesias N et al. Ubiquitin-mediated mRNP dynamics and surveillance prior to budding yeast mRNA export. Genes Dev 24, 1927–1938, doi:10.1101/gad.583310 (2010). [DOI] [PMC free article] [PubMed] [Google Scholar]
- 31.Ting L, Rad R, Gygi SP & Haas W MS3 eliminates ratio distortion in isobaric multiplexed quantitative proteomics. Nat Methods 8, 937–940, doi:10.1038/nmeth.1714 (2011). [DOI] [PMC free article] [PubMed] [Google Scholar]
- 32.McAlister GC et al. MultiNotch MS3 enables accurate, sensitive, and multiplexed detection of differential expression across cancer cell line proteomes. Anal Chem 86, 7150–7158, doi:10.1021/ac502040v (2014). [DOI] [PMC free article] [PubMed] [Google Scholar]
- 33.Paulo JA, O’Connell JD & Gygi SP A Triple Knockout (TKO) Proteomics Standard for Diagnosing Ion Interference in Isobaric Labeling Experiments. Journal of the American Society for Mass Spectrometry 27, 1620–1625, doi:10.1007/s13361-016-1434-9 (2016). [DOI] [PMC free article] [PubMed] [Google Scholar]
- 34.Huttlin EL et al. A tissue-specific atlas of mouse protein phosphorylation and expression. Cell 143, 1174–1189, doi:10.1016/j.cell.2010.12.001 (2010). [DOI] [PMC free article] [PubMed] [Google Scholar]
- 35.Beausoleil SA, Villen J, Gerber SA, Rush J & Gygi SP A probability-based approach for high-throughput protein phosphorylation analysis and site localization. Nature biotechnology 24, 1285–1292, doi:10.1038/nbt1240 (2006). [DOI] [PubMed] [Google Scholar]
- 36.Paulo JA, O’Connell JD, Gaun A & Gygi SP Proteome-wide quantitative multiplexed profiling of protein expression: carbon-source dependency in Saccharomyces cerevisiae. Mol Biol Cell 26, 4063–4074, doi:10.1091/mbc.E15-07-0499 (2015). [DOI] [PMC free article] [PubMed] [Google Scholar]
- 37.Wong KH, Jin Y & Moqtaderi Z Multiplex Illumina sequencing using DNA barcoding Current protocols in molecular biology / edited by Ausubel Frederick M. ... [et al. ] Chapter 7, Unit 7 11, doi:10.1002/0471142727.mb0711s101 (2013). [DOI] [PubMed] [Google Scholar]
- 38.Morin A et al. Collaboration gets the most out of software. Elife 2, e01456, doi:10.7554/eLife.01456 (2013). [DOI] [PMC free article] [PubMed] [Google Scholar]
- 39.Kabsch W Xds. Acta crystallographica. Section D, Biological crystallography 66, 125–132, doi:10.1107/S0907444909047337 (2010). [DOI] [PMC free article] [PubMed] [Google Scholar]
- 40.Winn MD et al. Overview of the CCP4 suite and current developments. Acta crystallographica. Section D, Biological crystallography 67, 235–242, doi:10.1107/S0907444910045749 (2011). [DOI] [PMC free article] [PubMed] [Google Scholar]
- 41.McCoy AJ et al. Phaser crystallographic software. J Appl Crystallogr 40, 658–674, doi:10.1107/S0021889807021206 (2007). [DOI] [PMC free article] [PubMed] [Google Scholar]
- 42.Adams PD et al. PHENIX: a comprehensive Python-based system for macromolecular structure solution. Acta crystallographica. Section D, Biological crystallography 66, 213–221, doi:10.1107/S0907444909052925 (2010). [DOI] [PMC free article] [PubMed] [Google Scholar]
- 43.Emsley P, Lohkamp B, Scott WG & Cowtan K Features and development of Coot. Acta crystallographica. Section D, Biological crystallography 66, 486–501, doi:10.1107/S0907444910007493 (2010). [DOI] [PMC free article] [PubMed] [Google Scholar]
Associated Data
This section collects any data citations, data availability statements, or supplementary materials included in this article.
Supplementary Materials
Reporting Summary
Supplementary Figure 1 The uncropped gels for panels used in Figure 1a, b, c, e, f, j, Figure 3a, b, Extended Data Figure 1b, f, g, and Extended Data Figure 5a, b, c.
Supplementary Table 1 H3K9me peak in the indicated strains containing one or two copies of clr4 wt or mutants are summarized.
Supplementary Table 2 H3K9me peak in the indicated epe1+ and epe1Δ genotypes are summarized.
Supplementary Table 3 A list of fission yeast S. pombe strains used in this study.
Supplementary Table 4 A list of plasmids used in this study.
Supplementary Table 5 Quantitative mass spectrometry analysis of Clr4 K455 methylation states in crystal.
Supplementary Table 6 Crystallographic data collection and refinement statistics.


