

In this study, Ravichandran et al. induced extremely high rates of chromosome missegregation in yeast to determine how cells adapt to chromosomal instability (CIN) over time. They show that adaptation to CIN initially occurs through many different individual chromosomal aneuploidies, and their findings provide new insights into how cells adapt by obtaining specific complex aneuploid karyotypes in the presence of CIN.
Keywords: chromosomes, aneuploidy, chromosomal instability, CIN, adaptation, chromosomal passenger complex
Abstract
Cells that contain an abnormal number of chromosomes are called aneuploid. High rates of aneuploidy in cancer are correlated with an increased frequency of chromosome missegregation, termed chromosomal instability (CIN). Both high levels of aneuploidy and CIN are associated with cancers that are resistant to treatment. Although aneuploidy and CIN are typically detrimental to cell growth, they can aid in adaptation to selective pressures. Here, we induced extremely high rates of chromosome missegregation in yeast to determine how cells adapt to CIN over time. We found that adaptation to CIN occurs initially through many different individual chromosomal aneuploidies. Interestingly, the adapted yeast strains acquire complex karyotypes with specific subsets of the beneficial aneuploid chromosomes. These complex aneuploidy patterns are governed by synthetic genetic interactions between individual chromosomal abnormalities, which we refer to as chromosome copy number interactions (CCNIs). Given enough time, distinct karyotypic patterns in separate yeast populations converge on a refined complex aneuploid state. Surprisingly, some chromosomal aneuploidies that provided an advantage early on in adaptation are eventually lost due to negative CCNIs with even more beneficial aneuploid chromosome combinations. Together, our results show how cells adapt by obtaining specific complex aneuploid karyotypes in the presence of CIN.
Accurate distribution of replicated genetic material to daughter cells is one of the most fundamental requirements of cell division. Errors in chromosome segregation lead to the loss or gain of chromosomes, a state called aneuploidy. In many cases, cancer cells have highly aberrant chromosome copy numbers and extremely complex karyotypes (Mitelman Database of Chromosome Aberrations and Gene Fusions in Cancer, http://cgap.nci.nih.gov/Chromosomes/Mitelman). The complexity of these cancer karyotypes makes it difficult to retroactively piece together the steps in their formation.
Aneuploidy is generally associated with decreased cellular fitness. Experiments using yeast or human cell lines engineered with specific aneuploidies have revealed that doubling the copy number of single chromosomes leads to increased expression of nearly all of the genes on that chromosome (Torres et al. 2007; Stingele et al. 2012). This creates imbalances in the expression levels between genes on different chromosomes. These imbalances lead to proteotoxic stress and increased rates of mutation and chromosome missegregation (Sheltzer et al. 2011; Oromendia et al. 2012; Zhu et al. 2012; Passerini et al. 2016).
In contrast, in certain cases, aneuploidy provides a selective advantage. Specific aneuploidies have been shown to provide resistance to stress conditions in yeast (Selmecki et al. 2006; Chen et al. 2012). Aneuploidy can also act as a suppressor of certain mutations (Rancati et al. 2008; Liu et al. 2015; Ryu et al. 2016). Although aneuploid chromosomes alter the stoichiometry of many genes, the selective advantage can often be attributed to the change in expression of one or two genes (Hughes et al. 2000; Rancati et al. 2008; Ryu et al. 2016). This indicates that, similar to other types of mutations, aneuploidy is typically detrimental but can be beneficial to cellular growth in specific cases. These results also suggest that the selective force on aneuploidy for a particular chromosome is determined mainly by the specific advantage of altered expression of a few genes. These advantages are tempered by the general disadvantage of expression imbalances for many other genes.
Aneuploidy arises from errors in cell division that result in the uneven distribution of the chromosomes between the two daughter cells. The increased rate of the formation of aneuploidy resulting from chromosome missegregation errors is called chromosomal instability (CIN). Importantly, both aneuploidy and CIN are hallmarks of cancer and are indicators of poor prognosis (for review, see Sansregret et al. 2018). Some cancer cell lines have chromosome segregation errors as high as 1% per chromosome per cell division, which would be detrimental to the growth of normal cells (Thompson and Compton 2008). Little is known about how cancer cells adapt to thrive with high levels of CIN.
In this study, we induced extremely high rates of chromosome missegregation in yeast to determine how they adapt to CIN over time. We found that the yeast adapted primarily through the accumulation of beneficial aneuploidies of many different chromosomes. The adapted yeast acquired complex karyotypes that consisted of specific subsets of the beneficial aneuploid chromosomes. By engineering the observed complex aneuploidy patterns in the absence of CIN, we demonstrate that distinct patterns of complex karyotypes are created by genetic interactions between individual aneuploid chromosomes. Given enough time to adapt, divergent complex karyotype patterns eventually converge on an “optimal” complex karyotype that maximizes the selective advantage of individual chromosomal aneuploidies while minimizing the negative genetic interactions between aneuploidies. This process often involves the loss of beneficial aneuploidies in order to gain other, incompatible aneuploid chromosomes. Overall, our results show that complex aneuploid karyotypes result from CIN in a stepwise manner that is heavily influenced by genetic interactions between aneuploid chromosomes.
Results
Yeast cells adapt to CIN through frequent accumulation of specific aneuploidies
To induce high rates of CIN in haploid budding yeast, we deleted the Survivin homolog Bir1. Bir1 is a member of the chromosomal passenger complex (CPC), which prevents chromosome missegregation by detecting and correcting improper connections between chromosomes and the mitotic spindle. Following tetrad dissection of a BIR1/bir1Δ heterozygous diploid, only ∼10% of the bir1Δ spores are able to form colonies (Sandall et al. 2006). The cells in the surviving 10% of colonies have extremely high rates of chromosome missegregation, making bir1Δ a strong candidate for inducing complex aneuploidy (Campbell and Desai 2013). To obtain strains in a semistable state amenable to further analysis, >100 isolated cells from 19 individual bir1Δ spores were allowed to adapt over 10 clonal expansions by selecting a single colony every 2 d. These haploid adapted strains, now called bir1Δ-ad, grow faster than the bir1Δ strains prior to adaptation; however, their growth rates remain lower than that of wild-type strains (Fig. 1A,B). To directly measure the rate of chromosome missegregation of the bir1Δ strains after adaptation, we monitored a fluorescently labeled chromosome by live microscopy. The missegregation rate of chromosome 4 for a subset of the bir1Δ-ad strains was found to vary from 0.5% to 4.2% per cell division (Supplemental Fig. S1A). In contrast, chromosome missegregation rates for four unadapted strains were significantly higher, ranging from 2.8% to 7.7% (P = 0.0013). As an additional assay for CIN, we measured the growth of the bir1Δ-ad strains on plates with a moderate amount of the microtubule-depolymerizing drug benomyl (10 µg/mL). The adapted strains maintained strong sensitivity to the drug (Supplemental Fig. S1B,C). Taken together, the above results demonstrate the adapted bir1Δ yeast display a partial decrease in CIN rates yet maintain a strong CIN phenotype.
Figure 1.
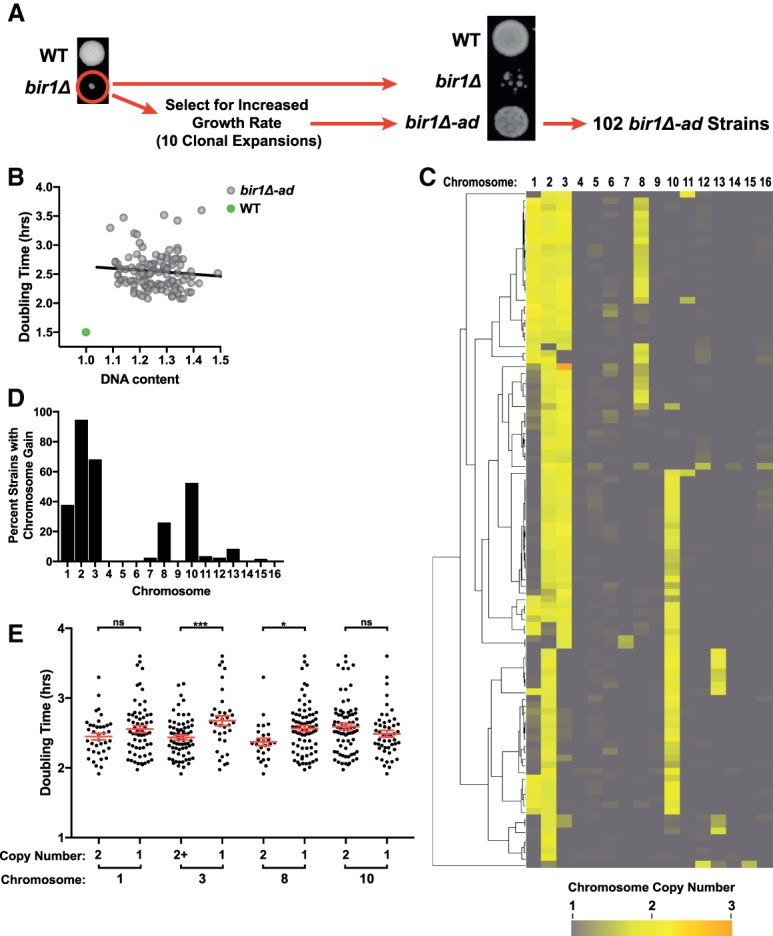
Adaptation to BIR1 deletion generates complex aneuploid karyotypes. (A) Schematic for the generation of 102 strains adapted to BIR1 deletion (bir1Δ-ad). At the left, colonies from wild-type and bir1Δ spores are shown 4 d after tetrad dissection of a BIR1/ bir1Δ diploid onto rich (YPA plus 2% dextrose [YPAD]) medium. The bir1Δ cells were then grown for ∼200 generations through 10 clonal expansions. At the right, equal optical densities of a wild-type strain, a bir1Δ strain, and its corresponding bir1Δ-ad strain were spotted on YPAD plates. (B) Lack of correlation between growth rates and degree of aneuploidy for the bir1Δ-ad strains. Doubling times in liquid YPAD of all 102 bir1Δ-ad strains were measured by optical density and plotted against the DNA content as measured by flow cytometry. Pearson's correlation coefficient = −0.09. Two-tailed P-value = 0.38. (C) Heat map visualization of chromosome copy number data for the bir1Δ-ad strains as measured by read counts from whole-genome sequencing. Each of the 102 bir1Δ-ad strains is represented as a row and clustered to show groupings of karyotype patterns. (D) Frequency of aneuploidy for each chromosome in the haploid bir1Δ-ad strains based on binarization of the data in C. (E) Comparison of the growth rates of haploid bir1Δ-ad strains with and without extra copies of chromosomes 1, 3, 8, and 10. The mean doubling time and the standard error of each group are shown. (*) P ≤ 0.01; (***) P ≤ 0.0001; (ns) not significant, unpaired t-test.
To determine the degree of aneuploidy in the adapted strains, the DNA content of the bir1Δ-ad strains was measured by flow cytometry. All 102 adapted strains had substantially increased DNA content, with increases ranging from 10% to 40% over wild type, demonstrating large amounts of aneuploidy consistent with approximately one to six extra chromosomes in each strain. Although the bir1Δ-ad strains display a remarkable heterogeneity in both growth rate and degree of aneuploidy, there was no clear correlation between the two (Fig. 1B). This lack of correlation indicates that there is not a simple relationship between the induced CIN, the resultant aneuploidy, and their impact on cellular fitness.
To determine the degree to which the growth defects in the bir1Δ-ad strains result from either ongoing CIN (from the continued lack of Bir1) or the resulting aneuploidy, we added the BIR1 gene back into the adapted strains via single-copy insertions. BIR1 add-back fully rescued the benomyl sensitivity for nearly all of the adapted strains, demonstrating a rescue of the CIN phenotype (Supplemental Fig. S1B,C). The growth rates of the add-back strains only partially recovered with readdition of the BIR1 gene, indicating that aneuploidy also contributes directly to the growth defects in the bir1Δ-ad strains (Supplemental Fig. S1D). Most of the bir1Δ-ad strains had decreased levels of aneuploidy following BIR1 add-back (Supplemental Fig. S1E), suggesting that the absence of BIR1 was an ongoing source of selection for specific aneuploidies. To specifically assess the effect of aneuploidy on the cellular fitness, we analyzed only those strains that maintained similar levels of aneuploidy after BIR1 add-back (28 out of 102 bir1Δ-ad strains) (Supplemental Fig. S1E). These aneuploid BIR1 add-back strains showed a partial (∼50% median) rescue in growth (Supplemental Fig. S1F). We conclude from these results that the growth defects in the bir1Δ-ad strains are caused by a combination of ongoing CIN as well as the resulting aneuploidy.
Disomy of different chromosomes can contribute directly to CIN adaptation
For detailed determination of the types of aneuploidy acquired in the adapted strains, their genomes were sequenced, and the relative chromosome copy numbers were determined from the read counts. The bir1Δ-ad strains frequently had extra copies of chromosomes 1, 2, 3, 8, and 10 (traditionally referred to as the roman numerals I, II, III, VIII, and X in yeast), each of which was seen in over a quarter of the strains (Fig. 1C,D). No chromosome rearrangements or large insertions or deletions were present in any of the adapted strains. Although nearly all of the strains acquired point mutations during adaptation (average of approximately two mutations per strain), the nonsynonymous mutations in coding regions were not significantly enriched for genes reported to be involved in CIN (P = 0.53). Of the genes mutated in bir1Δ-ad strains, 15.8% (30 of 190 genes) (Supplemental Table S3) were CIN genes, which is similar to the 14.5% of genes in the yeast genome (874 of 6000 genes). Additionally, no gene ontology (GO) terms were significantly enriched for in the list of genes mutated in the bir1Δ-ad strains (false discovery rate [FDR] < 0.05). We additionally identified 41 heterozygous gene mutations on disomic chromosomes (Supplemental Table S4). These mutations were also not significantly enriched for GO terms. The above result suggests that improved growth from adaptation was generally not a result of mutations in certain genes. Together, these results point to aneuploidy being the most substantial genomic alteration in the bir1Δ-ad strains.
To determine the degree to which the growth benefits from adaptation could be attributed to certain types of aneuploidy, we compared the doubling times of bir1Δ-ad strains with and without gains of chromosomes 1, 3, 8, and 10. There was an insufficient number of strains without chromosome 2 aneuploidy (six out of 102) to make a meaningful comparison (Fig. 1C). Adapted strains with gains of chromosomes 3 or 8 had significantly improved fitness over those that carry only one copy of those chromosomes (Fig. 1E). Chromosome 1 disomy was correlated with a small insignificant increase in fitness (P = 0.14). Surprisingly, disomy of chromosome 10 was not correlated with any increase in fitness despite over half of the adapted bir1Δ strains containing an extra copy of chromosome 10 (Fig. 1D,E). This discrepancy could be explained by one of the following: (1) Disomy of chromosome 10 in the background of BIR1 deletion is fitness-neutral, in which case, over a long enough period of time, half of the strains would be expected to have one copy, and half would have two, or (2) disomy of chromosome 10 provides an initial adaptive advantage that decreases with time. To test this second possibility, we engineered strains with individual disomies prior to removal of the BIR1 gene (Fig. 2A). Aneuploidy was induced via expression of a strong centromere-proximal galactose-inducible promoter and selected for by stochastic recombination events that restore the function of a selectable marker (Anders et al. 2009). BIR1 was subsequently lost by counterselection of the plasmid-linked URA3 gene with the drug 5-fluoroorotic acid (5-FOA) (Fig. 2A). Strains with disomy of chromosomes 2, 3, 8, and 10 had significantly increased growth relative to the euploid control on 5-FOA plates selecting for bir1Δ mutants (Fig. 2B). In contrast, a strain with disomy of chromosome 9, which was never observed in the adapted strains, had drastically impaired growth in the absence of BIR1. All five strains grew similarly on nonselective (BIR1+) plates. The increase in initial fitness following bir1Δ for the beneficial aneuploidies corresponded with a decrease in the missegregation rate of chromosome 4, indicating that disomy of these chromosomes partially suppresses the CIN phenotype (Fig. 2C). We conclude that high frequencies of certain chromosome gains in adapted bir1Δ strains, including chromosome 10, result from an initial benefit in fitness shortly after CIN initiation.
Figure 2.

Disomy of specific chromosomes provides an initial advantage to BIR1 deletion. (A) Schematic of a galactose-inducible system to engineer disomy of specific chromosomes prior to BIR1 deletion. Strains transformed with a construct (PGALCEN3 lys2::LEU2) and a minichromosome containing BIR1 and URA3 were grown in medium containing galactose to induce chromosome nondisjunction during cell division. Disomy of the desired chromosome was then selected for on minimal medium plates lacking leucine and lysine. Disomic strains for the chromosome of interest were grown on plates containing the drug 5-FOA to select for loss of the URA3 gene, creating bir1Δ yeast that are disomic for the chromosome of interest. (B) Tenfold dilution series of disomic strains on minimal medium plates with 5-FOA (selecting against URA3) or lacking uracil (selecting for URA3) plates. The graph shows the quantification of the growth of each strain after selection against BIR1 with 5-FOA. All values were normalized to the initially euploid strain. (*) P ≤ 0.05; (***) P ≤ 0.0001; (****) P ≤ 0.00001, unpaired t-test. (C) Missegregation rates of GFP-labeled chromosome 4 for bir1Δ strains from 5-FOA plates as in B. The total numbers of quantified segregation events (n) are indicated below the graph. See Supplemental Figure S1A for examples of segregation and missegregation events.
Chromosome 2 disomy had the strongest rescue of the bir1Δ phenotype and was the most frequent aneuploidy in the bir1Δ-ad strains, indicating that there is a gene or set of genes on that chromosome that contributes strongly to survival following BIR1 deletion. Notably, the gene for the CPC subunit Sli15 is on chromosome 2. We therefore put an additional copy of SLI15 on chromosome 5 to determine whether it would partially rescue the bir1Δ phenotype (Supplemental Fig. S2A). SLI15 duplication had levels of growth similar to chromosome 2 disomy immediately following BIR1 deletion (Supplemental Fig. S2B). Furthermore, adapted bir1Δ strains with SLI15 duplication had drastically reduced amounts of chromosome 2 disomy and significantly improved growth rates (Supplemental Fig. S2C,D). Sequencing of 12 SLI15-duplicated bir1Δ-ad strains showed that these strains still accumulated the other four frequent disomies seen in the original bir1Δ-ad strains (chromosomes 1, 3, 8, and 10) when chromosome 2 disomy is absent, demonstrating that the other four disomies are selected for independently of chromosome 2 (Supplemental Fig. S2E). Attempts to create bir1Δ strains with the sole copy of SLI15 on chromosome 5 failed to produce any viable spores. This indicates that SLI15 duplication is an essential initial step in adaptation to BIR1 deletion and is not possible on a chromosome whose disomy is associated with severe growth defects (Torres et al. 2007). We therefore relocated SLI15 as the only copy on a chromosome that we knew could be duplicated: chromosome 8. None of the adapted relocated SLI15 strains had disomy of chromosome 2 (zero out of seven strains) (Supplemental Fig. S2F,G), further demonstrating that increased expression of Sli15 is the sole basis behind the frequent disomy of chromosome 2 in bir1Δ-ad strains.
Positive and negative correlations occur between chromosome copy number alterations
If disomy of chromosome 10 gives an initial growth advantage, why does it not correlate with increased fitness in the adapted strains? Up to this point, we analyzed each chromosomal aneuploidy independently. However, 96% of the bir1Δ-ad strains had complex karyotypes, as defined by containing more than one chromosome copy number alteration (Fig. 1C). We next determined whether there were any correlations between the copy numbers of different chromosomes. The most striking pattern is a negative correlation between disomy of chromosomes 8 and 10. Seventy-six percent (78 of 102) of adapted strains have an elevated copy number of either chromosome 8 or 10, but only one strain has an increased copy number of both chromosomes (P = 2.6 × 10⁻⁹, hypergeometric test) (Fig. 3A). Conversely, a strong positive correlation is seen between chromosomes 8 and 3. Ninety-two percent of strains (24 of 26) with chromosome 8 gains have increases in chromosome 3 as well, while only 59% (45 of 76) of strains with a single copy of chromosome 8 have an extra copy of chromosome 3 (P = 0.001, hypergeometric test) (Fig. 3B). Comprehensive pairwise correlations between all aneuploid chromosomes in the bir1Δ-ad strains revealed five highly significant (P < 0.001) correlations (Fig. 3C). We conclude that aneuploidies of individual chromosomes do not act independently, which could help explain why aneuploidy of some chromosomes, such as chromosome 10, improved initial growth following BIR1 deletion (Fig. 2B) but did not correlate with increased fitness in the adapted strains (Fig. 1E).
Figure 3.
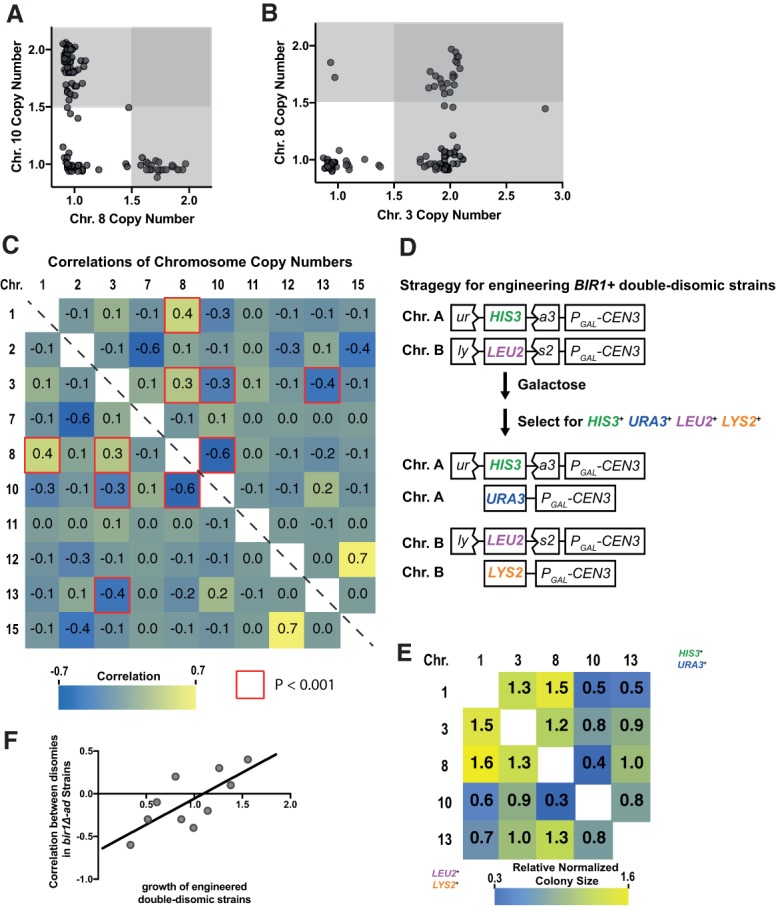
Genetic interactions between whole-chromosome disomies dictate patterns in complex aneuploidy. (A,B) Scatter plot of specific chromosome copy numbers of 102 bir1Δ-ad strains demonstrating positive (B) and negative (A) correlations between different chromosomal disomies. Copy number data are from read frequencies as in Figure 1C. The darker-gray regions contain strains that are aneuploid for both of the plotted chromosomes. (C) Heat map of the correlations between chromosome copy numbers in the 102 haploid bir1Δ-ad strains. Only correlations between chromosomes where aneuploidy was observed are shown. Each cell of the matrix contains the correlation coefficient between the two chromosomes written in the row and column. The red highlighted border represents correlations with P < 0.001 in the hypergeometric test. (D) Schematic of a system to engineered strains (BIR1+) that harbor two chromosome disomies. Strains were transformed with the construct PGAL-CEN3 ura3::HIS3 on one chromosome (chromosome A) and PGAL-CEN3 lys2::LEU2 on another chromosome (chromosome B). Chromosome nondisjunction was induced with galactose, and disomy of both chromosomes was selected for with all four auxotrophic markers (URA3, HIS3, LYS2, and LEU2). (E) Relative colony sizes of double-disomic strains on YPAD plates were normalized to the other values in their respective rows and columns. Colony sizes without normalization are shown in Supplemental Figure S2I. (F) Comparison of the correlation coefficients of the chromosome copy numbers in bir1Δ-ad strains (from C) and the relative fitness of engineered double-disomic strains (from E). Relative values are the average of the two values in E (column:row and row:column for each chromosome pair). Pearson's correlation coefficient = 0.73. Two-tailed P-value = 0.016.
Chromosome copy number correlations result from genetic interactions between aneuploid chromosomes
The strong anti-correlation between disomy of chromosomes 8 and 10 could result from functional redundancy in their adaptive advantage to BIR1 deletion, resulting in a loss of positive selection for the second disomic chromosome. Alternatively, combination of both disomies could result in a synthetic negative genetic interaction independently of BIR1 deletion. To test for genetic interactions between specific pairs of disomic chromosomes, we modified the aneuploidy induction system to engineer two chromosomal aneuploidies simultaneously (Fig. 3D). After induced missegregation via addition of galactose, disomy of both chromosomes was selected for on plates lacking histidine, uracil, leucine, and lysine. We engineered pairwise combinations of all five chromosomes that showed significant positive or negative copy number correlations in the bir1Δ-ad strains (Fig. 3E). The presence of an extra copy of both chromosomes was confirmed by quantitative PCR (qPCR). Colony sizes for each pair were measured and normalized to account for growth differences in individual aneuploidies (Fig. 3E; Supplemental Fig. S2I). Colony sizes ranged from 70% smaller to 60% larger than expected, demonstrating strong positive and negative genetic interactions between aneuploid chromosomes. These genetic interactions were not simply a result of increasing amounts of extra DNA, as there was no significant correlation between combined chromosome size and relative growth for the chromosome combinations that we tested (P = 0.48) (Supplemental Fig. S2J). We call these whole-chromosome-level genetic interactions chromosome copy number interactions (CCNIs).
To determine the degree to which CCNIs could explain the complex karyotype patterns observed in the bir1Δ-ad strains, we directly compared the colony sizes of the engineered double-disomic strains (Fig. 3E) with the chromosome copy number correlations in the bir1Δ-ad strains (Fig. 3C). The combination of disomies with the highest significant positive correlation in the bir1Δ-ad strains, chromosomes 1 and 8, had the largest relative colony sizes in engineered double-disomic strains. Similarly, the disomy pair with the highest significant negative correlation, chromosomes 8 and 10, had the smallest relative colony sizes (Fig. 3C,E,F; Supplemental Fig. S3A). Results were similar if the selection markers used for the two chromosomes were reversed (Fig. 3E). No negative interactions were seen with chromosome 2 disomy (Supplemental Fig. S2H,I). Overall, the correlation between growth of engineered disomic pairs and frequency of co-occurrence in bir1Δ-ad strains was significant (r = 0.73, P = 0.016) (Fig. 3F), demonstrating that aneuploidy patterns observed in complex karyotypes are directly affected by positive and negative genetic interactions between specific aneuploid chromosome pairs. This indicates that CCNIs play a key role in governing the formation of complex aneuploid karyotypes.
The complexity of aneuploidy correlates with the severity of CIN induction
We next tested how varying the level of induced CIN affects the resulting complex aneuploidy. To alter the amount of CIN induced, we used mutants that affect different aspects of the kinetochore–microtubule attachment error correction pathway (Fig. 4A). Deletions in NBL1, BUB1, and SGO1 (Borealin, BUB1, and Shugoshin in humans) were adapted via clonal expansion in the same manner as the BIR1 deletion strains. The growth rates of adapted strains demonstrate that bir1Δ-ad and nbl1Δ-ad have the strongest growth defects, followed by bub1Δ-ad strains, and the sgo1Δ-ad strains had the weakest phenotype (Fig. 4B). These results are consistent with previously published measurements of missegregation rates for mutants in BIR1 and SGO1 (Storchova et al. 2011; Campbell and Desai 2013). Whole-genome sequencing to determine the chromosome copy numbers for the adapted strains revealed very similar aneuploidy patterns for all four deletion mutants. The four mutants resulted in aneuploidy predominantly in the same five chromosomes (chromosomes 1, 2, 3, 8, and 10) (Fig. 4C,D). Additionally, the negative correlation between chromosome 8 and 10 disomy is also observed in these strains, although one sgo1Δ-ad strain did display disomy of both chromosomes (Fig. 4C). Although the general patterns of aneuploidy remained the same in the different adapted deletion strains, the degree of aneuploidy varied. nbl1Δ-ad and bir1Δ-ad had very similar increases in aneuploidy, whereas bub1Δ-ad and sgo1Δ-ad strains averaged comparatively less aneuploidy (Fig. 4E; Supplemental Fig. S3B). This trend correlates well with the degree of CIN observed in these strains. Together, these results suggest that increased karyotype complexity can result directly from elevated rates of chromosome missegregation.
Figure 4.

The degree of aneuploidy correlates with the severity of induced CIN. (A) Cartoon of the CPC and the regulators of its localization to chromatin. (B) Cell doubling times for each of the indicated strain types. (C) Heat map visualization of the clustered chromosome copy numbers of the nbl1Δ-ad, bub1Δ-ad, and sgo1Δ-ad strains. (D) Plot of the percentage of strains with a gain of a specific chromosome based on binarization of the data shown in C and Figure 1C. (E) Percentage change in overall DNA content as measured by taking the binarized copy number values of each chromosome, subtracting 1, multiplying each by the fraction of the genome represented by that chromosome, and then summing all of the chromosomes. Mean values and the standard errors are in red. (***) P ≤ 0.0001; (****) P < 0.00001.
Ploidy greatly affects the patterns of chromosome copy number correlations
We next sought to determine how changes in ploidy affect patterns in complex karyotypes. Compared with haploid genomes, diploids have a greater number of potential aneuploidy types to exploit for adaptation, such as chromosome loss (monosomy) and gain (trisomy) of only 50% more copies of a chromosome. In theory, this would provide more avenues to fine-tune adaptation through aneuploidy. To test this, we generated 25 diploid bir1Δ yeast strains, adapted them through clonal expansion, and subjected them to whole-genome sequencing (Fig. 5A). Similar to the adapted haploid strains, the diploids frequently accumulated extra copies of chromosomes 2, 3, 8, and 10 (Fig. 5B). In addition, the diploids had a much higher frequency of chromosome 13 gain (64% in diploids vs. 8% in haploids) (Figs. 1D, 5B). Although chromosomes 2, 3, 8, and 10 all had instances of tetrasomy, this was not the case for chromosome 13 (Fig. 5A). These data suggest that a 50% increase in chromosome 13 copy number provides a much better balance of growth benefit to fitness deficit when compared with a 100% increase in bir1Δ-ad strains. In addition to chromosome gains, losses of chromosomes 1 and 9 were also observed. Intriguingly, chromosome 1 was lost in some strains and gained in others, suggesting that the presence or absence of additional copies of this chromosome is largely inconsequential in adaptation to BIR1 deletion. The percentage change of DNA content (normalized to the basal ploidy) for bir1Δ-ad strains was very similar for haploids and diploids (Fig. 5C), demonstrating that the aneuploidy burden that is tolerated by a cell scales with its ploidy. Curiously, there was no significant difference between the mean doubling times of bir1Δ-ad haploids and diploids despite the diploids having more avenues for adaptation (Fig. 5D). Overall, these data show that initial ploidy is an important determinant in complex aneuploidy patterns.
Figure 5.

Ploidy greatly affects chromosome copy number correlations. (A) Heat map visualization of chromosome copy number values for diploid bir1Δ-ad strains clustered by similarity. Each of the 25 diploid bir1Δ-ad strains is represented as a row. (B) Frequency of the aneuploid chromosomes in the diploid bir1Δ-ad strains from binarization of the data shown in A. (C) Percentage change in overall DNA content as measured by taking the binarized copy number values of each chromosome, subtracting the basal ploidy 2, multiplying each by the fraction of the genome represented by that chromosome, and then summing the absolute values for all of the chromosomes. There was no significant difference between the two groups. P = 0.16. (D) Cell doubling times for the haploid and diploid bir1Δ-ad strains. There was no significant difference between the two groups. P = 0.91. (E) Heat map of the correlations between chromosome copy numbers for the 25 diploid bir1Δ-ad strains. Only correlations between chromosomes where aneuploidy was observed are shown. Each cell of the matrix contains the correlation coefficient between the two chromosomes written in the rows and columns. The red highlighted border represents correlations that had a P < 0.05 in the hypergeometric test. (F) Scatter plot of specific chromosome copy numbers of 25 diploid bir1Δ-ad strains demonstrating a negative correlation between monosomy of chromosome 9 and trisomy of chromosome 13. Copy number data are from read frequencies as in E. The darker-gray region contains strains that are aneuploid for both of the plotted chromosomes. Mean values and the standard error of each group are indicated in red with error bars.
We next determined the pairwise correlations between specific chromosome aneuploidy types in diploid bir1Δ-ad strains (Fig. 5E). Surprisingly, the most significant negative correlation in haploids, between gain of chromosomes 8 and 10, was not present in the diploids. Instead, the most significant correlations are between the loss of chromosome 9 and the gain of chromosome 10 or 13 (P = 0.003 and P = 7 × 10⁻⁵, respectively). Although 92% (23 out of 25) of strains had either chromosome 13 gain or chromosome 9 loss, none of them had both (Fig. 5E,F). As with chromosomes 8 and 10 in haploids, the anti-correlation between chromosome 13 trisomy and chromosome 9 monosomy is associated with a negative CCNI. The growth of cells engineered with both trisomy of chromosome 13 and monosomy of chromosome 9 was approximately half the size of those with chromosome 9 monosomy alone (P < 0.0001, Supplemental Fig. S3C). This demonstrates that CCNIs also play a role in shaping complex karyotypes with a diploid base ploidy. We conclude that chromosome copy number correlations and CCNIs are observed in multiple ploidy states, but the patterns change dramatically.
Chromosome copy number correlations are seen in cancer karyotypes
To determine whether cancer karyotypes have patterns similar to those that we observed in adapted CIN yeast strains, we analyzed competitive genome hybridization (CGH) data from The Cancer Genome Atlas (TCGA) database. Cancer karyotypes for 15 different cancer types were analyzed with a matrix of pairwise correlations between different aneuploidies. The cancers with the five highest percentages of predominantly whole-chromosome or whole-arm complex aneuploidy were analyzed in higher detail (Fig. 6A; Supplemental Fig. S4; Supplemental Table S2). Strong correlations were observed in all five cancer types (Fig. 6A; Supplemental Fig. S4). Correlation patterns in lower-grade glioma (LGG) stood out as being especially similar to the bir1Δ-ad strains, with both strong positive and negative correlations for a subset of chromosomes (Fig. 6A,B). LGG karyotypes largely fell into two categories: those with (1) loss of 1p and 19q or (2) gain of chromosome 7 and loss of chromosome 10 (Fig. 6B). The combined loss of 1p and 19q is the result of a frequent translocation between those two chromosomes. Intriguingly, strains that harbor this translocation almost never have a gain of chromosome 7 or loss of chromosome 10 (Fig. 6B). Other common chromosome aberrations such as loss of chromosome 18 did not have any strong correlations, suggesting specificity in the negative correlation between the two main karyotype classes. We conclude that chromosome copy number correlations are also present in cancer karyotypes and may reflect genetic interactions between different aneuploid chromosomes (CCNIs).
Figure 6.

Identification of chromosome copy number correlations in brain LGG tumors. (A) Visualization of the chromosome arm karyotypes from brain LGG tumor samples. Cancer karyotype data was acquired from the CGH data from the TCGA database. Each of the 193 LGG karyotypes is represented as a row, with the column indicating the chromosome copy number of chromosome arms. Only chromosome arms where aneuploidy was present in >10% of the tumor samples are shown. (B) Pairwise correlation coefficients for chromosome arm aneuploidy are shown as a heat map. The frequency of each aberration is shown in green as a percentage. The red highlighted border indicates P < 5 × 10⁻⁷ in the hypergeometric test. See Supplemental Figure S4 for similar analysis of four additional tumor types.
Additional competitive adaptation of bir1Δ-ad strains leads to convergent optimized complex karyotypes
Given that certain patterns in the karyotypes of bir1Δ-ad strains had strong correlations with increased growth rates, it is somewhat surprising that not all of the strains adapted to have the most advantageous patterns. We reasoned that perhaps if the adapted bir1Δ strains were given more time to adapt in a more competitive environment, they might converge on an “ideal” karyotype. Alternatively, further adaptation could allow the strains to find alternate ways to independently obtain the advantages conferred by the aneuploidy and then eliminate the disadvantages by returning to the euploid state (Yona et al. 2012). We therefore selected 16 haploid and 16 diploid strains for further adaptation for an additional ∼200 generations in rich liquid medium (Fig. 7A). We refer to these further adapted strains as bir1Δ-ad2. The adaptation in liquid medium did not greatly affect the CIN phenotype of the further adapted strains, as the 16 bir1Δ-ad2 diploids had little to no change in benomyl sensitivity when compared with the bir1Δ-ad strains (Supplemental Fig. S5A). In the haploid bir1Δ-ad2 strains, aneuploidy of chromosomes 8 and 10 was almost completely lost (Fig. 7B,C). This resulted in strains with more similar karyotypes, as the pooled standard deviation decreased from 0.18 to 0.13 after liquid adaptation. In contrast, levels for chromosomes 1 and 2 were largely unchanged. Notably, all four strains that started with chromosome 10 disomy and chromosome 3 monosomy lost a copy of chromosome 10 and gained a copy of chromosome 3. This suggests that, in haploids, the “optimal” bir1Δ karyotype is disomy of chromosomes 2 and 3, with chromosome 10 disomy being excluded due to the negative CCNI between aneuploidy of chromosomes 3 and 10 (Fig. 3C,E). Interestingly, the diploid bir1Δ-ad2 strains became much more homogenous in their karyotypes, with a decrease in pooled standard deviation from 0.36 to 0.17 after liquid adaptation. Trisomy of chromosomes 2, 3, 10, and 13 is now present in nearly all of the further adapted strains (Fig. 7D,E). Strikingly, all three bir1Δ-ad strains that started off with chromosome 9 monosomy regained a copy of chromosome 9 and acquired an extra copy of chromosome 13. Both of these changes occurred within 1 wk of each other in all three strains and occurred within the first 2 wk of liquid adaptation (Supplemental Fig. S5B). We conclude that certain types of aneuploidy that give an initial growth advantage, such as gain of chromosome 10 in haploids and loss of chromosome 9 in diploids, will eventually be lost due to the comparatively better fitness increases of other, incompatible types of aneuploidy (chromosome 3 gain in haploids and chromosome 13 gain in diploids). Together, these results suggest that although there are often many different, sometimes conflicting paths to obtaining an ideal karyotype, cell populations with high levels of CIN will eventually converge on a common complement of aneuploid chromosomes.
Figure 7.

Additional adaptation leads to convergence on “ideal” karyotypes in BIR1 deletion strains. (A) Graphical representation of the adaptation process on solid (see Fig. 1A) followed by liquid medium. On solid medium, the bir1Δ strains were struck out for single colonies and allowed to grow for 2 d at 30°C. After 10 rounds of growth on solid medium, a subset of bir1Δ-ad strains, selected to represent a diverse set of karyotypes, was grown for an additional ∼200 generations in liquid medium. Liquid cultures were diluted each day for 21 d, generating further adapted haploid/diploid bir1Δ-ad2 strains. (B) Heat map visualization of chromosome copy number values for the haploid bir1Δ strains before (see Fig. 1C) and after adaption in liquid medium. The bir1Δ-ad strains at the left directly correspond to the bir1Δ-ad2 strains at the right. (C) Frequency of aneuploidy for each chromosome in the haploid bir1Δ-ad and bir1Δ-ad2 strains based on binarization of the data in B. (D) Heat map visualization of chromosome copy number values for the diploid bir1Δ strains before (see Fig. 5A) and after adaption in liquid medium. The bir1Δ-ad strains at the left directly correspond to the bir1Δ-ad2 strains at the right. (E) Frequency of aneuploidy for each chromosome in the diploid bir1Δ-ad and bir1Δ-ad2 strains based on binarization of the data in D. (F) An empirical model depicting the pathways of adaptation to BIR1 deletion based on synthesizing data from Figures 1, 2, 3, and 5 and this figure. Adaptation starts with the gain of chromosome 2, which appears to be essential for initial survival. Following chromosome 2 gain, many different possible paths can be taken by haploid and diploid yeast during the formation of complex karyotypes. Note that some chromosome aneuploidies (disomy of chromosome 10 in haploids and monosomy of chromosome 9 in diploids) provide a growth advantage early in adaptation but must become euploid again to achieve the “optimal” complex karyotype. (G) Illustration of the selective forces that determine whether the aneuploidy of a chromosome is advantageous.
Discussion
In this study, we developed a system for studying how complex karyotypes arise from extremely high rates of CIN. Mutations in the kinetochore–microtubule error correction pathway provide an increase in the frequency of aneuploidy while simultaneously creating the selective pressure to adapt via aneuploidy. We identified strong correlations and anti-correlations between specific aneuploid chromosome pairs in the resulting complex karyotypes and hypothesized that these patterns result from genetic interactions between certain aneuploid chromosomes. We then identified genetic interactions between whole-chromosome copy number alterations (CCNIs) in engineered double-aneuploid strains that match the patterns observed in the adapted CIN strains. After additional competitive adaptation of the CIN strains, we observed an increase in homogeneity of the strains as they converged on an optimal karyotype.
We present a model of the different paths that yeast take in order to get to a final ideal aneuploid state that minimizes the growth defects resulting from BIR1 deletion (Fig. 7F). These paths of adaptation were based on (1) comparing cellular fitness with the different aneuploid states in the adapted strains (Figs. 1E, 2B), (2) comparing the karyotypes before and after liquid adaptation (Fig. 7B–E), and (3) the CCNIs observed between aneuploid chromosomes (Fig. 3E; Supplemental Fig. S3A,C). While the paths of adaptation are quite different for haploid and diploid cells, they have several things in common. For both ploidies, there are stepwise increases in aneuploidy and corresponding increases in fitness. The paths always start with the gain of chromosome 2, which is required for initial survival. After that, the cultures can acquire a number of different aneuploidies that all provide some selective advantage. These aneuploidies will sometimes lead down a direct route that quickly leads to the final optimal karyotype, such as the gain of chromosome 3 in haploids. Alternatively, the cultures will instead take a detour via an aneuploidy that is initially advantageous but, paradoxically, also provides a temporary barrier to obtaining the ideal complement of aneuploid chromosomes. Examples of this include gain of chromosome 10 in haploids or loss of chromosome 9 in diploids. These aneuploidies are eventually replaced due to negative CCNIs with copy number alterations that are even more advantageous. Our results demonstrate that aneuploidy can provide a surprisingly versatile mechanism of adaptation, with many different chromosomal aneuploidies able to provide an initial competitive advantage under selective conditions. Despite these divergent starting points, chromosomally unstable cell populations settle on an ideal complex karyotype through the gain and loss of chromosomes over time.
Synthetic genetic interactions between chromosomes have been reported before, as disomy of chromosome 6 is tolerated only in conjunction with a concomitant gain of chromosome 13. This interaction is due to imbalanced expression of the TUB2 gene on chromosome 6 and can be compensated for by increased expression of TUB1 from chromosome 13 (Torres et al. 2007; Anders et al. 2009). Here we demonstrate that both positive and negative whole-chromosome genetic interactions are potentially quite common and have strong effects on shaping complex aneuploid karyotypes. As of yet, we do not know the basis behind these genetic interactions and whether they typically result primarily from genetic interactions between pairs of genes, as with chromosomes 6 and 13, or due to cumulative effects of many genes, as has been reported for the growth defects that result from aneuploidy in general (Bonney et al. 2015). However, the specificity of the CCNIs among different chromosomes would suggest that they are likely the result of imbalances in a few specific genes. Another open question is whether cells frequently adapt to maintain the beneficial aspects of aneuploidy while finding ways to minimize the negative effects of genetic interactions between chromosomes.
Whether aneuploidy of a particular chromosome is advantageous depends on the balance between positive and negative selective forces (Fig. 7G). The key positive selective pressure for aneuploidy is the increased expression of genes on a chromosome that specifically relate to the selective forces acting on the cell population (Hughes et al. 2000; Rancati et al. 2008; Ryu et al. 2016). Negative selective pressure can come from the aberrant expression of many different genes simultaneously as well as stress-specific negative selection (Bonney et al. 2015; Chen et al. 2015). Here, we show that specific genetic interactions between aneuploid chromosomes can contribute either positively or negatively to the selective forces on aneuploidy. Additionally, the selective advantage for aneuploidy is heavily influenced by the original ploidy of the cells, as haploid and diploid yeast display largely divergent aneuploidy patterns. Furthermore, we found that the degree of aneuploidy resulting from CIN in diploids is, on average, doubled in comparison with haploids. These results are in agreement with the observation that gaining an extra chromosome in diploids causes much weaker phenotypes than gaining an extra chromosome in haploids (Beach et al. 2017). On the extreme end, tetraploidy in yeast has been shown to greatly encourage adaptation via aneuploidy (Selmecki et al. 2015). Together, these results highlight how subtle changes in the forces that select for and against aneuploidy can have a strong impact on the aneuploidy landscape in a cell population.
In cancer cell lines, higher amounts of aneuploidy are directly correlated with increased CIN rates, as measured by the frequency of lagging chromosomes (Duesberg et al. 1998; Nicholson and Cimini 2013). Since engineered aneuploid cells often display CIN (Sheltzer et al. 2011; Zhu et al. 2012; Passerini et al. 2016), this correlation has often been interpreted as aneuploidy being upstream of CIN (Nicholson and Cimini 2013). Here we show that the reciprocal relationship also exists. Yeast mutants with higher rates of CIN adapt to have proportionally more aneuploidy following adaptation. This may also explain why we observed much more complex karyotypes than previous studies that induced lower amounts of CIN and examined the resulting aneuploidy (Chen et al. 2012).
By analyzing the karyotypes of many different tumor cell populations, we identified that certain cancer types have strong correlations between specific somatic copy number alterations (SCNAs). A previous pan-cancer analysis of complex karyotypes revealed many positive correlations between whole-chromosome copy number changes (Ozery-Flato et al. 2011). Here, we found that restricting the analysis to certain cancer types allows for SCNAs at frequencies high enough to identify strong negative correlations in addition to positive correlations. These correlations are quite frequent and are suggestive of chromosome-level synthetic genetic interactions. Correlations between different aneuploidies in cancer identified in this manner could provide a starting point for identifying CCNIs in human cells. Additionally, our discovery that multiple distinct paths can lead to refined adaptive karyotypes provide a first glimpse into the paths of complex karyotype formation in cancer.
Materials and methods
Yeast strains and media
All yeast strains and plasmids used in this study are listed in Supplemental Table S1. Strains were grown in yeast extract/peptone supplemented with 40 µg/mL adenine-HCl (YPA) and 2% sugars. Benomyl (Sigma-Aldrich, 381586) and 5-FOA (Chempur, 220141-70-8) were used at concentrations of 10 µg/mL and 1 mg/mL, respectively. Cultures were incubated at 30°C. Genetic manipulations such as gene deletions were carried out as described (Longtine et al. 1998). Haploid strains with deletions of CIN genes were generated via tetrad dissection of heterozygous diploids. Homozygous diploid BIR1 deletion mutants were made one of two ways. Two heterozygous diploids were deleted of either the MATa or MATα locus to allow for mating between diploids. The resulting tetraploid strains were then sporulated, and tetrads were dissected. Alternatively, both copies of the endogenous BIR1 locus in a diploid strain were deleted in the presence of BIR1 linked to URA3 on a minichromosome. The minichromosome was then selected against using 5-FOA. Single disomic strains (N + 1 aneuploid strains) were constructed using a conditional centromere as described in Anders et al. (2009). In this system, the function of the centromere is repressed by the galactose-inducible promoter, causing frequent chromosome missegregation. Endogenous centromeres were targeted using recombination sites both upstream of and downstream from the centromere and subsequently replaced by the galactose-repressable centromere PGAL1-CEN3 and either URA3 or LYS2. This insert was then disrupted by insertion of plasmids with pieces of URA3 or LYS2 linearized with the Stu2 or EcoRV restriction enzymes, respectively, and selected for with HIS3 or LEU2 genes also present on the plasmid. Haploid strains containing PGAL1-CEN3 ura3::HIS3 and/or PGAL1-CEN3 lys2::LEU2 constructs were grown to log phase in YPA plus 2% dextrose (YPAD) and transferred to YPA plus 1% galactose and 1% raffinose (YPAGR) medium for 3 h. The cells were subsequently plated onto selection plates with complete synthetic medium (CSM) lacking either uracil and histidine or lysine and leucine. The resulting aneuploid strains were verified by qPCR. For double-disomic strains (N + 2 aneuploid strains), PGAL1-CEN3 ura3::HIS3 and PGAL1-CEN3 lys2::LEU2 were inserted on separate chromosomes. After induction for 3 h in YPAGR, the cultures were first plated on CSM lacking uracil and histidine. Single colonies were then selected on CSM plates lacking lysine and leucine. For engineering simultaneous loss and gain of chromosomes in diploid strains, PGAL1-CEN3 URA3 and PGAL1-CEN3 lys2::LEU2 were inserted into separate chromosomes to be lost and gained, respectively. The cells were induced as stated above and selected first on plates containing 5-FOA. Subsequently, single colonies were grown on CSM plates lacking lysine and leucine. The respective aneuploidies of the selected strains were verified using qPCR.
Adaptation through clonal expansion
Fresh BIR1-deleted haploids were obtained by tetrad dissection of heterozygous diploids on YPAD. After 4 d of growth, small colonies (bir1Δ) from tetrads with two large colonies (BIR1+) were streaked out for singles on fresh YPAD plates. Six colonies from each initial colony were then selected for further analysis by clonal expansion. Every 2 d, one large colony from each strain was streaked out on a fresh plate. After 10 clonal expansions, the strains were kept frozen at −80°C in 25% glycerol. Subsequent experiments were performed from these frozen stocks. The bir1Δ genotype was confirmed by hygromycin resistance as well as genome sequencing of the adapted strains.
Doubling time measurements
Overnight cultures were diluted to an optical density (OD) at 600 nm of 0.01 in YPAD. OD measurements were taken 3, 4, 5.5, 7, and 8.5 h after induction. The measurements were fit to logarithmic curves using Microsoft Excel to calculate doubling times.
Colony size measurements
Yeast strains were streaked for single colonies on YPAD plates and incubated for 40 h. The plates were imaged using an SPimager (S&P Robotics, Inc.) fitted with a Canon Rebel XSi dSLR camera, and the images were analyzed using ImageJ. After thresholding, colony sizes were measured using the “analyze particles” function with the following settings: particle size: 0.03–3 mm2; circularity: 0.90–1. Median colony sizes from multiple plates were averaged for each strain.
Flow cytometry
Log-phase cultures (OD600 ∼ 1.0) were pelleted and resuspended in 50 mM sodium citrate and sonicated to disperse cell clumps. Subsequently, the cells were treated with 250 µg/mL RNase A (Sigma-Aldrich, R6513) and 1 mg/mL Proteinase K (Sigma-Aldrich, P2308) overnight at 37°C. Finally, the cells were resuspended in 50 mM sodium citrate solution containing 1 µM SYTOX green (Thermo Fisher, 10768273). Samples were run on BD FACSCallibur flow cytometer equipped with a 15-mW 488-nm laser. Maximum count peaks for fluorescence intensities were calculated using the BD FACSDiva 8.0.1 software.
Next-generation sequencing and data analysis
DNA from saturated overnight cultures was isolated using the Wizard genomic DNA purification kit (Promega). The samples were then fragmented to ∼500 base pairs (bp) using the Bioruptor Pico sonicator for two to three cycles (30 sec on/off). The samples were subsequently run on a 0.8% agarose gel to verify the fragment length. DNA libraries were prepared using the NEBNext Ultra II DNA library preparation kit for Illumina (New England Biosciences). AMPure XP beads were used for size selection. Twelve to 16 strains per run were multiplexed with NEBNext Multiplex oligos (96 index primers) and mixed at equimolar ratios. The multiplexed samples were sequenced using the 50-bp paired-end setting on an Illumina HiSeq 2500 system at the Vienna Biocenter Next-Generation Sequencing Facility (VBCF). The demultiplexed data sets were then aligned to the yeast genome using Bowtie2 (version 2.2.9; http://bowtie-bio.sourceforge.net/bowtie2) and converted to bed files using SAMtools (version 1.3.1; http://samtools.sourceforge.net) and Bedtools (version 2.14, http://bedtools.readthedocs.io). The resulting bed files were used to calculate chromosome copy numbers for read densities using custom-made Python2 scripts. To normalize for differences in chromosome sizes, only the 15 kb closest to the telomeres were used. The value for the second-lowest quartile chromosomes was used for normalization. Mutations in the bir1Δ-ad strains were identified by taking the output from Bowtie2 and running mpileup function in SAMtools. The data were filtered by quality score and read depth. Next, BCFtools (version1.3.1) was implemented to convert the bcf files generated by mpileup to variant call format (.vcf) files. Subsequently, VCFtools (version0.1.13) was used to compare all mutations found in our test strains with mutations already identified in the diploid parent strain. Last, a custom-made Python script generated lists containing the strain identity, the coordinates of the mutation (in base pairs), and the type of mutation (coding/noncoding). We generated a list of CIN genes in the yeast genome from the Saccharomyces Genome Database associated with six specific GO terms: colony sectoring: increased; chromosome segregation: abnormal; chromosome/plasmid maintenance: decreased rate; chromosome/plasmid maintenance: abnormal; chromosome segregation: premature; and chromosome segregation: decreased. GO term enrichment tests were conducted using the Panther Classification System Web site (http://pantherdb.org) with the settings model organism: “S. cerevisiae”; “statistical overrepresentation test”; and “GO biological process complete.”
Microscopy
Strains were grown overnight, subsequently diluted 100-fold, and grown for 5 h to mid-log phase. Cells were pelleted by brief centrifugation, washed, and resuspended in 100 mM phosphate buffer (pH 7.4). They were then placed on 1% agarose pads supplemented with complete synthetic medium, covered with a coverslip, and sealed around the edges with VALAP (a 1:1:1 mixture of petroleum jelly [Vaseline], lanolin, and paraffin [Thermo Fisher Scientific] by weight). Time-lapse imaging was performed on an Olympus cellSens microscopy system (Olympus Corporation) fitted with an Olympus cellVivo system for temperature control at 30°C. A 60× 1.42 NA oil immersion Olympus plan apochromat objective and an ORCA-Flash4.0 V2 sCMOS camera (Hamamatsu) were used for imaging. Z-sections were taken with 11 0.7-µm steps with Olympus cellSens version 1.18 software (Olympus Corporation). Images were collected every 15 min for a period of 4 h. Image analyses, including maximum intensity projections and contrast adjustments, were performed using ImageJ. The images shown were collected on the same day, and contrast was adjusted identically. For quantification of the missegregation rates the GFP-labeled chromosome 4, foci were followed over time through chromosome segregation. When both foci ended up in either the mother or daughter cell after complete nuclear division (judged by the background nuclear fluorescence), the division was scored as an event of missegregation. The percentage of all missegregation events in a strain out of the total number of nuclear divisions is reported as the missegregation rate.
qPCR
Small amounts of cells from plates were lysed in 0.02 N NaOH for 10 min at 100°C in a thermocyler. The lysates were then centrifuged to pellet cellular debris, and the supernatants were collected. Each 20-µL reaction contained 10 µL of GoTaq qPCR master mix (Promega), 1 µL of lysate, and 1 µM each primer. Primers were in noncoding regions on each arm of the chromosome. The reactions were set up in 96-well plates (Eppendorf twin.tec real-time PCR 96-well plate) and cycled using a Mastercycler RealPlex2 (Eppendorf). Cycling conditions were for 5 min at 95°C followed by 40 cycles of 15 sec at 95°C and 1 min at 60°C. Dissociation curves were performed to verify that no secondary products had been amplified. Ct values were determined using the automatic thresholding of the Eppendorf RealPlex2 software. All reactions were run in duplicate along with the appropriate wild-type or parental controls. Chromosome copy numbers were calculated using a slightly modified ΔΔCt method (Schmittgen 2001). The Ct values from duplicates were averaged and used to obtain the ΔCt, which was subsequently raised to the negative power of 2 to give the fold change. The ratio of fold change of the test strains to that of a wild-type strain was calculated to obtain the values for the chromosome copy numbers.
Cancer genome databases and data analysis
Copy number variation (CNV) files were downloaded from the Genomic Data Commons (GDC) data portal (https://portal.gdc.cancer.gov) on October 19, 2017. Relative copy numbers were determined from each chromosome arm using a custom Python2 script. Tumor samples containing chromosome arms with large insertions or deletions (mean and median copy numbers differed by >0.2) were excluded from analysis. Karyotypes with no complex aneuploidy (fewer than two copy number aberrations) were not included in the statistical analyses.
Liquid adaptation
Overnight saturated cultures were first diluted to OD600 of 0.1. Subsequently, the cultures were diluted 1000-fold into 200 µL of YPAD in 96-well plates (Nunc 96 deep-well plates: 2-mL volume) and covered with a Breathe-Easier strip (Sigma, 2763624). These plates were fixed onto an incubator (New Brunswick Innova 4000 benchtop incubator shaker) using custom-made holders and incubated with shaking at 300 revolutions per minute for 24 h at 30°C. Each day, the cultures were diluted 1000-fold into fresh medium.
Statistics
Unpaired t-tests were performed in Prism 7 (Graphpad). Hypergeometric tests were performed in Python2 using the “hypergeom.pmf” function in the scipy.stats module. Pearson correlation coefficients were calculated using either the “pearsonr” function in the scipy.stats module in Python2 or the “correl” function in Microsoft Excel.
Supplementary Material
Acknowledgments
We thank all members of the Campbell and Dammermann laboratories for helpful discussions; Alexander Dammermann, Franz Klein, and Manish Grover for comments on the manuscript; Claudia Stadler for help with strain construction; Christopher D. Putnam for assistance with next-generation sequencing data analysis; and Kirk Anders for the gifts of plasmids. This work was supported by Vienna Science and Technology Fund (WWTF) grant VRG14-001 and Austrian Science Fund (FWF) grants Y944-B28 and W1238-B20 to C.S.C., and a University of Vienna Uni:docs Fellowship to M.C.R.
Author contributions: S.F., M.N.C., and F.C.H. conducted the experiments. C.S.C. and M.C.R. designed and conducted the experiments and wrote the paper.
Footnotes
Supplemental material is available for this article.
Article published online ahead of print. Article and publication date are online at http://www.genesdev.org/cgi/doi/10.1101/gad.319400.118.
Freely available online through the Genes & Development Open Access option.
References
- Anders KR, Kudrna JR, Keller KE, Kinghorn B, Miller EM, Pauw D, Peck AT, Shellooe CE, Strong IJT. 2009. A strategy for constructing aneuploid yeast strains by transient nondisjunction of a target chromosome. BMC Genet 10: 36. [DOI] [PMC free article] [PubMed] [Google Scholar]
- Beach RR, Ricci-Tam C, Brennan CM, Moomau CA, Hsu P-H, Hua B, Silberman RE, Springer M, Amon A. 2017. Aneuploidy causes non-genetic individuality. Cell 169: 229–242.e21. [DOI] [PMC free article] [PubMed] [Google Scholar]
- Bonney ME, Moriya H, Amon A. 2015. Aneuploid proliferation defects in yeast are not driven by copy number changes of a few dosage-sensitive genes. Genes Dev 29: 898–903. [DOI] [PMC free article] [PubMed] [Google Scholar]
- Campbell CS, Desai A. 2013. Tension sensing by Aurora B kinase is independent of survivin-based centromere localization. Nature 497: 118–121. [DOI] [PMC free article] [PubMed] [Google Scholar]
- Chen G, Bradford WD, Seidel CW, Li R. 2012. Hsp90 stress potentiates rapid cellular adaptation through induction of aneuploidy. Nature 482: 246–250. [DOI] [PMC free article] [PubMed] [Google Scholar]
- Chen G, Mulla WA, Kucharavy A, Tsai H-J, Rubinstein B, Conkright J, McCroskey S, Bradford WD, Weems L, Haug JS, et al. 2015. Targeting the adaptability of heterogeneous aneuploids. Cell 160: 771–784. [DOI] [PMC free article] [PubMed] [Google Scholar]
- Duesberg P, Rausch C, Rasnick D, Hehlmann R. 1998. Genetic instability of cancer cells is proportional to their degree of aneuploidy. Proc Natl Acad Sci 95: 13692–13697. [DOI] [PMC free article] [PubMed] [Google Scholar]
- Hughes TR, Roberts CJ, Dai H, Jones AR, Meyer MR, Slade D, Burchard J, Dow S, Ward TR, Kidd MJ, et al. 2000. Widespread aneuploidy revealed by DNA microarray expression profiling. Nat Genet 25: 333–337. [DOI] [PubMed] [Google Scholar]
- Liu G, Yong MYJ, Yurieva M, Srinivasan KG, Liu J, Lim JSY, Poidinger M, Wright GD, Zolezzi F, Choi H, et al. 2015. Gene essentiality is a quantitative property linked to cellular evolvability. Cell 163: 1388–1399. [DOI] [PubMed] [Google Scholar]
- Longtine MS, McKenzie A, Demarini DJ, Shah NG, Wach A, Brachat A, Philippsen P, Pringle JR. 1998. Additional modules for versatile and economical PCR-based gene deletion and modification in Saccharomyces cerevisiae. Yeast 14: 953–961. [DOI] [PubMed] [Google Scholar]
- Nicholson JM, Cimini D. 2013. Cancer karyotypes: survival of the fittest. Front Oncol 3: 148. [DOI] [PMC free article] [PubMed] [Google Scholar]
- Oromendia AB, Dodgson SE, Amon A. 2012. Aneuploidy causes proteotoxic stress in yeast. Genes Dev 26: 2696–2708. [DOI] [PMC free article] [PubMed] [Google Scholar]
- Ozery-Flato M, Linhart C, Trakhtenbrot L, Izraeli S, Shamir R. 2011. Large-scale analysis of chromosomal aberrations in cancer karyotypes reveals two distinct paths to aneuploidy. Genome Biol 12: R61. [DOI] [PMC free article] [PubMed] [Google Scholar]
- Passerini V, Ozeri-Galai E, de Pagter MS, Donnelly N, Schmalbrock S, Kloosterman WP, Kerem B, Storchova Z. 2016. The presence of extra chromosomes leads to genomic instability. Nat Commun 7: 10754. [DOI] [PMC free article] [PubMed] [Google Scholar]
- Rancati G, Pavelka N, Fleharty B, Noll A, Trimble R, Walton K, Perera A, Staehling-Hampton K, Seidel CW, Li R. 2008. Aneuploidy underlies rapid adaptive evolution of yeast cells deprived of a conserved cytokinesis motor. Cell 135: 879–893. [DOI] [PMC free article] [PubMed] [Google Scholar]
- Ryu H-Y, Wilson NR, Mehta S, Hwang SS, Hochstrasser M. 2016. Loss of the SUMO protease Ulp2 triggers a specific multichromosome aneuploidy. Genes Dev 30: 1881–1894. [DOI] [PMC free article] [PubMed] [Google Scholar]
- Sandall S, Severin F, McLeod IX, Yates JR, Oegema K, Hyman A, Desai A. 2006. A Bir1-Sli15 complex connects centromeres to microtubules and is required to sense kinetochore tension. Cell 127: 1179–1191. [DOI] [PMC free article] [PubMed] [Google Scholar]
- Sansregret L, Vanhaesebroeck B, Swanton C. 2018. Determinants and clinical implications of chromosomal instability in cancer. Nat Rev Clin Oncol 15: 139–150. [DOI] [PubMed] [Google Scholar]
- Schmittgen TD. 2001. Real-time quantitative PCR. Methods 25: 383–385. [DOI] [PubMed] [Google Scholar]
- Selmecki A, Forche A, Berman J. 2006. Aneuploidy and isochromosome formation in drug-resistant Candida albicans. Science 313: 367–370. [DOI] [PMC free article] [PubMed] [Google Scholar]
- Selmecki AM, Maruvka YE, Richmond PA, Guillet M, Shoresh N, Sorenson AL, De S, Kishony R, Michor F, Dowell R, et al. 2015. Polyploidy can drive rapid adaptation in yeast. Nature 519: 349–352. [DOI] [PMC free article] [PubMed] [Google Scholar]
- Sheltzer JM, Blank HM, Pfau SJ, Tange Y, George BM, Humpton TJ, Brito IL, Hiraoka Y, Niwa O, Amon A. 2011. Aneuploidy drives genomic instability in yeast. Science 333: 1026–1030. [DOI] [PMC free article] [PubMed] [Google Scholar]
- Stingele S, Stoehr G, Peplowska K, Cox J, Mann M, Storchova Z. 2012. Global analysis of genome, transcriptome and proteome reveals the response to aneuploidy in human cells. Mol Syst Biol 8: 608. [DOI] [PMC free article] [PubMed] [Google Scholar]
- Storchova Z, Becker JS, Talarek N, Kögelsberger S, Pellman D. 2011. Bub1, Sgo1, and Mps1 mediate a distinct pathway for chromosome biorientation in budding yeast. Mol Biol Cell 22: 1473–1485. [DOI] [PMC free article] [PubMed] [Google Scholar]
- Thompson SL, Compton DA. 2008. Examining the link between chromosomal instability and aneuploidy in human cells. J Cell Biol 180: 665–672. [DOI] [PMC free article] [PubMed] [Google Scholar]
- Torres EM, Sokolsky T, Tucker CM, Chan LY, Boselli M, Dunham MJ, Amon A. 2007. Effects of aneuploidy on cellular physiology and cell division in haploid yeast. Science 317: 916–924. [DOI] [PubMed] [Google Scholar]
- Yona AH, Manor YS, Herbst RH, Romano GH, Mitchell A, Kupiec M, Pilpel Y, Dahan O. 2012. Chromosomal duplication is a transient evolutionary solution to stress. Proc Natl Acad Sci 109: 21010–21015. [DOI] [PMC free article] [PubMed] [Google Scholar]
- Zhu J, Pavelka N, Bradford WD, Rancati G, Li R. 2012. Karyotypic determinants of chromosome instability in aneuploid budding yeast. PLoS Genet 8: e1002719. [DOI] [PMC free article] [PubMed] [Google Scholar]
Associated Data
This section collects any data citations, data availability statements, or supplementary materials included in this article.