

Abstract
Gene expression is controlled by transcription factors (TFs) that consist of DNA-binding domains (DBDs) and activation domains (ADs). The DBDs have been well-characterized, but little is known about the mechanisms by which ADs effect gene activation. Here we report that diverse ADs form phase-separated condensates with the Mediator coactivator. For the OCT4 and GCN4 TFs, we show that the ability to form phase-separated droplets with Mediator in vitro and the ability to activate genes in vivo are dependent on the same amino acid residues. For the estrogen receptor (ER), a ligand-dependent activator, we show that estrogen enhances phase separation with Mediator, again linking phase separation with gene activation. These results suggest that diverse TFs can interact with Mediator through the phase-separating capacity of their ADs and that formation of condensates with Mediator is involved in gene activation.
Graphical Abstract

In Brief
Activation domains from a diverse array of mammalian and yeast transcription factors form phase-separated condensates with mediator to activate gene expression
INTRODUCTION
Regulation of gene expression requires that the transcription apparatus be efficiently assembled at specific genomic sites. DNA-binding transcription factors (TFs) ensure this specificity by occupying specific DNA sequences at enhancers and promoter-proximal elements. TFs typically consist of one or more DNA-binding domains (DBD) and one or more separate activation domains (ADs) (Brent and Ptashne, 1985; Keegan et al., 1986). While the structure and function of TF DBDs are well-documented, comparatively little is understood about the structure of ADs and how these interact with coactivators to drive gene expression.
The structure of TF DBDs and their interaction with cognate DNA sequences has been described at atomic resolution for many TFs, and TFs are generally classified according to the structural features of their DBDs (Fulton et al., 2009; Vaquerizas et al., 2009). For example, DBDs can be composed of zinc-coordinating, basic helix-loop-helix, basic-leucine zipper, or helix-turn-helix DNA-binding structures. These DBDs selectively bind specific DNA sequences that range from 4-12 bp, and the DNA binding sequences favored by hundreds of TFs have been described (Hume et al., 2015; Jolma et al., 2013; Khan et al., 2018). Multiple TF molecules typically bind together at any one enhancer or promoter-proximal element. For example, at least eight different TF molecules bind a 50bp core component of the IFN-β enhancer (Panne et al., 2007).
Anchored in place by the DBD, the AD interacts with coactivators, which integrate signals from multiple TFs to regulate transcriptional output (Allen and Taatjes, 2015; Juven-Gershon and Kadonaga, 2010; Malik and Roeder, 2010; Plaschka et al., 2016; Reiter et al., 2017; Soutourina, 2017; Taatjes, 2010). In contrast to the structured DBD, the ADs of most TFs are low-complexity amino acid sequences not amenable to crystallography. These intrinsically disordered regions (IDRs) have therefore been classified by their amino acid profile as acidic, proline-, serine/threonine-, or glutamine-rich; or by their hypothetical shape as acid blobs, negative noodles, or peptide lassos (Mitchell and Tjian, 1989; Roberts, 2000; Sigler, 1988; Staby et al., 2017a; Triezenberg, 1995). Remarkably, hundreds of TFs are thought to interact with the same small set of coactivator complexes, which include Mediator and p300 (Allen and Taatjes, 2015; Avantaggiati et al., 1996; Dai and Markham, 2001; Eckner et al., 1996; Green, 2005; Merika et al., 1998; Oliner et al., 1996; Yin and Wang, 2014; Yuan et al., 1996). ADs that share little sequence homology are functionally interchangeable among TFs (Godowski et al., 1988; Hope and Struhl, 1986; Jin et al., 2016; Lech et al., 1988; Ransone et al., 1990; Sadowski et al., 1988; Struhl, 1988; Tora et al., 1989); this interchangeability is not readily explained by traditional lock-and-key models of protein-protein interaction. Thus, how the diverse ADs of hundreds of different TFs interact with a similar small set of coactivators remains a conundrum.
Recent studies have shown that the AD of the yeast TF GCN4 binds to the Mediator subunit MED15 at multiple sites and in multiple orientations and conformations (Brzovic et al., 2011; Jedidi et al., 2010; Tuttle et al., 2018; Warfield et al., 2014). The products of this type of protein-protein interaction, where the interaction interface cannot be described by a single conformation, have been termed “fuzzy complexes” (Tompa and Fuxreiter, 2008). These dynamic interactions are also typical of the IDR-IDR interactions that facilitate formation of phase-separated biomolecular condensates (Alberti, 2017; Banani et al., 2017; Hyman et al., 2014; Shin and Brangwynne, 2017; Wheeler and Hyman, 2018).
We recently proposed that transcriptional control may be driven by the formation of phase-separated condensates (Hnisz et al., 2017), and demonstrated that the coactivator proteins MED1 and BRD4 form phase-separated condensates at superenhancers (SEs) (Sabari et al., 2018). Here, we report that diverse TF ADs phase separate with the Mediator coactivator. We show that the embryonic stem cell (ESC) pluripotency TF OCT4, the estrogen receptor (ER) and the yeast TF GCN4 form phase-separated condensates with Mediator and require the same amino acids or ligands for both activation and phase separation. We propose that IDR-mediated phase separation with coactivators is a mechanism by which TF ADs activate genes.
RESULTS
Mediator condensates at ESC super-enhancers depend on OCT4
OCT4 is a master TF essential for the pluripotent state of ESCs and is a defining TF at ESC SEs (Whyte et al., 2013). The Mediator coactivator, which forms condensates at ESC SEs (Sabari et al., 2018), is thought to interact with OCT4 via the MED1 subunit (Table S1) (Apostolou et al., 2013). If OCT4 contributes to the formation of Mediator condensates, then OCT4 puncta should be present at the SEs where MED1 puncta have been observed. Indeed, immunofluorescence (IF) microscopy with concurrent nascent RNA FISH revealed discrete OCT4 puncta at the SEs of the key pluripotency genes Esrrb, Nanog, Trim28 and Mir290 (Figure 1). Average image analysis confirmed that OCT4 IF was enriched at center of RNA FISH foci. This enrichment was not seen using a randomly selected nuclear position (Figure S1). These results confirm that OCT4 occurs in puncta at the same SEs where Mediator forms condensates (Sabari et al., 2018) and where ChIP-seq shows co-occupancy of OCT4 and MED1 (Figure 1).
Figure 1. OCT4 and Mediator occupy super-enhancers in vivo.

ChIP-seq tracks of OCT4 and MED1 in ESCs at SEs (left column) and OCT4 IF with concurrent RNA-FISH demonstrating occupancy of OCT4 at Esrrb, Nanog, Trim28 and Mir290. Hoechst staining was used to determine the nuclear periphery, highlighted with a blue line. The two rightmost columns show average RNA FISH signal and average OCT4 IF signal centered on the RNA-FISH focus from at least 11 images. Average OCT4 IF signal at random randomly selected nuclear position is displayed in S1.
We investigated whether the Mediator condensates present at SEs are dependent on OCT4 using a degradation strategy (Nabet et al., 2018). Degradation of OCT4 in an ESC line bearing endogenous knock-in of DNA encoding the FKBP protein fused to OCT4 was induced by addition of dTag for 24 hours (Weintraub et al., 2017) (Figure 2A and S2A). Induction of OCT4 degradation reduced OCT4 protein levels, but did not affect MED1 levels (Figure S2B). ChIP-seq analysis showed a reduction of OCT4 and MED1 occupancy at enhancers, with the most profound effects occurring at SEs, as compared to typical enhancers (TEs). (Figure 2B). RNA-seq revealed that expression of SE-driven genes was concomitantly decreased (Figure 2B). For example, OCT4 and MED1 occupancy was reduced by approximately 90% at the Nanog SE (Figure 2C), associated with a 60% reduction in Nanog mRNA levels (Figure 2D). Immunofluorescence (IF) microscopy with concurrent DNA FISH showed that OCT4 degradation caused a reduction in MED1 condensates at Nanog (Figure 2E and S2C). These results indicate that the presence of Mediator condensates at an ESC SE is dependent on OCT4.
Figure 2. MED1 condensates are dependent on OCT4 binding in vivo.

A. Schematic of OCT4 degradation. The C-terminus of OCT4 is endogenously biallelically tagged with the FKBP protein; when exposed to the small molecule dTag, OCT4 is ubiquitylated and rapidly degraded.
B. Box plot representation of log2 fold change in OCT4 and MED1 ChIP-seq reads and RNA-seq reads of Super-enhancer (SE)- or Typical enhancer (TE)- driven genes, in ESCs carrying the OCT4 FKBP tag, treated with DMSO or dTAG for 24 hours.
C. Genome browser view of OCT4 (green) and MED1 (yellow) ChIP-seq data at the Nanog locus. The Nanog SE (red) show a 90% reduction of OCT4 and MED1 binding after OCT4 degradation.
D. Normalized RNA-seq read counts of Nanog mRNA show a 60% reduction upon OCT4 degradation.
E. Confocal microscopy images OCT4 and MED1 IF with DNA FISH to the Nanog locus in ESCs carrying the OCT4 FKBP tag, treated with DMSO or dTAG. Inset represent a zoomed in view of the yellow box. The Merge view displays all three channels (OCT4 IF, MED1 IF and Nanog DNA FISH) together.
F. OCT4 ChIP-qPCR to the Mir290 SE in ESCs and differentiated cells (Diff). Presented as enrichment over control, relative to signal in ESCs. Error bars represents standard error of the mean from two biological replicates.
G. MED1 ChIP-qPCR to the Mir290 SE in ESCs and differentiated cells (Diff). Presented as enrichment over control, relative to signal in ESCs. Error bars represents the SEM from two biological replicates.
H. Normalized RNA-seq read counts of Mir290 miRNA in ESCs or differentiated cells (Diff). Error bars represents the SEM from two biological replicates.
I. Confocal microscopy images of MED1 IF and DNA FISH to the Mir290 genomic locus in ESCs and differentiated cells. Merge (zoom) represent a zoomed in view of the yellow box in the merged channel.
ESC differentiation causes a loss of OCT4 binding at certain ESC SEs, which leads to a loss of these OCT4-dependent SEs, and thus should cause a loss of Mediator condensates at these sites. To test this idea, we differentiated ESCs by LIF withdrawal. In the differentiated cell population, we observed reduced OCT4 and MED1 occupancy at the MiR290 SE (Figure 2F, 2G, and S2D) and reduced levels of MiR290 miRNA (Figure 2H), despite continued expression of MED1 protein (Figure S2E). Correspondingly, MED1 condensates were reduced at Mir290 (Figure 2I and S2F) in the differentiated cell population. These results are consistent with those obtained with the OCT4 degron experiment and support the idea that Mediator condensates at these ESC SEs are dependent on occupancy of the enhancer elements by OCT4.
OCT4 is incorporated into MED1 liquid droplets
OCT4 has two intrinsically disordered ADs responsible for gene activation, which flank a structured DBD (Figure 3A) (Brehm et al., 1997). Since IDRs are capable of forming dynamic networks of weak interactions, and the purified IDRs of proteins involved in condensate formation can form phase-separated droplets (Burke et al., 2015; Lin et al., 2015; Nott et al., 2015), we next investigated whether OCT4 is capable of forming droplets in vitro, with and without the IDR of the MED1 subunit of Mediator.
Figure 3. OCT4 forms liquid droplets with MED1 in vitro.
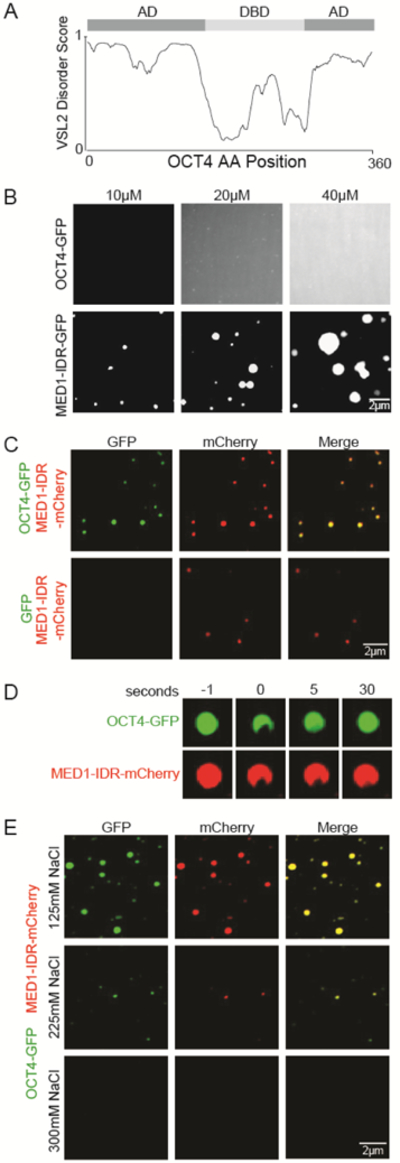
A. Graph of intrinsic disorder of OCT4 as calculated by the VSL2 algorithm (www.pondr.com). The DNA binding domain (DBD) and activation domains (ADs) are indicated above the disorder score graph (Brehm et al., 1997).
B. Representative images of droplet formation of OCT4-GFP (top row) and MED1-IDR-GFP (bottom row) at the indicated concentration in droplet formation buffer with 125mM NaCl and 10% PEG-8000.
C. Representative images of droplet formation of MED1-IDR-mCherry mixed with GFP or OCT4-GFP at 10uM each in droplet formation buffer with 125mM NaCl and 10% PEG-8000.
D. FRAP of heterotypic droplets of OCT4-GFP and MED1-IDR-mCherry. Confocal images were taken at indicated time points relative to photobleaching (0).
E. Representative images of droplet formation of 10uM MED1-IDR-mCherry and OCT4-GFP in droplet formation buffer with varying concentrations of salt and 10% PEG-8000.
Recombinant OCT4-GFP fusion protein was purified and added to droplet formation buffers containing a crowding agent (10% PEG-8000) to simulate the densely crowded environment of the nucleus. Fluorescent microscopy of the droplet mixture revealed that OCT4 alone did not form droplets throughout the range of concentrations tested (Figure 3B). In contrast, purified recombinant MED1-IDR-GFP fusion protein exhibited concentration-dependent liquid-liquid phase separation (Figure 3B), as described previously (Sabari et al., 2018).
We then mixed the two proteins and found that droplets of MED1-IDR incorporate and concentrate purified OCT4-GFP to form heterotypic droplets (Figure 3C). In contrast, purified GFP was not concentrated into MED1-IDR droplets (Figure 3C, S3A). OCT4-MED1-IDR droplets were near-micron-sized (Figure S3B), exhibited fast recovery after photobleaching (Figure 3D), spherical shape (Figure S3C), and were salt sensitive (Figure 3E and S3D). Thus, they exhibited characteristics associated with phase-separated liquid condensates (Banani et al 2017; Shin et al 2017). Furthermore, we found that OCT4-MED1-IDR droplets could form in the absence of any crowding agent (Figure S3E and S3F).
Residues required for OCT4-MED1-IDR droplet formation and gene activation
We next investigated whether specific OCT4 amino acid residues are required for the formation of OCT4-MED1-IDR phase-separated droplets, as multiple categories of amino acid interaction have been implicated in forming condensates. For example, serine residues are required for MED1 phase separation (Sabari et al., 2018). We asked whether amino acid enrichments in the OCT4 ADs might point to a mechanism for interaction. An analysis of amino acid frequency and charge bias showed that the OCT4 IDRs are enriched in proline and glycine, and have an overall acidic charge (Figure 4A). ADs are known to be enriched in acidic amino acids and proline, and have historically been classified on this basis (Frietze and Farnham, 2011), but the mechanism by which these enrichments might cause gene activation is not known. We hypothesized that proline or acidic amino acids in the ADs might facilitate interaction with the phase-separated MED1-IDR droplet. To test this, we designed fluorescently labeled proline and glutamic acid decapeptides and investigated whether these peptides can be concentrated in MED1-IDR droplets. When added to droplet formation buffer alone, these peptides remained in solution (Figure S4A). When mixed with MED1-IDR-GFP, however, proline peptides were not incorporated into MED1-IDR droplets, while the glutamic acid peptides were concentrated within (Figure 4B and S4B). These results show that peptides with acidic residues are amenable to incorporation within MED1 phase-separated droplets.
Figure 4. OCT4 phase separation with MED1 is dependent on specific interactions.
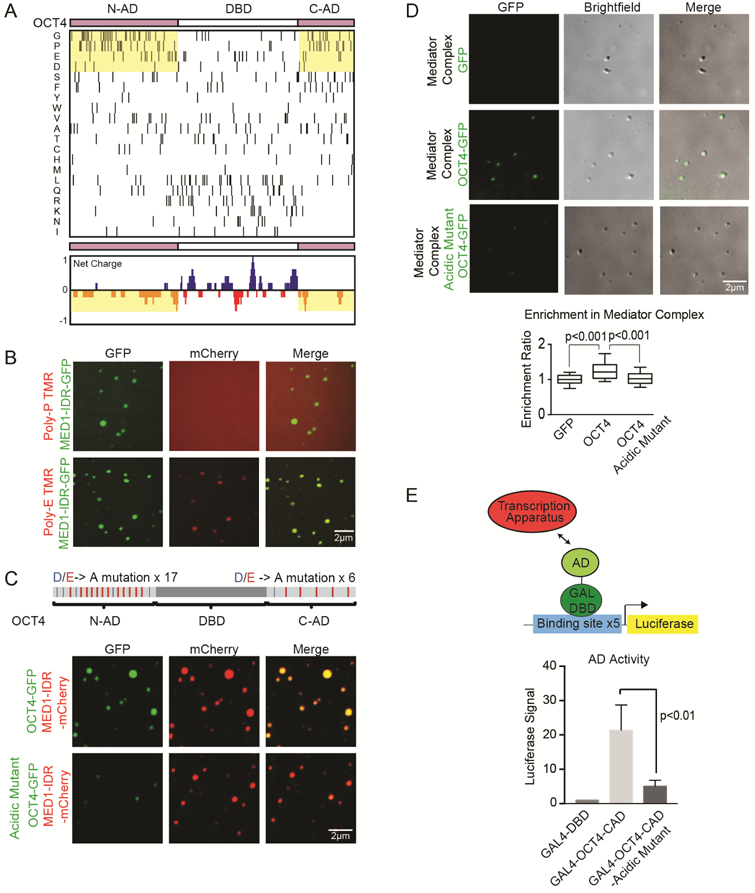
A. Amino acid enrichment analysis ordered by frequency of amino acid in the ADs (upper panel). Net charge per amino acid residue analysis of OCT4 (lower panel).
B. Representative images of droplet formation showing that Poly-E peptides are incorporated into MED1-IDR droplets. MED1-GFP and a TMR labeled proline or glutamic acid decapeptide (Poly-P and Poly-E respectively) were added to droplet formation buffers at 10uM each with 125mM NaCl and 10% PEG-8000.
C. (Upper panel) Schematic of OCT4 protein, horizontal lines in the AD mark acidic D residues (blue) and acidic E residues (red). All 17 acidic residues in the N-AD and 6 acidic residues in the C-AD were mutated to alanine to generate an OCT4-acidic mutant. (Lower panel) Representative confocal images of droplet formation showing that the OCT4 acidic mutant has an attenuated ability to concentrate into MED1-IDR droplets. 10uM of MED1-IDR-mCherry and OCT4-GFP or OCT4-acidic mutant-GFP were added to droplet formation buffers with 125mM NaCl and 10% PEG-8000.
D. (Upper panel) Representative images of droplet formation showing that OCT4 but not the OCT4 acidic mutant is incorporated into Mediator complex droplets. Purified Mediator complex was mixed with 10uM GFP, OCT4-GFP or OCT4-acidic mutant-GFP in droplet formation buffers with 140mM NaCl and 10% PEG-8000. (Lower panel) Enrichment ratio of GFP, OCT4-GFP or OCT4-acidic mutant-GFP in Mediator complex droplets. N>20, error bars represent the distribution between the 10th and 90th percentiles.
E. (Top panel) GAL4 activation assay schematic. The GAL4 luciferase reporter plasmid was transfected into mouse ES cells with an expression vector for the GAL4-DBD fusion protein. (Bottom panel) The AD activity was measured by luciferase activity of mouse ES cells transfected with GAL4-DBD, GAL-OCT4-CAD or GAL-OCT4-CAD-acidic mutant.
Based on these results, we deduced that an OCT4 protein lacking acidic amino acids in its ADs might be defective in its ability to phase separate with MED1-IDR. Such a dependence on acidic residues would be consistent with our observation that OCT4-MED1-IDR droplets are highly salt sensitive. To test this idea, we generated a mutant OCT4 in which all acidic residues in the ADs were replaced with alanine (thus changing 17 AAs in the N-terminal AD and 6 in the C-terminal AD) (Figure 4C). When this GFP-fused OCT4 mutant was mixed with purified MED1-IDR, entry into droplets was highly attenuated (Figure 4C and S4C). To test if this effect was specific for acidic residues, we generated a mutant of OCT4 in which all the aromatic amino acids within the ADs were changed to alanine. We found that this mutant was still incorporated into MED1-IDR droplets (S4C and S4D). These results indicate that the ability of OCT4 to phase separate with MED1-IDR is dependent on acidic residues in the OCT4 IDRs.
To ensure that these results were not specific to the MED1-IDR we explored whether purified Mediator complexes would form droplets in vitro and incorporate OCT4. The human Mediator complex was purified as previously described (Meyer et al., 2008) and then concentrated for use in the droplet formation assay (Figure S4E). Because purified endogenous Mediator does not contain a fluorescent tag, we monitored droplet formation by differential interference contrast (DIC) microscopy and found it to form droplets alone at ~200-400nM (Figure 4D). Consistent with the results for MED1-IDR droplets, OCT4 was incorporated within human Mediator complex droplets but incorporation of the OCT4 acidic mutant was attenuated. These results indicate that the MED1-IDR and the complete Mediator complex each exhibit phase-separating behaviors and suggest that they both incorporate OCT4 in a manner that is dependent on electrostatic interactions provided by acidic amino acids.
To test whether the OCT4 AD acidic mutations affect the ability of the factor to activate transcription in vivo, we utilized a GAL4 transactivation assay (Figure 4E). In this system, ADs or their mutant counterparts are fused to the GAL4 DBD and expressed in cells carrying a luciferase reporter plasmid. We found that the wild-type OCT4-AD fused to the GAL4-DBD was able to activate transcription, while the acidic mutant lost this function (Figure 4E). These results indicate that the acidic residues of the OCT4 ADs are necessary for both incorporation into MED1 phase-separated droplets in vitro and for gene activation in vivo.
Multiple TFs phase separate with Mediator subunit droplets
TFs with diverse types of ADs have been shown to interact with Mediator subunits, and MED1 is among the subunits that is most targeted by TFs (Table S1). An analysis of mammalian TFs confirmed that TFs and their putative ADs are enriched in IDRs, as previous analyses have shown (Liu et al., 2006; Staby et al., 2017b) (Figure 5A). We reasoned that many different TFs might interact with the MED1-IDR to generate liquid droplets and therefore be incorporated into MED1 condensates. To assess whether diverse MED1-interacting transcription factors can phase separate with MED1, we prepared purified recombinant, mEGFP-tagged, full length MYC, p53, NANOG, SOX2, RARa, GATA2, and ER (Table S3). When added to droplet formation buffers, most TFs formed droplets alone (Figure 5B). When added to droplet formation buffers with MED1-IDR, all 7 of these TFs concentrated into MED1-IDR droplets (Figure 5C, S5A). We selected p53 droplets for FRAP analysis; they exhibited rapid and dynamic internal reorganization (Figure S5B), supporting the notion that they are liquid condensates. These results indicate that TFs previously shown to interact with the MED1 subunit of Mediator can do so by forming phase-separated condensates with MED1.
Figure 5. Multiple TFs phase separate with Mediator droplets.
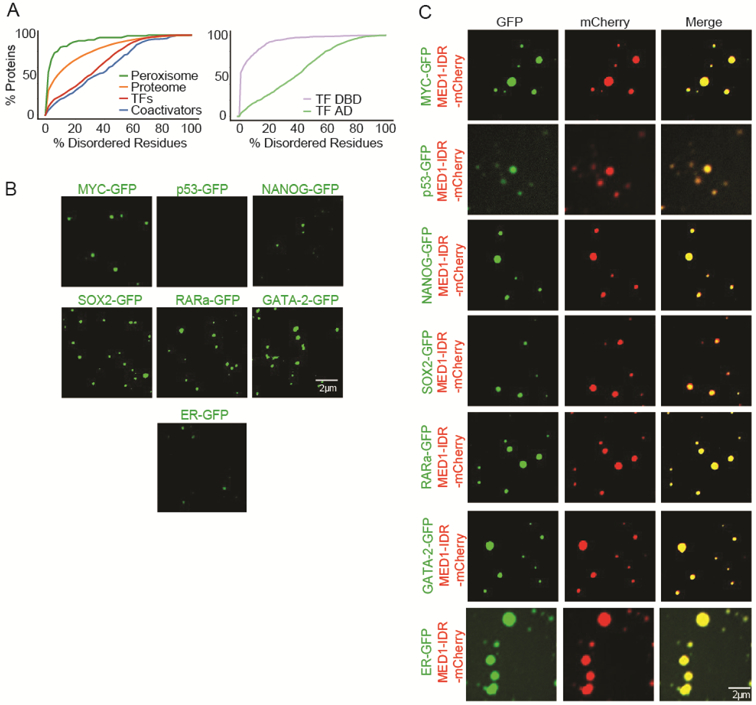
A. (Left graph) Percent disorder of various protein classes (x axis) plotted against the cumulative fraction of disordered proteins of that class (y axis). (Right graph) Disorder content of transcription factor (TF) DNA-binding domains (DBD) and putative activation domains (ADs).
B. Representative images of droplet formation assaying homotypic droplet formation of indicated TFs. Recombinant MYC-GFP (12uM), p53-GFP (40uM), NANOG-GFP (10uM), SOX2-GFP (40uM), RARa-GFP (40uM), GATA-2-GFP (40uM), and ER-GFP (40uM) was added to droplet formation buffers with 125mM NaCl and 10% PEG-8000.
C. Representative images of droplet formation showing that all tested TFs were incorporated into MED1-IDR droplets. 10uM of MED1-IDRmCherry and 10uM of either MYC-GFP, p53-GFP, NANOG-GFP, SOX2-GFP, RARa-GFP, GATA-2-GFP, or ER-GFP was added to droplet formation buffers with 125mM NaCl and 10% PEG-8000.
Estrogen stimulates phase separation of the Estrogen Receptor with MED1
The estrogen receptor (ER) is a well-studied example of a ligand-dependent TF. ER consists of an N-terminal ligand-independent AD, a central DBD, and a C-terminal ligand-dependent AD (also called the ligand binding domain (LBD)) (Figure 6A). Estrogen facilitates the interaction of ER with MED1 by binding the LBD of ER, which exposes a binding pocket for LXXLL motifs within the MED1-IDR (Figure 6A and 6B) (Manavathi et al., 2014). We noted that ER can form heterotypic droplets with the MED1-IDR recombinant protein used thus far in these studies (Figure 5C), which lacks the LXXLL motifs. This led us to investigate whether ER-MED1 droplet formation is responsive to estrogen and whether this involves the MED1 LXXLL motifs.
Fig. 6. Estrogen stimulates phase separation of the Estrogen Receptor with MED1.
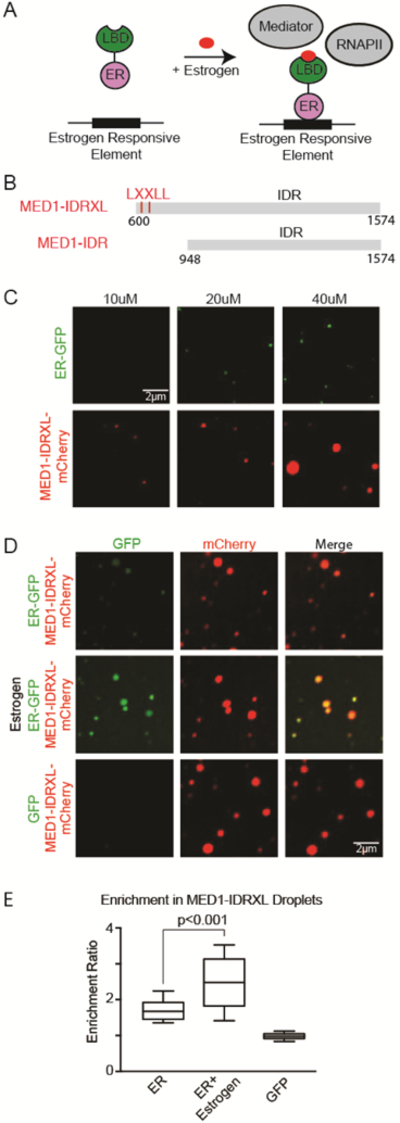
A. Schematic of estrogen stimulated gene activation. Estrogen facilitates the interaction of ER with Mediator and RNAPII by binding the ligand binding domain (LBD) of ER, which exposes a binding pocket for LXXLL motifs within the MED1-IDR.
B. Schematic view of the MED1-IDRXL, and MED1-IDR used for recombinant protein production.
C. Representative images of droplet formation, assaying homotypic droplet formation of ER-GFP and MED1-IDRXL-mCherry. Performed with the indicated protein concentration in droplet formation buffers with 125mM NaCl and 10% PEG-8000.
D. Representative confocal images of droplet formation showing that ER is incorporated into MED1-IDRXL droplets and the addition of estrogen considerably enhanced heterotypic droplet formation. ER-GFP, ER-GFP in the presence of estrogen, or GFP is mixed with MED1-IDRXL. 10uM of each indicated protein was added to droplet formation buffers with 125mM NaCl and 10% PEG-8000.
E. Enrichment ratio in MED1-IDRXL droplets of ER-GFP, ER-GFP in the presence of estrogen, or GFP. N>20, error bars represent the distribution between the 10th and 90th percentiles.
We performed droplet formation assays using a MED1-IDR recombinant protein containing LXXLL motifs (MED1-IDRXL-mCherry) and found that, similar to MED1-IDR and complete Mediator, it had the ability to form droplets alone (Figure 6C). We then tested the ability of ER to phase separate with MED1-IDRXL-mCherry and MED1-IDR-mCherry droplets. Some recombinant ER was incorporated and concentrated into MED1-IDRXL-mCherry droplets, but the addition of estrogen considerably enhanced heterotypic droplet formation (Figure 6D and 6E). In contrast, the addition of estrogen had little effect on droplet formation when the experiment was conducted with MED1-IDR-mCherry, which lacks the LXXLL motifs (Figure S6). These results show that estrogen, which stimulates ER-mediated transcription in vivo, also stimulates incorporation of ER into MED1-IDR droplets in vitro. Thus, OCT4 and ER both require the same amino acids/ligands for both phase separation and activation. Furthermore, since the LBD is a structured domain that undergoes a conformation shift upon estrogen binding to interact with MED1, it appears that structured interactions may contribute to transcriptional condensate formation.
GCN4 and MED15 phase separation is dependent on residues required for activation
Among the best studied TF-coactivator systems is the yeast TF GCN4 and its interaction with the MED15 subunit of Mediator (Brzovic et al., 2011; Herbig et al., 2010; Jedidi et al., 2010). The GCN4 AD has been dissected genetically, the amino acids that contribute to activation have been identified (Drysdale et al., 1995; Staller et al., 2018), and recent studies have shown that the GCN4 AD interacts with MED15 in multiple orientations and conformations to form a “fuzzy complex” (Tuttle et al., 2018). Weak interactions that form fuzzy complexes have features of the IDR-IDR interactions that are thought to produce phase-separated condensates.
To test whether GCN4 and MED15 can form phase-separated droplets, we purified recombinant yeast GCN4-GFP and the N-terminal portion of yeast MED15-mCherry containing residues 6-651 (hereafter called MED15), which are responsible for the interaction with GCN4. When added separately to droplet formation buffer, GCN4 formed micron-sized droplets only at quite high concentrations (40uM), and MED15 formed only small droplets at this high concentration (Figure 7A). When mixed together, however, the GCN4 and MED15 recombinant proteins formed double-positive, micron-sized, spherical droplets at lower concentrations (Figure 7B, S7A). These GCN4-MED15 droplets exhibited rapid FRAP kinetics (Figure S7B), consistent with liquid-like behavior. We generated a phase diagram of these two proteins, and found that they formed droplets together at low concentration (Figures S7C and S7D). This suggests that interaction between the two is required for phase separation at low concentration.
Fig 7. TF-Coactivator phase separation is dependent on residues required for transactivation.
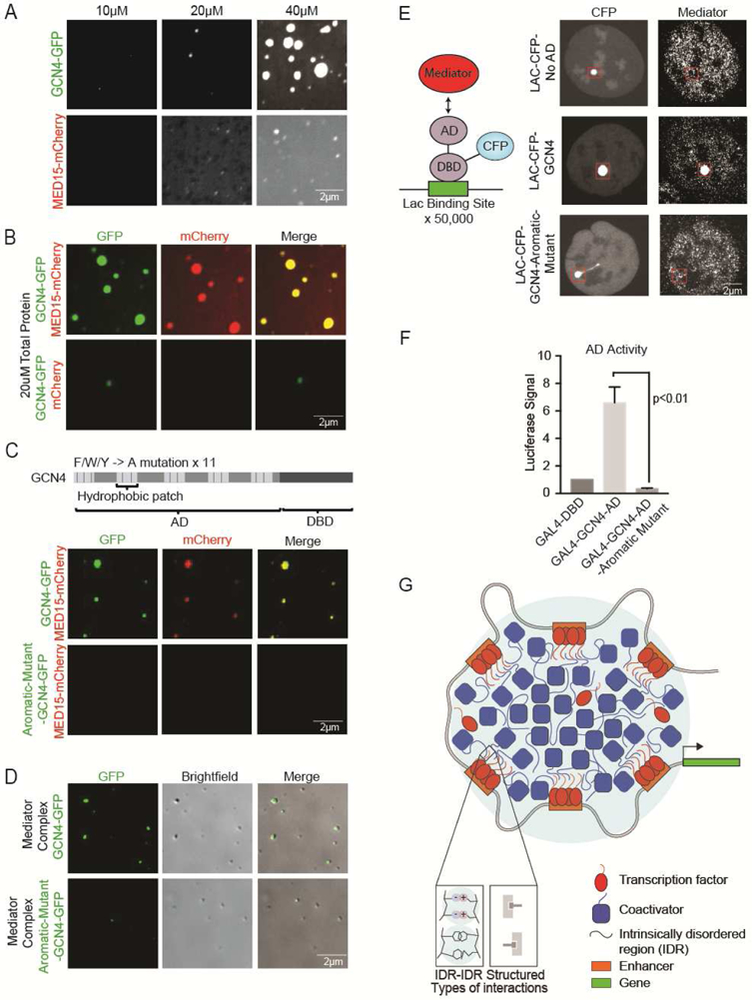
A. Representative confocal images of droplet formation of GCN4-GFP or MED15-mCherry were added to droplet formation buffers with 125mM NaCl and 10% PEG-8000.
B. Representative images of droplet formation showing that GCN4 forms droplets with MED15. GCN4-GFP and mCherry or GCN4-GFP and MED15-mCherry were added to droplet formation buffers at 10uM with 125mM NaCl and 10% PEG-8000 and imaged on a fluorescent microscope with the indicated filters.
C. (Top row) Schematic of GCN4 protein composed of an activation domain (AD) and DNA-binding domain (DBD). Aromatic residues in the hydrophobic patches of the AD are marked by blue lines. All 11 aromatic residues in the hydrophobic patches were mutated to alanine (A) to generate an GCN4-aromatic mutant. (Bottom row) Representative images of droplet formation showing that the ability of GCN4 aromatic mutant to form droplets with MED15 is attenuated. GCN4-GFP or GCN4-Aromatic-mutant-GFP and MED15-mCherry were added to droplet formation at 10uM each with 125mM NaCl and 10% PEG-8000.
D. (Upper panel) Representative images of droplet formation showing that GCN4 wild type but not GCN4 aromatic mutant are incorporated into Mediator complex droplets. 10uM of GCN4-GFP or GCN4-Aromatic-mutant-GFP was mixed with purified Mediator complex in droplet formation buffer with 125mM NaCl and 10% PEG-8000.
E. (Left panel) Schematic of the Lac assay. A U2OS cell bearing 50,000 repeats of the Lac operon is transfected with a Lac binding domain-CFP-AD fusion protein. (Right panel) IF of MED1 in Lac-U2OS cells transfected with the indicated Lac binding protein construct.
F. GAL4 activation assay. Transcriptional output as measured by luciferase activity in 293T cells, of the indicated activation domain fused to the GAL4 DBD.
G. Model showing transcription factors and coactivators forming phase-separated condensates at super-enhancers to drive gene activation. In this model, transcriptional condensates incorporate both dynamic and structured interactions.
The ability of GCN4 to interact with MED15 and activate gene expression has been attributed to specific hydrophobic patches and aromatic residues in the GCN4 AD (Drysdale et al., 1995; Staller et al., 2018; Tuttle et al., 2018). We created a mutant of GCN4 in which the 11 aromatic residues contained in these hydrophobic patches were changed to alanine (Figure 7C). When added to droplet formation buffers, the ability of the mutant protein to form droplets alone was attenuated (Figure S7E). Next, we tested whether droplet formation with MED15 was affected; indeed, the mutated protein has a compromised ability to form droplets with MED15 (Figure 7C and S7F). Similar results were obtained when GCN4 and the aromatic mutant of GCN4 was added to droplet formation buffers with the complete Mediator complex; while GCN4 was incorporated into Mediator droplets, the incorporation of the GCN4 mutant into Mediator droplets was attenuated (Figure 7D and S7G). These results demonstrate that multivalent, weak interactions between the AD of GCN4 and MED15 promote phase separation into liquidlike droplets.
The ADs of yeast TFs can function in mammalian cells and can do so by interacting with human Mediator (Oliviero et al., 1992). To investigate whether the aromatic mutant of GCN4 AD is impaired in its ability to recruit Mediator in vivo, the GCN4 AD and the GCN4 mutant AD were tethered to a Lac array in U2OS cells (Figure 7E) (Janicki et al., 2004). While the tethered GCN4 AD caused robust Mediator recruitment, the GCN4 aromatic mutant did not (Figure 7E). We used the GAL4 transactivation assay described previously to confirm that the GCN4 AD was capable of transcriptional activation in vivo, whereas the GCN4 aromatic mutant had lost that property (Figure 7F). These results provide further support for the idea that TF AD amino acids that are essential for phase separation with Mediator are required for gene activation.
DISCUSSION
The results described here support a model whereby TFs interact with Mediator and activate genes by the capacity of their ADs to form phase-separated condensates with this coactivator. For both the mammalian ESC pluripotency TF OCT4 and the yeast TF GCN4, we found that the AD amino acids required for phase separation with Mediator condensates were also required for gene activation in vivo. For the estrogen receptor, we found that estrogen stimulates the formation of phase-separated ER-MED1 droplets. ADs and coactivators generally consist of low-complexity amino acid sequences that have been classified as IDRs, and IDR-IDR interactions have been implicated in facilitating the formation of phase-separated condensates. We propose that IDR-mediated phase separation with Mediator is a general mechanism by which TF ADs effect gene expression, and provide evidence that this occurs in vivo at SEs. We suggest that the ability to phase separate with Mediator, which would employ the features of high valency and low affinity characteristic of liquid-liquid phase-separated condensates, operates alongside an ability of some TFs to form high affinity interactions with Mediator (Figure 7G) (Taatjes, 2017).
The model that TF ADs function by forming phase-separated condensates with coactivators explains several observations that are difficult to reconcile with classical lock-and-key models of protein-protein interaction. The mammalian genome encodes many hundreds of TFs with diverse ADs that must interact with a very small number of coactivators (Allen and Taatjes, 2015; Arany et al., 1995; Avantaggiati et al., 1996; Dai and Markham, 2001; Eckner et al., 1996; Gelman et al., 1999; Green, 2005; Liu et al., 2009; Merika et al., 1998; Oliner et al., 1996; Yin and Wang, 2014; Yuan et al., 1996), and ADs that share little sequence homology are functionally interchangeable among TFs (Godowski et al., 1988; Hope and Struhl, 1986; Jin et al., 2016; Lech et al., 1988; Ransone et al., 1990; Sadowski et al., 1988; Struhl, 1988; Tora et al., 1989). The common feature of ADs – the possession of low-complexity IDRs – is also a feature that is pronounced in coactivators. The model of coactivator interaction and gene activation by phase-separated condensate formation thus more readily explains how many hundreds of mammalian TFs interact with these coactivators.
Previous studies have provided important insights that prompted us to investigate the possibility that TF ADs function by forming phase-separated condensates. TF ADs have been classified by their amino acid profile as acidic, proline-rich, serine/threonine-rich, glutamine-rich, or by their hypothetical shape as acid blobs, negative noodles, or peptide lassos (Sigler, 1988). Many of these features have been described for IDRs that are capable of forming phase-separated condensates (Babu, 2016; Darling et al., 2018; Das et al., 2015; Dunker et al., 2015; Habchi et al., 2014; van der Lee et al., 2014; Oldfield and Dunker, 2014; Uversky, 2017; Wright and Dyson, 2015). Evidence that the GCN4 AD interacts with MED15 in multiple orientations and conformations to form a “fuzzy complex” (Tuttle et al., 2018) is consistent with the notion of dynamic low-affinity interactions characteristic of phase-separated condensates. Likewise, the low complexity domains of the FET (FUS/EWS/TAF15) RNA-binding proteins (Andersson et al., 2008) can form phase-separated hydrogels and interact with the RNA polymerase II C-terminal domain (CTD) in a CTD phosphorylation-dependent manner (Kwon et al., 2013); this may explain the mechanism by which RNA polymerase II is recruited to active genes in its unphosphorylated state and released for elongation following phosphorylation of the CTD.
The model we describe here for TF AD function may explain the function of a class of heretofore poorly understood fusion oncoproteins. Many malignancies bear fusion-protein translocations involving portions of TFs (Bradner et al., 2017; Kim et al., 2017; Latysheva et al., 2016). These abnormal gene products often fuse a DNA-or chromatin-binding domain to a wide array of partners, many of which are IDRs. For example, MLL may be fused to 80 different partner genes in AML (Winters and Bernt, 2017), the EWS-FLI rearrangement in Ewing’s Sarcoma causes malignant transformation by recruitment of a disordered domain to oncogenes (Boulay et al., 2017; Chong et al., 2017), and the disordered phase-separating protein FUS is found fused to a DBD in certain sarcomas (Crozat et al., 1993; Patel et al., 2015). Phase separation provides a mechanism by which such gene products result in aberrant gene expression programs; by recruiting a disordered protein to the chromatin, diverse coactivators may form phase-separated condensates to drive oncogene expression. Understanding the interactions which compose these aberrant transcriptional condensates, their structures, and behaviors may open new therapeutic avenues.
STAR METHODS
CONTACT FOR REAGENT AND RESOURCE SHARING
Further information and requests for resources and reagents should be directed to and will be fulfilled by the Lead Contact Richard Young (young@wi.mit.edu).
EXPERIMENTAL MODEL AND SUBJECT DETAILS
Cells
V6.5 murine embryonic stem were a gift from R. Jaenisch of the Whitehead Institute. V6.5 are male cells derived from a C57BL/6(F) × 129/sv(M) cross. HEK293T cells were purchased from ATCC (ATCC CRL-3216). Cells were negative for mycoplasma.
Cell Culture Conditions
V6.5 murine embryonic stem (mES) cells were grown in 2i + LIF conditions. mES cells were always grown on 0.2% gelatinized (Sigma, G1890) tissue culture plates. The media used for 2i + LIF media conditions is as follows: 967.5 mL DMEM/F12 (GIBCO 11320), 5 mL N2 supplement (GIBCO 17502048), 10 mL B27 supplement (GIBCO 17504044), 0.5mML-glutamine (GIBCO 25030), 0.5X non-essential amino acids (GIBCO 11140), 100 U/mL Penicillin-Streptomycin (GIBCO 15140), 0.1 mM b-mercaptoethanol (Sigma), 1 uM PD0325901 (Stemgent 04-0006), 3 uM CHIR99021 (Stemgent 04-0004), and 1000 U/mL recombinant LIF (ESGRO ESG1107). For differentiation mESCs were cultured in serum media as follows: DMEM (Invitrogen, 11965-092) supplemented with 15% fetal bovine serum (Hyclone, characterized SH3007103), 100 mM nonessential amino acids (Invitrogen, 11140-050), 2 mM L-glutamine (Invitrogen, 25030-081), 100 U/mL penicillin, 100 mg/mL streptomycin (Invitrogen, 15140-122), and 0.1mM b-mercaptoethanol (Sigma Aldrich). HEK293T cells were purchased from ATCC (ATCC CRL-3216) and cultured in DMEM, high glucose, pyruvate (GIBCO 11995-073) with 10% fetal bovine serum (Hyclone, characterized SH3007103), 100 U/mL Penicillin-Streptomycin (GIBCO 15140), 2 mM L-glutamine (Invitrogen, 25030-081). Cells were negative for mycoplasma.
METHOD DETAILS
Immunofluorescence with RNA FISH
Coverslips were coated at 37°C with 5ug/mL poly-L-o rnithine (Sigma-Aldrich, P4957) for 30 minutes and 5μg/mL of Laminin (Corning, 354232) for 2 hours. Cells were plated on the pre-coated cover slips and grown for 24 hours followed by fixation using 4% paraformaldehyde, PFA, (VWR, BT140770) in PBS for 10 minutes. After washing cells three times in PBS, the coverslips were put into a humidifying chamber or stored at 4°C in PBS. Permeabilization of cells were performed using 0.5% triton X100 (Sigma Aldrich, X100) in PBS for 10 minutes followed by three PBS washes. Cells were blocked with 4% IgG-free Bovine Serum Albumin, BSA, (VWR, 102643-516) for 30 minutes and indicated primary antibody (see table S2) was added at a concentration of 1:500 in PBS for 4-16 hours. Cells were washed with PBS three times followed by incubation with secondary antibody at a concentration of 1:5000 in PBS for 1 hour. After washing twice with PBS, cells were fixed using 4% paraformaldehyde, PFA, (VWR, BT140770) in PBS for 10 minutes. After two washes of PBS, Wash buffer A (20% Stellaris RNA FISH Wash Buffer A (Biosearch Technologies, Inc., SMF-WA1-60), 10% Deionized Formamide (EMD Millipore, S4117) in RNase-free water (Life Technologies, AM9932) was added to cells and incubated for 5 minutes. 12.5 μM RNA probe (Table S4, Stellaris) in Hybridization buffer (90% Stellaris RNA FISH Hybridization Buffer (Biosearch Technologies, SMF-HB1-10) and 10% Deionized Formamide) was added to cells and incubated overnight at 37C. After washing with Wash buffer A for 30 minutes at 37°C, the nuclei was stained in 20 μm/mL Hoechst 33258 (Life Technologies, H3569) for 5 minutes, followed by a 5 minute wash in Wash buffer B (Biosearch Technologies, SMF-WB1-20). Cells were washed once in water followed by mounting the coverslip onto glass slides with Vectashield (VWR, 101098-042) and finally sealing the cover slip with nail polish (Electron Microscopy Science Nm, 72180). Images were acquired at the RPI Spinning Disk confocal microscope with 100x objective using MetaMorph acquisition software and a Hammamatsu ORCA-ER CCD camera (W.M. Keck Microscopy Facility, MIT). Images were post-processed using Fiji Is Just ImageJ (FIJI).
Immunofluorescence with DNA FISH
Immunofluorescence was performed as previously above. After incubating the cells with the secondary antibodies, cells were washed three times in PBS for 5min at RT, fixed with 4% PFA in PBS for 10min and washed three times in PBS. Cells were incubated in 70% ethanol, 85% ethanol and then 100% ethanol for 1 minute at RT. Probe hybridization mixture was made mixing 7μL of FISH Hybridization Buffer (Agilent G9400A), 1 μl of FISH probes (see below for region) and 2μL of water. 5μL of mixture was added on a slide and coverslip was placed on top (cell-side toward the hybridization mixture). Coverslip was sealed using rubber cement. Once rubber cement solidified, genomic DNA and probes were denatured at 78°C for 5 minutes and slides were incubated at 16°C in the dark O/N. The coversl ip was removed from slide and incubated in pre-warmed Wash buffer 1 (Agilent, G9401A) at 73¼C for 2 minutes and in Wash Buffer 2 (Agilent, G9402A) for 1 minute at RT. Air dry slides and stain nuclei with Hoechst in PBS for 5 minutes at RT. Coverslips were washed three times in PBS, mounted on slide using Vectashield and sealed with nail polish. Images were acquired at the RPI Spinning Disk confocal microscope with 100× objective using MetaMorph acquisition software and a Hammamatsu ORCA-ER CCD camera (W.M. Keck Microscopy Facility, MIT).
DNA FISH probes were custom designed and generated by Agilent to target Nanog and MiR290 super enhancers.
Nanog
Design Input Region – mm9
chr6 122605249 – 122705248
Design Region – mm9
chr6: 122605985-122705394
Mir290
Design Region – mm10
chr7: 3141151 – 3241381
Tissue Culture
V6.5 murine embryonic stem cells (mESCs) were a gift from the Jaenisch lab. Cells were grown on 0.2% gelatinized (Sigma, G1890) tissue culture plates in 2i media, DMEM-F12 (Life Technologies, 11320082), 0.5X B27 supplement (Life Technologies, 17504044), 0.5X N2 supplement (Life Technologies, 17502048), an extra 0.5mM L-glutamine (Gibco, 25030-081), 0.1mM b-mercaptoethanol (Sigma, M7522), 1% Penicillin Streptomycin (Life Technologies, 15140163), 0.5X nonessential amino acids (Gibco, 11140-050), 1000 U/ml LIF (Chemico, ESG1107), 1μM PD0325901 (Stemgent, 04-0006-10), 3μM CHIR99021 (Stemgent, 04-0004-10). Cells were grown at 37°C with 5% CO2 in a humidified incubator. For confocal imaging, cells were grown on glass coverslips (Carolina Biological Supply, 633029), coated with 5 μg/mL of poly-L-ornithine (Sigma Aldrich, P4957) for 30 minutes at 37°C and w ith 5μg/ml of Laminin (Corning, 354232) for 2hrs-16hrs at 37°C. For passaging, cell s were washed in PBS (Life Technologies, AM9625), 1000 U/mL LIF. TrypLE Express Enzyme (Life Technologies, 12604021) was used to detach cells from plates. TrypLE was quenched with FBS/LIF-media (DMEM K/O (Gibco, 10829-018), 1X nonessential amino acids, 1% Penicillin Streptomycin, 2mM L-Glutamine, 0.1mM b-mercaptoethanol and 15% Fetal Bovine Serum, FBS, (Sigma Aldrich, F4135)). Cells were spun at 1000rpm for 3 minutes at RT, resuspended in 2i media and 5×10⁶ cells were plated in a 15 cm dish. For differentiation of mESCs, 6000 cells were plated per well of a 6 well tissue culture dish, or 1000 cells were plated per well of a 24 well plate with a laminin coated glass coverslip. After 24 hours, 2i media was replaced with FBS media (above) without LIF. Media was changed daily for 5 days, cells were then harvested.
Western Blot
Cells were lysed in Cell Lytic M (Sigma-Aldrich C2978) with protease inhibitors (Roche, 11697498001). Lysate was run on a 3%-8% Tris-acetate gel or 10% Bis-Tris gel or 3-8% Bis-Tris gels at 80 V for ~2 hrs, followed by 120 V until dye front reached the end of the gel. Protein was then wet transferred to a 0.45 μm PVDF membrane (Millipore, IPVH00010) in ice-cold transfer buffer (25 mM Tris, 192 mM glycine, 10% methanol) at 300 mA for 2 hours at 4°C. After transfer the membrane was blocked with 5% non-fat milk in TBS for 1 hour at room temperature, shaking. Membrane was then incubated with 1:1,000 of the indicated antibody (Table S2) diluted in 5% non-fat milk in TBST and incubated overnight at 4°C, with shaking. In the morning, the membrane was washed three times with TBST for 5 minutes at room temperature shaking for each wash. Membrane was incubated with 1:5,000 secondary antibodies for 1 hr at RT and washed three times in TBST for 5 minutes. Membranes were developed with ECL substrate (Thermo Scientific, 34080) and imaged using a CCD camera or exposed using film or with high sensitivity ECL.
Chromatin immunoprecipitation (ChIP) qPCR and sequencing
mES were grown to 80% confluence in 2i media. 1% formaldehyde in PBS was used for crosslinking of cells for 15 minutes, followed by quenching with Glycine at a final concentration of 125mM on ice. Cells were washed with cold PBS and harvested by scraping cells in cold PBS. Collected cells were pelleted at 1000 g for 3 minutes at 4°C, flash frozen in liquid nitrogen and stored at −80°C All buffers contained freshly prepared cOmplete protease inhibitors (Roche, 11873580001). Frozen crosslinked cells were thawed on ice and then resuspended in lysis buffer I (50 mM HEPES-KOH, pH 7.5, 140 mM NaCl, 1 mM EDTA, 10% glycerol, 0.5% NP-40, 0.25% Triton X-100, 1 3 protease inhibitors) and rotated for 10 minutes at 4°C, then spun at 1350 rcf, for 5 minutes at 4°C. The pellet was resuspended in lysis buffer II (10 mM Tris-HCl, pH 8.0, 200 mM NaCl, 1 mM EDTA, 0.5 mM EGTA, 1 3 protease inhibitors) and rotated for 10 minutes at 4°C and spun at 1350 rcf. for 5 minutes at 4°C. The pellet was resuspended in sonication buffer (20 mM Tris-HCl pH 8.0, 150 mM NaCl, 2 mM EDTA pH 8.0, 0.1% SDS, and 1% Triton X-100, 1 3 protease inhibitors) and then sonicated on a Misonix 3000 sonicator for 10 cycles at 30 s each on ice (18-21 W) with 60 s on ice between cycles. Sonicated lysates were cleared once by centrifugation at 16,000 rcf. for 10 minutes at 4°C. Input material was reserved and the remainder was incubated overnight at 4°C with magnetic beads bound with antibody (Table S2) to enrich for DNA fragments bound by the indicated factor. Beads were washed twice with each of the following buffers: wash buffer A (50 mM HEPES-KOH pH 7.5, 140 mM NaCl, 1 mM EDTA pH 8.0, 0.1% Na-Deoxycholate, 1% Triton X-100, 0.1% SDS), wash buffer B (50 mM HEPES-KOH pH 7.9, 500 mM NaCl, 1 mM EDTA pH 8.0, 0.1% Na-Deoxycholate, 1% Triton X-100, 0.1% SDS), wash buffer C (20 mM Tris-HCl pH8.0, 250 mM LiCl, 1 mM EDTA pH 8.0, 0.5% Na-Deoxycholate, 0.5% IGEPAL C-630, 0.1% SDS), wash buffer D (TE with 0.2% Triton X-100), and TE buffer. DNA was eluted off the beads by incubation at 65°C for 1 hour with intermittent vortexing in elution buffer (50 mM Tris-HCl pH 8.0, 10 mM EDTA, 1% SDS). Cross-links were reversed overnight at 65°C. To purify eluted DNA, 200 μL TE was added and then RNA was degraded by the addition of 2.5 μL of 33 mg/mL RNase A (Sigma, R4642) and incubation at 37°C for 2 hours. Protein was degraded by the addition of 10 μL of 20 mg/mL proteinase K (Invitrogen, 25530049) and incubation at 55°C for 2 hours. A phenol:chloroform:isoamyl alcohol extraction was performed followed by an ethanol precipitation. The DNA was then resuspended in 50 μL TE and used for either qPCR or sequencing. For ChIP-qPCR experiments, qPCR was performed using Power SYBR Green mix (Life Technologies #4367659) on either a QuantStudio 5 or a QuantStudio 6 System (Life Technologies).
RNA-Seq
RNA-Seq was performed in the indicated cell line with the indicated treatment, and used to determine expressed genes. RNA was isolated by AllPrep Kit (Qiagen 80204) and stranded polyA selected libraries was prepared using the TruSeq Stranded mRNA Library Prep Kit (Illumina, RS-122-2101) according to manufacturer’s protocol and single-end sequenced on a Hi-seq 2500 instrument.
Protein purification
cDNA encoding the genes of interest or their IDRs were cloned into a modified version of a T7 pET expression vector. The base vector was engineered to include a 5’ 6×HIS followed by either mEGFP or mCherry and a 14 amino acid linker sequence “GAPGSAGSAAGGSG.” NEBuilder® HiFi DNA Assembly Master Mix (NEB E2621S) was used to insert these sequences (generated by PCR) in-frame with the linker amino acids. Vectors expressing mEGFP or mCherry alone contain the linker sequence followed by a STOP codon. Mutant sequences were synthesized as geneblocks (IDT) and inserted into the same base vector as described above. All expression constructs were sequenced to ensure sequence identity. For protein expression plasmids were transformed into LOBSTR cells (gift of Chessman Lab) and grown as follows. A fresh bacterial colony was inoculated into LB media containing kanamycin and chloramphenicol and grown overnight at 37°C. Cells containing the MED1-IDR constructs were diluted 1:30 in 500ml room temperature LB with freshly added kanamycin and chloramphenicol and grown 1.5 hours at 16°C. IPTG was added to 1mM and growth continued for 18 hours. Cells were collected and stored frozen at −80°C. Cells containing all other constructs were treated in a similar manner except they were grown for 5 hours at 37°C after IPTG induction.
Pellets of 500ml of cMyc and Nanog cells were resuspended in 15ml of denaturing buffer (50mM Tris 7.5, 300mM NaCl, 10mM imidazole, 8M Urea) containing complete protease inhibitors (Roche,11873580001) and sonicated (ten cycles of 15 seconds on, 60 sec off). The lysates were cleared by centrifugation at 12,000g for 30 minutes and added to 1ml of Ni-NTA agarose (Invitrogen, R901-15) that had been pre-equilibrated with 10 volumes of the same buffer. Tubes containing this agarose lysate slurry were rotated for 1.5 hours. The slurry was poured into a column, washed with 15 volumes of the lysis buffer and eluted 4 X with denaturing buffer containing 250mM imidazole. Each fraction was run on a 12% gel and proteins of the correct size were dialyzed first against buffer (50mM Tris pH 7.5, 125Mm NaCl, 1Mm DTT and 4M Urea), followed by the same buffer containing 2M Urea and lastly 2 changes of buffer with 10% Glycerol, no Urea. Any precipitate after dialysis was removed by centrifugation at 3.000rpm for 10 minutes. All other proteins were purified in a similar manner. 500ml cell pellets were resuspended in 15ml of Buffer A (50mM Tris pH7.5, 500 mM NaCl) containing 10mM imidazole and cOmplete protease inhibitors, sonicated, lysates cleared by centrifugation at 12,000g for 30 minutes at 4°C, added to 1ml of p re-equilibrated Ni-NTA agarose, and rotated at 4°C for 1.5 hours. The slurry was poure d into a column, washed with 15 volumes of Buffer A containing 10mM imidazole and protein was eluted 2 X with Buffer A containing 50mM imidazole, 2 X with Buffer A containing 100mM imidazole, and 3 X with Buffer A containing 250mM imidazole. Alternatively, the resin slurry was centrifuged at 3,000rpm for 10 minutes, washed with 15 volumes of Buffer and proteins were eluted by incubation for 10 or more minutes rotating with each of the buffers above (50mM, 100mM and 250mM imidazole) followed by centrifugation and gel analysis. Fractions containing protein of the correct size were dialyzed against two changes of buffer containing 50mM Tris 7.5, 125mM NaCl, 10% glycerol and 1mM DTT at 4°C.
In vitro droplet assay
Recombinant GFP or mCherry fusion proteins were concentrated and desalted to an appropriate protein concentration and 125mM NaCl using Amicon Ultra centrifugal filters (30K MWCO, Millipore). Recombinant proteins were added to solutions at varying concentrations with indicated final salt and 10% PEG-8000 as crowding agent in Droplet Formation Buffer (50mM Tris-HCl pH 7.5, 10% glycerol, 1mM DTT). The protein solution was immediately loaded onto a homemade chamber comprising a glass slide with a coverslip attached by two parallel strips of double-sided tape. Slides were then imaged with an Andor confocal microscope with a 150x objective. Unless indicated, images presented are of droplets settled on the glass coverslip. For experiments with fluorescently labeled polypeptides, the indicated decapeptides were synthesized by the Koch Institute/MIT Biopolymers & Proteomics Core Facility with a TMR fluorescent tag. The protein of interest was added Buffer D with 125mM NaCl and 10% Peg-8000 with the indicated polypeptide and imaged as described above. For FRAP of in vitro droplets 5 pulses of laser at a 50us dwell time was applied to the droplet, and recovery was imaged on an Andor microscope every 1s for the indicated time periods. For estrogen stimulation experiments, fresh B-Estradiol (E8875 Sigma) was reconstituted to 10mM in 100% EtOH then diluted in 125mM NaCl droplet formation buffer to 100uM. One microliter of this concentrated stock was used in a 10uL droplet formation reaction to achieve a final concentration of 10uM.
Genome Editing and protein degradation
The CRISPR/Cas9 system was used to genetically engineer ESC lines. Target-specific oligonucleotides were cloned into a plasmid carrying a codon-optimized version of Cas9 with GFP (gift from R. Jaenisch). The sequences of the DNA targeted (the protospacer adjacent motif is underlined) are listed in the same table. For the generation of the endogenously tagged lines, 1 million Med1-mEGFP tagged mES cells were transfected with 2.5 mg Cas9 plasmid containing the guide sequence below (pX330-GFP-Oct4) and 1.25 mg non-linearized repair plasmid 1 (pUC19-Oct4-FKBP-BFP) and 1.25 mg non-linearized repair plasmid 2 (pUC19-Oct4-FKBP-mcherry) (Table S3). Cells were sorted after 48 hours for the presence of GFP. Cells were expanded for five days and then sorted again for double positive mCherry and BFP cells. Forty thousand mCherry+/BFP+ sorted cells were plated in a six-well plate in a serial dilution. The cells were grown for approximately one week in 2i medium and then individual colonies were picked using a stereoscope into a 96-well plate. Cells were expanded and genotyped by PCR, degradation was confirmed by western blot and IF. Clones with a homozygous knock-in tag were further expanded and used for experiments. A clonal homozygous knock-in line expressing FKBP tagged Oct4 was used for the degradation experiments. Cells were grown in 2i and then treated with dTAG-47 at a concentration of 100 nM for 24 hours, then harvested.
Oct4 Guide sequence
tgcattcaaactgaggcacc*NGG(PAM)
GAL4 Transcription assay
Transcription factor constructs were assembled in a mammalian expression vector containing an SV40 promoter driving expression of a GAL4 DNA-binding domain. Wild type and mutant activation domains of Oct4 and Gcn4 were fused to the C-terminus of the DNA-binding domain by Gibson cloning (NEB 2621S), joined by the linker GAPGSAGSAAGGSG. These transcription factor constructs were transfected using Lipofectamine 3000 (Thermofisher L3000015) into HEK293T cells (ATCC CRL-3216) or V6.5 mouse embryonic stem cells, that were grown in white flat-bottom 96-well assay plates (Costar 3917). The transcription factor constructs were co-transfected with a modified version of the PGL3-Basic (Promega) vector containing five GAL4 upstream activation sites upstream of the firefly luciferase gene. Also co-transfected was pRL-SV40 (Promega), a plasmid containing the Renilla luciferase gene driven by an SV40 promoter. 24 hours after transfection, luminescence generated by each luciferase protein was measured using the Dual-glo Luciferase Assay System (Promega E2920). The data as presented has been controlled for Renilla luciferase expression.
Lac Binding Assay
Constructs were assembled by NEB HIFI cloning in pSV2 mammalian expression vector containing an SV40 promoter driving expression of a CFP-LacI fusion protein. The activation domains and mutant activation domains of Gcn4 were fused by the c-terminus to this recombinant protein, joined by the linker sequence GAPGSAGSAAGGSG. U2OS-268 cells containing a stably integrated array of ~51,000 Lac-repressor binding sites (a gift of the Spector laboratory) were transfected using lipofectamine 3000 (Thermofisher L3000015). 24 hours after transfection, cells were plated on fibronectin-coated glass coverslips. After 24 hours on glass coverslips, cells were fixed for immunofluorescence with a MED1 antibody (Table S2) as described above and imaged, by spinning disk confocal microscopy.
Purification of CDK8-Mediator
The CDK8-Mediator samples were purified as described (Meyer et al., 2008) with modifications. Prior to affinity purification, the P0.5M/QFT fraction was concentrated, to 12 mg/mL, by ammonium sulfate precipitation (35%). The pellet was resuspended in pH 7.9 buffer containing 20 mM KCl, 20mM HEPES, 0.1mM EDTA, 2mM MgCl2, 20% glycerol and then dialyzed against pH 7.9 buffer containing 0.15M KCl, 20mM HEPES, 0.1mM EDTA, 20% glycerol and 0.02% NP-40 prior to the affinity purification step. Affinity purification was carried out as described (Meyer et al., 2008), eluted material was loaded onto a 2.2mL centrifuge tube containing 2mL 0.15M KCl HEMG (20mM HEPES, 0.1mM EDTA, 2mM MgCl2, 10% glycerol) and centrifuged at 50K RPM for 4h at 4°C. This served to remove excess free GST-SREBP and to concentrate the CDK8-Mediator in the final fraction. Prior to droplet assays, purified CDK8-Mediator was concentrated using Microcon-30kDa Centrifugal Filter Unit with Ultracel-30 membrane (Millipore MRCF0R030) to reach ~300nM of Mediator complex. Concentrated CDK8-Mediator was added to the droplet assay to a final concentration of ~200nM with or without 10μM indicated GFP-tagged protein. Droplet reactions contained 10% PEG-8000 and 140mM salt.
QUANTIFICATION AND STATISTICAL ANALYSIS
Experimental Design
All experiments were replicated. For the specific number of replicates done see either the figure legends or the specific section below. No aspect of the study was done blinded. Sample size was not predetermined and no outliers were excluded.
Average image and radial distribution analysis
For analysis of RNA FISH with immunofluorescence custom in-house MATLAB™ scripts were written to process and analyze 3D image data gathered in FISH (RNA/DNA) and IF channels. FISH foci were manually identified in individual z-stacks through intensity thresholds, centered along a box of size l = 2.9 μm, and stitched together in 3-D across z-stacks. The called FISH foci are cross-referenced against a manually curated list of FISH foci to remove false positives, which arise due to extra-nuclear signal or blips. For every RNA FISH focus identified, signal from the corresponding location in the IF channel is gathered in the l × l square centered at the RNA FISH focus at every corresponding z-slice. The IF signal centered at FISH foci for each FISH and IF pair are then combined and an average intensity projection is calculated, providing averaged data for IF signal intensity within a l × l square centered at FISH foci. The same process was carried out for the FISH signal intensity centered on its own coordinates, providing averaged data for FISH signal intensity within a l × l square centered at FISH foci. As a control, this same process was carried out for IF signal centered at randomly selected nuclear positions. Randomly selected nuclear positions were identified for each image set by first identifying nuclear volume and then selecting positions within that volume. Nuclear volumes were determined from DAPI staining through the z-stack image, which was then processed through a custom CellProfiler pipeline (included as auxiliary file). Briefly, this pipeline rescales the image intensity, condenses the image to 20% of original size for speed of processing, enhances detected speckles, filters median signal, thresholds bodies, removes holes, filters the median signal, dilates the image back to original size, watersheds nuclei, and converts the resulting objects into a black and white image. This black and white image is used as input for a custom R script that uses readTIFF and im (from spatstat) to select 40 random nuclear voxels per image set. These average intensity projections were then used to generate 2D contour maps of the signal intensity or radial distribution plots. Contour plots are generated using in-built functions in MATLAB™. The intensity radial function (I(r)) is computed from the average data. For the contour plots, the intensity-color ranges presented were customized across a linear range of colors (n! = 15). For the FISH channel, black to magenta was used. For the IF channel, we used chroma.js (an online color generator) to generate colors across 15 bins, with the key transition colors chosen as black, blueviolet, mediumblue, lime. This was done to ensure that the reader’s eye could more readily detect the contrast in signal. The generated colormap was employed to 15 evenly spaced intensity bins for all IF plots. The averaged IF centered at FISH or at randomly selected nuclear locations are plotted using the same color scale, set to include the minimum and maximum signal from each plot. For DNA FISH analysis FISH foci were manually identified in individual z-stacks through intensity thresholds in FIJI and marked as a reference area. The reference areas were then transferred to the MED1 IF channel of the image and the average IF signal within the FISH focus was determined. The average signal across 5 images comprising greater than 10 cells per image was averaged to calculate the mean MED1 IF intensity associated with the DNA FISH focus.
Chromatin immunoprecipitation PCR and sequencing (ChIP) Analysis
Values displayed in the figures were normalized to the input. The average WT norm values and standard deviation are displayed. The primers used are listed below. ChIP values at the region of interest (ROI) were normalized to input values (fold input) and for the mir290 enhancer an additional negative region (negative norm) Values are displayed as normalized to the ES state in differentiation experiments and to DMSO control in OCT4 degradation experiments (control normalization). qPCR reactions were performed in technical triplicate.
ChIP qPCR Primers
Mir290
mir290_Neg_F GGACTCCATCCCTAGTATTTGC
mir290_Neg_R GCTAATCACAAATTTGCTCTGC
mir290_OCT4_F CCACCTAAACAAAGAACAGCAG
mir290_OCT4_R TGTACCCTGCCACTCAGTTTAC
mir290_MED1_F AAGCAGGGTGGTAGAGTAAGGA
mir290 MED1_R ATTCCCGATGTGGAGTAGAAGT
ChIP-Seq data were aligned to the mm9 version of the mouse reference genome using bowtie with parameters –k 1 –m 1 –best and –l set to read length. Wiggle files for display of read coverage in bins were created using MACS with parameters –w –S – space=50 –nomodel –shiftsize=200, and read counts per bin were normalized to the millions of mapped reads used to make the wiggle file. Reads-per-million-normalized wiggle files were displayed in the UCSC genome browser. ChIP-Seq tracks shown in Figure 1 are derived from GSM1082340 (OCT4) and GSM560348 (MED1) from Whyte et al., 2013. Super-enhancers and typical enhancers and their associated genes in cells grown in 2i conditions were downloaded from Sabari et al., 2018. Distributions of occupancy fold-changes were calculated using bamToGFF (https://github.com/BradnerLab/pipeline) to quantify coverage in super-enhancers and typical enhancers from cells grown in 2i conditions. Reads overlapping each typical and super-enhancer were determined using bamToGFF with parameters -e 200 -f 1 -t TRUE and were subsequently normalized to the millions of mapped reads (RPM). RPM-normalized input read counts from each condition were then subtracted from RPM-normalized ChIP-Seq read counts from the corresponding condition. Values from regions wherein this subtraction resulted in a negative number were set to 0. Log2 fold-changes were calculated between DMSO-treated (normal OCT4 amount) and dTAG-treated (depleted OCT4); one pseudocount was added to each condition.
Super-enhancer identification
Super-enhancers were identified as described in Whyte et al.. Peaks of enrichment in MED1 were identified using MACS with –p 1e-9 –keep-dup=1 and input control. MED1 aligned reads from the untreated condition and corresponding peaks of MED1 were used as input for ROSE (https://bitbucket.org/young_computation/) with parameters -s 12500 -t 2000 -g mm9 and input control. A custom gene list was created by adding D7Ertd143e, and removing Mir290, Mir291a, Mir291b, Mir292, Mir293, Mir294, and Mir295 to prevent these nearby microRNAs that are part of the same transcript from being multiply counted. Stitched enhancers (super-enhancers and typical enhancers) were assigned to the single expressed RefSeq transcript whose promoter was nearest the center of the stitched enhancer. Expressed transcripts were defined as above.
RNA-Seq Analysis
For analysis, raw reads were aligned to the mm9 revision of the mouse reference genome using hisat2 with default parameters. Gene name-level read count quantification was performed with htseq-count with parameters -I gene_id – stranded=reverse -f bam -m intersection-strict and a GTF containing transcript positions from Refseq, downloaded 6/6/18. Normalized counts, normalized fold-changes, and differential expression p values were determined using DEseq2 using the standard workflow and both replicates of each condition.
Enrichment and charge analysis of OCT4
Amino acid composition plots were generated using R by plotting the amino acid identity of each residue along the amino acid sequence of the protein. Net charge per residue for OCT4 was determined by computing the average amino acid charge along the OCT4 amino acid sequence in a 5 amino acid sliding window using the localCIDER package (Holehouse et al., 2017).
Disorder enrichment analysis
A list of human transcription factors protein sequences is used for all analysis on TFs, as defined in (Saint-andré et al.). The reference human proteome (Uniprot UP000005640) is used to distill the list (down to ~1200 proteins), mostly removing non-canonical isoforms. Transcriptional coactivators and Pol II associated proteins were identified in humans using the GO enrichments IDS GO:0003713 and GO:0045944. The reference human proteome defined above was used to generate list of all human proteins, and peroxisome and golgi proteins were identified from Uniprot reviewed lists. For each protein, D2P2 was used to assay disorder propensity for each amino acid. An amino acid in a protein is considered disordered if at least 75 % of the algorithms employed by D2P2 (Oates et al., 2013) predict the residue to be disordered. Additionally, for transcription factors, all annotated PFAM domains were identified (5741 in total, 180 unique domains). Cross-referencing PFAM annotation for known DNA-binding activity, a subset of 45 unique high-confidence DNA-binding domains were identified, accounting for ~85% of all identified domains. The vast majority of TFs (>95%) had at least one identified DNA-binding domain. Disorder scores were computed for all DNA-binding regions in every TF, as well as the remaining part of the sequence, which includes most identified trans-activation domains.
Imaging analysis of in vitro droplets
To analyze in-vitro phase separation imaging experiments, custom MATLAB™ scripts were written to identify droplets and characterize their size and shape. For any particular experimental condition, intensity thresholds based on the peak of the histogram and size thresholds (2 pixel radius) were employed to segment the image. Droplet identification was performed on the “scaffold” channel (MED1 in case of MED1 + TFs, GCN4 for GCN4+MED15), and areas and aspect ratios were determined. To calculate enrichment for the in vitro droplet assay, droplets were defined as a region of interest in FIJI by the scaffold channel, and the maximum signal of the client within that droplet was determined. Scaffolds chosen were MED1, Mediator complex, or GCN4. This was divided by the background client signal in the image to generate a Cin/out. Enrichment scores were calculated by dividing the Cin/out of the experimental condition by the Cin/out of a control fluorescent protein (either GFP or mCherry).
DATA AND SOFTWARE AVAILABILITY
Datasets
| Figure | Dataset type | IP target | Sample | GEO |
|---|---|---|---|---|
| 2B | ChIP-Seq | OCT4 | Oct4-degron + DMSO | GSM3401065 |
| 2B | ChIP-Seq | OCT4 | Oct4-degron + dTag | GSM3401066 |
| 2B | ChIP-Seq | MED1 | Oct4-degron + DMSO | GSM3401067 |
| 2B | ChIP-Seq | MED1 | Oct4-degron + dTag | GSM3401068 |
| 2B | ChIP-Seq Input | N/A | Oct4-degron + DMSO | GSM3401069 |
| 2B | ChIP-Seq Input | N/A | Oct4-degron + dTag | GSM3401070 |
| 2B | RNA-Seq | N/A | Oct4-degron + DMSO |
GSM3401252 GSM3401253 |
| 2B | RNA-Seq | N/A | Oct4-degron + dTag |
GSM3401254 GSM3401255 |
| 2H | RNA-Seq | N/A | ES Cell |
GSM3401256 GSM3401257 |
| 2H | RNA-Seq | N/A | Differentiating ES Cell |
GSM3401258 GSM3401259 |
Overall accession: GSE120476
Supplementary Material
Related to Figure 1. Random focus analysis. Average fluorescence centered at the indicated RNA FISH focus (top panels) versus a randomly distributed IF foci +/− 1.5 microns in X and Y (bottom panels). Color scale bars present arbitrary units of fluorescence intensity.
Related to Figure 2. OCT4 degradation and ES cell differentiation. A. Schematic of the Oct4-FKBP cell-engineering strategy. V6.5 mouse ES cells were transfected with a repair vector and Cas9 expressing plasmid to generate knock-in loci with either BFP or RFP for selection (Left). WT or untreated OCT4-dTAG ES cells blotted for OCT4 showing expected shift in size, HA (on FKBP), and ACTIN (Right). B. Western blot against OCT4 (left panels), MED1 (right panels), and BETA-ACTIN in the OCT4 degron line (dTAG), either treated with dTag47 or vehicle (DMSO). C. Mean intensity of the MED1 immunofluorescence signal within the Nanog DNA FISH focus in DMSO treated, vs dTAG treated OCT4-degron cells. N=5 images, error bars are distribution between the 10th and 90th percentile. D. Schematic showing the position of primers used for OCT4 (P1) and MED1 (P2) ChIP-qPCR in differentiated and ES cells at the MiR290 locus. E. Western blot against MED1 and BETA-ACTIN in ES cells or cells differentiated by LIF withdrawal. F. Mean intensity of MED1 immunofluorescence signal within MiR290 DNA FISH focus in ES cells versus cells differentiated by LIF withdrawal. N=5 images, error bars are distribution between the 10th and 90th percentile.
Related to Figure 3. MED1 and OCT4 droplet formation. A. Enrichment ratio of OCT4-GFP versus GFP in MED1-IDR-mCherry droplets formed in droplet formation buffer with 10% PEG-8000 at 125mM NaCl. N>20, error bars represent the distribution between the 10th and 90th percentile. B. Area in micrometers-squared of MED1-IDR-OCT4 droplets formed in 10% PEG-8000 at 125mM salt with 10uM of each protein. C. Aspect ratio of MED1-IDR-OCT4 droplets formed in 10% PEG-8000 at 125mM with 10uM of each protein. N>20, error bars represent the distribution between the 10th and 90th percentile. D. Area in micrometers-squared of MED1-IDR-OCT4 droplets formed in 10% PEG-8000 at 125mM, 225uM, or 300uM salt, with 10uM of each protein. E. Fluorescence microscopy of droplet formation without crowding agents at 50mM NaCl for the indicated protein or combination of proteins (at 10uM each), imaged in the channel indicated at the top of the panel. F. Enrichment ratio of OCT4-GFP versus GFP in MED1-IDR-mCherry droplets formed in droplet formation buffer without crowding agent at 50mM NaCl. N>20, error bars represent the distribution between the 10th and 90th percentile.
Related to Figure 4. Phase separation of mutant OCT4. A. Fluorescent microscopy of the indicated TMR-labeled polypeptide, at the indicated concentration in droplet formation buffers with 10% PEG-8000 and 125mM NaCl. B. Enrichment ratios of the indicated polypeptide within MED1-IDR-mCherry droplets. N>20, error bars represent the distribution between the 10th and 90th percentile. C. Enrichment ratios of the indicated protein within MED1-IDR-mCherry droplets. N>20, error bars represent the distribution between the 10th and 90th percentile. D. (Upper panel) Schematic of OCT4 protein, aromatic residues in the activation domains (ADs) are marked by blue horizontal lines. All 9 aromatic residues in the N-terminal Activation Domain (N-AD) and 10 aromatic residues in the C-terminal Activation Domain (C-AD) were mutated to alanine to generate an OCT4-aromatic mutant. (Lower panel) Representative confocal images of droplet formation showing that the OCT4 aromatic mutant is still incorporated into MED1-IDR droplets. MED1-IDR-mCherry and OCT4-GFP or MED1-IDR-mCherry and OCT4-aromatic mutant-GFP were added to droplet formation buffers with 125mM NaCl at 10uM each with 10% PEG-8000 and visualized on a fluorescent microscope with the indicated filters. E. Droplets of intact Mediator complex were collected by pelleting and equal volumes of input, supernatant, and pellet were run on an SDS-PAGE gel and stained with sypro ruby. Mediator subunits present in the pellet are annotated on the rightmost column.
Related to Figure 5. Diverse TFs phase separate with Mediator. A. Enrichment ratios of the indicated GFP-fused TF in MED1-IDR-mCherry droplets. N>20, error bars represent the distribution between the 10th and 90th percentile. B. FRAP of heterotypic p53-GFP/MED1-IDR-mCherry droplets formed in droplet formation buffers with 10% PEG-8000 and 125mM NaCL, imaged every second over 30 seconds.
Related to Figure 6. Estrogen receptor phase separates with MED1. A. Enrichment ratio of ER-GFP in MED1-IDR-mCherry droplets in the presence or absence of 10uM estrogen. Droplets were formed in 10% PEG-8000 with 125mM NaCl. N>20, error bars represent the distribution between the 10th and 90th percentile.
Related to Figure 7. GCN4 and MED15 form phase separated droplets. A. Enrichment ratio of mCherry or MED15-mCherry in GCN4-GFP droplets, in droplet formation buffer with 10% PEG-8000 and 125mM NaCl. N>20, error bars represent the distribution between the 10th and 90th percentile. B. FRAP of heterotypic GCN4-GFP/MED15-IDR-mCherry droplets formed in droplet formation buffers with 10% PEG-8000 and 125mM NaCl, imaged every second over 30 seconds. C. Phase diagram of GCN4-GFP and MED15-mCherry added at the indicated concentrations to droplet formation buffers with 10% PEG-8000 and 125mM salt. D. Enrichment ratio of GCN4 droplets from S7C. N>20, error bars represent the distribution between the 10th and 90th percentile. E. Fluorescent imaging of GCN4-GFP or the aromatic mutant of GCN4-GFP at the indicated concentration in 10% PEG-8000 and 125mM NaCl. Shown are images from GFP channel. F. Enrichment ratio of GCN4-GFP or the aromatic mutant of GCN4-GFP in MED15-mCherry droplets, formed in droplet formation buffer with 10% PEG-8000 and 125mM salt. N>20, error bars represent the distribution between the 10th and 90th percentile. G. Enrichment ratio of GFP, GCN4-GFP or GCN4-aromatic mutant-GFP in Mediator complex droplets. N>20, error bars represent the distribution between the 10th and 90th percentiles.
Related to Figure 1. Table of reported transcription factor-mediator subunit interactions.
Highlights.
Transcription factors (TFs) form phase-separated condensates with Mediator
Phase separation of activation domains is a general property of TFs
Phase separation capacity of TFs is associated with gene activation
TF condensates incorporate dynamic and structured interactions
Acknowledgments
We thank Wendy Salmon of the W.M Keck Microscopy Facility, The Whitehead Genomics Core, Arup Chakraborty, and Philip A. Sharp. The work was supported by NIH grant GM123511 and NSF grant PHY1743900 (R.A.Y.), NIH Grant GM117370 (D.J.T.), Swedish Research Council Postdoctoral Fellowship (VR 2017-00372) (A.B.), NIH Grant T32CA009172 (I.A.K.), Damon Runyon Cancer Research Foundation Fellowship (2309-17) (B.R.S.), NSF Graduate Research Fellowship (A.V.Z.), Hope Funds for Cancer Research fellowship (B.J.A.), Cancer Research Institute Irvington Fellowship (Y.E.G.), T32GM08759 (C.B.F.), NWO Rubicon Fellowship (J.S.).
Footnotes
Publisher's Disclaimer: This is a PDF file of an unedited manuscript that has been accepted for publication. As a service to our customers we are providing this early version of the manuscript. The manuscript will undergo copyediting, typesetting, and review of the resulting proof before it is published in its final citable form. Please note that during the production process errors may be discovered which could affect the content, and all legal disclaimers that apply to the journal pertain.
Declaration of Interests
The Whitehead Institute filed a patent application based in part on this paper. R.A.Y. is a founder and shareholder of Syros Pharmaceuticals, Camp4 Therapeutics, and Omega Therapeutics. I.A.K. is a consultant to InfiniteMD, Best Doctors, and Foundation Medicine, and is a shareholder of InfiniteMD. B.J.A. and T.I.L. are shareholders of Syros Pharmaceuticals. T.I.L. is a consultant to Camp4 Therapeutics.
REFERENCES
- Alberti S (2017). The wisdom of crowds: regulating cell function through condensed states of living matter. J. Cell Sci. 130, 2789–2796. [DOI] [PubMed] [Google Scholar]
- Allen BL, and Taatjes DJ (2015). The Mediator complex: a central integrator of transcription. Nat. Rev. Mol. Cell Biol. 16, 155–166. [DOI] [PMC free article] [PubMed] [Google Scholar]
- Andersson MK, Stahlberg A, Arvidsson Y, Olofsson A, Semb H, Stenman G, Nilsson O, and Aman P (2008). The multifunctional FUS, EWS and TAF15 protooncoproteins show cell type-specific expression patterns and involvement in cell spreading and stress response. BMC Cell Biol 9, 37. [DOI] [PMC free article] [PubMed] [Google Scholar]
- Apostolou E, Ferrari F, Walsh RM, Bar-Nur O, Stadtfeld M, Cheloufi S, Stuart AT, Polo JM, Ohsumi TK, Borowsky ML, et al. (2013). Genome-wide chromatin interactions of the Nanog locus in pluripotency, differentiation, and reprogramming. Cell Stem Cell 12, 699–712. [DOI] [PMC free article] [PubMed] [Google Scholar]
- Arany Z, Newsome D, Oldread E, Livingston DM, and Eckner R (1995). A family of transcriptional adaptor proteins targeted by the E1A oncoprotein. Nature 374, 81–84. [DOI] [PubMed] [Google Scholar]
- Avantaggiati ML, Carbone M, Graessmann A, Nakatani Y, Howard B, and Levine AS (1996). The SV40 large T antigen and adenovirus E1a oncoproteins interact with distinct isoforms of the transcriptional co-activator, p300. EMBO J. 15, 2236–2248. [PMC free article] [PubMed] [Google Scholar]
- Babu MM (2016). The contribution of intrinsically disordered regions to protein function, cellular complexity, and human disease. Biochem. Soc. Trans. 44, 1185–1200. [DOI] [PMC free article] [PubMed] [Google Scholar]
- Banani SF, Lee HO, Hyman AA, and Rosen MK (2017). Biomolecular condensates: organizers of cellular biochemistry. Nat. Rev. Mol. Cell Biol. 18, 285–298. [DOI] [PMC free article] [PubMed] [Google Scholar]
- Boulay G, Sandoval GJ, Riggi N, Iyer S, Buisson R, Naigles B, Awad ME, Rengarajan S, Volorio A, McBride MJ, et al. (2017). Cancer-Specific Retargeting of BAF Complexes by a Prion-like Domain. Cell 171, 163–178.e19. [DOI] [PMC free article] [PubMed] [Google Scholar]
- Bradner JE, Hnisz D, and Young RA (2017). Transcriptional Addiction in Cancer. [DOI] [PMC free article] [PubMed] [Google Scholar]
- Brehm A, Ohbo K, and Scholer H (1997). The carboxy-terminal transactivation domain of Oct-4 acquires cell specificity through the POU domain. Mol. Cell. Biol. 17, 154–162. [DOI] [PMC free article] [PubMed] [Google Scholar]
- Brent R, and Ptashne M (1985). A eukaryotic transcriptional activator bearing the DNA specificity of a prokaryotic repressor. Cell 43, 729–736. [DOI] [PubMed] [Google Scholar]
- Brzovic PS, Heikaus CC, Kisselev L, Vernon R, Herbig E, Pacheco D, Warfield L, Littlefield P, Baker D, Klevit RE, et al. (2011). The acidic transcription activator Gcn4 binds the mediator subunit Gal11/Med15 using a simple protein interface forming a fuzzy complex. Mol. Cell 44, 942–953. [DOI] [PMC free article] [PubMed] [Google Scholar]
- Burke KA, Janke AM, Rhine CL, and Fawzi NL (2015). Residue-by-Residue View of In Vitro FUS Granules that Bind the C-Terminal Domain of RNA Polymerase II. Mol. Cell 60, 231–241. [DOI] [PMC free article] [PubMed] [Google Scholar]
- Chong S, Dugast-darzacq C, Liu Z, Dong P, and Dailey GM (2017). Dynamic and Selective Low - Complexity Domain Interactions Revealed by Live - Cell Single - Molecule Imaging. Bioarxiv. [Google Scholar]
- Crozat A, Aman P, Mandahl N, and Ron D (1993). Fusion of CHOP to a novel RNA-binding protein in human myxoid liposarcoma. Nature 363, 640–644. [DOI] [PubMed] [Google Scholar]
- Dai YS, and Markham BE (2001). p300 Functions as a coactivator of transcription factor GATA-4. J. Biol. Chem. 276, 37178–37185. [DOI] [PubMed] [Google Scholar]
- Darling AL, Liu Y, Oldfield CJ, and Uversky VN (2018). Intrinsically Disordered Proteome of Human Membrane-Less Organelles. Proteomics 18, 1700193. [DOI] [PubMed] [Google Scholar]
- Das RK, Ruff KM, and Pappu RV (2015). Relating sequence encoded information to form and function of intrinsically disordered proteins. Curr. Opin. Struct. Biol 32, 102–112. [DOI] [PMC free article] [PubMed] [Google Scholar]
- Drysdale CM, Duenas E, Jackson BM, Reusser U, Braus GH, and Hinnebusch AG (1995). The transcriptional activator GCN4 contains multiple activation domains that are critically dependent on hydrophobic amino acids. Mol. Cell. Biol. 15, 1220–1233. [DOI] [PMC free article] [PubMed] [Google Scholar]
- Dunker AK, Bondos SE, Huang F, and Oldfield CJ (2015). Intrinsically disordered proteins and multicellular organisms. Semin. Cell Dev. Biol. 37, 44–55. [DOI] [PubMed] [Google Scholar]
- Eckner R, Yao TP, Oldread E, and Livingston DM (1996). Interaction and functional collaboration of p300/CBP and bHLH proteins in muscle and B-cell differentiation. Genes Dev. 10, 2478–2490. [DOI] [PubMed] [Google Scholar]
- Frietze S, and Farnham PJ (2011). Transcription factor effector domains. Subcell. Biochem. 52, 261–277. [DOI] [PMC free article] [PubMed] [Google Scholar]
- Fulton DL, Sundararajan S, Badis G, Hughes TR, Wasserman WW, Roach JC, and Sladek R (2009). TFCat: the curated catalog of mouse and human transcription factors. Genome Biol. 10, R29. [DOI] [PMC free article] [PubMed] [Google Scholar]
- Gelman L, Zhou G, Fajas L, Raspe E, Fruchart JC, and Auwerx J (1999). p300 interacts with the N- and C-terminal part of PPARgamma2 in a ligand-independent and - dependent manner, respectively. J. Biol. Chem. 274, 7681–7688. [DOI] [PubMed] [Google Scholar]
- Godowski PJ, Picard D, and Yamamoto KR (1988). Signal transduction and transcriptional regulation by glucocorticoid receptor-LexA fusion proteins. Science 241, 812–816. [DOI] [PubMed] [Google Scholar]
- Green MR (2005). Eukaryotic Transcription Activation: Right on Target. Mol. Cell 18, 399–402. [DOI] [PubMed] [Google Scholar]
- Habchi J, Tompa P, Longhi S, and Uversky VN (2014). Introducing Protein Intrinsic Disorder. Chem. Rev 114, 6561–6588. [DOI] [PubMed] [Google Scholar]
- Herbig E, Warfield L, Fish L, Fishburn J, Knutson BA, Moorefield B, Pacheco A, and Hahn S (2010). Mechanism of Mediator Recruitment by Tandem Gcn4 Activation Domains and Three Gal11 Activator-Binding Domains. Mol. Cell. Biol. 30, 2376–2390. [DOI] [PMC free article] [PubMed] [Google Scholar]
- Hnisz D, Shrinivas K, Young RA, Chakraborty AK, and Sharp PA (2017). Perspective A Phase Separation Model for Transcriptional Control. Cell 169, 13–23. [DOI] [PMC free article] [PubMed] [Google Scholar]
- Holehouse AS, Das RK, Ahad JN, Richardson MOG, and Pappu RV (2017). CIDER: Resources to Analyze Sequence-Ensemble Relationships of Intrinsically Disordered Proteins. Biophys. J. 112, 16–21. [DOI] [PMC free article] [PubMed] [Google Scholar]
- Hope IA, and Struhl K (1986). Functional dissection of a eukaryotic transcriptional activator protein, GCN4 of yeast. Cell 46, 885–894. [DOI] [PubMed] [Google Scholar]
- Hume MA, Barrera LA, Gisselbrecht SS, and Bulyk ML (2015). UniPROBE, update 2015: new tools and content for the online database of protein-binding microarray data on protein-DNA interactions. Nucleic Acids Res. 43, D117–D122. [DOI] [PMC free article] [PubMed] [Google Scholar]
- Hyman AA, Weber CA, and JQlicher F (2014). Liquid-Liquid Phase Separation in Biology. Annu. Rev. Cell Dev. Biol. 30, 39–58. [DOI] [PubMed] [Google Scholar]
- Janicki SM, Tsukamoto T, Salghetti SE, Tansey WP, Sachidanandam R, Prasanth KV, Ried T, Shav-Tal Y, Bertrand E, Singer RH, et al. (2004). From silencing to gene expression: real-time analysis in single cells. Cell 116, 683–698. [DOI] [PMC free article] [PubMed] [Google Scholar]
- Jedidi I, Zhang F, Qiu H, Stahl SJ, Palmer I, Kaufman JD, Nadaud PS, Mukherjee S, Wingfield PT, Jaroniec CP, et al. (2010). Activator Gcn4 employs multiple segments of Med15/Gal11, including the KIX domain, to recruit mediator to target genes in vivo. J. Biol. Chem. 285, 2438–2455. [DOI] [PMC free article] [PubMed] [Google Scholar]
- Jin W, Wang L, Zhu F, Tan W, Lin W, Chen D, Sun Q, and Xia Z (2016). Critical POU domain residues confer Oct4 uniqueness in somatic cell reprogramming. Sci. Rep. 6, 20818. [DOI] [PMC free article] [PubMed] [Google Scholar]
- Jolma A, Yan J, Whitington T, Toivonen J, Nitta KR, Rastas P, Morgunova E, Enge M, Taipale M, Wei G, et al. (2013). DNA-Binding Specificities of Human Transcription Factors. Cell 152, 327–339. [DOI] [PubMed] [Google Scholar]
- Juven-Gershon T, and Kadonaga JT (2010). Regulation of gene expression via the core promoter and the basal transcriptional machinery. Dev. Biol. 339, 225–229. [DOI] [PMC free article] [PubMed] [Google Scholar]
- Keegan L, Gill G, and Ptashne M (1986). Separation of DNA binding from the transcription-activating function of a eukaryotic regulatory protein. Science 231, 699–704. [DOI] [PubMed] [Google Scholar]
- Khan A, Fornes O, Stigliani A, Gheorghe M, Castro-Mondragon JA, van der Lee R, Bessy A, Cheneby J, Kulkarni SR, Tan G, et al. (2018). JASPAR 2018: update of the open-access database of transcription factor binding profiles and its web framework. Nucleic Acids Res. 46, D260–D266. [DOI] [PMC free article] [PubMed] [Google Scholar]
- Kim P, Ballester LY, and Zhao Z (2017). Domain retention in transcription factor fusion genes and its biological and clinical implications: a pan-cancer study. Oncotarget 8, 110103–110117. [DOI] [PMC free article] [PubMed] [Google Scholar]
- Latysheva NS, Oates ME, Maddox L, Buljan M, Weatheritt RJ, Madan Babu M, Flock T, and Gough J (2016). Molecular Principles of Gene Fusion Mediated Rewiring of Protein Interaction Networks in Cancer. Mol. Cell 63, 579–592. [DOI] [PMC free article] [PubMed] [Google Scholar]
- Lech K, Anderson K, and Brent R (1988). DNA-bound Fos proteins activate transcription in yeast. Cell 52, 179–184. [DOI] [PubMed] [Google Scholar]
- van der Lee R, Buljan M, Lang B, Weatheritt RJ, Daughdrill GW, Dunker AK, Fuxreiter M, Gough J, Gsponer J, Jones DT, et al. (2014). Classification of intrinsically disordered regions and proteins. Chem. Rev. 114, 6589–6631. [DOI] [PMC free article] [PubMed] [Google Scholar]
- Lin Y, Protter DSW, Rosen MK, and Parker R (2015). Formation and Maturation of Phase-Separated Liquid Droplets by RNA-Binding Proteins. Mol. Cell 60, 208–219. [DOI] [PMC free article] [PubMed] [Google Scholar]
- Liu J, Perumal NB, Oldfield CJ, Su EW, Uversky VN, and Dunker AK (2006). Intrinsic Disorder in Transcription Factors f. Biochemistry 45, 6873–6888. [DOI] [PMC free article] [PubMed] [Google Scholar]
- Liu W-L, Coleman RA, Ma E, Grob P, Yang JL, Zhang Y, Dailey G, Nogales B, and Tjian R (2009). Structures of three distinct activator-TFIID complexes. Genes Dev. 23, 1510–1521. [DOI] [PMC free article] [PubMed] [Google Scholar]
- Malik S, and Roeder RG (2010). The metazoan Mediator co-activator complex as an integrative hub for transcriptional regulation. Nat. Rev. Genet. 11, 761–772. [DOI] [PMC free article] [PubMed] [Google Scholar]
- Manavathi B, Samanthapudi VSK, and Gajulapalli VNR (2014). Estrogen receptor coregulators and pioneer factors: the orchestrators of mammary gland cell fate and development. Front. Cell Dev. Biol. 2, 34. [DOI] [PMC free article] [PubMed] [Google Scholar]
- Merika M, Williams AJ, Chen G, Collins T, and Thanos D (1998). Recruitment of CBP/p300 by the IFN beta enhanceosome is required for synergistic activation of transcription. Mol. Cell 1, 277–287. [DOI] [PubMed] [Google Scholar]
- Meyer KD, Donner AJ, Knuesel MT, York AG, Espinosa JM, and Taatjes, and D.J. (2008). Cooperative activity of cdk8 and GCN5L within Mediator directs tandem phosphoacetylation of histone H3. EMBO J. 27, 1447–1457. [DOI] [PMC free article] [PubMed] [Google Scholar]
- Mitchell PJ, and Tjian R (1989). Transcriptional regulation in mammalian cells by sequence-specific DNA binding proteins. Science 245, 371–378. [DOI] [PubMed] [Google Scholar]
- Nabet B, Roberts JM, Buckley DL, Paulk J, Dastjerdi S, Yang A, Leggett AL, Erb MA, Lawlor MA, Souza A, et al. (2018). The dTAG system for immediate and target-specific protein degradation. Nat. Chem. Biol. 14, 431–441. [DOI] [PMC free article] [PubMed] [Google Scholar]
- Nott TJ, Petsalaki E, Farber P, Jervis D, Fussner E, Plochowietz A, Craggs TD, Bazett-Jones DP, Pawson T, Forman-Kay JD, et al. (2015). Phase Transition of a Disordered Nuage Protein Generates Environmentally Responsive Membraneless Organelles. Mol. Cell 57, 936–947. [DOI] [PMC free article] [PubMed] [Google Scholar]
- Oates ME, Romero P, Ishida T, Ghalwash M, Mizianty MJ, Xue B, Dosztanyi Z, Uversky VN, Obradovic Z, Kurgan L, et al. (2013). D2P2: database of disordered protein predictions. Nucleic Acids Res. 41, D508–16. [DOI] [PMC free article] [PubMed] [Google Scholar]
- Oldfield CJ, and Dunker AK (2014). Intrinsically Disordered Proteins and Intrinsically Disordered Protein Regions. Annu. Rev. Biochem. 83, 553–584. [DOI] [PubMed] [Google Scholar]
- Oliner JD, Andresen JM, Hansen SK, Zhou S, and Tjian R (1996). SREBP transcriptional activity is mediated through an interaction with the CREB-binding protein. Genes Dev. 10, 2903–2911. [DOI] [PubMed] [Google Scholar]
- Oliviero S, Robinson GS, Struhl K, and Spiegelman BM Yeast GCN4 as a probe for oncogenesis by AP-1. transcription factors: transcnpuonal activation through AP-1 sites is not sufficient for cellular transformation. [DOI] [PubMed] [Google Scholar]
- Panne D, Maniatis T, and Harrison SC (2007). An Atomic Model of the Interferon-β Enhanceosome. Cell 129, 1111–1123. [DOI] [PMC free article] [PubMed] [Google Scholar]
- Patel A, Lee HO, Jawerth L, Maharana S, Jahnel M, Hein MY, Stoynov S, Mahamid J, Saha S, Franzmann TM, et al. (2015). A Liquid-to-Solid Phase Transition of the ALS Protein FUS Accelerated by Disease Mutation. Cell 162, 1066–1077. [DOI] [PubMed] [Google Scholar]
- Plaschka C, Nozawa K, and Cramer P (2016). Mediator Architecture and RNA Polymerase II Interaction. J. Mol. Biol. 428, 2569–2574. [DOI] [PubMed] [Google Scholar]
- Ransone LJ, Wamsley P, Morley KL, and Verma IM (1990). Domain swapping reveals the modular nature of Fos, Jun, and CREB proteins. Mol. Cell. Biol 10, 4565–4573. [DOI] [PMC free article] [PubMed] [Google Scholar]
- Reiter F, Wienerroither S, and Stark A (2017). Combinatorial function of transcription factors and cofactors. Curr. Opin. Genet. Dev. 43, 73–81. [DOI] [PubMed] [Google Scholar]
- Roberts SG (2000). Mechanisms of action of transcription activation and repression domains. Cell. Mol. Life Sci. 57, 1149–1160. [DOI] [PMC free article] [PubMed] [Google Scholar]
- Sabari B, Dall’Agnese A, Boija A, Klein IA, Coffey EL, Shrinivas K, Abraham BJ, Hannett NM, Zamudio AV, Manteiga J, et al. (2018). Coactivator condensation at super-enhancers links phase separation and gene control. Science (80. ). [DOI] [PMC free article] [PubMed] [Google Scholar]
- Sadowski I, Ma J, Triezenberg S, and Ptashne M (1988). GAL4-VP16 is an unusually potent transcriptional activator. Nature 335, 563–564. [DOI] [PubMed] [Google Scholar]
- Saint-andre V, Federation AJ, Lin CY, Abraham BJ, Reddy J, Lee TI, Bradner JE, and Young RA Models of human core transcriptional regulatory circuitries. 385–396. [DOI] [PMC free article] [PubMed] [Google Scholar]
- Shin Y, and Brangwynne CP (2017). Liquid phase condensation in cell physiology and disease. Science (80-.). 357, eaaf4382. [DOI] [PubMed] [Google Scholar]
- Sigler PB (1988). Acid blobs and negative noodles. Nature 333, 210–212. [DOI] [PubMed] [Google Scholar]
- Soutourina J (2017). Transcription regulation by the Mediator complex. Nat. Rev. Mol. Cell Biol. 19, 262–274. [DOI] [PubMed] [Google Scholar]
- Staby L, O’Shea C, Willemoes M, Theisen F, Kragelund BB, and Skriver K (2017a). Eukaryotic transcription factors: paradigms of protein intrinsic disorder. Biochem. J. 474, 2509–2532. [DOI] [PubMed] [Google Scholar]
- Staby L, O’Shea C, Willemoes M, Theisen F, Kragelund BB, and Skriver K (2017b). Eukaryotic transcription factors: paradigms of protein intrinsic disorder. Biochem. J. 474, 2509–2532. [DOI] [PubMed] [Google Scholar]
- Staller MV, Holehouse AS, Swain-Lenz D, Das RK, Pappu RV, and Cohen BA (2018). A High-Throughput Mutational Scan of an Intrinsically Disordered Acidic Transcriptional Activation Domain. Cell Syst. 6, 444–455.e6. [DOI] [PMC free article] [PubMed] [Google Scholar]
- Struhl K (1988). The JUN oncoprotein, a vertebrate transcription factor, activates transcription in yeast. Nature 332, 649–650. [DOI] [PubMed] [Google Scholar]
- Taatjes DJ (2010). The human Mediator complex: a versatile, genome-wide regulator of transcription. Trends Biochem. Sci. 35, 315–322. [DOI] [PMC free article] [PubMed] [Google Scholar]
- Taatjes DJ (2017). Transcription Factor-Mediator Interfaces: Multiple and Multi-Valent. J. Mol. Biol. 429, 2996–2998. [DOI] [PubMed] [Google Scholar]
- Tompa P, and Fuxreiter M (2008). Fuzzy complexes: polymorphism and structural disorder in protein-protein interactions. Trends Biochem. Sci. 33, 2–8. [DOI] [PubMed] [Google Scholar]
- Tora L, White J, Brou C, Tasset D, Webster N, Scheer E, and Chambon P (1989). The human estrogen receptor has two independent nonacidic transcriptional activation functions. Cell 59, 477–487. [DOI] [PubMed] [Google Scholar]
- Triezenberg SJ (1995). Structure and function of transcriptional activation domains. Curr. Opin. Genet. Dev. 5, 190–196. [DOI] [PubMed] [Google Scholar]
- Tuttle LM, Pacheco D, Warfield L, Luo J, Ranish J, Hahn S, and Klevit RE (2018). Gcn4-Mediator Specificity Is Mediated by a Large and Dynamic Fuzzy Protein-Protein Complex. Cell Rep. 22, 3251–3264. [DOI] [PMC free article] [PubMed] [Google Scholar]
- Uversky VN (2017). Intrinsically disordered proteins in overcrowded milieu: Membrane-less organelles, phase separation, and intrinsic disorder. Curr. Opin. Struct. Biol. 44, 18–30. [DOI] [PubMed] [Google Scholar]
- Vaquerizas JM, Kummerfeld SK, Teichmann SA, and Luscombe NM (2009). A census of human transcription factors: function, expression and evolution. Nat. Rev. Genet. 10, 252–263. [DOI] [PubMed] [Google Scholar]
- Warfield L, Tuttle LM, Pacheco D, Klevit RE, and Hahn S (2014). A sequence-specific transcription activator motif and powerful synthetic variants that bind Mediator using a fuzzy protein interface. Proc. Natl. Acad. Sci. 111, E3506–E3513. [DOI] [PMC free article] [PubMed] [Google Scholar]
- Weintraub AS, Li CH, Zamudio AV, Sigova AA, Hannett NM, Day DS, Abraham BJ, Cohen MA, Nabet B, Buckley DL, et al. (2017). YY1 Is a Structural Regulator of Enhancer-Promoter Loops. Cell 171, 1573–1588.e28. [DOI] [PMC free article] [PubMed] [Google Scholar]
- Wheeler RJ, and Hyman AA (2018). Controlling compartmentalization by nonmembrane-bound organelles. Philos. Trans. R. Soc. Lond. B. Biol. Sci 373. [DOI] [PMC free article] [PubMed] [Google Scholar]
- Whyte WA, Orlando DA, Hnisz D, Abraham BJ, Lin CY, Kagey MH, Rahl PB, Lee TI, and Young RA (2013). Master transcription factors and mediator establish super-enhancers at key cell identity genes. Cell 153, 307–319. [DOI] [PMC free article] [PubMed] [Google Scholar]
- Winters AC, and Bernt KM (2017). MLL-Rearranged Leukemias-An Update on Science and Clinical Approaches. Front. Pediatr 5, 4. [DOI] [PMC free article] [PubMed] [Google Scholar]
- Wright PE, and Dyson HJ (2015). Intrinsically disordered proteins in cellular signalling and regulation. Nat. Rev. Mol. Cell Biol. 16, 18–29. [DOI] [PMC free article] [PubMed] [Google Scholar]
- Yin J, and Wang G (2014). The Mediator complex: a master coordinator of transcription and cell lineage development. Development 141, 977–987. [DOI] [PubMed] [Google Scholar]
- Yuan W, Condorelli G, Caruso M, Felsani A, and Giordano A (1996). Human p300 protein is a coactivator for the transcription factor MyoD. J. Biol. Chem. 271, 9009–9013. [DOI] [PubMed] [Google Scholar]
Associated Data
This section collects any data citations, data availability statements, or supplementary materials included in this article.
Supplementary Materials
Related to Figure 1. Random focus analysis. Average fluorescence centered at the indicated RNA FISH focus (top panels) versus a randomly distributed IF foci +/− 1.5 microns in X and Y (bottom panels). Color scale bars present arbitrary units of fluorescence intensity.
Related to Figure 2. OCT4 degradation and ES cell differentiation. A. Schematic of the Oct4-FKBP cell-engineering strategy. V6.5 mouse ES cells were transfected with a repair vector and Cas9 expressing plasmid to generate knock-in loci with either BFP or RFP for selection (Left). WT or untreated OCT4-dTAG ES cells blotted for OCT4 showing expected shift in size, HA (on FKBP), and ACTIN (Right). B. Western blot against OCT4 (left panels), MED1 (right panels), and BETA-ACTIN in the OCT4 degron line (dTAG), either treated with dTag47 or vehicle (DMSO). C. Mean intensity of the MED1 immunofluorescence signal within the Nanog DNA FISH focus in DMSO treated, vs dTAG treated OCT4-degron cells. N=5 images, error bars are distribution between the 10th and 90th percentile. D. Schematic showing the position of primers used for OCT4 (P1) and MED1 (P2) ChIP-qPCR in differentiated and ES cells at the MiR290 locus. E. Western blot against MED1 and BETA-ACTIN in ES cells or cells differentiated by LIF withdrawal. F. Mean intensity of MED1 immunofluorescence signal within MiR290 DNA FISH focus in ES cells versus cells differentiated by LIF withdrawal. N=5 images, error bars are distribution between the 10th and 90th percentile.
Related to Figure 3. MED1 and OCT4 droplet formation. A. Enrichment ratio of OCT4-GFP versus GFP in MED1-IDR-mCherry droplets formed in droplet formation buffer with 10% PEG-8000 at 125mM NaCl. N>20, error bars represent the distribution between the 10th and 90th percentile. B. Area in micrometers-squared of MED1-IDR-OCT4 droplets formed in 10% PEG-8000 at 125mM salt with 10uM of each protein. C. Aspect ratio of MED1-IDR-OCT4 droplets formed in 10% PEG-8000 at 125mM with 10uM of each protein. N>20, error bars represent the distribution between the 10th and 90th percentile. D. Area in micrometers-squared of MED1-IDR-OCT4 droplets formed in 10% PEG-8000 at 125mM, 225uM, or 300uM salt, with 10uM of each protein. E. Fluorescence microscopy of droplet formation without crowding agents at 50mM NaCl for the indicated protein or combination of proteins (at 10uM each), imaged in the channel indicated at the top of the panel. F. Enrichment ratio of OCT4-GFP versus GFP in MED1-IDR-mCherry droplets formed in droplet formation buffer without crowding agent at 50mM NaCl. N>20, error bars represent the distribution between the 10th and 90th percentile.
Related to Figure 4. Phase separation of mutant OCT4. A. Fluorescent microscopy of the indicated TMR-labeled polypeptide, at the indicated concentration in droplet formation buffers with 10% PEG-8000 and 125mM NaCl. B. Enrichment ratios of the indicated polypeptide within MED1-IDR-mCherry droplets. N>20, error bars represent the distribution between the 10th and 90th percentile. C. Enrichment ratios of the indicated protein within MED1-IDR-mCherry droplets. N>20, error bars represent the distribution between the 10th and 90th percentile. D. (Upper panel) Schematic of OCT4 protein, aromatic residues in the activation domains (ADs) are marked by blue horizontal lines. All 9 aromatic residues in the N-terminal Activation Domain (N-AD) and 10 aromatic residues in the C-terminal Activation Domain (C-AD) were mutated to alanine to generate an OCT4-aromatic mutant. (Lower panel) Representative confocal images of droplet formation showing that the OCT4 aromatic mutant is still incorporated into MED1-IDR droplets. MED1-IDR-mCherry and OCT4-GFP or MED1-IDR-mCherry and OCT4-aromatic mutant-GFP were added to droplet formation buffers with 125mM NaCl at 10uM each with 10% PEG-8000 and visualized on a fluorescent microscope with the indicated filters. E. Droplets of intact Mediator complex were collected by pelleting and equal volumes of input, supernatant, and pellet were run on an SDS-PAGE gel and stained with sypro ruby. Mediator subunits present in the pellet are annotated on the rightmost column.
Related to Figure 5. Diverse TFs phase separate with Mediator. A. Enrichment ratios of the indicated GFP-fused TF in MED1-IDR-mCherry droplets. N>20, error bars represent the distribution between the 10th and 90th percentile. B. FRAP of heterotypic p53-GFP/MED1-IDR-mCherry droplets formed in droplet formation buffers with 10% PEG-8000 and 125mM NaCL, imaged every second over 30 seconds.
Related to Figure 6. Estrogen receptor phase separates with MED1. A. Enrichment ratio of ER-GFP in MED1-IDR-mCherry droplets in the presence or absence of 10uM estrogen. Droplets were formed in 10% PEG-8000 with 125mM NaCl. N>20, error bars represent the distribution between the 10th and 90th percentile.
Related to Figure 7. GCN4 and MED15 form phase separated droplets. A. Enrichment ratio of mCherry or MED15-mCherry in GCN4-GFP droplets, in droplet formation buffer with 10% PEG-8000 and 125mM NaCl. N>20, error bars represent the distribution between the 10th and 90th percentile. B. FRAP of heterotypic GCN4-GFP/MED15-IDR-mCherry droplets formed in droplet formation buffers with 10% PEG-8000 and 125mM NaCl, imaged every second over 30 seconds. C. Phase diagram of GCN4-GFP and MED15-mCherry added at the indicated concentrations to droplet formation buffers with 10% PEG-8000 and 125mM salt. D. Enrichment ratio of GCN4 droplets from S7C. N>20, error bars represent the distribution between the 10th and 90th percentile. E. Fluorescent imaging of GCN4-GFP or the aromatic mutant of GCN4-GFP at the indicated concentration in 10% PEG-8000 and 125mM NaCl. Shown are images from GFP channel. F. Enrichment ratio of GCN4-GFP or the aromatic mutant of GCN4-GFP in MED15-mCherry droplets, formed in droplet formation buffer with 10% PEG-8000 and 125mM salt. N>20, error bars represent the distribution between the 10th and 90th percentile. G. Enrichment ratio of GFP, GCN4-GFP or GCN4-aromatic mutant-GFP in Mediator complex droplets. N>20, error bars represent the distribution between the 10th and 90th percentiles.
Related to Figure 1. Table of reported transcription factor-mediator subunit interactions.