Abstract
The function and cell surface phenotype of lung macrophages vary within the respiratory tract. Alterations in the bioenergetic profile of macrophages may also be influenced by their location within the respiratory tract. This study sought to characterize the bioenergetic profile of macrophages sampled from different locations within the respiratory tract at baseline and in response to ex vivo xenobiotic challenge. Surface macrophages recovered from healthy volunteers by induced sputum and by bronchial and bronchoalveolar lavage were profiled using extracellular flux analyses. Oxygen consumption and extracellular acidification rates were measured at rest and after stimulation with lipopolysaccharide (LPS), phorbol 12-myristate 13-acetate (PMA), or 1,2-naphthoquinone (1,2-NQ). Oxygen consumption and extracellular acidification rates were highly correlated for all macrophage samples. Induced sputum macrophages had relatively higher oxygen consumption and extracellular acidification rates and were largely reliant on glycolysis. In contrast, bronchial fraction and bronchoalveolar macrophages depended more heavily on mitochondrial respiration. Bronchoalveolar macrophages showed elevated LPS-induced cytokine responses. Unlike their autologous peripheral blood monocytes, lung macrophages from any source did not display bioenergetic changes following LPS stimulation. The protein kinase C activator PMA did not affect mitochondrial respiration, whereas the air pollutant 1,2-NQ induced marked mitochondrial dysfunction in bronchoalveolar and bronchial fraction macrophages. The bioenergetic characteristics of macrophages from healthy individuals are dependent on their location within the respiratory tract. These findings establish a regional bioenergetic profile for macrophages from healthy human airways that serves as a reference for changes that occur in disease.
Keywords: airway, bioenergetics, inflammation, macrophages, metabolism
INTRODUCTION
Lung macrophages (MAC) are found throughout the respiratory tract surfaces and are a key part of the innate immune defense to inhaled biological and xenobiotic agents. Altered MAC function is associated with numerous respiratory diseases, including chronic obstructive pulmonary disease, asthma, and cystic fibrosis (5, 14). Functionally, MAC clear pathogens and debris through phagocytic processing and produce a repertoire of cytokines, chemokines, reactive oxygen species, and proteases that are vital to their function in host defense (18).
The bioenergetic activity of immune cells has been reported to be a key determinant of their response to pathogenic challenges. Metabolic dysfunction of respiratory immune cells is thought to be involved in the initiation or progression of a number of inflammatory airway diseases in which mitochondrial respiration is dysfunctional (20, 32, 34).
Energy metabolism plays an important role in mediating MAC function and plasticity (33). Recently, metabolic reprogramming has been identified as a critical factor in committing innate immune cells toward a pro- or anti-inflammatory phenotype following exposure to an appropriate stimulus (22). For example, MAC that were differentiated from rodent bone marrow-derived monocytes (BMDM) or human peripheral blood monocytes (PBMC) and stimulated with lipopolysaccharide (LPS) and/or interferon-γ display an M1 proinflammatory phenotype that is more reliant on glycolysis than mitochondrial respiration for ATP production. This shift is caused by a reduction in Krebs cycle production of NADH, as the metabolic intermediates succinate and citrate are used for non-energy functions, such as membrane biogenesis and HIF1α activation, respectively. In contrast, alternatively activated M2 MAC have an anti-inflammatory phenotype and primarily use oxidative phosphorylation for ATP generation (10, 16, 27, 29). Much of the pioneering immunometabolism work on MAC has used rodent BMDM or human PBMC. Relatively little is known about the bioenergetic profiles of human lung MAC.
Previous work by our group demonstrated that MAC recovered from induced sputum (IS), a technique that samples the surfaces of large central airways (2), were phenotypically (CD11b+) and functionally (phagocytosis, intracellular oxidative burst) more active and proinflammatory than MAC recovered from distal alveolar airways using bronchoalveolar lavage (BAL) (1). As bioenergetics has been shown to influence immune function, these findings suggest that the bioenergetic profiles of these two cell populations may also differ from each other. Specifically, we hypothesized that MAC retrieved by IS are more glycolytic and less reliant on mitochondrial respiration for ATP production relative to those obtained by BAL, corresponding to the regions within the respiratory tract that these techniques sample.
In the present study, we used IS, the first aliquot of BAL [bronchial fraction (BF)], or BAL to recover MAC from the central airways, distal bronchial, and alveolar surfaces of the respiratory tract, respectively, of healthy volunteers. The recovered MAC were subjected ex vivo to extracellular flux analyses to characterize their bioenergetic profile at baseline and following xenobiotic challenge. We report that MAC obtained by IS are highly dependent on glycolysis for their energy needs, whereas BAL MAC primarily rely on mitochondrial respiration for energy production. Notably, despite mounting a robust inflammatory response, lung MAC stimulated with LPS did not produce a shift in metabolic profile as previously reported for murine BMDM (24, 27), revealing a potentially novel in vivo phenotype wherein the disposition of the MAC toward an inflammatory response appears uncoupled from its bioenergetic profile.
METHODS
Materials.
All chemicals were purchased from Sigma-Aldrich (St. Louis, MO) unless otherwise noted. XF Base Medium and XF FluxPaks were purchased from Agilent Technologies (Santa Clara, CA). l-glutamine (GIBCO), the Bicinchoninic Acid (BCA) Protein Assay Kit, RPMI Medium 1640 (GIBCO, with l-glutamine and phenol red), fetal bovine serum (GIBCO), penicillin-streptomycin (Pen-Strep, GIBCO), and gentamicin (GIBCO) were purchased from Thermo Fisher Scientific (Waltham, MA). Basic laboratory supplies were purchased from Fisher Scientific (Raleigh, NC).
Study participants.
The study protocol was approved by the Institutional Review Board at the University of North Carolina Medical School in Chapel Hill and the US Environmental Protection Agency. Informed consent was obtained from all subjects before their participation in the study. All subjects underwent a physical examination before participation. For IS, 12 healthy, nonsmoking volunteers participated in this study, ranging from age 23 to 60 yr. Three subjects provided multiple IS samples, with procedures separated by over 6 wk, giving a total of 16 independent cell collections. Separately, 25 nonsmoking healthy volunteers between 20 and 37 yr of age were recruited for bronchoscopy. Of those that underwent bronchoscopy, the BF was used from 17 subjects, based on cell yield. Subject characteristics are shown in Table 1.
Table 1.
Characteristics of healthy subjects who underwent bronchoscopy (BAL or BF) or induced sputum
| Donor Characteristics | |||
|---|---|---|---|
| BAL | BF | IS | |
| Age, yr | 27 (20–37) | 27 (20–37) | 29 (20–60) |
| BMI, kg/m2 | 28.3 (19.7–36.9) | 27.2 (19.7–33.5) | 29.6 (18.8–44.8) |
| Sex | |||
| Women | 10 | 7 | 5 |
| Men | 15 | 8 | 7 |
| Race | |||
| Black | 12 | 7 | 3 |
| White | 11 | 9 | 9 |
| Hispanic | 1 | 0 | 0 |
| Bi-Racial | 1 | 1 | 0 |
Data are means (range). BAL, bronchoalveolar lavage; BF, bronchial fraction; BMI, body mass index; IS, induced sputum. Of note, BF donors represent a subset of bronchoscopy subjects. Some IS donors provided multiple samples over the course of the study.
IS collection.
Sputum was collected as described previously (4). Briefly, subjects underwent three 7-min inhalation periods of nebulized hypertonic saline (3%, 4%, and 5%; UltraNeb 99 ultrasonic nebulizer, DeVilbiss, Jackson, TN), followed by expectoration of sputum into a sterile specimen cup. Cell-rich mucus plugs were selected and incubated in Dulbecco’s PBS containing 0.1% dithiothreitol (Sputolysin, Calbiochem, San Diego, CA). The sample was then washed in Dulbecco’s PBS, and the cells were gravity filtered through a 48-μm-pore mesh filter.
A separate study was performed comparing spontaneous (i.e., no hypertonic saline induction) sputum samples to those obtained by IS to assess the potential confounding effect of hypertonic saline on the MAC bioenergetic profile. No significant bioenergetic differences were observed between spontaneous sputum samples and those produced by IS from the same subjects (data not shown), demonstrating that exposure to hypertonic saline during IS did not confound MAC bioenergetics in this study.
Bronchoalveolar lavage.
BAL was performed by an ABIM-certified pulmonologist, as described previously (12). Briefly, a fiberoptic bronchoscope was wedged into a sub-segmental lingualar bronchus. One 20-ml aliquot and five 50-ml aliquots of sterile saline were sequentially instilled and immediately aspirated. Samples were put on ice immediately following aspiration and pelleted by centrifugation at 300 g for 10 min, 4°C. Cells from the first 20-ml aliquot were classified as the BF. Cells from the remaining five washes were pooled and classified as BAL. Cells were washed once in RPMI (+0.25% gentamicin).
For matched BAL and PBMC comparisons, whole blood was drawn from an antecubital site before bronchoscopy for three subjects. PBMCs were isolated using BD Vacutainer CPT Cell Preparation Tube with Sodium Citrate according to manufacturer’s instructions.
Cell differentials.
Cells were counted, and their viability was determined by trypan blue exclusion, as previously described (3). Results of cell differentials are shown in Table 2. Additional BF samples were collected in healthy individuals to provide representative inflammatory cell differentials, as the limited sample prevented differential analysis.
Table 2.
Differential cell count percentages
| Sample Type | PMN | MAC | Eos | Lym | Bec |
|---|---|---|---|---|---|
| IS, % | 29.6 (8.3–67.8) | 70.1 (30.9–91.7) | 0.3 (0.0–2.6) | 0.0 (0.0–0.0) | 0.1 (0.0–0.7) |
| BAL, % | 2.9 (0–8) | 96.8 (91.2–100) | 0.2 (0.0–1.0) | 0.1 (0.0–1.0) | 0.1 (0–0.9) |
| BF, %* | 12.3 (6.0–17.0) | 84.0 (80.0–88.0) | 0.0 (0.0–0.0) | 0.0 (0.0–0.0) | 3.67 (2–6) |
Data are means (range). IS, n = 16; BAL, n = 20. BAL, bronchoalveolar lavage; BF, bronchial fraction; Bec, bronchial epithelial cells; Eos, Eosinophils; IS, induced sputum; Lym, lymphocytes; MAC, macrophages.
For BF samples, differentials were conducted on separate samples (n = 3) than those run in experimental procedures because of limited sample size.
Bioenergetic analyses.
Cellular oxygen consumption rate (OCR) and extracellular acidification rate (ECAR) were measured using the Seahorse XFe24 Analyzer (Agilent Technologies) (11). With the exception of 24-h challenges, all samples were assayed on the day of collection.
XFe24 sensor cartridges were hydrated for at least 4 hr with XF Calibrant at 37°C. Cells were seeded at 60,000 cells/well in XF24 cell culture plates. For BF and BAL cells, media was changed from RPMI to assay media before cell seeding. Sputum cells were plated in isotonic saline and replaced with assay media immediately before assay. Cells were allowed to settle for ~40 min before assay in a non-CO2 incubator at 37°C. After attachment, assay media was either XF Glycolysis media (XF Base Media supplemented with only 2 mM glutamine) or XF Cell Mito Assay Media (XF Base Media with 10 mM glucose, 1 mM sodium pyruvate, and 2 mM glutamine). Both mediums were prepared fresh on the day of assay and adjusted to pH 7.4. For 24-h challenges, media was changed from RPMI to XF Cell Mito Assay Media 1 h before assay to allow proper degassing. Basal OCR and ECAR were recorded in the presence of 10 mM glucose, 2 mM glutamine, and sometimes 1 mM sodium pyruvate, though the presence of sodium pyruvate did not affect basal OCR or ECAR in our samples (data not shown). Sequential mix-wait-measurement times were set at 3 min-2 min-3 min.
Bioenergetic parameters were calculated using a modified Cell Mitochondrial (Mito) Stress Test (29). This assay tests nine different parameters of glycolytic and mitochondrial function using injection of specific bioenergetic modulators. Briefly, measurements were made after addition of glucose to stimulate glycolysis, followed by sequential addition of oligomycin to block ATP synthase (Complex V), carbonyl cyanide-p-trifluoromethoxyphenylhydrazone (FCCP) to stimulate maximal mitochondrial oxygen consumption, and rotenone/antimycin A to inhibit electron transport through Complexes I and III, measuring non-mitochondrial respiration processes.
Stock concentrations of oligomycin, FCCP, rotenone, and antimycin A were prepared in DMSO and stored at −20°C. Stock concentrations of glucose were prepared in XF Glycolysis media and stored at −20°C. Working solutions (10×) were diluted in cell media with final DMSO concentrations less than 0.1%. Ports A, B, C, and D were loaded with 56 μl, 62 μl, 69 μl, and 75 μl of 10× solutions, respectively. Injections were ordered as follows: A) 10 mM glucose; B) 1 μM oligomycin; C) 1 μM FCCP; and D) 0.5 μM rotenone and 0.5 μM antimycin A. For bioenergetics parameter calculations, all measurements were normalized as a percentage of the basal OCR and ECAR. Mitochondrial and glycolytic parameters were calculated as recommended by the instrument manufacturer (Agilent Technologies).
Challenges.
A stock of LPS (1 mg/ml) was made in PBS and stored at −80°C. Airway MAC were exposed to a final concentration of 50 or 100 ng/ml LPS for either 6 h, after which media was collected for cytokine analysis. For experiments with a 6-h exposure, the stimulus was the first injection after three baseline measurements were collected. Measurements were performed every 8 min thereafter for 4 h, before the introduction of oligomycin, FCCP, and rotenone/antimycin A per Cell Mito Stress Test. Media was collected for cytokine analysis.
1,2-Naphthoquinone (1,2-NQ; 10 μM) was used as an environmentally relevant model of a redox-cycling air pollutant (17). The protein kinase C activator, 100 ng/ml phorbol myristate acetate (PMA), was used as a model inducer of the oxidative burst at. 1,2-NQ was prepared fresh as a 100 mM stock solution in DMSO. PMA was made as a 0.4 mg/ml stock in DMSO and stored at −20°C. Both stimuli were diluted to 10× working solutions in Cell Mito Assay Media and loaded as the first port injection, immediately before the Cell Mito Stress Test.
Protein normalization.
Immediately after extracellular flux assay completion, the media was aspirated from each well, and the plate was stored at −80°C overnight. BCA protein assay reagent was prepared according to manufacturer’s instructions (Thermo Fisher Scientific). BSA protein standards (0, 250, 500, and 750 μg/ml) were pipetted directly into Seahorse “blank” wells. In-plate BCA assays were performed by lysing cells in radioimmunoprecipitation assay buffer (25 mM Tris-HCl, pH 7.6; 150 mM NaCl; 1% Nonidet P-40; 1% sodium deoxycholate; 0.1% SDS) and adding BCA working reagent directly to each well. After 30 min incubation at 37°C, absorbance was read at 562 nm using a CLARIOstar microplate reader (BMG Labtech, Ortenberg, Germany). For each group, protein values were averaged and basal OCR and ECAR values were normalized for protein mass.
Cytokine production measurements.
IL-6 and IL-1β in media were measured using commercially available ELISA kits (BD OptEIA, BD Biosciences, Franklin Lakes, NJ). Absorbance was measured using a CLARIOstar microplate reader (BMG Labtech).
Statistical analyses.
PRISM (GraphPad Software, La Jolla, CA) was used for statistical analyses. OCR and ECAR values represent the averages of at least three technical replicate wells per group. For comparison between sample types, nonparametric Kruskal-Wallis test and a subsequent Dunn’s multiple comparison test were used. Between BAL and BF samples, a paired nonparametric t-test (Wilcoxon) was used. P < 0.05 was considered statistically significant.
RESULTS
IS MAC can be highly energetic.
We examined the bioenergetic profiles of cells recovered by the BAL or IS sampling techniques. Table 2 shows that both samples contained a majority of MAC, as previously reported (3, 13). However, IS samples also contained on average 30% PMN (Table 2).
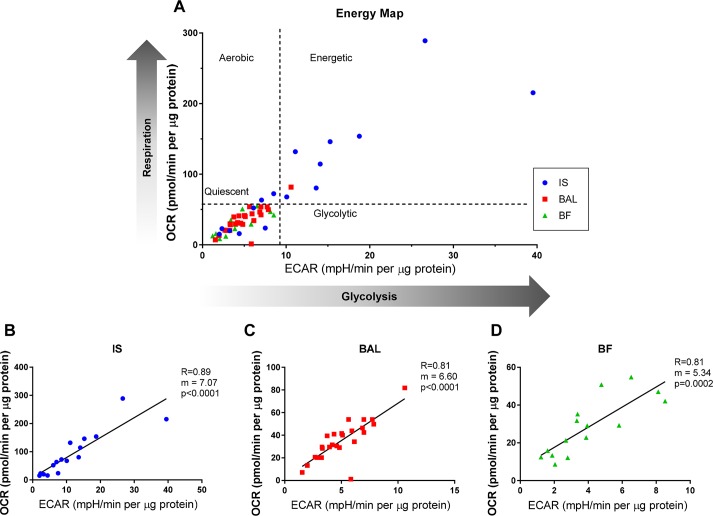
The basal OCR and the ECAR, indicators of mitochondrial respiration and glycolytic activity, respectively, were measured using extracellular flux analyses in the presence of glucose. Figure 1A shows the cell energy phenotype (OCR vs. ECAR) plotted for BAL, IS, and BF MAC. Quadrants depict the relative tendency toward different bioenergetic phenotypes. Relative to BAL and BF MAC, IS MAC were found to be more energetic, with the highest OCR and ECAR, although IS MAC also the showed the greatest variability among sample types. The ECAR and OCR values were highly correlated in each of the samples (Fig. 1, B–D).
Fig. 1.
Bioenergetic profiles of macrophages (MAC) sampled from different regions of the human lung. MAC obtained by induced sputum (IS), bronchial fraction (BF), or bronchoalveolar lavage (BAL) from normal volunteers undergoing extracellular flux analysis. Basal oxygen consumption rate (OCR) and extracellular acidification rate (ECAR) as measures of mitochondrial respiration and glycolysis activities, respectively, were assessed. Basal OCR and ECAR were measured in the presence of 10 mM glucose and 2 mM l-glutamine. A: a comparative representation of the range of bioenergetics profiles of MAC obtained by IS or BAL. B–D: plots of the OCR vs. ECAR for cell samples recovered by IS or BAL. Shown is goodness of fit, slope, and P for individual samples representing IS (n = 16), BF (n = 15), and BAL (n = 25).
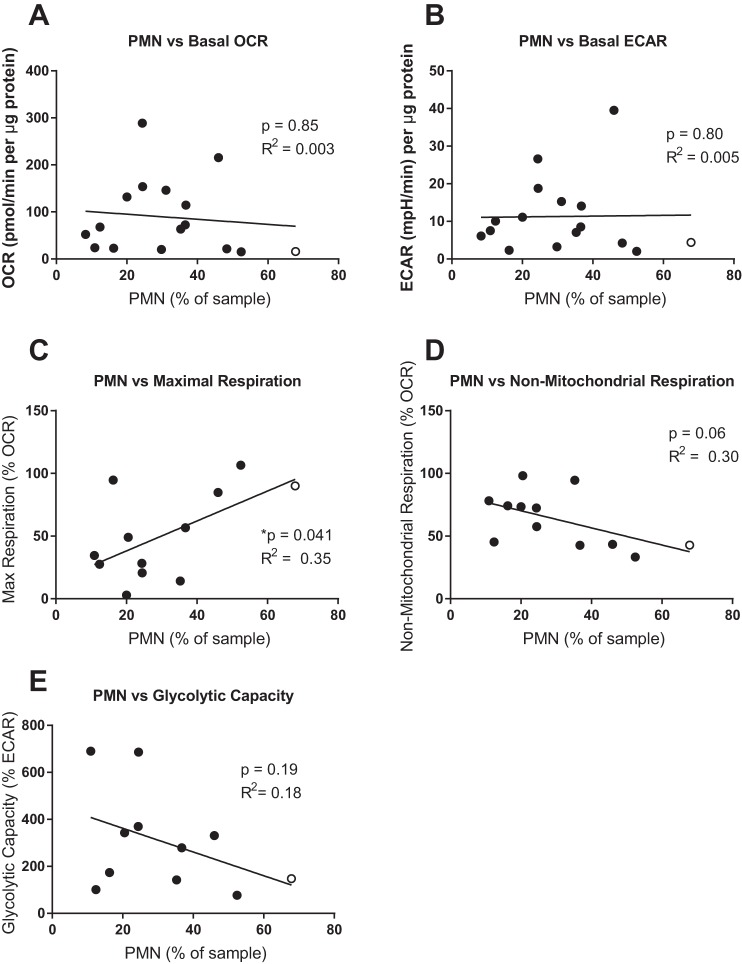
There was no correlation between PMN content and the baseline OCR or ECAR of IS samples (Fig. 2, A and B), consistent with previous reports that PMN exhibit a relatively quiescent bioenergetic phenotype (7, 8).
Fig. 2.
Neutrophil content does not significantly correlate with bioenergetic parameters. Percentage of neutrophils (PMN) in each sample was plotted against basal oxygen consumption rate (OCR; A), basal extracellular acidification rate (ECAR; B), maximal respiration (C), non-mitochondrial respiration (D), and glycolytic capacity (E). Linear regression was performed, and the resulting significance of a non-zero slope and correlation coefficient (R2) is shown. An outlier was identified as higher than two standard deviations from the mean (red marker). When the outlier was excluded from analysis, the parameters changed for each graph as follows: basal OCR, P = 0.88, R2 = 0.016 (A); basal ECAR, P = 0.58, R2 = 0.02 (B); maximal respiration, P = 0.10, R2 = 0.26 (C); non-mitochondrial respiration, P = 0.11, R2 = 0.25 (D); glycolytic capacity, P = 0.30, R2 = 0.13 (E).
Bronchoalveolar MAC are more reliant on mitochondrial respiration.
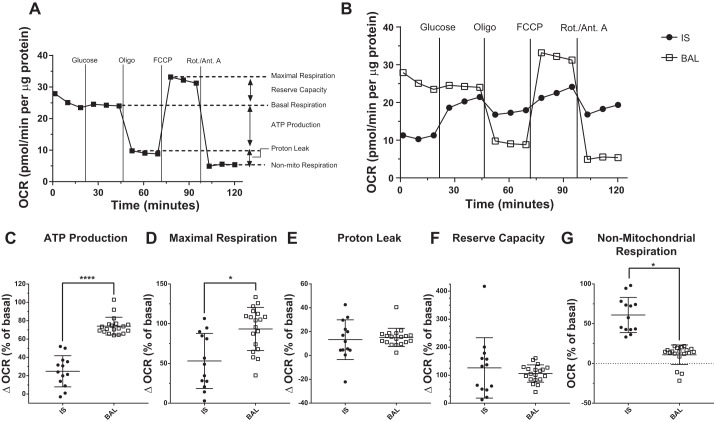
We next examined individual bioenergetics parameters in samples using a modified mitochondrial stress test, wherein glucose and site-specific inhibitors of the electron transport chain are added sequentially to the cells, and the effects on OCR are measured. Six parameters of mitochondrial respiration were quantified using this assay (Fig. 3A). IS MAC showed an increase in OCR following glucose addition, indicating that these cells prefer glucose over glutamine as a substrate for mitochondrial respiration (Fig. 3B). In contrast, BAL MAC showed little change in OCR in response to glucose addition, suggesting their preference for l-glutamine as a substrate (Fig. 3B). As shown in Fig. 3C, BAL MAC showed a higher dependence on mitochondrial respiration for ATP production than did IS MAC. Similarly, BAL MAC exhibited higher maximal respiration than IS MAC (Fig. 3D). Reserve capacity and proton leak did not differ between BAL and IS MAC (Fig. 3, E and F). In contrast, the rate of non-mitochondrial oxygen use was higher in IS MAC than BAL MAC (Fig. 3G).
Fig. 3.
Bronchoalveolar lavage (BAL) macrophages (MAC) are highly dependent on mitochondrial respiration for energy production. A: oxygen consumption rate (OCR) can be modulated by addition of glucose and followed by a mitochondrial stress test to yield different bioenergetic parameters. Mitochondrial stress test involves sequential addition of site-specific inhibitors of the electron transport chain: oligomycin (Oligo), FCCP, and rotenone/antimycin A (Rot./Ant. A). B: mitochondrial stress test was performed on MAC sampled from the central airways [induced sputum (IS)] or distal airways (BAL) of normal volunteers. Representative OCR graphs for each sample type are shown. C–G: individual parameters measured from the mitochondrial stress test data for IS and BAL MAC. *P < 0.05 and ****P < 0.0001 for comparison of group means. Shown are means ± SD, IS (n = 13) and BAL (n = 19).
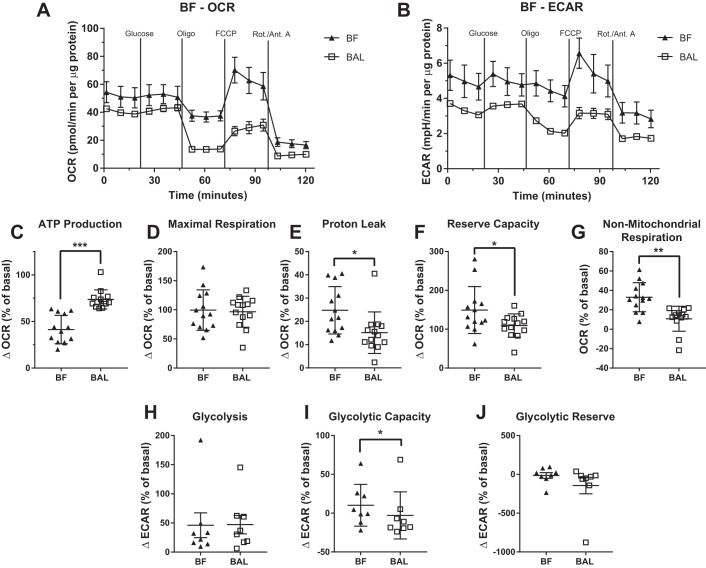
BF MAC had a bioenergetic profile that was similar to that of BAL MAC (Fig. 4, A, C–G). However, like the IS MAC, BF MAC showed a lower mitochondrial oxygen-dependent ATP production and higher non-mitochondrial respiration than BAL MAC when samples from the same subject were compared.
Fig. 4.
Bioenergetic profile of bronchial fraction (BF) macrophages (MAC) resemble that of bronchoalveolar lavage (BAL) MAC. Bioenergetic parameters in MAC from BF and paired BAL were measured using extracellular flux analysis and a mitochondrial stress test. Representative oxygen consumption rate (OCR; A) and extracellular acidification rate (ECAR; B) are plotted for the BAL and BF MAC from the same subject. The following mitochondrial parameters were calculated using OCR: ATP production (C), maximal respiration (D), proton leak (E), reserve capacity (F), and non-mitochondrial respiration (G). Data shown as means ± SD, n = 13. The following glycolytic parameters were calculated using ECAR: glycolysis (G), glycolytic capacity (I), glycolytic reserve (J). Data shown as means ± SD, n = 8. For all graphs, *P < 0.05, **P < 0.01, and ***P < 0.001. Oligo, oligomycin; Rot./Ant. A, rotenone/antimycin A.
We also examined the association between percentage of PMN in IS and maximal respiration. Initially, we noted a positive correlation that was statistically significant. However, the exclusion of a single outlier (noted by open circle, Fig. 2C) resulted in a loss of statistical significance in the correlation. Similarly, Fig. 2D shows a trend toward correlation between IS percent PMN and non-mitochondrial oxygen consumption, but the trend disappeared by removing the same outlier from the data (noted by open circle, Fig. 2D).
IS MAC have a higher glycolytic activity.
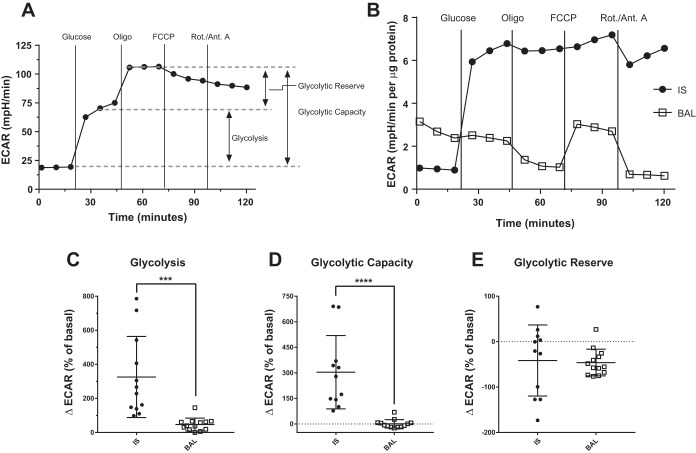
The modified mitochondrial stress test also allowed us to quantify three parameters of MAC glycolytic function, as assessed by ECAR (Fig. 5A). In this assay, IS MAC showed a marked increase in ECAR in response to the introduction of glucose, reaching nearly full glycolytic capacity (Fig. 5B). In contrast, the ECAR in the BAL MAC was not changed by the addition of glucose (Fig. 5B). Furthermore, glycolysis and glycolytic capacity were significantly higher in IS MAC; however, no difference in glycolytic reserve was observed in IS versus BAL MAC (Fig. 5, C–E). BF MAC displayed a similar glycolytic profile to that of BAL MAC, but also showed a slight yet significant increase in glycolytic capacity (Fig. 4, B, H–J).
Fig. 5.
Induced sputum (IS) macrophages (MAC) rely on glycolysis. A: glycolytic stress test with the sequential addition of glucose and oligomycin (Oligo) provides measurements of three glycolytic parameters using the extracellular acidification rate (ECAR). B: ECAR was measured in MAC sampled from the upper airways (IS) or bronchoalveolar region [bronchoalveolar lavage (BAL)] of normal volunteers in response to the glycolytic stress test. Representative ECAR plots are shown for each sample type. C–E: individual parameters derived from the data produced by the glycolytic stress test described in A for IS and BAL MAC. ***P < 0.001 and ****P < 0.0001 for comparison of group means. Shown are means ± SD, IS (n = 11) and BAL (n = 13). Rot./Ant. A, rotenone/antimycin A.
As observed for other bioenergetic parameters, the PMN content of IS samples was not positively correlated with the glycolytic capacity of the IS samples (Fig. 2E).
Xenobiotic challenges differentially affect BAL and sputum MAC bioenergetics.
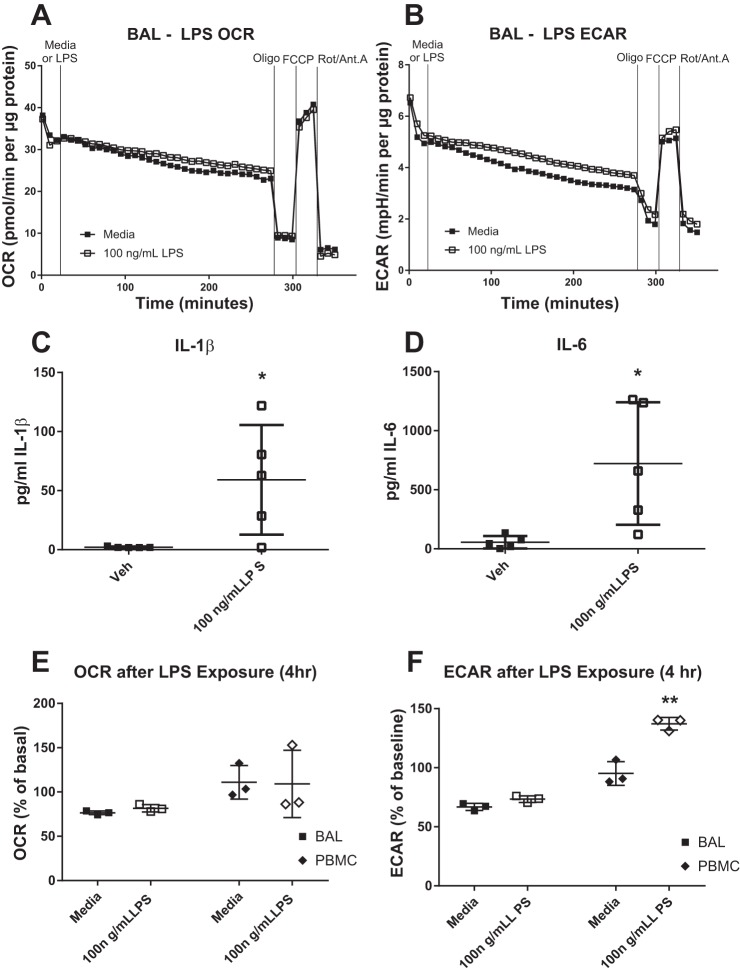
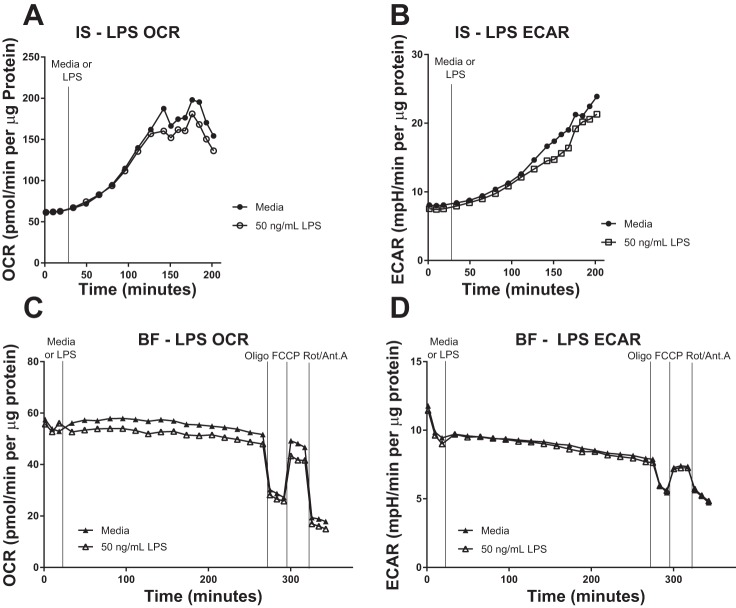
We characterized and compared the influence of various challenges on cellular bioenergetics in MAC obtained by IS and BAL, and BF MAC. LPS is a potent proinflammatory stimulus of MAC. Exposure of lung MAC to 50–100 ng/ml LPS for 4 h did not alter baseline OCR nor mitochondrial parameters measured in these cells (Fig. 6A, Fig. 7, A and C). ECAR parameters were similarly unchanged in IS, BAL, and BF MAC following 4 h LPS exposure (Fig. 6B, Fig. 7, B and D).
Fig. 6.
Acute lipopolysaccharide (LPS) challenge does not alter bronchoalveolar lavage (BAL) macrophage (MAC) bioenergetics. BAL MAC were subjected to extracellular flux analyses in which the oxygen consumption rate (OCR; A) and extracellular acidification rate (ECAR; B) were measured in response to exposure of 100 ng/ml LPS for 4 h were then of the cells. After 4 h of exposure, a mitochondrial stress test was performed using sequential addition of site-specific inhibitors of the electron transport chain [oligomycin (Oligo), FCCP, and rotenone/antimycin A (Rot/Ant. A)]. A representative plot is shown, n = 6. OCR and ECAR values are expressed normalized for protein content. Levels of IL-1β (C) and IL-6 (D) produced by BAL MAC after 4 h challenge with media or 100 ng/ml LPS, n = 5. BAL MAC and peripheral blood monocytes (PBMC; E and F) from the same subject were stimulated with media or 100 ng/ml LPS for 4 h before measurement of their OCR and ECAR. Data are expressed as a percent of the baseline value. *P < 0.05 from vehicle (Veh) or media controls, means ± SD, n ≥ 3.
Fig. 7.
Acute lipopolysaccharide (LPS) challenge does not alter the bioenergetics of induced sputum (IS) or bronchial fraction (BF) macrophages. Oxygen consumption rate (OCR) and extracellular acidification rate (ECAR) of IS (A and B) and BF (C and D) cells were monitored using extracellular flux analysis during exposure to 50 ng/ml LPS for 3–4 h. For BF cells, this exposure was followed by a mitochondrial stress test [oligomycin (Oligo), FCCP, and rotenone/antimycin A (Rot/Ant. A)]. Activity data are expressed normalized for protein content. Representative of n = 3 subjects.
Given the lack of an effect of LPS on MAC bioenergetics, we investigated whether the BAL MAC examined in our study were capable of mounting an inflammatory response to LPS stimulation by measuring their production of IL-1β and IL-6. As shown in Fig. 6, C and D, BAL MAC responded to 6 h LPS treatment with an ~10-fold increase in the production of these inflammatory cytokines.
We then determined whether the lack of a bioenergetic response to LPS challenge in lung MAC also extended to other monocytic cells from the same study volunteers. We compared the bioenergetic profiles of BAL MAC with PBMC obtained from the same individual volunteers. Matched BAL MAC and PBMC were exposed to LPS for 4 h and subjected to the mitochondrial stress test. As shown in Fig. 6F, there was a significant LPS-induced increase in basal ECAR in the PBMC but not in the BAL MAC. No significant changes in basal OCR were seen in response to LPS in either PBMC or BAL MAC (Fig. 6E).
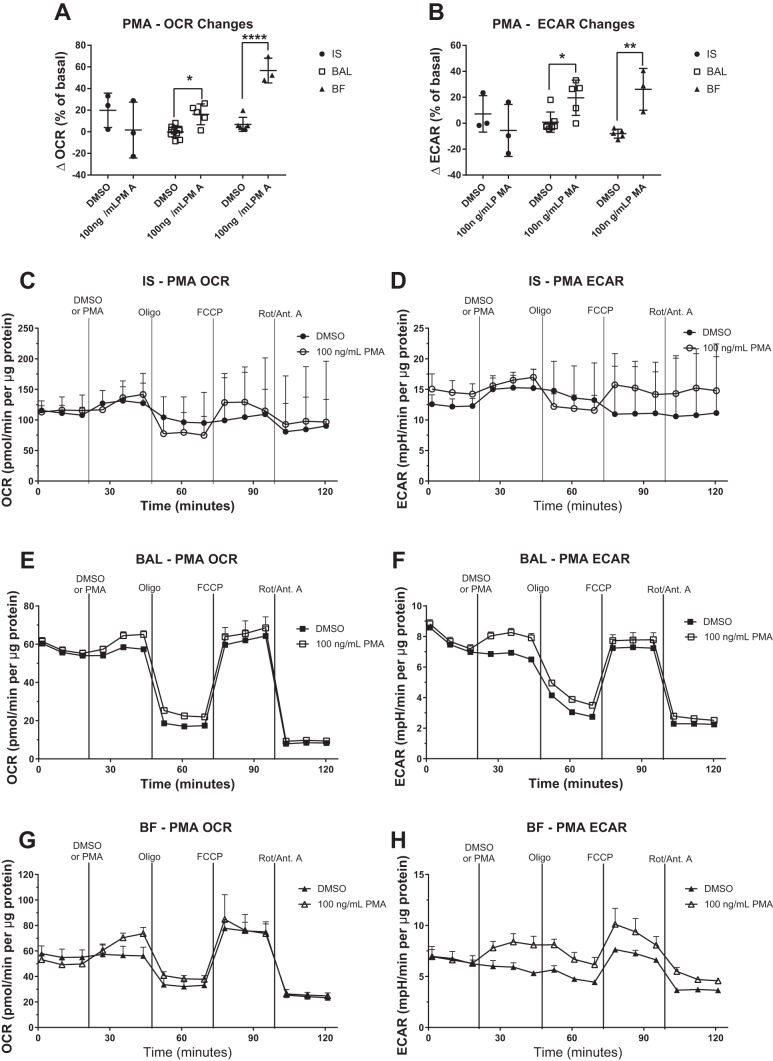
We also tested the effect of activation of PMA, a potent protein kinase C activator, on IS, BAL, and BF MAC. Treatment of BAL or BF MAC with PMA significantly increased the baseline OCR (Fig. 8, A, E, and G), whereas IS MAC showed no change (Fig. 8, A and C). There were no changes in subsequent mitochondrial parameters associated with OCR in IS, BAL, or BF MAC (Fig. 8, C, E, and G). In contrast, glycolytic parameters were affected by PMA exposure, as demonstrated by increased ECAR in BAL and BF MAC (Fig. 8, B, F, and H) but not in IS MAC (Fig. 8, B and D).
Fig. 8.
Activation of protein kinase C induces bronchoalveolar and bronchial fraction (BF) macrophage oxygen consumption rate (OCR) and extracellular acidification rate (ECAR). Cells collected by induced sputum (IS), bronchoalveolar lavage (BAL), and BF were stimulated with the protein kinase C activator PMA, and bioenergetic changes were monitored by extracellular flux analysis. OCR and ECAR were measured at basal conditions, following the addition of 100 ng/ml PMA and in response to a mitochondrial stress test [oligomycin (Oligo), FCCP, rotenone/antimycin A (Rot/Ant. A)]. Data are expressed as the means. OCR (A) and ECAR (B) changes in response to PMA addition over a 24-min exposure are shown as a percentage of the basal OCR or ECAR. Representative OCR and ECAR graphs are shown for IS (C and D), BAL (E and F), and BF (G and H), n ≥ 3, means + SD. OCR and ECAR data were normalized to total protein content in the sample. *P < 0.05 and ****P < 0.001 between means of DMSO control and PMA groups.
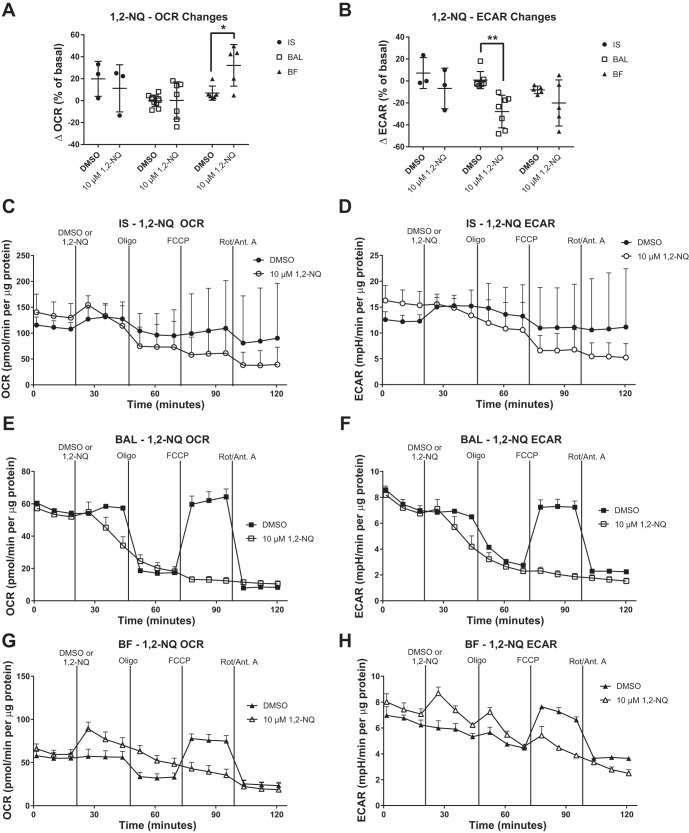
Redox-cycling quinones such as 1,2-NQ are contaminants of ambient air that are thought to contribute to the health effects of air pollution exposure (17, 28). Relative to baseline, the addition of 10 μM 1,2-NQ had no significant effect on IS or BAL MAC OCR (Fig. 9A) but did increase OCR in BF MAC. Further perturbation with bioenergetic inhibitors produced no response in BAL and BF MAC, indicating that the exposure to 1,2-NQ effectively suppressed mitochondrial respiration, including ATP production and maximum respiration (Fig. 9, E and G). In the glycolytic pathway, exposure to 1,2-NQ significantly decreased the ECAR in BAL MAC but had no effect on ECAR in BF or IS MAC (Fig. 9B).
Fig. 9.
Exposure to 1,2-naphthoquinone (1,2-NQ) impairs mitochondrial respiration in human bronchoalveolar macrophages (MAC). Effect of 1,2-NQ on induced sputum (IS), bronchoalveolar lavage (BAL), and bronchial fraction (BF) MAC was measured using extracellular flux analysis. Oxygen consumption rate (OCR) and extracellular acidification rate (ECAR) were measured at basal conditions, following the addition of 10 μM 1,2-NQ and in response to a mitochondrial stress test [oligomycin (Oligo), FCCP, and rotenone/antimycin A (Rot/Ant. A)]. Data are expressed as the means. OCR (A) and ECAR (B) changes in response to 1,2-NQ addition over a 24-min exposure are shown as a percentage of baseline. Representative OCR and ECAR plots are shown for IS (C and D), BAL (E and F), and BF (G and H), n ≥ 3, means + SD. OCR and ECAR data were normalized to total protein content in the sample. *P < 0.05 and **P < 0.01 between means of DMSO control and 1,2-NQ groups within sample type.
DISCUSSION
To our knowledge, this is the first report comparing the bioenergetic profile of MAC recovered from different regions in the respiratory tract of healthy human volunteers. Our study provides evidence that depending on their location within the respiratory tract, MAC populations demonstrate metabolically distinct profiles. We observed that IS MAC recovered from the surfaces of the central airways had constitutively higher OCR and ECAR levels compared with BAL and BF MAC, suggesting that a heightened basal metabolic state occurs in MAC from the central versus distal airway regions. Interestingly, much of the basal OCR in IS MAC was nonmitochondrial, suggesting oxygen consumption occurs through alternative processes, such as the oxidative burst. Furthermore, IS MAC had higher glycolytic activity, reflecting the M1 phenotype. In contrast, BAL MAC were highly reliant on mitochondrial respiration, a reflection of the M2 phenotype. These observations are consistent with our previous work that showed greater functional activity (phagocytosis, oxidative burst) and upregulated cell surface phenotype expression (CD11b+) in IS versus BAL and BF MAC sampled from the same individuals (1). As immune function has been shown to be dictated by bioenergetic profile, the results here may serve as an underlying reason behind functional and phenotypic differences in IS and BAL MAC.
Based on these findings, we speculate that the increased glycolytic state of IS MAC may reflect the cell’s need to generate ATP quickly via glycolysis, rather than slowly via oxidative phosphorylation, to optimally respond to the continued exposure and interaction with inhaled microorganisms and pathogen-associated molecular patterns. During the immune response, nitric oxide can inhibit Complex I, II, and IV, leading to a collapse in the mitochondrial membrane potential (6). To mount an appropriate immune response, IS MAC may repurpose mitochondria to generate required reactive oxygen species signals to stimulate inflammation and phagocytosis, as reported for Complex I (9, 25). BAL MAC, on the other hand, are located more distally from inhaled pathogens and are therefore less likely to require a rapid metabolic output, consistent with their bioenergetic similarity to the anti-inflammatory M2 profile. Overall, the metabolic differences that we report here, together with previously reported functional and phenotypic differences between IS, BAL, and BF MAC, support the notion that functionally heterogeneous MAC populations exist in the lung and that bioenergetic profiles play distinct roles in supporting the respective activities of MAC from the upper and lower respiratory tract.
An unexpected finding from this study was the lack of metabolic reprogramming toward glycolysis in BAL MAC after acute LPS stimulation. This metabolic reprogramming has been previously reported in MAC differentiated from both murine BMDM (24, 31) and human PBMC (15) and has been hypothesized to be necessary for the production of inflammatory cytokines (27). In the present study, BAL MAC were metabolically unresponsive to an acute LPS exposure even though LPS recognition and associated signal transduction processes were functional, as evidenced by a robust IL-6 and IL-1β cytokine response. In addition, subject-matched PBMC did show an increase in ECAR in response to LPS, as previously seen using MAC differentiated in vitro from PBMC (15). These data suggest that in terms of their ability to undergo metabolic reprogramming toward the glycolytic phenotype, human BAL MAC in vivo are unlike both murine or human MAC differentiated in culture from BMDM or PBMC, respectively. Additional investigation is needed to determine whether glycolytic IS MAC can be reprogrammed toward oxidative phosphorylation (M2 phenotype) in the presence of IL-4, a process that has been shown not to occur in murine MAC (30).
We further characterized the metabolic profile of our samples by challenging them with PMA, a protein kinase C activator known to induce intracellular oxidative burst activity, and with 1,2-NQ, a redox-active air pollutant that induces oxidative stress. BAL and BF MAC responded with the expected increase in OCR and ECAR following PMA, likely indicating increases in oxidative burst and a shift toward glycolysis, respectively. IS MAC bioenergetics did not change in response to PMA exposure, likely because of the high basal activation (high OCR and ECAR) of the IS samples. Interestingly, BF MAC were the only cells to show an increase in OCR following 1,2-NQ exposure, an effect attributable to the redox-cycling activity of the quinone. Indeed, BF and BAL MAC demonstrated decreases in mitochondrial function when treated with 1,2-NQ, as previously reported in BEAS-2B immortalized human bronchial epithelial cells (19). Such mitochondrial dysfunction could also induce oxidative stress, leading to adaptive changes or even apoptosis in MAC (23).
It is important to note that although our sample types contained predominately MAC, some IS samples contained significant numbers of PMN (on average 30%), which is also in keeping with previously published findings (1, 26). Because of limited cell yield of these samples, it was not possible to remove PMN from the bioenergetic profile and enrich for MAC. However, we contend that PMN were unlikely contributors to the MAC OCR and ECAR measurements for multiple reasons. First, resting PMN have relatively few mitochondria per cell, rendering these cells bioenergetically quiescent (7, 8). Second, although there was a positive correlation between the percent PMN and the maximal respiration of the IS sample, this correlation was found to be driven by a single outlier in whom the percent PMN (68%) was more than 2 standard deviations above the group mean (30%) in this study. Third, given their phagocytic capacity, PMN would be expected to contribute to non-mitochondrial oxygen consumption and/or the glycolytic capacity of the IS samples. However, no positive correlations were observed between PMN content and either parameter in the IS samples. Therefore, while we cannot completely rule out the possibility that PMN contribute to the bioenergetic profile of the IS samples, we take our results in this study to represent the bioenergetic profile of MAC from the surfaces of the large central airways. In addition, signaling from PMN in sputum samples may contribute to the altered bioenergetics of IS MAC, though more investigation is needed into potential mechanisms.
Another inherent limitation in our study was that IS and BAL/BF samples were collected from different individuals. Given the relatively small sample size, potential intersubject variability may have contributed to differences in bioenergetic profiles between IS and BAL MAC. To address this limitation, current studies underway in our laboratory are examining IS and BAL MAC acquired from the same individuals using extracellular flux analysis. In terms of the utility of monocyte-derived MAC to serve as a model that approximates MAC in vivo, our data suggest that even with an organ system, such as the lung, MAC bioenergetics differ regionally. Therefore, MAC models differentiated from monocytes in vitro should be used with some caution.
Recent advances in extracellular flux technology have greatly facilitated the characterization of the bioenergetic profile of intact cells, affording unprecedented insights into how energy metabolism can influence immune cell function during homeostasis and in response to challenge (21). Here, we show for the first time that human IS MAC derived from the surfaces of the central airways are often more basally energetic overall than BF and BAL MAC from distal airways. Furthermore, IS MAC have a higher dependence on glycolysis than BAL and BF MAC, which appear to rely on mitochondrial respiration. Notably, unlike MAC differentiated from BMDM or PBMC in culture, human lung MAC examined ex vivo do not undergo metabolic reprogramming during their inflammatory responses to LPS. Bioenergetic measurements provide a new classification of MAC based on their functional phenotype. Although in its infancy, translational bioenergetics can inform clinical research by revealing mechanisms underlying innate immune cell function in both health and disease.
GRANTS
K. S. Lavrich was supported by US Environmental Protection Agency-University of North Carolina Toxicology Training Agreement Grant CR-83591401-0 and National Institute of Environmental Health Sciences National Research Service Award Grant T32-ES-007126.
DISCLAIMERS
The research described in this article has been reviewed by the National Health and Environmental Effects Research Laboratory, US Environmental Protection Agency, and approved for publication. The contents of this article should not be construed to represent agency policy nor does mention of trade names or commercial products constitute endorsement or recommendation for use.
DISCLOSURES
No conflicts of interest, financial or otherwise, are declared by the authors.
AUTHOR CONTRIBUTIONS
K.S.L., J.M.S., and N.E.A. conceived and designed research; K.S.L., A.M.S., and A.J.G. performed experiments; K.S.L. and A.M.S. analyzed data; K.S.L., P.A.B., J.M.S., and N.E.A. interpreted results of experiments; K.S.L. prepared figures; K.S.L. drafted manuscript; K.S.L., A.M.S., A.J.G., P.A.B., J.M.S., and N.E.A. edited and revised manuscript; K.S.L., A.M.S., A.J.G., P.A.B., J.M.S., and N.E.A. approved final version of manuscript.
ACKNOWLEDGMENTS
We thank the clinical staff at the Environmental Public Health Division of the US Environmental Protection Agency, specifically Tracey Montilla, RN, Julie Wood, RN, Claudia Salazar, CCRC, Joleen Soukup, MSPH, and Lisa Dailey, MSPH for obtaining and processing the bronchoalveolar lavage samples. We also thank the clinical staff of the Center for Environmental Medicine, Asthma, and Lung Biology, including Heather Wells, Sha ‘Leema Jenkins, and Carole Robinette. We thank Elizabeth Corteselli for experimental support and advice.
REFERENCES
- 1.Alexis N, Soukup J, Ghio A, Becker S. Sputum phagocytes from healthy individuals are functional and activated: a flow cytometric comparison with cells in bronchoalveolar lavage and peripheral blood. Clin Immunol 97: 21–32, 2000. doi: 10.1006/clim.2000.4911. [DOI] [PubMed] [Google Scholar]
- 2.Alexis NE, Hu SC, Zeman K, Alter T, Bennett WD. Induced sputum derives from the central airways: confirmation using a radiolabeled aerosol bolus delivery technique. Am J Respir Crit Care Med 164: 1964–1970, 2001. doi: 10.1164/ajrccm.164.10.2104051. [DOI] [PubMed] [Google Scholar]
- 3.Alexis NE, Lay JC, Zeman KL, Geiser M, Kapp N, Bennett WD. In vivo particle uptake by airway macrophages in healthy volunteers. Am J Respir Cell Mol Biol 34: 305–313, 2006. doi: 10.1165/rcmb.2005-0373OC. [DOI] [PMC free article] [PubMed] [Google Scholar]
- 4.Alexis NE, Zhou H, Lay JC, Harris B, Hernandez ML, Lu TS, Bromberg PA, Diaz-Sanchez D, Devlin RB, Kleeberger SR. The glutathione-S-transferase Mu 1 null genotype modulates ozone-induced airway inflammation in human subjects. J Allergy Clin Immunol 124: 1222–1228, 2009. doi: 10.1016/j.jaci.2009.07.036. [DOI] [PMC free article] [PubMed] [Google Scholar]
- 5.Belchamber KB, Donnelly LE. Macrophage dysfunction in respiratory disease. In: Macrophages. New York: Springer, 2017, p. 299–313. doi: 10.1007/978-3-319-54090-0_12. [DOI] [PubMed] [Google Scholar]
- 6.Beltrán B, Mathur A, Duchen MR, Erusalimsky JD, Moncada S. The effect of nitric oxide on cell respiration: a key to understanding its role in cell survival or death. Proc Natl Acad Sci USA 97: 14602–14607, 2000. doi: 10.1073/pnas.97.26.14602. [DOI] [PMC free article] [PubMed] [Google Scholar]
- 7.Borregaard N, Herlin T. Energy metabolism of human neutrophils during phagocytosis. J Clin Invest 70: 550–557, 1982. doi: 10.1172/JCI110647. [DOI] [PMC free article] [PubMed] [Google Scholar]
- 8.Chacko BK, Kramer PA, Ravi S, Johnson MS, Hardy RW, Ballinger SW, Darley-Usmar VM. Methods for defining distinct bioenergetic profiles in platelets, lymphocytes, monocytes, and neutrophils, and the oxidative burst from human blood. Lab Invest 93: 690–700, 2013. doi: 10.1038/labinvest.2013.53. [DOI] [PMC free article] [PubMed] [Google Scholar]
- 9.Chandel NS, Schumacker PT, Arch RH. Reactive oxygen species are downstream products of TRAF-mediated signal transduction. J Biol Chem 276: 42728–42736, 2001. doi: 10.1074/jbc.M103074200. [DOI] [PubMed] [Google Scholar]
- 10.Galván-Peña S, O’Neill LA. Metabolic reprograming in macrophage polarization. Front Immunol 5: 420, 2014. doi: 10.3389/fimmu.2014.00420. [DOI] [PMC free article] [PubMed] [Google Scholar]
- 11.Gerencser AA, Neilson A, Choi SW, Edman U, Yadava N, Oh RJ, Ferrick DA, Nicholls DG, Brand MD. Quantitative microplate-based respirometry with correction for oxygen diffusion. Anal Chem 81: 6868–6878, 2009. doi: 10.1021/ac900881z. [DOI] [PMC free article] [PubMed] [Google Scholar]
- 12.Ghio AJ, Devlin RB. Inflammatory lung injury after bronchial instillation of air pollution particles. Am J Respir Crit Care Med 164: 704–708, 2001. doi: 10.1164/ajrccm.164.4.2011089. [DOI] [PubMed] [Google Scholar]
- 13.Heron M, Grutters JC, ten Dam-Molenkamp KM, Hijdra D, van Heugten-Roeling A, Claessen AM, Ruven HJ, van den Bosch JM, van Velzen-Blad H. Bronchoalveolar lavage cell pattern from healthy human lung. Clin Exp Immunol 167: 523–531, 2012. doi: 10.1111/j.1365-2249.2011.04529.x. [DOI] [PMC free article] [PubMed] [Google Scholar]
- 14.Hiemstra PS. Altered macrophage function in chronic obstructive pulmonary disease. Ann Am Thorac Soc Suppl 10: S180–S185, 2013. doi: 10.1513/AnnalsATS.201305-123AW. [DOI] [PubMed] [Google Scholar]
- 15.Huang SC, Everts B, Ivanova Y, O’Sullivan D, Nascimento M, Smith AM, Beatty W, Love-Gregory L, Lam WY, O’Neill CM, Yan C, Du H, Abumrad NA, Urban JF Jr, Artyomov MN, Pearce EL, Pearce EJ. Cell-intrinsic lysosomal lipolysis is essential for alternative activation of macrophages. Nat Immunol 15: 846–855, 2014. doi: 10.1038/ni.2956. [DOI] [PMC free article] [PubMed] [Google Scholar]
- 16.Jha AK, Huang SC, Sergushichev A, Lampropoulou V, Ivanova Y, Loginicheva E, Chmielewski K, Stewart KM, Ashall J, Everts B, Pearce EJ, Driggers EM, Artyomov MN. Network integration of parallel metabolic and transcriptional data reveals metabolic modules that regulate macrophage polarization. Immunity 42: 419–430, 2015. doi: 10.1016/j.immuni.2015.02.005. [DOI] [PubMed] [Google Scholar]
- 17.Kumagai Y, Shinkai Y, Miura T, Cho AK. The chemical biology of naphthoquinones and its environmental implications. Annu Rev Pharmacol Toxicol 52: 221–247, 2012. doi: 10.1146/annurev-pharmtox-010611-134517. [DOI] [PubMed] [Google Scholar]
- 18.Laskin DL, Sunil VR, Gardner CR, Laskin JD. Macrophages and tissue injury: agents of defense or destruction? Annu Rev Pharmacol Toxicol 51: 267–288, 2011. doi: 10.1146/annurev.pharmtox.010909.105812. [DOI] [PMC free article] [PubMed] [Google Scholar]
- 19.Lavrich KS, Corteselli EM, Wages PA, Bromberg PA, Simmons SO, Gibbs-Flournoy EA, Samet JM. Investigating mitochondrial dysfunction in human lung cells exposed to redox-active PM components. Toxicol Appl Pharmacol 342: 99–107, 2018. doi: 10.1016/j.taap.2018.01.024. [DOI] [PMC free article] [PubMed] [Google Scholar]
- 20.Mabalirajan U, Dinda AK, Kumar S, Roshan R, Gupta P, Sharma SK, Ghosh B. Mitochondrial structural changes and dysfunction are associated with experimental allergic asthma. J Immunol 181: 3540–3548, 2008. doi: 10.4049/jimmunol.181.5.3540. [DOI] [PubMed] [Google Scholar]
- 21.Mills EL, Kelly B, O’Neill LA. Mitochondria are the powerhouses of immunity. Nat Immunol 18: 488–498, 2017. doi: 10.1038/ni.3704. [DOI] [PubMed] [Google Scholar]
- 22.O’Neill LA, Kishton RJ, Rathmell J. A guide to immunometabolism for immunologists. Nat Rev Immunol 16: 553–565, 2016. doi: 10.1038/nri.2016.70. [DOI] [PMC free article] [PubMed] [Google Scholar]
- 23.Ott M, Gogvadze V, Orrenius S, Zhivotovsky B. Mitochondria, oxidative stress and cell death. Apoptosis 12: 913–922, 2007. doi: 10.1007/s10495-007-0756-2. [DOI] [PubMed] [Google Scholar]
- 24.Palsson-McDermott EM, Curtis AM, Goel G, Lauterbach MA, Sheedy FJ, Gleeson LE, van den Bosch MW, Quinn SR, Domingo-Fernandez R, Johnston DG, Jiang JK, Israelsen WJ, Keane J, Thomas C, Clish C, Vander Heiden M, Xavier RJ, O’Neill LA. Pyruvate kinase M2 regulates Hif-1α activity and IL-1β induction and is a critical determinant of the warburg effect in LPS-activated macrophages. Cell Metab 21: 65–80, 2015. doi: 10.1016/j.cmet.2014.12.005. [DOI] [PMC free article] [PubMed] [Google Scholar]
- 25.Pearce EL, Pearce EJ. Metabolic pathways in immune cell activation and quiescence. Immunity 38: 633–643, 2013. doi: 10.1016/j.immuni.2013.04.005. [DOI] [PMC free article] [PubMed] [Google Scholar]
- 26.Rutgers SR, Timens W, Kaufmann HF, van der Mark TW, Koëter GH, Postma DS. Comparison of induced sputum with bronchial wash, bronchoalveolar lavage and bronchial biopsies in COPD. Eur Respir J 15: 109–115, 2000. doi: 10.1183/09031936.00.15110900. [DOI] [PubMed] [Google Scholar]
- 27.Tannahill GM, Curtis AM, Adamik J, Palsson-McDermott EM, McGettrick AF, Goel G, Frezza C, Bernard NJ, Kelly B, Foley NH, Zheng L, Gardet A, Tong Z, Jany SS, Corr SC, Haneklaus M, Caffrey BE, Pierce K, Walmsley S, Beasley FC, Cummins E, Nizet V, Whyte M, Taylor CT, Lin H, Masters SL, Gottlieb E, Kelly VP, Clish C, Auron PE, Xavier RJ, O’Neill LA. Succinate is an inflammatory signal that induces IL-1β through HIF-1α. Nature 496: 238–242, 2013. doi: 10.1038/nature11986. [DOI] [PMC free article] [PubMed] [Google Scholar]
- 28.Valavanidis A, Fiotakis K, Bakeas E, Vlahogianni T. Electron paramagnetic resonance study of the generation of reactive oxygen species catalysed by transition metals and quinoid redox cycling by inhalable ambient particulate matter. Redox Rep 10: 37–51, 2005. doi: 10.1179/135100005X21606. [DOI] [PubMed] [Google Scholar]
- 29.Van den Bossche J, Baardman J, de Winther MP. Metabolic characterization of polarized M1 and M2 bone marrow-derived macrophages using real-time extracellular flux analysis. J Vis Exp 105: e53424, 2015. doi: 10.3791/53424. [DOI] [PMC free article] [PubMed] [Google Scholar]
- 30.Van den Bossche J, Baardman J, Otto NA, van der Velden S, Neele AE, van den Berg SM, Luque-Martin R, Chen H-J, Boshuizen MC, Ahmed M, Hoeksema MA, de Vos AF, de Winther MP. Mitochondrial dysfunction prevents repolarization of inflammatory macrophages. Cell Reports 17: 684–696, 2016. doi: 10.1016/j.celrep.2016.09.008. [DOI] [PubMed] [Google Scholar]
- 31.Vats D, Mukundan L, Odegaard JI, Zhang L, Smith KL, Morel CR, Wagner RA, Greaves DR, Murray PJ, Chawla A. Oxidative metabolism and PGC-1β attenuate macrophage-mediated inflammation. Cell Metab 4: 13–24, 2006. doi: 10.1016/j.cmet.2006.05.011. [DOI] [PMC free article] [PubMed] [Google Scholar]
- 32.Wiegman CH, Michaeloudes C, Haji G, Narang P, Clarke CJ, Russell KE, Bao W, Pavlidis S, Barnes PJ, Kanerva J, Bittner A, Rao N, Murphy MP, Kirkham PA, Chung KF, Adcock IM, Brightling CE, Davies DE, Finch DK, Fisher AJ, Gaw A, Knox AJ, Mayer RJ, Polkey M, Salmon M, Singh D; COPDMAP . Oxidative stress-induced mitochondrial dysfunction drives inflammation and airway smooth muscle remodeling in patients with chronic obstructive pulmonary disease. J Allergy Clin Immunol 136: 769–780, 2015. doi: 10.1016/j.jaci.2015.01.046. [DOI] [PMC free article] [PubMed] [Google Scholar]
- 33.Xue J, Schmidt SV, Sander J, Draffehn A, Krebs W, Quester I, De Nardo D, Gohel TD, Emde M, Schmidleithner L, Ganesan H, Nino-Castro A, Mallmann MR, Labzin L, Theis H, Kraut M, Beyer M, Latz E, Freeman TC, Ulas T, Schultze JL. Transcriptome-based network analysis reveals a spectrum model of human macrophage activation. Immunity 40: 274–288, 2014. doi: 10.1016/j.immuni.2014.01.006. [DOI] [PMC free article] [PubMed] [Google Scholar]
- 34.Yoon CM, Nam M, Oh YM, Dela Cruz CS, Kang MJ. Mitochondrial regulation of inflammasome activation in chronic obstructive pulmonary disease. J Innate Immun 8: 121–128, 2016. doi: 10.1159/000441299. [DOI] [PMC free article] [PubMed] [Google Scholar]


