

SUMMARY
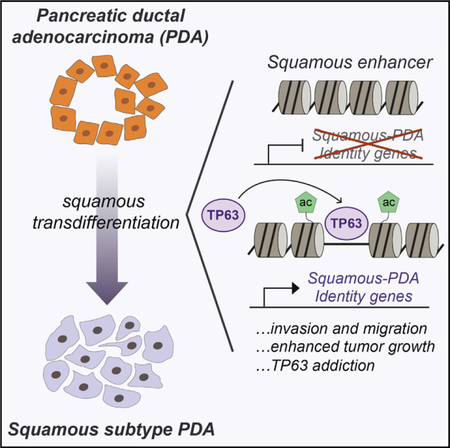
The aberrant expression of squamous lineage markers in pancreatic ductal adenocarcinoma (PDA) has been correlated with poor clinical outcomes. However, the functional role of this putative transdifferentiation event in PDA pathogenesis remains unclear. Here, we show that expression of the transcription factor TP63 (∆Np63) is sufficient to install and sustain the enhancer landscape and transcriptional signature of the squamous lineage in human PDA cells. We also demonstrate that TP63-driven enhancer reprogramming promotes aggressive tumor phenotypes, including enhanced cell motility and invasion, and an accelerated growth of primary PDA tumors and metastases in vivo. This process ultimately leads to a powerful addiction of squamous PDA cells to continuous TP63 expression. Our study demonstrates the functional significance of squamous transdifferentiation in PDA and reveals TP63-based reprogramming as an experimental tool for investigating mechanisms and vulnerabilities linked to this aberrant cell fate transition.
Graphical Abstract
In Brief
Somerville et al. report that the transcription factor TP63 is a master regulator of squamous-subtype pancreatic cancer as it reprograms the enhancer landscape to drive squamous transdifferentiation, promoting invasion, migration, in vivo tumor growth, and poor prognosis.
INTRODUCTION
Pancreatic ductal adenocarcinoma (PDA) is an aggressive malignancy that typically presents at an advanced stage and is refractory to most available treatments, with a median 5-year survival rate of <8% (Siegel et al., 2018). This malignancy is typically initiated by an activating mutation in KRAS in a ductal or an acinar cell of the pancreas, which collaborates with the loss of tumor suppressor genes to drive PDA progression (Aguirre et al., 2003; Hingorani et al., 2003, 2005). Despite our deep understanding of the genetic drivers and the molecular pathogenesis of PDA, pathway-specific targeted therapies have yet to be implemented in the management of disease. Among the numerous challenges in advancing targeted therapies in PDA is the profound heterogeneity of tumor cell phenotypes within the current histology-based definition of this disease, which limits our ability to predict responses to targeted agents.
Dynamic transitions in cell fate are one important source of inter- and intra-tumoral heterogeneity in PDA. For example, experiments in mouse models have shown that PDA can originate in a pancreatic acinar cell, which transdifferentiates into a ductal cell following the introduction of mutant Kras (Ferreira et al., 2017; Guerra et al., 2007). In later stages of disease progression, it is known that PDA can transiently lose the expression of epithelial cell markers and gain mesenchymal features, in association with metastatic spread (Genovese et al., 2017; Krebs et al., 2017; McDonald et al., 2017; Rhim et al., 2012). Moreover, a subset of PDA tumors exhibit epigenetic silencing of endodermal cell fate determinants, including hepatocyte nuclear factor 1 homeobox A (HNF1A), HNF1B, HNF4A, and Kruppel-like factor 5 (KLF5), in association with a stable epithelial-to-mesenchymal fate transition (David et al., 2016; Diaferia et al., 2016). We have recently shown that mouse and human PDA tumors can upregulate the pioneer factor Forkhead box A1 (FOXA1), which leads to the activation of an embryonic foregut endoderm enhancer landscape to endow tumor cells with metastatic potential (Roe et al., 2017). Collectively, these studies highlight aberrant cell fate transitions as a hallmark property of PDA, which can be understood mechanistically by epigenomic mapping of the global enhancer configuration.
It has long been recognized that a subset of PDA tumors acquire features of the squamous epithelial lineage (Morohoshi et al., 1983), although the clinical relevance of this aberrant cell fate transition is not well understood. Squamous epithelial cells are a specialized cell type found in the epidermis, oropharynx, and other anatomical locations, but this cell type does not exist in the normal pancreas (Basturk et al., 2005). Nonetheless, histological analyses have revealed that a subset of human PDAs possess an adenosquamous cell morphology, which is invariably associated with the expression of TP63, a master regulator of the normal squamous lineage (Mills et al., 1999; Soares and Zhou, 2018). Recent transcriptome profiling of human tumor specimens revealed that squamous lineage markers are expressed in as much as 25% of PDA tumors, which includes the adenosquamous tumors as well as specimens that lack clear evidence of this cell morphology (Bailey et al., 2016). These squamous-like PDAs are associated with an inferior prognosis when compared to tumors lacking this transcriptional signature. While the origin of a squamous identity in this disease is poorly understood, it has been recognized that squamous-like PDAs are enriched for loss-of-function mutations in the tumor-suppressor genes TP53, KDM6A, KMT2C, and KMT2D (Andricovich et al., 2018; Bailey et al., 2016).
A recent study used genetically engineered mice to show that inactivation of the histone demethylase gene Kdm6a, in conjunction with a KrasG12D mutation, led to the emergence of aggressive PDAs that express squamous lineage markers (Andricovich et al., 2018). In addition, it was shown that Kdm6a loss led to the aberrant activation of enhancers at the Trp63 (the mouse ortholog of TP63), Runx3, and Myc loci. While this important study validates Kdm6a as a genetic driver of PDA progression and establishes a model system for interrogating this disease subtype, it did not address whether squamous transdifferentiation was a cause or a consequence of the aggressive tumor phenotype. This is particularly relevant because KDM6A is a general chromatin regulator, which may perform tumor-suppressor functions irrespective of cell lineage (Ezponda et al., 2017).
In this study, we show that the ∆N isoform of the transcription factor TP63 (∆Np63) is a master regulator that specifies squamous cell identity in PDA through dynamic regulation of the enhancer landscape. Based on this observation, we use ∆Np63 to introduce squamous lineage characteristics into otherwise isogenic PDA cell lines, which we use to interrogate the functional consequences of this cell fate transition in vitro and in vivo. These experiments implicate ∆Np63-driven enhancer reprogramming as a mechanism that promotes PDA progression by endowing tumors with enhanced growth and invasive potential. In addition, we identify a network of oncogenic target genes sustained by ∆Np63 that operate in the squamous subtype of PDA. In addition to validating the functional significance of squamous transdifferentiation in PDA, our study suggests that targeting the ∆Np63 transcriptional network may have therapeutic potential in this aggressive disease subtype.
RESULTS
TP63 Is Expressed in a Subset of Pancreatic Tumors that Display a Squamous-like Transcriptional Signature and Inferior Overall Survival
Prior studies have noted the expression of squamous lineage markers in a poor-prognosis subtype of PDA (Bailey et al., 2016). To investigate the functional importance of this cell fate transition, we first sought to identify the master regulator transcription factor (TF), whose presence is sufficient to confer squamous cell identity in PDA. To this end, we evaluated existing transcriptome analyses of PDA tumors in search of TFs that are selectively expressed in the squamous-like subtype of this disease (Bailey et al., 2016; The Cancer Genome Atlas Research Network, 2017). Among all of the TFs expressed in PDA, we recovered TP63 expression as the most highly enriched in squamous-subtype tumors, which is in accordance with prior observations and the known role of this TF in normal and neoplastic squamous lineage contexts (Figures 1A, 1B, S1A, and S1B) (Andricovich et al., 2018; Bailey et al., 2016). In addition, we found that endodermal TFs GATA6, HNF1A, HNF1B, and HNF4A are often silenced in TP63-expressing tumors, which is consistent with the mutually exclusive classification of PDA into progenitor and squamous subtypes (Bailey et al., 2016). Notably, TP63 is expressed at low levels in normal human and mouse pancreatic epithelial cells, but it is aberrantly upregulated in 15%–26% of primary human PDA tumors and metastatic lesions (Figures S1C–S1F) (Boj et al., 2015; GTEx Consortium, 2015). To further corroborate this finding, we turned to our recently established collection of 56 human organoid cultures derived from normal pancreatic tissue or PDA tumors (Tiriac et al., 2018). Using RNA sequencing (RNA-seq) analysis, we verified that ~20% of PDA organoids express TP63, which increases in a stage-dependent manner (Figure 1C; Table S1). Using RT-PCR analysis, we determined that the ∆N isoform of TP63 (∆Np63) is specifically expressed in these samples, which is known to be the oncogenic form of this TF (Figure S1G) (Rocco et al., 2006). TP63 expression in PDA tumors was associated with an inferior overall survival across each study analyzed (Figures 1D, S1H, and S1I). Considering the known link between ∆Np63 and squamous cell carcinoma (Keyes et al., 2011), we investigated whether manipulating this TF would allow us to understand the importance of squamous lineage characteristics in PDA.
Figure 1. ∆Np63 Is Necessary and Sufficient to Drive Progenitor-to-Squamous Transcriptional Reprogramming in Human PDA Cells.
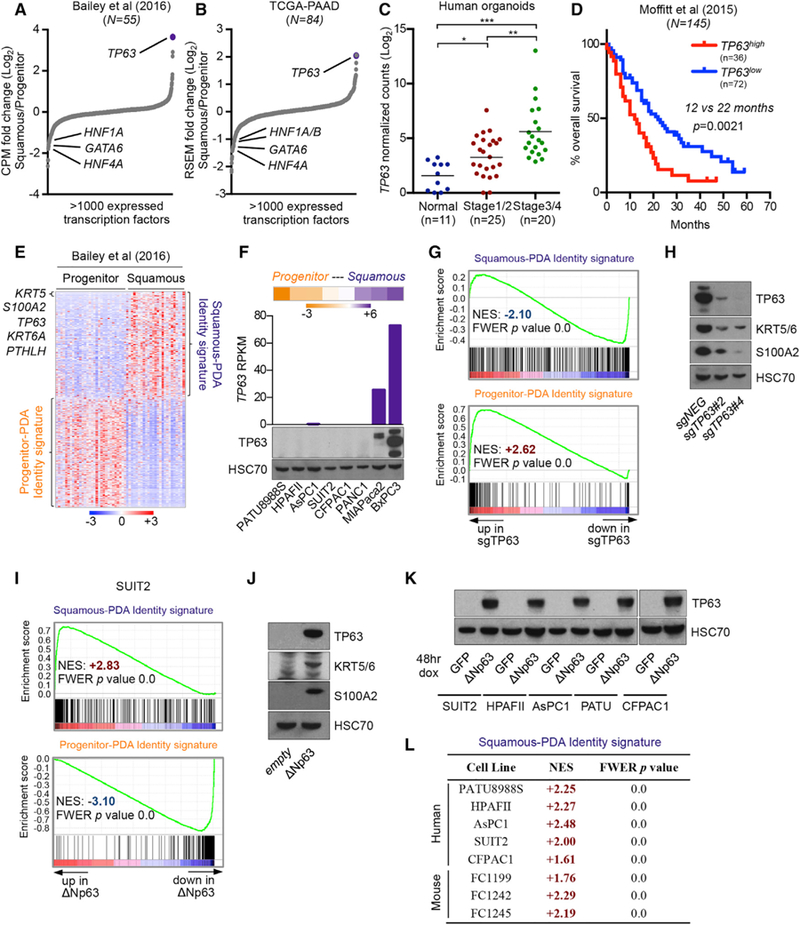
(A and B) Transcription factor expression in squamous and progenitor subtypes of PDA. Scatterplots show expressed transcription factors ranked by their mean log2 fold change in squamous versus progenitor patient samples from (A) Bailey et al. (2016) and (B) The Cancer Genome Atlas Research Network (2017).
(C) TP63 expression in human organoids derived from normal pancreatic tissue or PDA tumor samples at the indicated disease stage. Data are from the study by Tiriac et al. (2018). *p < 0.05, **p < 0.01, ***p < 0.001 by unpaired Student’s t test. See also Table S1.
(D) Survival curve of patients from the indicated study stratified according to high or low TP63 expression and for which survival data were available (Moffitt et al., 2015). Samples were designated as TP63high or TP63low based on Z score expression values >0.35 or <0, respectively. p value was calculated using the log rank (Mantel-Cox) test.
(E) Squamous-PDA and progenitor-PDA identity signatures defined from patient samples. The top 500 protein coding genes in squamous (n = 25) or progenitor (n = 30) patient samples from the study by Bailey et al. (2016) were used to define the respective signatures. Heatmap shows expression levels of signature genes. Scale bar indicates the standardized expression value. See also Table S2.
(F) TP63 expression in human PDA cell lines. Heatmap (top) shows RNA-seq analysis of human PDA cell lines ranked according to fold change in the median expression level of genes corresponding to the squamous-PDA versus progenitor-PDA identity signatures; scale bar indicates log2 fold change. Bar chart (middle) and western blot analysis (bottom) show TP63 expression in the indicated human PDA cell lines.
(G and H) TP63 knock out in BxPC3 cells. (G) GSEA plots evaluating the squamous-PDA and progenitor-PDA identity signatures upon TP63 knockout.(H) Representative western blot analysis for the indicated proteins. RNA was extracted and whole-cell lysates were prepared for the respective analyses on day 5 post-infection with sgRNAs, 3 days post-selection with G418.
(I and J) ∆Np63 expression in SUIT2 cells. (I) GSEA plots evaluating the squamous-PDA and progenitor-PDA identity signatures upon ∆Np63 expression.(J) Representative western blot analysis in SUIT2 cells for the indicated protiens. RNA was extracted and whole-cell lysates were prepared for the respective analyses on day 7 post-infection, 5 days following G418 selection.
(K and L) Acute ∆Np63 expression in progenitor-like PDA cells. (K) Representative western blot analysis in the indicated cell lines for the indicated proteins.(L) Table summarizing RNA-seq data evaluating the squamous-PDA identity signature upon induction of ∆Np63 expression in the indicated cell lines. RNA was extracted and whole-cell lysates were prepared for the respective analyses 48 hr following dox administration.
See also Figure S1.
Ectopic Expression of ∆Np63 Is Sufficient to Drive Squamous Transcriptional Reprogramming in PDA Cell Lines
To evaluate lineage reprogramming in PDA, we used transcriptome analysis of PDA tumors from Bailey et al. (2016) to define gene expression signatures that discriminate squamous from progenitor cell identity in this disease (Figure 1E; Tables S2 and S3). The squamous-PDA identity signature includes known markers of the squamous cell lineage, including TP63, KRT5, KRT6A, S100A2, and PTHLH (Kaufmann et al., 2001; Shrestha et al., 1998; Kitazawa et al., 1991). We interrogated these signatures in RNA-seq data obtained from eight human PDA cell lines, which allowed us to rank each line based on its degree of resemblance to progenitor or squamous cell fates (Figure 1F). In accordance with the observations above in human tumors, TP63 mRNA and protein were only detected in the most squamous like PDA cell lines MIAPaca2 and BxPC3 (Figure 1F). We focused our subsequent analysis of endogenous TP63 in BxPC3 cells as they express the relevant ∆N isoforms, which is in contrast to MIAPaca2 cells, which instead express the tumor-suppressive transactivation domain (TA) isoform of TP63 (TAp63) (Figure S1J) (Yang et al., 1998). Using CRISPR-Cas9, we targeted TP63 in BxPC3 cells with two independent single guide RNAs (sgRNAs) and performed RNA-seq analysis. Gene set enrichment analysis (GSEA) (Subramanian et al., 2005) revealed that the loss of TP63 led to diminished expression of the squamous-PDA identity signature, which was further supported by an independent Gene Ontology analysis (Figures 1G and S1K). These gene expression changes were not limited to mRNA levels, as loss of KRT5/6 and S100A2 protein was also verified by western blotting (Figure 1H). In addition, inactivating TP63 also led to a paradoxical induction of the progenitor-PDA identity signature, suggesting an antagonistic relation between these two cell fates in PDA. These experiments suggest that the squamous transcriptional signature in PDA is enforced by the presence of TP63.
Having validated the causal relation between TP63 and the human PDA tumor-derived squamous transcriptional signature, we next evaluated whether ectopic expression of TP63 would be sufficient to endow PDA cell lines with the transcriptional profile of the squamous cell lineage. To this end, we initially lentivirally transduced the ∆Np63 cDNA into two progenitor-like PDA cell lines, SUIT2 and PATU8988S (Figure 1F; Table S4). RNA-seq analysis of these cells revealed that ∆Np63 enhanced the expression of squamous-PDA identity gene signatures in both settings (Figures 1I, S1L, and S1M), which we also verified by western blotting for squamous markers KRT5/6 and S100A2 (Figure 1J). Consistent with the findings above, ∆Np63 diminished the progenitor-PDA identity signature in both settings (Figures 1I and S1M). To investigate the sufficiency of ∆Np63 to install squamous transcriptional features across a broader panel of PDA cells in a more acute manner, we generated cell lines in which ∆Np63 expression was under the control of doxycycline (dox). The addition of dox led to robust activation of ∆Np63 expression (Figures 1K and S1N), and this was accompanied by potent activation of the squamous-PDA identity gene signature in all of the human cell lines tested, as well as PDA cells derived from KPC (Kras+/LSL-G12D; Trp53+/LSL-R172H; Pdx1-Cre) mice (Figure 1L). These results demonstrate the necessity and sufficiency of ∆Np63 to produce squamous-like features in PDA.
A Unique Enhancer Configuration Linked to ∆Np63 Genomic Occupancy in PDA
Prior work has shown that lineage transitions in PDA are mediated through alterations of the chromatin state and the associated landscape of active enhancer elements (Diaferia et al., 2016; McDonald et al., 2017; Roe et al., 2017). However, it has yet to be determined whether a distinct enhancer-chromatin configuration exists in squamous versus progenitor subtypes of PDA. To address this, we performed chromatin immunoprecipitation sequencing (ChIP-seq) analysis in 10 human cell lines or organoids representing PDA or normal pancreatic ducts to map the genome-wide pattern of histone H3 lysine 27 acetylation (H3K27ac), which is a covalent modification that demarcates active cis-regulatory elements (Rada-Iglesias et al., 2011). These cultures include PDAs that express TP63 and other squamous lineage markers, including the TAp63-expressing MIAPaca2 cells and two ∆Np63-expressing PDAs (BxPC3 cells and the hF3 organoid), whereas the other cultures express the progenitor-PDA identity signature (Figures 1F and S2A). An unsupervised clustering analysis of the global pattern of H3K27ac enrichment across the 10 cultures revealed three major groups (Figures 2A and S2B). The most progenitor-like samples formed two distinct clusters: one containing PATU8988S, hT85, and the two normal ductal organoids, and the other containing AsPC1, HPAFII, and SUIT2 cells. We found that the two ∆Np63-expressing squamous-like cultures (BxPC3 and hF3) formed a distinct cluster, suggesting a unique enhancer-chromatin configuration linked to this cell fate (Figure 2A). Of note, the TAp63-expressing MIAPaca2 cell line did not cluster together with the two ∆Np63-expressing cultures, indicating that this cell line is epigenetically distinct (Figure S2B).
Figure 2. A Unique Enhancer Landscape Linked to ∆Np63 Occupancy in PDA.
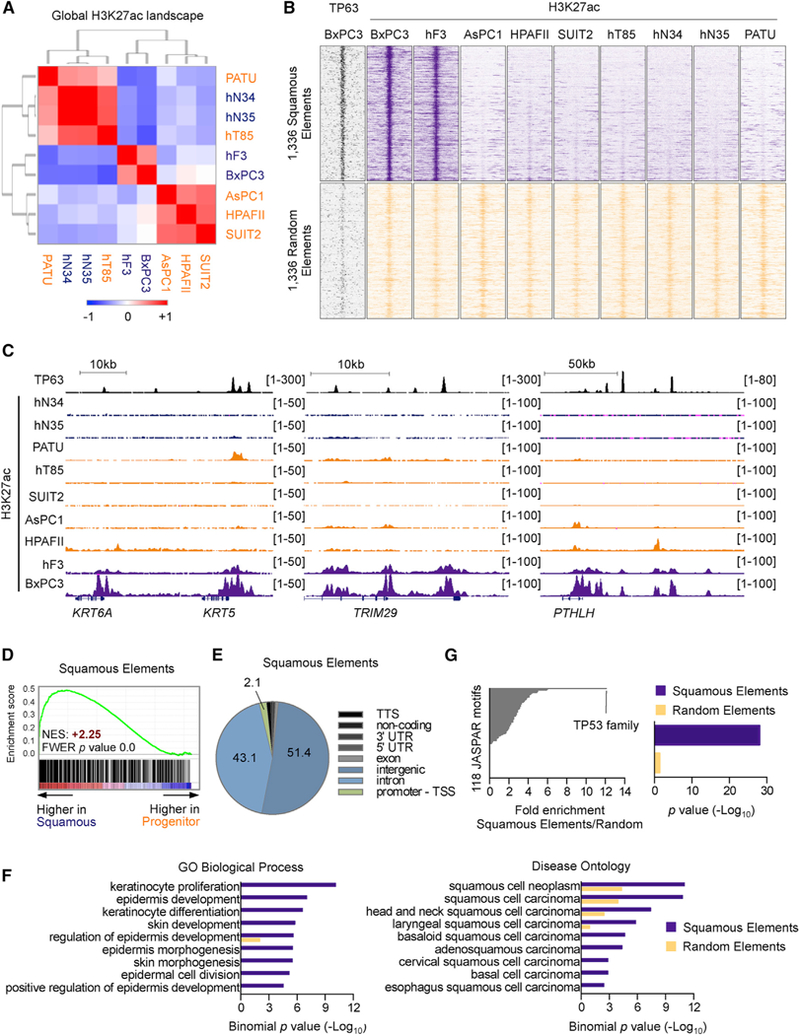
(A) Heatmap representation of unsupervised hierarchical clustering of nine human cell lines or organoids representing PDA or normal pancreatic ducts based on H3K27ac occupancy at total H3K27ac ChIP-seq peaks. Scale bar indicates Pearson correlation coefficient. Normal organoids: hN34, hN35; PDA organoids: hF3, hT85; PATU: PATU8988S.
(B) ChIP-seq density plots of TP63 and H3K27ac enrichments at squamous elements (top) or a set of 1,336 control H3K27ac regions (bottom) in the indicated cell lines. Each row represents a 10-kb interval centered on the midpoint of each H3K27ac peak.
(C) ChIP-seq profiles of TP63 (top track) and H3K27ac at representative squamous elements close to KRT5 and KRT6A (left), TRIM29 (middle), and PTHLH (right).
(D) GSEA plots evaluating the relative expression of genes proximal to squamous elements in squamous or progenitor patient samples from the study by Bailey et al. (2016). See also Table S5.
(E) Pie chart showing the genomic distribution of squamous elements according to annotation of H3K27ac peaks by HOMER. TTS, transcription termination site; TSS, transcription start site.
(F) Ontology analysis of genes located nearest to squamous elements versus control elements using GREAT. Gene Ontology (GO) terms related to biological process (left) and disease ontology (right) are shown.
(G) Representation of motifs enriched at squamous elements versus control elements using TRAP. Human promoters were used as the comparison library. Left: fold change in p value. The TP53 position weight matrix is represented as TP53 family motif. Right: enrichment of the TP53 motif at squamous elements and control elements as determined by p value.
See also Figure S2.
We next extracted the subset of H3K27ac-enriched regions that correlated with the BxPC3 and hF3 cell cluster, which identified 1,336 regions that we termed ‘‘squamous elements’’ (Figures 2B and 2C; Table S5). Squamous elements were almost entirely found at distal (non-promoter) sites and were located near genes that were preferentially expressed in the squamous subtype of PDA, suggesting that they represent enhancer elements (Figures 2D and 2E). In addition, an unbiased ontology analysis of genes located near these elements confirmed their association with the normal and neoplastic squamous lineage (e.g., epidermis development, squamous cell carcinoma) (Figure 2F). KRT5/6, TRIM29, and PTHLH are examples of squamous lineage genes located in proximity to squamous elements (Figure 2C). These data complement prior transcriptional observations (Bailey et al., 2016) by suggesting that a subset of PDA tumors display an enhancer landscape resembling the squamous cell lineage.
We next investigated the causal role of TP63 in activating squamous elements in the context of PDA. Using a TF affinity prediction (TRAP) motif enrichment analysis (Thomas-Chollier et al., 2011), we identified a motif recognized by TP63 as the most enriched sequence within the entire group of squamous elements (Figure 2G) (Yang et al., 1998). This finding led us to perform ChIP-seq analysis of endogenous TP63 in BxPC3 cells, which revealed pervasive TP63 occupancy at squamous elements. In contrast, we observed much lower levels of TP63 occupancy at a control set of H3K27ac-enriched locations (Figures 2B, 2C, S2C, and S2D). These findings indicate that squamous elements are linked to the occupancy of TP63 in the squamous-like subtype of PDA.
Having established a link between TP63 and squamous elements in PDA, we next evaluated the functional requirement of TP63 to activate these cis-regulatory elements. We used ChIP-seq to profile H3K27ac in BxPC3-Cas9 cells following acute transduction with TP63 sgRNAs (Figure S3A). This analysis revealed a selective reduction in H3K27ac at squamous elements, whereas the levels of this histone mark were unchanged at control locations (Figures 3A and 3B). To complement this loss-of-function experiment, we next evaluated whether expression of TP63 would be sufficient to activate squamous elements. To this end, we performed ChIP-seq analysis in control or ∆Np63-expressing SUIT2 cells to profile the impact on the enhancer landscape. While parental SUIT2 cells possess background levels of H3K27ac enrichment at squamous elements, introducing ∆Np63 led to a selective induction of H3K27ac at these locations, which now resembled the enhancer configuration observed in hF3 and BxPC-3 cells that possess endogenous ∆Np63 expression (Figures 3C, 3D, and S3B). To further investigate the sufficiency of ∆Np63 to install squamous enhancers across a broader panel of PDA cells, we performed ChIP-seq analysis of H3K27ac enrichment following dox-inducible expression of ∆Np63 in the four most progenitor-like human PDA cell lines. In each cell line tested, acute induction of ∆Np63 produced potent and selective acetylation of squamous elements (Figures 3E and S3C). Together with the transcriptional profiling results above, these findings indicate that toggling the function of ∆Np63 allows for the experimental manipulation of the enhancer landscape that underlies the squamous subtype of PDA.
Figure 3. ∆Np63 Expression Is Sufficient to Install and Maintain a Squamous Enhancer Landscape in PDA.
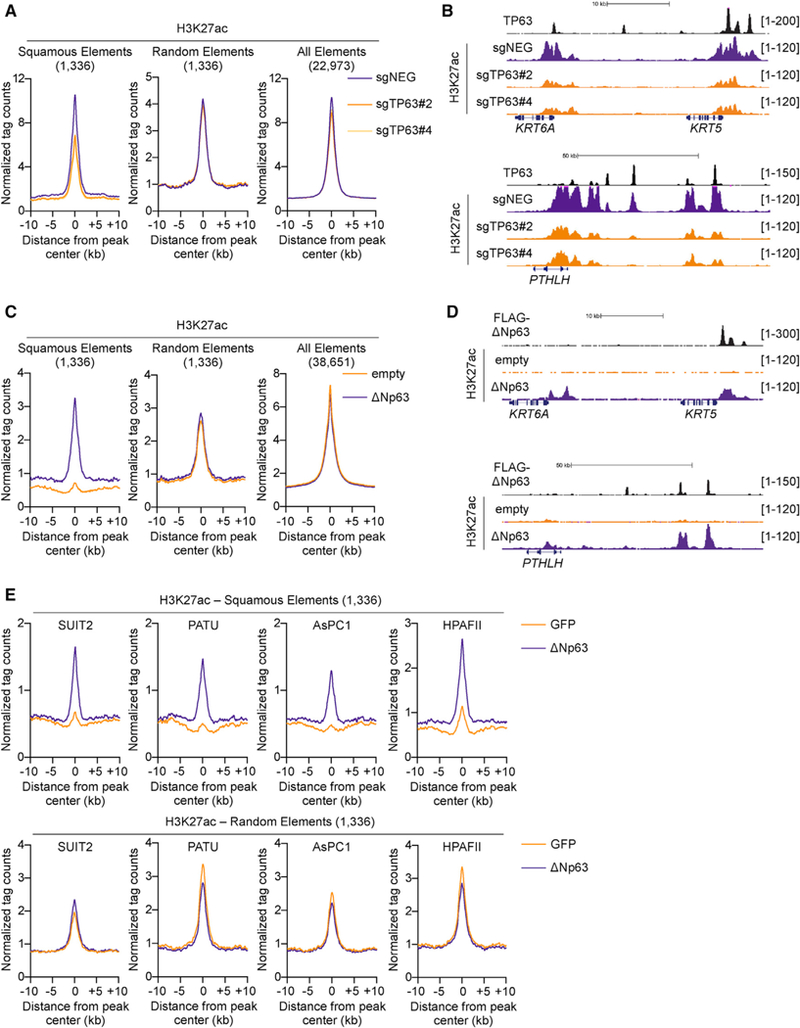
(A and B) TP63 knockout in BxPC3 cells and H3K27ac ChIP-seq analysis. (A) Metagene representation of H3K27ac signal in squamous elements (left), random control elements (middle), and all of the H3K27ac elements (right) in TP63 knockout and control cells. (B) ChIP-seq profiles of TP63 (top track) and H3K27ac at representative squamous elements close to KRT5 and KRT6A (top) and PTHLH (bottom). BxPC3-Cas9 cells were cross-linked and prepared for ChIP-seq analysis on day 5 post-infection, 3 days following G418 selection, with two independent TP63 or control sgRNAs (sgNEGs).
(C and D) ∆Np63 expression in SUIT2 cells and H3K27ac ChIP-seq analysis. (C) Metagene representation of H3K27ac signal in squamous elements (left), random control elements (middle), and all of the H3K27ac elements (right) in SUIT2 cells expressing ∆Np63 or control cells. (D) ChIP-seq profiles of ectopically expressed FLAG-tagged TP63 (top track) and H3K27ac at representative squamous elements close to KRT5 and KRT6A (top) and PTHLH (bottom). SUIT2 cells were cross-linked and prepared for ChIP-seq analysis on day 7 post-infection, 5 days post-G418 selection.
(E) Metagene representation of H3K27ac signal in squamous elements (top) and random control elements (bottom) in the indicated progenitor-like PDA cells following dox-inducible expression of ∆Np63 or GFP as a control. Cells were cross-linked and prepared for ChIP-seq analysis 48 hr following dox administration.
See also Figure S3.
Phenotypic Consequences of ∆Np63-Mediated Enhancer Reprogramming
We reasoned that the phenotypic characterization of SUIT2 cell lines transduced with ∆Np63 provided an ideal system for probing the functional significance of this enhancer reprogramming event in this disease. Under tissue culture monolayer conditions, we found that expression of ∆Np63 led to a reduced rate of SUIT2 cell proliferation, but enhanced cell motility in a scratch-wound assay (Figures 4A and 4B). In three-dimensional growth assay conditions in media supplemented with Matrigel (Corning Life Sciences), ∆Np63-expressing SUIT2 cells formed fewer colonies than control cells; however, the colonies that formed were significantly larger and possessed more invasive projections (Figures 4C and S4A). These findings suggested that ∆Np63 expression alters the growth and invasive characteristics of PDA cells in vitro.
Figure 4. Phenotypic Consequences of ∆Np63-mediated Enhancer Reprogramming.
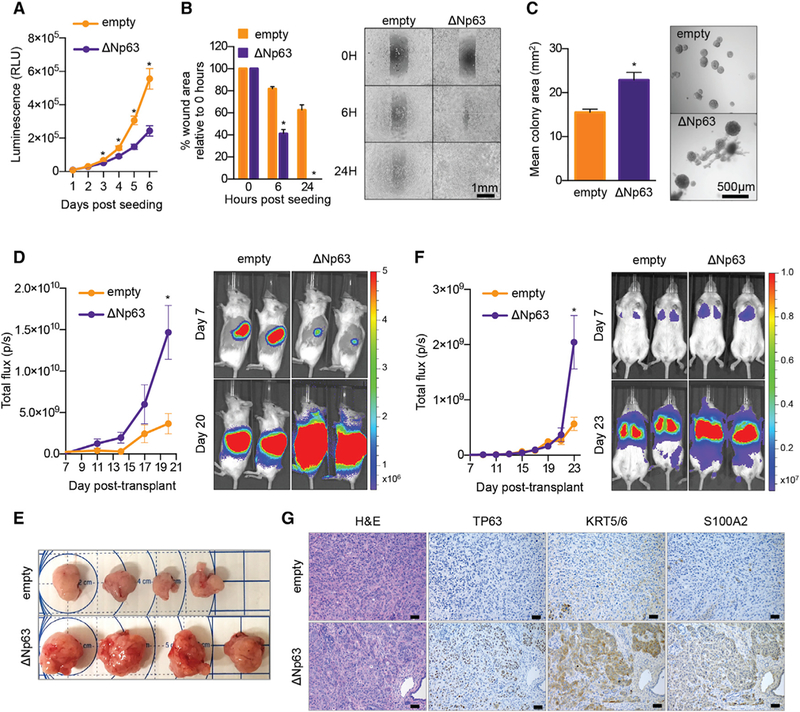
(A–C) In vitro consequences of ∆Np63-mediated squamous lineage reprogramming. SUIT2 cells were infected with ∆Np63 cDNA or an empty vector and assayed on day 7 post-transduction, day 5 post-G418 selection. (A) Line graph showing in vitro cell growth as determined by CellTiter-Glo (Promega) assay. Means ±SEMs are shown. n = 3. (B) Bar chart (left) showing quantification of scratch assays at the indicated time points post-seeding, and representative images are shown (right). Means + SEMs are shown. n = 3. (C) Bar chart (left) showing quantification of colony size in three-dimensional (3D) Matrigel colony formation assays on day 7 post-plating, day 14 post-viral transduction. Colony size was measured using ImageJ software (NIH). Means + SEMs are shown. n = 3. Representative images at day 7 are shown (right).
(D–G) In vivo consequences of ∆Np63-mediated squamous lineage reprogramming. SUIT2 cells harboring a luciferase transgene were infected with ∆Np63 cDNA or an empty vector and transplanted on day 5 post-viral transduction, day 3 post-G418 selection. (D) Line graph (left) shows quantification of the bioluminescence signal following orthotopic injection of 50,000 cells to the pancreas of NSG mice. Means ± SEMs are shown. Mice were imaged on days 7, 11, 14, 17, and 20 post-transplantation, and representative images are shown (right). n = 4 mice per group. (E) Bright-field images of tumors removed from mice shown in (D) on day 21 post-transplantation. (F) Line graph (left) shows quantification of bioluminescence signal following injection of 100,000 cells via the tail vein of NSG mice. Means ± SEMs are shown. Mice were imaged every 2 days from days 7 to 23 post-transplantation, and representative images are shown (right panel). n = 5 mice per group. Scale bar indicates luminescence signal. (G) Representative H&E (left) or immunohistochemical staining for the indicated proteins of tumor samples from (E). Scale bar indicates 50 μm. *p < 0.001 by two-way ANOVA with Sidak’s test for multiple comparisons.
See also Figure S4.
To extend these findings into the more relevant in vivo environment, we transplanted the ∆Np63-reprogrammed or control SUIT2 cells harboring a luciferase transgene into the pancreas of immunodeficient mice and monitored tumor progression using bioluminescent imaging. Following transplantation of equal numbers of cells, we found at initial time points that ∆Np63-expressing SUIT2 cells displayed less efficient engraftment levels in comparison to their control counterparts, which is in accordance with experiments performed in vitro (Figures 4D and S4B). However, the ∆Np63-expressing cells proceeded to expand more rapidly compared to controls and gave rise to significantly larger tumors at the endpoint of the experiment (Figures 4D and 4E). When injected into the tail vein of mice, ∆Np63-expressing cells colonized the lung parenchyma with similar kinetics to control mice, but formed larger metastatic lesions at the terminal endpoint of the experiment (Figures 4F and S4C). Histological examination of the primary tumors revealed that ∆Np63 expression gave rise to poorly differentiated tumors, and immunohistochemical staining confirmed the upregulation of squamous lineage markers (Figure 4G). These data suggest that enhancer reprogramming imposed by ∆Np63 confers enhanced growth characteristics to PDA cells in vivo in both primary and metastatic tissue contexts.
Squamous PDA Cells Become Addicted to ∆Np63
The findings above led us to investigate whether squamous PDA cells become addicted to ∆Np63 to sustain their growth potential. Using CRISPR-Cas9 competition-based proliferation assays evaluating the effects of individual sgRNAs, we validated that TP63 is essential for the growth of BxPC3 cells, but dispensable in other PDA contexts (Figures 5A, S5A, and S5B). To rule out any CRISPR-induced artifacts, we also targeted TP63 in BxPC3 cells using small hairpin RNAs (shRNAs) and observed a similar loss of proliferative potential and highly concordant gene expression changes to those seen following TP63 inactivation with sgRNAs (Figures S5C–S5F). Moreover, knock down of TP63 in the hF3 PDA organoid sample also resulted in a growth arrest and suppression of the squamous-PDA identity signature (Figures 5B, 5C, and S5G). The growth arrest phenotype in BxPC3 cells could be rescued by expressing a CRISPR-resistant cDNA encoding ∆Np63, with the degree of rescue correlating with the levels of reconstituted ∆Np63 protein (Figures 5D, 5E, and S5H). We next evaluated the impact of ∆Np63 inactivation on PDA growth in vivo by transducing BxPC3-Cas9-luciferase cells with TP63 sgRNAs before transplantation into the pancreas or the tail vein of immunodeficient mice. By monitoring tumor progression using bioluminescent imaging, we found that TP63 inactivation resulted in complete arrest of tumor growth when compared to control cells, both at the primary site and in the lung parenchyma (Figures 5F–5I and S5I). These results are complementary to our experiments in reprogrammed SUIT2 cells and suggest that squamous-like PDA tumors become addicted to ∆Np63 to sustain tumor growth in vivo.
Figure 5. ∆Np63 Is a Dependency in Squamous PDA Cells.
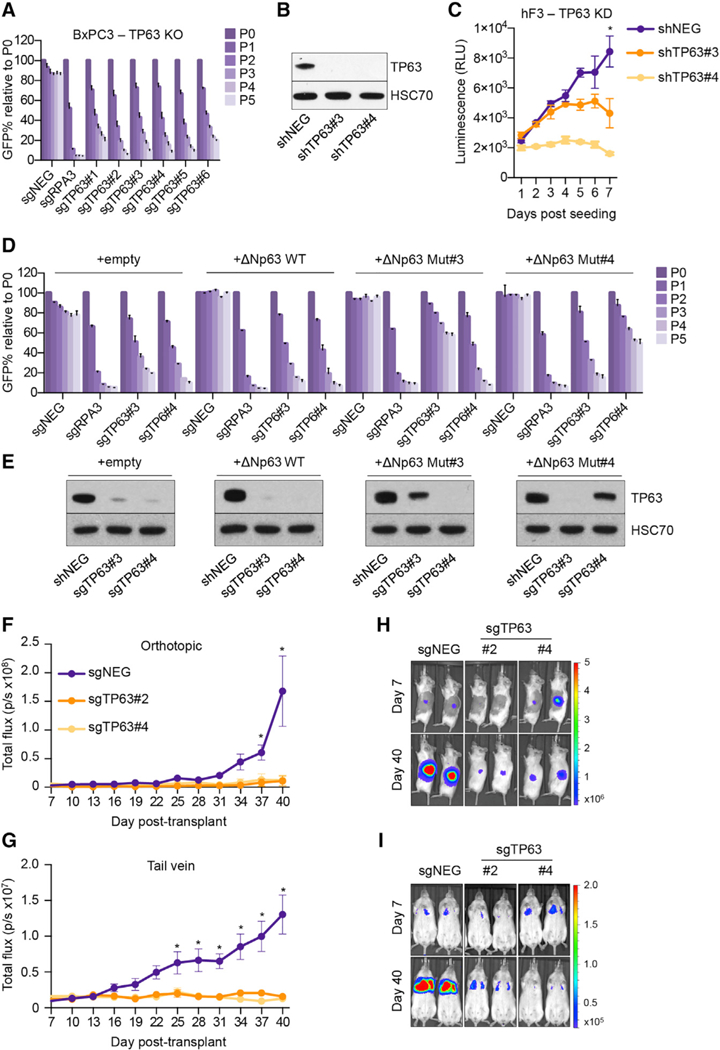
(A) Competition-based proliferation assay in BxPC3 cells following infection with the indicated sgRNAs linked to GFP. Means + SEMs are shown. n= 3.
(B and C) TP63 knockdown in hF3 organoids. (B) Representative western blot analysis for the indicated proteins in the indicated conditions. Whole-cell lysates were prepared on day 8 post-infection with shRNAs, 5 days post-selection with puro-mycin. (C) Line graph showing in vitro cell growth as determined by CellTiter-Glo assay following infection with the indicated shRNAs. Means ± SEMs are shown. n = 3. *p <0.01 by two-way ANOVA with Sidak’s test for multiple comparisons.
(D and E) TP63 sgRNA/cDNA rescue assay in BxPC3 cells. (D) Competition-based proliferation assay in BxPC3 cells stably expressing the indicated cDNA following infection with the indicated sgRNAs linked to GFP. Means + SEMs are shown. n = 3. (E) Representative western blot analysis for the indicated proteins in the indicated conditions. Whole-cell lysates were prepared on day 5 post-infection with sgRNAs; the GFP percentage was >95% in each condition for western blot analysis. ∆Np63 WT, wild-type ∆Np63; ∆Np63 Mut#3, ∆Np63 cDNA resistant to sgTP63#3; ∆Np63 Mut#4, ∆Np63 cDNA resistant to sgTP63#4.
(F and G) In vivo consequences of TP63 knockout. BxPC3-Cas9 cells expressing a luciferase transgene were infected with two independent TP63 or control (sgNEG) sgRNAs before transplantation on day 5 post-infection, 3 days post-G418 selection. Line graphs show quantification of bioluminescence signal following injection of 100,000 cells to the pancreas (F) or 250,000 cells via the tail vein (G) of NSG mice. Means ± SEMs are shown.
(H and I) Representative bioluminescence images at the indicated days post-transplant following injection of cells to the pancreas (H) or via the tail vein (I) of NSG mice. Scale bar indicates luminescence signal. n = 4–5 mice per group. *p <00.1 by two-way ANOVA with Sidak’s test for multiple comparisons.
See also Figure S5.
We next investigated which target genes within the ∆Np63-reprogrammed enhancer landscape may be relevant to the progression of PDA. For this purpose, we analyzed our collective RNA-seq and ChIP-seq datasets in search of high-confidence ∆Np63 target genes. By intersecting the genes downregulated following TP63 ablation in BxPC3 cells with the genes upregulated following ∆Np63 expression in SUIT2 cells, we recovered 63 candidate ∆Np63 targets. We reduced this list to 58 genes by requiring that a target gene be located near a peak of TP63 occupancy detected by ChIP-seq (Figure 6A; Table S6). As expected, these 58 genes were preferentially expressed in the squamous subtype of PDA and included the previously described squamous lineage genes KRT5, PTHLH, and S100A2 (Figure S6A). From a literature search, we note that many of the ∆Np63 target genes encode proteins that have been causally implicated in promoting tumor cell growth and cancer progression in prior studies, such as HRAS and CXCL8 (Grabocka et al., 2014; Young et al., 2013) (Figures 6B–6D; Table 1). Consistent with these observations, these genes are concordantly downregulated following TP63 knockdown in the hF3 PDA organoid (Figures S6B and S6C). We additionally found that MYC mRNA and protein were significantly downregulated following TP63 inactivation, which is in accord with the elevated level of the MYC transcriptional network in squamous-subtype PDA tumors (Bailey et al., 2016) (Figures S5E, S6D, and S6E). Our ChIP-seq analysis identified several TP63-occupied squamous elements at the MYC locus, which may account for TP63-mediated MYC regulation (Figure S6F). This analysis reveals a network of cancer-promoting ∆Np63 targets that are activated during enhancer reprogramming in squamous-subtype PDA.
Figure 6. The Core Circuitry of ∆Np63-Mediated Enhancer Reprogramming in Squamous PDA Cells.
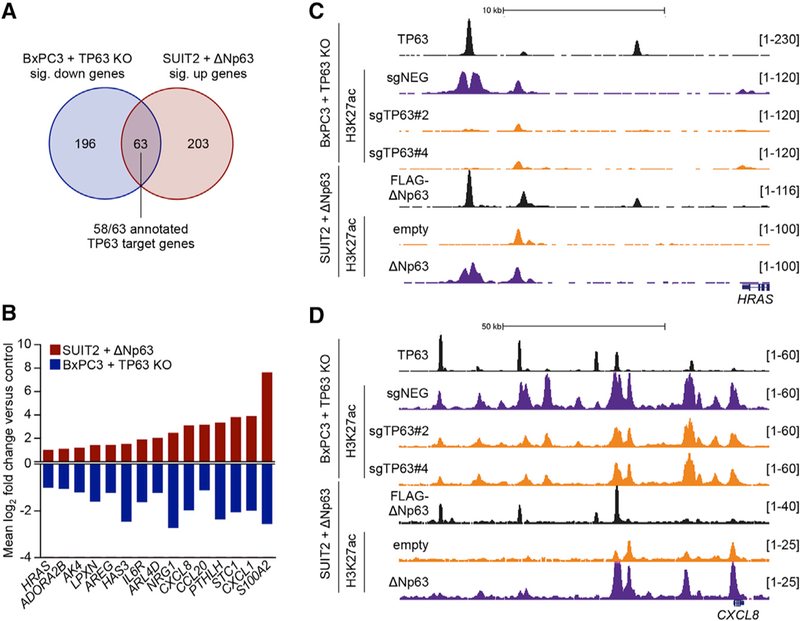
(A) Venn diagram showing the overlap of significantly downregulated genes in BxPC3-Cas9 cells and upregulated genes in SUIT2 cells following infection with sgRNAs targeting TP63 or expression of ∆Np63 cDNA, respectively (fold change >2, p < 0.01). See also Table S6.
(B) Bar graph showing the mean log2 fold change of example genes from (A). See also Table 1. (C and D) ChIP-seq profiles of TP63, FLAG-tagged ∆Np63, and H3K27ac at the ∆Np63 target genes HRAS (C) and CXCL8 (D) following TP63 knockout in BxPC3-Cas9 cells or expression of ∆Np63 in SUIT2 cells.
See also Figure S6.
Table 1.
∆Np63 Target Genes with Oncogenic Potential
| Putative ∆Np63 Target Gene | Oncogenic Phenotype | Reference |
|---|---|---|
| S100A2 | migration and metastasis | Bulk et al., 2009 |
| CXCL1 | tumor growth, tumor cell survival, angiogenesis, myeloid cell recruitment |
Acharyya et al., 2012 |
| STC1 | tumor growth, tumor cell survival, metastasis | Peñ a et al., 2013 |
| PTHLH | metastasis, tumor growth, tumor cell survival | Iguchi et al., 1996; Urosevic et al., 2014 |
| CCL20 | metastasis, myeloid cell recruitment, EMT | Ye et al., 2016 |
| CXCL8 | angiogenesis, tumor growth and migration, metastasis, myeloid cell recruitment |
Waugh and Wilson, 2008 |
| NRG1 | tumor growth | Sheng et al., 2010 |
| ARL4D | tumor cell migration | Li et al., 2007 |
| IL6R | tumor progression and inflammation | Hodge et al., 2005 |
| HAS3 | tumor growth, angiogenesis, ECM deposition, migration | Itano et al., 2002; Liu et al., 2001 |
| AREG | tumor growth, cell migration, chemoresistance | Peterson et al., 2015; Zhang et al., 2009 |
| LPXN | tumor progression | Kaulfuß et al., 2009 |
| AK4 | tumor invasion and metastasis | Jan et al., 2012 |
| ADORA2B | invasion, migration and metastasis | Desmet et al., 2013 |
| HRAS | tumor cell growth, survival, and maintenance | Grabocka et al., 2014; Young et al., 2013 |
ECM, extracellular matrix; EMT, epithelial-to-mesenchymal transition.
See also Figure 6.
DISCUSSION
Prior studies have shown that squamous lineage markers become aberrantly expressed in a subset of aggressive PDAs (Andricovich et al., 2018; Bailey et al., 2016; Morohoshi et al., 1983). Here, we have pursued the causal role of squamous transdifferentiation in PDA progression using an experimental approach that exploits the master regulator concept, which is classically defined by the ability of certain TFs to drive cell fate transitions by functioning at the apex of a gene regulatory network (Davis et al., 1987). The gain- and loss-of-function epigenomic analysis presented in this study validates ∆Np63 as a master regulator of the squamous identity in PDA, which is consistent with the known role of this TF in normal squamous epithelial tissues and in squamous cell carcinomas (Soares and Zhou, 2018). We have used the master regulator property of ∆Np63 to endow PDA cells with the enhancer landscape and transcriptional signature associated with squamous identity without the confounding effect of altering the tumor genotype. This approach leverages recent transcriptome analyses of human PDA to validate that ∆Np63-mediated reprogramming produced in cell lines faithfully recapitulates the transcriptional profile seen in human tumors (Bailey et al., 2016; The Cancer Genome Atlas Research Network, 2017). This approach allowed us to demonstrate that a ∆Np63-driven enhancer landscape promotes PDA progression in vivo.
Our study highlights the utility of enhancer profiling as a strategy for mapping cell fate transitions in cancer and for the validation of lineage reprogramming by master regulators in an experimental setting. In specific cancers, enhancer profiling has revealed novel tumor subtypes that reflect an alternative cell of origin (Lin et al., 2016). In pancreatic cancer, enhancer profiling has been used to provide insight into transdifferentiation mechanisms of cellular lineage. For example, prior work in cancer cell lines revealed an enhancer configuration established by endodermal lineage TFs (e.g., KLF5), which becomes extinguished in cell lines with mesenchymal features (Diaferia et al., 2016). We previously used a mouse organoid progression model of PDA to reveal the activation of an embryonic foregut enhancer landscape by FOXA1, which promotes disease progression and metastatic spread (Roe et al., 2017). However, neither of these prior studies focused on the squamous subtype of PDA, which has only recently been recognized as a common form of PDA with an exceptionally poor prognosis (Bailey et al., 2016). A major finding in our study is that massive alterations of the enhancer landscape occur upon acquiring a squamous identity, which strongly suggests that the previously described squamous transcriptional signature in PDA reflects a bona fide cell fate transition in this disease.
Our prior studies highlighted the role of TFs in driving the reorganization of enhancers and promoting disease progression and metastatic spread in PDA, identifying FOXA1 as a driver of this process (Roe et al., 2017). However, in contrast to FOXA1, which requires cooperating TFs to achieve effective enhancer activation in PDA, here, we demonstrate that ∆Np63 expression alone is sufficient to install squamous enhancer elements and promote aggressive disease characteristics in this disease. The powerful effects of ∆Np63 on the enhancer landscape of PDA cells are also reflected in their ensuing addiction to the continued expression of this TF, as well as an exceptionally poor prognosis in this group of PDA patients, which we did not observe to be the case for FOXA1 (Roe et al., 2017). Thus, although these studies highlight a common theme of enhancer reprogramming in driving disease progression in PDA, they also highlight that the functional and clinical outputs of this reprogramming event can be distinct and are determined by the master regulator TFs deregulated in this disease.
One unexpected result in our study is that ∆Np63 expression augments PDA tumor cell growth under in vivo conditions and in three-dimensional cultures, but not in two-dimensional monolayer conditions. This finding can be explained, as many of the ∆Np63 target genes identified in this study have been previously shown to drive migratory and invasive properties of tumor cells, such as HAS3 and S100A2 (Bulk et al., 2009; Itano et al., 2002). Moreover, a number of ∆Np63 target genes encode proteins that can modulate the tumor microenvironment. This includes the genes CXCL1, CXCL8, and CCL20, which encode pro-inflammatory cytokines that can drive tumor progression through non-cell-autonomous mechanisms, such as promoting angiogenesis and the recruitment of tumor-propagating myeloid cells (Acharyya et al., 2012; Waugh and Wilson, 2008; Ye et al., 2016). It is also noteworthy that some ∆Np63 target genes may have effects that reach beyond the local microenvironment. For example, the gene PTHLH encodes a secreted hormone that is implicated in hypercalcemia of malignancy and cachexia (Burtis et al., 1987; Iguchi et al., 1996; Kir et al., 2014; Urosevic et al., 2014). We hypothesize that ∆Np63-driven enhancer reprogramming and hijacking of the squamous lineage program provide an efficient means for PDA cells to acquire capabilities for sustained invasive growth into the tissue parenchyma of the pancreas and at distal sites. It may also play a systemic role during the course of disease progression.
Prior studies have implicated a role for ∆Np63 as an oncogene, such as in squamous cell carcinoma (Rocco et al., 2006). Diverse mechanisms have been proposed to explain the tumor-promoting function of ∆Np63, which include antagonism of p53, modulation of microRNAs, bypass of senescence, and enhanced cancer stem cell activity (Keyes et al., 2011; Memmi et al., 2015; Su et al., 2010; Yang et al., 1998). To our knowledge, our study is the first to demonstrate that ∆Np63 is sufficient to reprogram the enhancer landscape of PDA cells and confer properties of the squamous cell lineage, thus implicating squamous transdifferentiation in tumor progression. Of note, in vitro experiments performed using our dox-regulated system in SUIT2 cells, whereby ∆Np63 was transiently introduced and subsequently removed, suggest that the addiction to ∆Np63 does not occur immediately following its expression, but instead requires a longer period of transdifferentiation before the addiction ensues (data not shown). It is important to consider that the aberrant acquisition of a squamous identity in PDA occurs in the context of a highly mutated cancer genome, which includes oncogenic KRAS and inactivation of several tumor-suppressor genes, as well as within the complexity of the tumor microenvironment. Thus, it is likely that the genes activated through the mechanism of TP63-mediated enhancer reprogramming collaborate with the milieu of established genetic mutations within the context of a PDA cell to promote this disease.
The observation that squamous-like PDAs are enriched for mutations in specific tumor suppressors suggests that certain genotypes may be more permissive for the acquisition of a squamous-like identity in PDA (Andricovich et al., 2018; Bailey et al., 2016). A recent study described a KrasG12D/Kdm6a−/− mouse model of PDA that forms tumors that express TP63 (Andricovich et al., 2018). Because KDM6A mutations are enriched in squamous-like human PDAs, the Andricovich et al. (2018) study establishes how specific genotypes can predispose tumor cells to acquire squamous attributes. However, mutations in KDM6A (and other related chromatin regulators) only account for less than half of the squamous PDA tumors (Bailey et al., 2016). This suggests the existence of additional mechanisms that activate TP63 expression in PDA. Prior work has implicated genotoxic stress, hypoxia, Notch ligands, and Hedgehog signals as regulating TP63 expression, suggesting a possibility that non-genetic mechanisms in the pancreas microenvironment may also contribute to the squamous lineage transition in PDA (Li et al., 2008; Petitjean et al., 2008; Tadeu and Horsley, 2013; Xi et al., 2017). Moreover, it also possible that other TFs participate in the acquisition of squamous cell characteristics in PDA. For example, SOX2 can function as a lineage oncogene in squamous cell carcinomas (Bass et al., 2009), and MYC amplifications have been correlated with adenosquamous variants of pancreatic cancer (Witkiewicz et al., 2015). While our findings suggest a functional link between MYC and ∆Np63, we did not find evidence for a role for SOX2 in squamous transdifferentiation in PDA (data not shown). Nevertheless, our findings and the work of Andricovich et al. (2018) provide complementary evidence in human and murine systems, respectively, to implicate the acquisition of a squamous-like identity as a contributor to PDA progression.
A major challenge in implementing cancer therapy is in identifying tumor biomarkers that predict exceptional responses. In this study, we have shown that introducing ∆Np63 into a PDA cell line is sufficient to reprogram the epigenome and cell identity to one that resembles human squamous-like PDA tumors. This approach provides a powerful isogenic cell system for investigating unique vulnerabilities linked with the squamous subtype of PDA. For example, domain-focused CRISPR screening could be applied to control and ∆Np63-expressing SUIT2 cells to discover actionable targets that are linked with this cell fate transition (Shi et al., 2015). More broadly, our study calls attention to the use of master regulator TFs as predictive biomarkers for targeted therapies, thus implicating isogenic-reprogrammed cell lines as a powerful tool for revealing dependencies linked with specific cellular states.
STAR★METHODS
KEY RESOURCES TABLE
| REAGENT or RESOURCE | SOURCE | IDENTIFIER |
|---|---|---|
| Antibodies | ||
| Rabbit polyclonal anti-TP63 (for WB, IHC and ChIP) | Cell Signaling | Cat# 39692; RRID: N/A |
| Rabbit polyclonal anti-KRT5/6 (for WB) | Millipore | Cat# MAB1620; RRID: AB_94292 |
| Rabbit polyclonal anti-S100A2 (for WB and HIC) | Abcam | Cat# ab109494; RRID: AB_10859000 |
| ImmPRESS Horse-Anti-Rabbit Ig Reagent antibody (IHC) |
Vector | Cat# MP-7401; RRID: AB_2336529 |
| ImmPRESS Horse-Anti-Mouse Ig Reagent antibody (IHC) |
Vector | Cat# MP-7402; RRID: AB_2336528 |
| Mouse monoclonal anti-HSC70 (for WB) | Santa Cruz Biotechnology | Cat# sc-7298; RRID: AB_627761 |
| Rabbit polyclonal anti-H3K27ac (for ChIP) | Abcam | Cat# ab4729; RRID: AB_2118291 |
| Rabbit polyclonal anti-MYC (for ChIP) | Abcam | Cat# ab32072; RRID: AB_731658 |
| Mouse monoclonal anti-FLAG (for ChIP) | Sigma-Aldrich | Cat# F1804; RRID: AB_262044 |
| Chemicals, Peptides, and Recombinant Proteins | ||
| 10% Neutral Buffered Formalin | Thermal Fisher Scientific | Cat# 22–110-869 |
| 2-Mercaptoethanol | Sigma-Aldrich | Cat# M6250 |
| Isopropanol | Sigma-Aldrich | Cat# 190674 |
| 2× Laemmli Sample Buffer | BIO-RAD | Cat# 1610737 |
| Chloroform | Sigma-Aldrich | Cat# 288306 |
| DNase I (RNase-free) | New England Biolabs | Cat# M0303S |
| Formaldehyde, 37% solution | Avantor | Cat# 2106–01 |
| Glycine | Thermal Fisher Scientific | Cat# BP381–1 |
| Penicillin/Streptomycin | Thermal Fisher Scientific | Cat# 15140122 |
| Polybrene | EMD Millipore | Cat# TR-1003-G |
| Polyethylenimine, Linear, MW 25,000 (PEI 25000) | Polysciences | Cat# 23966–1 |
| TRIzol Reagent | Thermo Fisher | Cat# 15596018 |
| D-Luciferin | Goldbio | Cat# 115144–35-9 |
| Geneticin Selective Antibiotic (G-418 Sulfate) | Thermal Fisher Scientific | Cat# 10131035 |
| Puromycin dihydrochloride | Sigma-Aldrich | Cat# P8833 |
| Blasticidin S HCl | Thermal Fisher Scientific | Cat# A1113903 |
| DMEM with 4.5 g/L glucose, L-glutamine & sodium pyruvate |
Cellgro | Cat# 10–013-CV |
| Advanced DMEM/F12 | Life Technologies | Cat# 12634–028 |
| RPMI 1640 w/L-glutamine | Fisher Scientific | Cat# MT10040CV |
| HEPES | Life Technologies | Cat# 15630–130 |
| Glutamax | Life Technologies | Cat# 35050–079 |
| AB3–01 | Tocris Bioscience | Cat# 2939 |
| hEGF | PeproTech | Cat# AF-100–15 |
| mNoggin | PeproTech | Cat# 250–38 |
| hFGF10 | PeproTech | Cat# 100–26 |
| hGastrin | Tocris Bioscience | Cat# 3006 |
| N-acetylcysteine | Sigma-Aldrich | Cat# A9165–5G |
| Nicotinamide | Sigma-Aldrich | Cat# N0636–100G |
| PGE2 | Tocris Bioscience | Cat# 2296 |
| B27 supplement | Life Technologies | Cat# 17504044 |
| R-Spondin 1 Cells | Trevigen | Cat# 3710–001-K |
| Afamin/Wnt3A conditioned media | Osaka University | N/A |
| T4 DNA Polymerase | New England Biolabs | Cat# M0203L |
| DNA Polymerase I, Large (Klenow) Fragment | New England Biolabs | Cat# M0201L |
| T4 polynucleotide kinase | New England Biolabs | Cat# M0201L |
| Klenow Fragment (30-50 exo-) | New England Biolabs | Cat# M0212L |
| ImmPACT DAB peroxidase (HRP) substrate | Vector | Cat# SK-4105 |
| Doxycycline hyclate | Sigma-Aldrich | Cat# D9891 |
| Critical Commercial Assays | ||
| TruSeq RNA Sample Prep Kit v2 | Illumina | Cat# RS-122–2001 |
| TruSeq ChIP Sample Prep Kit | Illumina | Cat# IP-202–1012 |
| Power SYBR Green Master Mix | Thermo Fisher Scientific | Cat# 4368577 |
| qScript cDNA SuperMix | Quanta bio | Cat# 95048–500 |
| SuperScript II Reverse Transcriptase | Thermo Fisher | Cat# 18064014 |
| Agencourt AMPure XP | Beckman Coulter | Cat# A63880 |
| Dynabeads Protein A | Thermal Fisher Scientific | Cat# 10002D |
| Dynabeads Protein G | Thermal Fisher Scientific | Cat# 10003D |
| MiniElute PCR Purification Kit | QIAGEN | Cat# 28004 |
| QIAquick Gel Extraction Kit | QIAGEN | Cat# 28704 |
| Agilent High Sensitivity DNA Kit | Agilent Genomics | Cat# 5067–4626 |
| CellTiter-Glo Luminescent Cell Viability Assay | Promega | G7570 |
| Corning Matrigel Growth Factor Reduced (GFR) Basement Membrane Matrix, *LDEV-free |
Life Sciences | Cat# 354230 |
| Deposited Data | ||
| ChIP-seq and RNA-seq data | This paper | GEO: GSE115463 |
| PDAC patients microarray data | (Moffitt et al., 2015) | GEO: GSE71729 |
| Experimental Models: Cell Lines/Organoids | ||
| Human PDA cell line PATU8988S | DSMZ | Cat# ACC 204 |
| Human PDA cell line HPAFII | ATCC | Cat# CRL-1997 |
| Human PDA cell line AsPC1 | ATCC | Cat# CRL-1682 |
| Human PDA cell line SUIT2 | JCRB | JCRB1094 |
| Human PDA cell line CFPAC1 | ATCC | Cat# CRL-1918 |
| Human PDA cell line PANC1 | ATCC | Cat# CRL-1469 |
| Human PDA cell line MIAPaca2 | ATCC | Cat# CRL-1420 |
| Human PDA cell line BxPC3 | ATCC | Cat# CRL-1687 |
| Human HEK293T | CSHL | N/A |
| Human normal pancreas organoid hN30 | (Tiriac et al., 2018) | N/A |
| Human normal pancreas organoid hN34 | (Tiriac et al., 2018) | N/A |
| Human normal pancreas organoid hN35 | (Tiriac et al., 2018) | N/A |
| Human PDA organoid hF3 | (Tiriac et al., 2018) | N/A |
| Human PDA organoid hT85 | (Tiriac et al., 2018) | N/A |
| Human PDA organoid hF2 | (Tiriac et al., 2018) | N/A |
| Human PDA organoid hT3 | (Tiriac et al., 2018) | N/A |
| Murine PDA cell line FC1199 | David Tuveson | N/A |
| Murine PDA cell line FC1242 | David Tuveson | N/A |
| Murine PDA cell line FC1245 | David Tuveson | N/A |
| Experimental Models: Organisms/Strains | ||
| Mouse: NSG | The Jackson Laboratory | Stock # 005557 |
| Oligonucleotides | ||
| sgRNA/shRNA/RT-PCR sequences see Table S7 | This paper | N/A |
| Recombinant DNA | ||
| deltaNp63alpha-FLAG | (Chatterjee et al., 2008) | Addgene plasmid #26979 |
| LentiV-∆Np63-FLAG-neo | This paper | N/A |
| Lenti-luciferase-blast | This paper | N/A |
| LentiV-Cas9-puro | (Tarumoto et al., 2018) | Addgene plasmid #108100 |
| LRNG (Lenti_sgRNA_EFS_Neo-IRES-GFP) | (Roe et al., 2017) | N/A |
| LRG2.1 | (Tarumoto et al., 2018) | Addgene plasmid #108098 |
| LEPG (LTR-miRE-shRNA-PGK-puro-IRES-GFP) | (Fellmann et al., 2013) | Addgene plasmid #111160 |
| psPAX2 | N/A | Addgene plasmid #12260 |
| TREtight-∆Np63-EFS-rtTA-P2A-Puro | This paper | N/A |
| TREtight-GFP-EFS-rtTA-P2A-Puro | This paper | N/A |
| Software and Algorithms | ||
| MACS 1.4.2 | (Feng et al., 2012) | http://liulab.dfci.harvard.edu/MACS/00README.html |
| SAMtools 1.4 | (Li et al., 2009) | http://samtools.sourceforge.net |
| BEDTools 2.22.1 | (Quinlan and Hall, 2010) | https://bedtools.readthedocs.io/en/latest/ |
| TRAP | (Thomas-Chollier et al., 2011) | http://trap.molgen.mpg.de/cgi-bin/home.cgi/home.cgi |
| HOMER v4.9 | (Heinz et al., 2010) | http://homer.ucsd.edu/homer/ |
| HISAT2 | (Kim et al., 2015) | http://ccb.jhu.edu/software/hisat2/index.shtml |
| Cufflinks | (Trapnell et al., 2010) | http://cole-trapnell-lab.github.io/cufflinks/ |
| Morpheus | Broad Institute | https://software.broadinstitute.org/morpheus/ |
| UCSC Genome Browser | UCSC | http://genome.ucsc.edu |
| GSEA | (Subramanian et al., 2005) | http://software.broadinstitute.org/gsea/index.jsp |
| Bowtie2 | (Langmead and Salzberg, 2012) | http://bowtie-bio.sourceforge.net/bowtie2/index.shtml |
| GREAT | (McLean et al., 2010) | http://bejerano.stanford.edu/great/public/html/ |
| ImageJ | NIH | https://imagej.nih.gov/ij/ |
| GraphPad PRISM 6 | GraphPad Software | https://www.graphpad.com/scientific-software/prism/ |
| Living Image Software | PerkinElmer | http://www.perkinelmer.com/lab-products-and-services/resources/in-vivo-imaging-software-downloads.html#LivingImage |
| TreeView | (Saldanha, 2004) | http://jtreeview.sourceforge.net |
| CBioPortal | (Cerami et al., 2012) | http://www.cbioportal.org |
| The International Cancer Genome Consortium | ICGC | https://dcc.icgc.org |
| GTExPortal | (GTEx Consortium, 2015) | http://gtexportal.org/home/ |
CONTACT FOR REAGENT AND RESOURCE SHARING
Further information and requests for resources and reagents should be directed to and will be fulfilled by the Lead Contact, Christopher Vakoc (vakoc@cshl.edu).
EXPERIMENTAL MODEL AND SUBJECT DETAILS
Mice
All animal procedures and studies were approved by the Cold Spring Harbor Laboratory Animal Care and Use Committee in accordance to IACUC. Six- to ten-week old female NSG mice used for transplant studies were purchased from the Jackson Laboratory.
Cell Lines
PATU8988S, HPAFII, AsPC1, SUIT2, CFPAC1, PANC1, MIAPaca2 and BxPC3 cells were cultured in RPMI supplemented with 10% FBS (R10). FC1199, FC1242 and FC245 were derived from KPC (Kras+/LSL-G12D; Trp53+/LSL-R172H; Pdx1-Cre) mice and cultured in DMEM with 10% FBS. hN30, N34, hN35, hT85, hF2 and hF3 (human organoid samples) were established and cultured as described in detail elsewhere (Tiriac et al., 2018). Briefly, cells were plated with Matrigel and grown in Human complete Feeding Medium (hCPLT): advanced DMEM/F12, HEPES 10mM, Glutamax 1X, A83–01 500nM, hEGF 50ng/mL, mNoggin 100ng/mL, hFGF10 100ng/mL, hGastrin I 0.01 mM, N-acetylcysteine 1.25mM, Nicotinamide 10mM, PGE2 1 μM, B27 supplement 1X final, R-spondin1 conditioned media 10% final, Afamin/Wnt3A conditioned media 50% final. HEK293T cells were cultured in DMEM with 10% FBS. Penicillin/streptomycin were added to all cell culture. HEK293T cells were used for packaging lentivirus using polyethylenimine (PEI)-mediated transfection.
METHOD DETAILS
Plasmid Construction
For generation of the LentiV-∆Np63-neo vector, ∆Np63 cDNA from the detlaNp63-FLAG vector (addgene #26979) (Chatterjee et al., 2008) was subcloned to LentiV-Cas9-puro vector (addgene #108100) (Tarumoto et al., 2018) in place of Cas9 and the puromycin resistance cassette was replaced with a neomycin resistance cassette. For the LentiV-neo empty vector, Cas9 was replaced with a 3*FLAG sequence (Xu et al., 2018). For generation of the LentiV-∆Np63-FLAG-neo vector, a 3*FLAG sequence was added to the C terminus of ∆Np63 cDNA in the LentiV-∆Np63-neo vector. To generate Lenti-luciferase-blast vector the luciferase transgene from Lenti-luciferase-P2A-Neo vector (addgene #105621) to a vector with blasticidin resistance. For experiments involving dox-regulated expression, cells were infected with ∆Np63 or GFP cDNA in the dox-regulated vector YXP (TREtight-cDNA-EFS-rtTA-P2A-Puro) and selected with puromycin (3 μg/ml).
Lentiviral Production and Infection
Lentivirus was produced in HEK293T cells by transfecting plasmids and packaging plasmids (VSVG and psPAX2) using PEI. Media was replaced with R10 media 6–8 hours following transfection and lentivirus-containing supernatant was subsequently collected every 12 hours for 48 hours prior to filtration through a 0.45 mm filter. For infection of cells, cell suspensions were mixed with lentiviral-containing supernatant supplemented with polybreane to a final concentration of 4 μg/ml. Cells were plated in tissue culture plates of the appropriate size and lentiviral-containing supernatant was replaced with fresh media after an incubation period of 6–8 hours.
In Vitro Phenotypic Assays
SUIT2 cells were first infected with ∆Np63 cDNA in LentiV-∆Np63-neo vector or the empty vector as a control. Two days post infection, transduced cells were selected with 1 mg/ml of G418 and on day seven post infection, cells were counted by trypan blue exclusion and used for the assays described below.
For cell growth assays, 200 cells were plated in quadruplicate in 20 μL of media in each well of a 384-well plate. Quantification of viable cells was determined every 24 hours post seeding for a total of six days using CellTiterGlo Luminescent Cell Viability Assay kit (Promega) and a SpectraMax plate reader (Molecular Devices) following the manufacture’s protocol.
For 3D Matrigel colony formation assays, 5,000 cells were resuspended in 1ml RPMI supplemented with 5% Matrigel and 2% FBS and plated in triplicate in each well of an ultra-low attachment 24-well plate (Corning). Bright field images were captured on day seven post plating and colony size and number were quantified from four 4× images per well using ImageJ software (NIH).
For scratch assays, cells were first plated to confluency in triplicate in wells of a standard 24-well plate. At day 0 of the assay, a wound was applied down the center of the well using a pipette tip. Media was subsequently removed and cells washed with PBS before addition of 1ml serum-free RPMI. Bright field images were captured using a 4× objective immediately (0 hours) and then at 6 hours and 24 hours post plating. Area of the wound was quantified using ImageJ software (NIH).
CRISPR-Based Targeting
For GFP-depletion assays, cells stably expressing Cas9 in LentiV-Cas9-puro vector were infected with sgRNAs in LRG2.1 vector (addgene #108098). GFP% was measured on day three (P0) and then every three days post viral transduction until the end of the experiment.
For RNA-seq experiments of CRISPR based targeting of TP63 in BxPC3 cells, BxPC3 cells stably expressing Cas9 were infected with control or TP63 sgRNAs in LRNG vector. Two days post infection with sgRNAs, transduced cells were selected with 1mg/ml of G418 and on day five post infection cells were used for RNA-seq analysis.
For CRISPR based targeting of TP63 in BxPC3 cells in vivo, please refer to the in vivo transplantation experiments section. sgRNA sequences can be found in Table S7.
shRNA targeting in BxPC3 cells and hF3 organoids
shRNAs targeting TP63 or control were cloned into the miR-E-based retroviral shRNA expression vector LEPG (LTR-miRE-shRNA-PGK-puro-IRES-GFP) (addgene #111160) (Fellmann et al., 2013). For GFP depletion assays in BxPC3 cells, GFP% was measured on day three (P0) and then every three days post viral transduction until the end of the experiment. For cell growth assays in hF3 organoids, cells were first infected with the appropriate lentiviral supernatant and at three days post infection, transduced cells were selected with 2 μg/ml of puromycin for five days. On day eight post infection, cells were counted by trypan blue exclusion and 500 cells were plated in triplicate in 30 μL of hCPLT media supplemented with 10% Matrigel in each well of a 384-well plate. Quantification of viable cells was determined every 24 hours post seeding for a total of seven days using CellTiterGlo Luminescent Cell Viability Assay kit (Promega) and a SpectraMax plate reader (Molecular Devices) following the manufacture’s protocol.
For RNA-seq experiments of shRNA-mediated targeting of TP63 in BxPC3 cells and hF3 organoids, cells were infected with control or TP63 shRNAs in MLS-E vector and at two days (for BxPC3 cells) or three days (for hF3 organoids) post infection with shRNAs, transduced cells were selected with 2 μg/ml of puromycin and on day five (for BxPC3 cells) or day eight (for hF3 organoids) post infection cells were used for RNA-seq analysis. shRNA sequences can be found in Table S7.
In Vivo Transplantation Experiments
All animal procedures and studies were approved by the Cold Spring Harbor Laboratory Animal Care and Use Committee in accordance to IACUC.
For CRISPR-mediated targeting of TP63 in BxPC3 cells in vivo, BxPC3 cells stably expressing Cas9 were first infected with a luciferase transgene in Lenti-luciferase-blast vector and a stable cell line was generated by selection with 10 μg/ml blasticidin. These cells were subsequently infected with control or TP63 sgRNA in LRNG vectors. Two days post infection with sgRNAs, transduced cells were selected with 1mg/ml of G418 for three days and on day five post infection, cells were counted by trypan blue exclusion, resuspended in PBS and kept on ice prior to transplantation.
For in vivo experiments using reprogrammed SUIT2 cells, parental SUIT2 cells were first infected with a luciferase transgene in Lenti-luciferase-blast vector and a stable cell line was generated by selection with 10 μg/ml blasticidin. These cells were subsequently infected ∆Np63 cDNA in LentiV-∆Np63-neo vector or the empty vector as a control. Two days post infection, transduced cells were selected 1 mg/ml of puromycin for three days and on day five post infection, cells were counted by trypan blue exclusion, resuspended in PBS and kept on ice prior to transplantation.
For lung colonization assays, 100,000 viable SUIT2 cells or 250,000 viable BxPC3 cells in 200 μL PBS were injected into the tail vein of NSG mice and bioluminescence imaging was initiated on day seven post transplantation.
Orthotopic transplants of cells into the pancreas of mice were performed as previously described (Aiello et al., 2016). Briefly, 50,000 viable SUIT2 cells or 100,000 viable BxPC3 cells in 50 μL of PBS were slowly injected into the body of the pancreas. Following bleb formation, the pancreas was carefully put back in place before suturing the peritoneal cavity and closing the skin incision using wound clips. Wound clips were removed on day seven post transplantation prior to bioluminescence imaging.
For bioluminescence imaging, mice were intraperitoneally (IP) injected with D-Luciferin (50mg/kg) and analyzed using an IVIS Spectrum system (Caliper Life Sciences) ten minutes post IP injection.
Histology and Immunohistochemistry
For histological and immunohistochemical analysis of mouse tissues, tissues were fixed in 10% neutral buffered formalin at room temperature for 24 hours and washed with 70% ethanol. Samples were then processed and subjected to H&E staining following standard protocol at the CSHL histology core facility. For immune histochemical analysis, 6 μm FFPE tissues sections were deparaffinized and rehydrated prior to steam based antigen retrieval in citrate buffer (pH 6.0). Sections were washed with dH2O prior to 10 minute incubation with 3% H2O2 to block endogenous peroxidase activity. Following 5 minutes rinse with dH2O, sections were incubated with 2.5% normal horse serum (Vector) for 1 hour at room temperature. Sections were subsequently incubated with 100 μL of primary antibody at the following dilutions in TBST: anti-TP63 (1:500), anti-KRT5/6 (1:200) or anti-S100A2 (1:250). Following washes, sections were then incubated for 1 hour at room temperature with HRP-linked horse-anti-mouse (for anti-KRT5/6) or horse-anti-rabbit (for anti- TP63 and anti-S100A2) secondary antibodies. Following further wash steps antigen labeling was performed using ImmPACT DAB (3,3-diamionbenzidine) peroxidase substrate kit (Vector) with 1–2 minute incubation. Sections were washed thoroughly, hematoxylin counterstained, dehydrated and coverslipped. Images were taken on an Axio Imager.A2 (ZEISS) microscope with a 20× objective.
Cell Lysate Preparation for Western Blot Analysis
Cell cultures were collected and 1 million cells were counted by trypan blue exclusion and washed with ice cold PBS. Cells were then resuspended in 100 μL PBS and lysed with 100 μL of 2× Laemmli Sample Buffer supplemented with b-mercaptoethanol by boiling for 30 minutes.
RNA Extraction and RT-PCR
Total RNA was extracted using TRIzol reagent following the manufacturer’s instructions. For RNA extraction from organoid samples, organoids were lysed by adding TRIzol reagent directly to the Matrigel dome. 1–2 μg of total RNA was treated with DNaseI and reverse transcribed to cDNA using qScript cDNA SuperMix, followed by RT-qPCR analysis with SYBR green PCR master mix on an ABI 7900HT fast real-time PCR system.
RNA-seq Library Construction
RNA-seq libraries were constructed using the TruSeq sample Prep Kit V2 (Illumina) according to the manufacturer’s instructions. Briefly, 2 μg of purified RNA was poly-A selected and fragmented with fragmentation enzyme. cDNA was synthesized with Super Script II master mix, followed by end repair, A-tailing and PCR amplification. RNA-seq libraries were single-end sequenced for 50bp using an Illumina HighSeq2500 or NextSeq platform (Cold Spring Harbor Genome Center, Woodbury).
ChIP and ChIP-Seq Library Construction
Cell cultures and organoid cultures were collected as single cell suspensions and were crosslinked in 1% formaldehyde at room temperature for 20 min and the reaction was then quenched using 0.125M glycine. 5–10 million cells were incubated with cell lysis buffer (10 mM Tris pH8.0, 10 mM NaCl, 0.2% NP-40) and then resuspended and sonicated in 500 μL of nuclei lysis buffer (50 mM Tris pH8.0, 10 mM EDTA, 1% SDS) for 15 min using a BioRuptor water bath sonicator (medium setting, 30 s ON/OFF cycles). 500 μL of sonicated chromatin from 5–10 million cells was diluted with 7.5ml of IP-Dilution buffer (20 mM Tris pH 8.0, 2 mM EDTA, 150 mM NaCl, 1% Triton X-100, 0.01% SDS) and incubated with 2 μg of the appropriate antibody and 25 μL of magnetic beads (protein A beads for rabbit antibody, protein G beads for mouse antibody) at 4°C overnight. After washing once with 1ml IP-wash 1 buffer (20 mM Tris pH8.0, 2 mM EDTA, 50 mM NaCl, 1% Triton X-100, 0.1% SDS), twice with 1ml High-salt buffer (20 mM Tris pH 8.0, 2 mM EDTA, 500 mM NaCl, 1% Triton X-100, 0.01% SDS), once with 1ml IP-wash 2 buffer (10 mM Tris pH 8.0, 1 mM EDTA 0.25 M LiCl, 1% NP-40, 1% sodium deoxycholate), twice with 1ml TE buffer (10 mM Tris-Cl, 1 mM EDTA, pH 8.0), beads bound to chromatin were eluted in 200 μL nuclei lysis buffer by heating at 65°C for 15 min at 1000rpm. 12 μL of 5M NaCl and 2 μL RNaseA (stock at 1mg/ml) was then added to the 200 μL eluted chromatin, followed by incubation at 65°C overnight for reverse cross-linking. DNA was subsequently treated with proteinase K for 2 hours at 42°C and then purified using a QIAGEN PCR purification kit.
ChIP-seq library was constructed using Illumina TruSeq ChIP Sample Prep kit following manufacture’s protocol. Briefly, ChIP DNA was end repaired, followed by A-tailing and size selection (300–500bp) by gel electrophoresis using a 2% gel. 15 PCR cycles were used for final library amplification which was analyzed on a Bioanalyzer using a high sensitivity DNA chip (Agilent). ChIP-seq libraries were single-end sequenced for 50bp using an Illumina NextSeq platform (Cold Spring Harbor Genome Center, Woodbury).
RNA-Seq Data Analysis
Single end 50bp sequencing reads were mapped to the hg19 genome using HISAT2 (Kim et al., 2015). Structural RNA was masked and differentially expressed genes were identified using Cuffdiff (Trapnell et al., 2010). All the following analysis was performed on genes with an RPKM value no less than 2 in either control or experimental samples. For RNA-seq following CRISPR based targeting of TP63 in BxPC3 cells, fold-change in RPKM was calculated as the ratio of the mean RPKM value of two independent TP63 sgRNAs to the RPKM value of the control sgRNA. For RNA-seq following ectopic expression of ∆Np63 in PATU8988S or SUIT2 cells, fold-change in RPKM was calculated as ratio of mean RPKM value of samples expressing ∆Np63 from two biological repeats to the mean RPKM value of control samples infected with an empty vector.
RNA-seq analysis of patient samples was performed using data extracted from Bailey et al. (2016). Only protein coding genes with a cpm value greater than 4 in at least 10% of the 96 patient samples for which RNA-seq data was available were used. The top 500 and bottom 500 genes passing this expression threshold in Squamous versus Progenitor samples, as defined by Bailey et al. (2016), defined the Squamous-PDA and Progenitor-PDA Identity signatures, respectively. To generate a ranked gene list for Pre-ranked gene set enrichment analysis (GSEA) (Subramanian et al., 2005), genes were ranked by their mean log2 fold change in Squamous versus Progenitor PDA patient samples. Heatmaps of standardized expression values were generated using Morpheus from the Broad Institute.
ChIP-Seq Analysis
Single end 50bp sequencing reads were mapped to the hg19 genome using Bowtie2 with default settings (Langmead and Salzberg, 2012). After removing duplicated mapped reads using SAM tools (Li et al., 2009), MACS 1.4.2 was used to call peaks using input genomic DNA as control (Feng et al., 2012). Only peaks enriched greater than or equal to 10-fold over input samples were used for subsequent analyses. Annotation of ChIP-seq peaks was performed using HOMER v4.9 with default settings (Heinz et al., 2010).
For unsupervised hierarchical clustering of the nine cell cultures representing human PDA and normal ducts, H3K27ac peaks from all samples were combined using the mergePeaks tool from HOMER v4.9 using default settings (-d given). This yielded a union of all H3K27ac peaks (n = 68,043). ChIP-seq tag counts were then recalculated at these intervals using MultCovBed from BEDTools (Quinlan and Hall, 2010) and were normalized to a read depth of 10 million uniquely mapped reads. Normalized H3K27ac tag counts were then used to generate a heatmap of similarity matrix by Pearson correlation, which was subsequently clustered by Euclidean distance with average linkage using Morpheus from the Broad Institute.
To define ‘Squamous Elements’, regions with greater than 1 tag per million in either hF3 or BxPC3 cells were used to calculate the ratio of the H3K27ac tag counts in hF3 or BxPC3 cells versus the mean tag counts across the other seven cultures. Those regions found to be greater than 5-fold increased in both hF3 and BxPC3 cells were defined as Squamous Elements (n = 1,336). A randomized set of 1,336 regions from the union of all H3K27ac peaks across the nine cultures were used as control regions (Random elements).
Heatmap density plots were made by first generating a density matrix by mapping sequencing reads from each ChIP-seq experiment to the 200 100bp bins around the center of a defined set of H3K27ac regions, i.e., Squamous elements, Random elements or All elements, with the latter defined as all H3K27ac peaks from the parental cell line. Tree View software was used to generate the heat-map from the density matrix and the contrast was adjusted proportionally to the total uniquely mapped reads for visual comparison across samples (Saldanha, 2004).
For calculating fold-change of H3K27ac tag counts following CRISPR based targeting of TP63 in BxPC3 cells, the following analysis was performed. First, H3K27ac peaks from cells infected with control and the two independent TP63 sgRNAs were combined using the mergePeaks tool to yield a union of all H3K27ac peaks in BxPC3 cells. ChIP-seq tag counts were then recalculated and normalized to a read depth of 1million uniquely mapped reads. Regions with greater than or equal to 5 tags per million in either control or TP63 knockout samples were then used to calculate the fold-change in tags as the ratio of the mean tag count of the two independent TP63 sgRNAs to the tag count in the control sample. Regions that decreased greater than 3-fold following TP63 knockout were defined as repressed (n = 741) and those that increased greater than 3-fold were defined as activated (n = 330). The same pipeline was used for calculating fold-change of H3K27ac tag counts following ectopic ∆Np63 expression in SUIT2 cells compared to those infected with an empty vector control. Those H3K27ac regions that increased greater than 3-fold in ∆Np63 cells versus controls were defined as activated (n = 1,335) and those that decreased greater than 3-fold were defined as repressed (n = 79).
For GSEA analysis, the nearest expressed genes (RPKM R 2) in hF3 or BxPC3 cells to Squamous Elements were first identified using Genomic Regions Enrichment of Annotations Tool (GREAT) (McLean et al., 2010). If the two nearest genes had an RPKM < 2 in both hF3 and BxPC3 cells, the peak was abandoned. This yielded 668 genes that were used for GSEA using the ranked gene list prepared from the analysis of Squamous versus Progenitor PDA patient samples.
Ontology analysis of Squamous elements and Random elements was also performed using GREAT with whole genome set as background using the basal plus extension setting.
For TRAP analysis (Thomas-Chollier et al., 2011), DNA sequences flanking 500bp from the center of each H3K27ac peak were extracted from the hg19 genome using the UCSC table browser. These regions served as the input to find enriched JASPAR vertebrate motifs with human promoters as the background using the Benjamini-Hochber correction. Fold enrichment was calculated as the ratio +1 of the observed p value (-log10) at Squamous versus Random elements.
For TP63 ChIP-seq analysis in BxPC3 cells, motif discovery was performed on all peaks using MEME-ChIP from the MEME Suite (Bailey et al., 2009). Annotation of ChIP-seq peaks was performed using HOMER v4.9 with default settings (Heinz et al., 2010).
QUANTIFICATION AND STATISTICAL ANALYSIS
Statistical significance was evaluated by p value from two-tailed Student’s t test or ANOVA using Prism software as indicated in the figure legends. Data are presented as mean with SEM and statistical significance of p value is indicated in figure legends. Unless otherwise stated in the figure legend, n refers to the number of biological repeats. For Kaplan-Meier survival curves, the log rank (Mantel-Cox) test was used to estimate median overall survival and statistical significance. Survival data were obtained from the CBioPortal (TCGA-PAAD) (Cerami et al., 2012), ICGC Data Portal (PACA-AU) (Bailey et al., 2016) or from the study by Moffitt et al. (2015). Survival data from the CBioPortal and the ICGC Data Portal data were downloaded in January 2018. For the TCGA-PAAD study, only the 150 confirmed PDA cases were used for the analyses in this study (The Cancer Genome Atlas Research Network, 2017).
Supplementary Material
Highlights.
TP63 reprograms enhancers to drive squamous transdifferentiation in PDA
TP63 expression promotes migration, invasion, and in vivo tumor growth
Sustained TP63 expression is essential for the growth of squamous PDA cells
TP63 regulates an oncogenic network that operates in the squamous subtype of PDA
ACKNOWLEDGMENTS
We would like to thank Rachel Rubino and Jill Habel from Cold Spring Harbor Laboratory (CSHL) Animal Resources for technical assistance with the mouse transplantation assays and John E. Wilkinson from the University of Michigan School of Medicine for the analysis of mouse histopathology. In addition, we thank the following CSHL shared resource core facilities: Animal and Animal Imaging, Bioinformatics, and DNA Sequencing and Histology. T.D.D.S. was supported by a grant from the State of New York, contract no. C150158. C.R.V. was supported by Pershing Square Sohn Cancer Research Alliance, Boehringer Ingelheim, the Cold Spring Harbor Laboratory and Northwell Health Affiliation, the National Cancer Institute (NCI) 5P01CA013106-Project 4, and a Career Development Award from the Pancreatic Cancer Action Network-American Association for Cancer Research (AACR) 16-20-25-VAKO. D.A.T. is supported by the Lustgarten Foundation of Pancreatic Cancer Research and the NIH (NIH 5P30CA45508-29, 5P50CA101955-07, P20CA192996-03, 1U10CA180944-04, 1R01CA188134-01, and 1R01CA190092-04).
Footnotes
DECLARATION OF INTERESTS
C.R.V. is an advisor to KSQ Therapeutics and receives research funding from Boehringer Ingelheim. D.A.T. is a member of the scientific advisory boards of Surface Oncology, Leap Therapeutics, MabImmune, VividBiosciences, and Bethyl Antibodies. D.A.T. has stock ownership in Surface Oncology and Leap Therapeutics. D.A.T. receives research support from ONO and Fibrogen.
DATA AND SOFTWARE AVAILABILITY
The accession number for the ChIP-seq and RNA-seq data reported in this paper is GEO: GSE115463.
SUPPLEMENTAL INFORMATION
Supplemental Information six figures and seven tables and can be found with this article online at https://doi.org/10.1016/j.celrep.2018.10.051.
REFERENCES
- Acharyya S, Oskarsson T, Vanharanta S, Malladi S, Kim J, Morris PG, Manova-Todorova K, Leversha M, Hogg N, Seshan VE, et al. (2012). A CXCL1 paracrine network links cancer chemoresistance and metastasis. Cell 150, 165–178. [DOI] [PMC free article] [PubMed] [Google Scholar]
- Aguirre AJ, Bardeesy N, Sinha M, Lopez L, Tuveson DA, Horner J, Redston MS, and DePinho RA (2003). Activated Kras and Ink4a/Arf deficiency cooperate to produce metastatic pancreatic ductal adenocarcinoma. Genes Dev 17, 3112–3126. [DOI] [PMC free article] [PubMed] [Google Scholar]
- Aiello NM, Rhim AD, and Stanger BZ (2016). Orthotopic injection of pancreatic cancer cells. Cold Spring Harb. Protoc 2016, pdb.prot078360. [DOI] [PubMed]
- Andricovich J, Perkail S, Kai Y, Casasanta N, Peng W, and Tzatsos A (2018). Loss of KDM6A Activates Super-Enhancers to Induce Gender-Specific Squamous-like Pancreatic Cancer and Confers Sensitivity to BET Inhibitors. Cancer Cell 33, 512–526. e8. [DOI] [PMC free article] [PubMed] [Google Scholar]
- Bailey TL, Boden M, Buske FA, Frith M, Grant CE, Clementi L, Ren J, Li WW, and Noble WS (2009). MEME SUITE: tools for motif discovery and searching. Nucleic Acids Res 37, W202–W208. [DOI] [PMC free article] [PubMed] [Google Scholar]
- Bailey P, Chang DK, Nones K, Johns AL, Patch AM, Gingras MC, Miller DK, Christ AN, Bruxner TJC, Quinn MC, et al. ; Australian Pancreatic Cancer Genome Initiative (2016). Genomic analyses identify molecular subtypes of pancreatic cancer. Nature 531, 47–52. [DOI] [PubMed] [Google Scholar]
- Bass AJ, Watanabe H, Mermel CH, Yu S, Perner S, Verhaak RG, Kim SY, Wardwell L, Tamayo P, Gat-Viks I, et al. (2009). SOX2 is an amplified lineage-survival oncogene in lung and esophageal squamous cell carcinomas. Nature Genetics 41, 1238. [DOI] [PMC free article] [PubMed] [Google Scholar]
- Basturk O, Khanani F, Sarkar F, Levi E, Cheng JD, and Adsay NV (2005). DeltaNp63 expression in pancreas and pancreatic neoplasia. Mod. Pathol 18, 1193–1198. [DOI] [PubMed] [Google Scholar]
- Boj SF, Hwang C-I, Baker LA, Chio IIC, Engle DD, Corbo V, Jager M, Ponz-Sarvise M, Tiriac H, Spector MS, et al. (2015). Organoid models of human and mouse ductal pancreatic cancer. Cell 160, 324–338. [DOI] [PMC free article] [PubMed] [Google Scholar]
- Bulk E, Sargin B, Krug U, Hascher A, Jun Y, Knop M, Kerkhoff C, Gerke V, Liersch R, Mesters RM, et al. (2009). S100A2 induces metastasis in non-small cell lung cancer. Clin. Cancer Res 15, 22–29. [DOI] [PubMed] [Google Scholar]
- Burtis WJ, Wu T, Bunch C, Wysolmerski JJ, Insogna KL, Weir EC, Broadus AE, and Stewart AF (1987). Identification of a novel 17,000-dalton parathyroid hormone-like adenylate cyclase-stimulating protein from a tumor associated with humoral hypercalcemia of malignancy. J. Biol. Chem 262, 7151–7156. [PubMed] [Google Scholar]
- Cerami E, Gao J, Dogrusoz U, Gross BE, Sumer SO, Aksoy BA, Jacobsen A, Byrne CJ, Heuer ML, Larsson E, et al. (2012). The cBio cancer genomics portal: an open platform for exploring multidimensional cancer genomics data. Cancer Discov 2, 401–404. [DOI] [PMC free article] [PubMed] [Google Scholar]
- Chatterjee A, Upadhyay S, Chang X, Nagpal JK, Trink B, and Sidransky D (2008). U-box-type ubiquitin E4 ligase, UFD2a attenuates cisplatin mediated degradation of DeltaNp63alpha. Cell Cycle 7, 1231–1237. [DOI] [PMC free article] [PubMed] [Google Scholar]
- David CJ, Huang YH, Chen M, Su J, Zou Y, Bardeesy N, Iacobuzio-Donahue CA, and Massagué J. (2016). TGF-b tumor suppressor through a lethal EMT. Cell 164, 1015–1030. [DOI] [PMC free article] [PubMed] [Google Scholar]
- Davis RL, Weintraub H, and Lassar AB (1987). Expression of a single transfected cDNA converts fibroblasts to myoblasts. Cell 51, 987–1000. [DOI] [PubMed] [Google Scholar]
- Desmet CJ, Gallenne T, Prieur A, Reyal F, Visser NL, Wittner BS, Smit MA, Geiger TR, Laoukili J, Iskit S, et al. (2013). Identification of a pharmacologically tractable Fra-1/ADORA2B axis promoting breast cancer metastasis. Proc. Natl. Acad. Sci. USA 110, 5139–5144. [DOI] [PMC free article] [PubMed] [Google Scholar]
- Diaferia GR, Balestrieri C, Prosperini E, Nicoli P, Spaggiari P, Zerbi A, and Natoli G (2016). Dissection of transcriptional and cis-regulatory control of differentiation in human pancreatic cancer. EMBO J 35, 595–617. [DOI] [PMC free article] [PubMed] [Google Scholar]
- Ezponda T, Dupé ré-Richer D, Will CM, Small EC, Varghese N, Patel T, Nabet B, Popovic R, Oyer J, Bulic M, et al. (2017). UTX/KDM6A Loss Enhances the Malignant Phenotype of Multiple Myeloma and Sensitizes Cells to EZH2 inhibition. Cell Rep 21, 628–640. [DOI] [PMC free article] [PubMed] [Google Scholar]
- Fellmann C, Hoffmann T, Sridhar V, Hopfgartner B, Muhar M, Roth M, Lai DY, Barbosa IA, Kwon JS, Guan Y, et al. (2013). An optimized micro-RNA backbone for effective single-copy RNAi. Cell Rep 5, 1704–1713. [DOI] [PubMed] [Google Scholar]
- Feng J, Liu T, Qin B, Zhang Y, and Liu XS (2012). Identifying ChIP-seq enrichment using MACS. Nat. Protoc 7, 1728–1740. [DOI] [PMC free article] [PubMed] [Google Scholar]
- Ferreira RMM, Sancho R, Messal HA, Nye E, Spencer-Dene B, Stone RK, Stamp G, Rosewell I, Quaglia A, and Behrens A (2017). Duct- and Acinar-Derived Pancreatic Ductal Adenocarcinomas Show Distinct Tumor Progression and Marker Expression. Cell Rep 21, 966–978. [DOI] [PMC free article] [PubMed] [Google Scholar]
- Genovese G, Carugo A, Tepper J, Robinson FS, Li L, Svelto M, Nezi L, Corti D, Minelli R, Pettazzoni P, et al. (2017). Synthetic vulnerabilities of mesenchymal subpopulations in pancreatic cancer. Nature 542, 362–366. [DOI] [PMC free article] [PubMed] [Google Scholar]
- Grabocka E, Pylayeva-Gupta Y, Jones MJ, Lubkov V, Yemanaberhan E, Taylor L, Jeng HH, and Bar-Sagi D (2014). Wild-type H- and N-Ras promote mutant K-Ras-driven tumorigenesis by modulating the DNA damage response. Cancer Cell 25, 243–256. [DOI] [PMC free article] [PubMed] [Google Scholar]
- GTEx Consortium (2015). Human genomics. The Genotype-Tissue Expression (GTEx) pilot analysis: multitissue gene regulation in humans. Science 348, 648–660. [DOI] [PMC free article] [PubMed] [Google Scholar]
- Guerra C, Schuhmacher AJ, Cañamero M, Grippo PJ, Verdaguer L, Pé rez-Gallego L, Dubus P, Sandgren EP, and Barbacid M (2007). Chronic pancreatitis is essential for induction of pancreatic ductal adenocarcinoma by K-Ras oncogenes in adult mice. Cancer Cell 11, 291–302. [DOI] [PubMed] [Google Scholar]
- Heinz S, Benner C, Spann N, Bertolino E, Lin YC, Laslo P, Cheng JX, Murre C, Singh H, and Glass CK (2010). Simple combinations of lineage-determining transcription factors prime cis-regulatory elements required for macrophage and B cell identities. Mol. Cell 38, 576–589. [DOI] [PMC free article] [PubMed] [Google Scholar]
- Hingorani SR, Petricoin EF, Maitra A, Rajapakse V, King C, Jacobetz MA, Ross S, Conrads TP, Veenstra TD, Hitt BA, et al. (2003). Preinvasive and invasive ductal pancreatic cancer and its early detection in the mouse. Cancer Cell 4, 437–450. [DOI] [PubMed] [Google Scholar]
- Hingorani SR, Wang L, Multani AS, Combs C, Deramaudt TB, Hruban RH, Rustgi AK, Chang S, and Tuveson DA (2005). Trp53R172H and KrasG12D cooperate to promote chromosomal instability and widely metastatic pancreatic ductal adenocarcinoma in mice. Cancer Cell 7, 469–483. [DOI] [PubMed] [Google Scholar]
- Hodge DR, Hurt EM, and Farrar WL (2005). The role of IL-6 and STAT3 in inflammation and cancer. Eur. J. Cancer 41, 2502–2512. [DOI] [PubMed] [Google Scholar]
- Iguchi H, Tanaka S, Ozawa Y, Kashiwakuma T, Kimura T, Hiraga T, Ozawa H, and Kono A (1996). An experimental model of bone metastasis by human lung cancer cells: the role of parathyroid hormone-related protein in bone metastasis. Cancer Res 56, 4040–4043. [PubMed] [Google Scholar]
- Itano N, Atsumi F, Sawai T, Yamada Y, Miyaishi O, Senga T, Hamaguchi M, and Kimata K (2002). Abnormal accumulation of hyaluronan matrix diminishes contact inhibition of cell growth and promotes cell migration. Proc. Natl. Acad. Sci. USA 99, 3609–3614. [DOI] [PMC free article] [PubMed] [Google Scholar]
- Jan YH, Tsai HY, Yang CJ, Huang MS, Yang YF, Lai TC, Lee CH, Jeng YM, Huang CY, Su JL, et al. (2012). Adenylate kinase-4 is a marker of poor clinical outcomes that promotes metastasis of lung cancer by down-regulating the transcription factor ATF3. Cancer Res 72, 5119–5129. [DOI] [PubMed] [Google Scholar]
- Kaufmann O, Fietze E, Mengs J, and Dietel M (2001). Value of p63 and cytokeratin 5/6 as immunohistochemical markers for the differential diagnosis of poorly differentiated and undifferentiated carcinomas. Am. J. Clin. Pathol 116, 823–830. [DOI] [PubMed] [Google Scholar]
- Kaulfuß S, von Hardenberg S, Schweyer S, Herr AM, Laccone F, Wolf S, and Burfeind P (2009). Leupaxin acts as a mediator in prostate carcinoma progression through deregulation of p120catenin expression. Oncogene 28, 3971. [DOI] [PubMed] [Google Scholar]
- Keyes WM, Pecoraro M, Aranda V, Vernersson-Lindahl E, Li W, Vogel H, Guo X, Garcia EL, Michurina TV, Enikolopov G, et al. (2011). ∆Np63a is an oncogene that targets chromatin remodeler Lsh to drive skin stem cell proliferation and tumorigenesis. Cell Stem Cell 8, 164–176. [DOI] [PMC free article] [PubMed] [Google Scholar]
- Kim D, Langmead B, and Salzberg SL (2015). HISAT: a fast spliced aligner with low memory requirements. Nat. Methods 12, 357–360. [DOI] [PMC free article] [PubMed] [Google Scholar]
- Kir S, White JP, Kleiner S, Kazak L, Cohen P, Baracos VE, and Spiegelman BM (2014). Tumour-derived PTH-related protein triggers adipose tissue browning and cancer cachexia. Nature 513, 100–104. [DOI] [PMC free article] [PubMed] [Google Scholar]
- Kitazawa S, Fukase M, Kitazawa R, Takenaka A, Gotoh A, Fujita T, and Maeda S (1991). Immunohistologic evaluation of parathyroid hormone-related protein in human lung cancer and normal tissue with newly developed monoclonal antibody. Cancer 67, 984–989. [DOI] [PubMed] [Google Scholar]
- Krebs AM, Mitschke J, Lasierra Losada M., Schmalhofer O, Boerries M, Busch H, Boettcher M, Mougiakakos D, Reichardt W, Bronsert P, et al. (2017). The EMT-activator Zeb1 is a key factor for cell plasticity and promotes metastasis in pancreatic cancer. Nat. Cell Biol 19, 518–529. [DOI] [PubMed] [Google Scholar]
- Langmead B, and Salzberg SL (2012). Fast gapped-read alignment with Bowtie 2. Nat. Methods 9, 357–359. [DOI] [PMC free article] [PubMed] [Google Scholar]
- Li CC, Chiang TC, Wu TS, Pacheco-Rodriguez G, Moss J, Lee FJS, and Barr F (2007). ARL4D recruits cytohesin-2/ARNO to modulate actin remodeling. Mol. Biol. Cell 18, 4420–4437. [DOI] [PMC free article] [PubMed] [Google Scholar]
- Li N, Singh S, Cherukuri P, Li H, Yuan Z, Ellisen LW, Wang B, Robbins D, and DiRenzo J (2008). Reciprocal intraepithelial interactions between TP63 and hedgehog signaling regulate quiescence and activation of progenitor elaboration by mammary stem cells. Stem Cells 26, 1253–1264. [DOI] [PMC free article] [PubMed] [Google Scholar]
- Li H, Handsaker B, Wysoker A, Fennell T, Ruan J, Homer N, Marth G, Abecasis G, and Durbin R; 1000 Genome Project Data Processing Subgroup (2009). The Sequence Alignment/Map format and SAMtools. Bioinformatics 25, 2078–2079. [DOI] [PMC free article] [PubMed] [Google Scholar]
- Lin CY, Erkek S, Tong Y, Yin L, Federation AJ, Zapatka M, Haldipur P, Kawauchi D, Risch T, Warnatz H-J, et al. (2016). Active medulloblastoma enhancers reveal subgroup-specific cellular origins. Nature 530, 57–62. [DOI] [PMC free article] [PubMed] [Google Scholar]
- Liu N, Gao F, Han Z, Xu X, Underhill CB, and Zhang L (2001). Hyaluronan synthase 3 overexpression promotes the growth of TSU prostate cancer cells. Cancer Res 61, 5207–5214. [PubMed] [Google Scholar]
- McDonald OG, Li X, Saunders T, Tryggvadottir R, Mentch SJ, Warmoes MO, Word AE, Carrer A, Salz TH, Natsume S, et al. (2017). Epigenomic reprogramming during pancreatic cancer progression links anabolic glucose metabolism to distant metastasis. Nat. Genet 49, 367–376. [DOI] [PMC free article] [PubMed] [Google Scholar]
- McLean CY, Bristor D, Hiller M, Clarke SL, Schaar BT, Lowe CB, Wenger AM, and Bejerano G (2010). GREAT improves functional interpretation of cis-regulatory regions. Nat. Biotechnol 28, 495–501. [DOI] [PMC free article] [PubMed] [Google Scholar]
- Memmi EM, Sanarico AG, Giacobbe A, Peschiaroli A, Frezza V, Cicalese A, Pisati F, Tosoni D, Zhou H, Tonon G, et al. (2015). p63 Sustains self-renewal of mammary cancer stem cells through regulation of Sonic Hedgehog signaling. Proc. Natl. Acad. Sci. USA 112, 3499–3504. [DOI] [PMC free article] [PubMed] [Google Scholar]
- Mills AA, Zheng B, Wang X-J, Vogel H, Roop DR, and Bradley A (1999). p63 is a p53 homologue required for limb and epidermal morphogenesis. Nature 398, 708–713. [DOI] [PubMed] [Google Scholar]
- Moffitt RA, Marayati R, Flate EL, Volmar KE, Loeza SGH, Hoadley KA, Rashid NU, Williams LA, Eaton SC, Chung AH, et al. (2015). Virtual microdissection identifies distinct tumor- and stroma-specific subtypes of pancreatic ductal adenocarcinoma. Nat. Genet 47, 1168–1178. [DOI] [PMC free article] [PubMed] [Google Scholar]
- Morohoshi T, Held G, and Klöppel G (1983). Exocrine pancreatic tumours and their histological classification. A study based on 167 autopsy and 97 surgical cases. Histopathology 7, 645–661. [DOI] [PubMed] [Google Scholar]
- Peñ a C, Céspedes MV, Lindh MB, Kiflemariam S, Mezheyeuski A, Edqvist PH, Hägglöf C, Birgisson H, Bojmar L, Jirström K, et al. (2013). STC1 expression by cancer-associated fibroblasts drives metastasis of colorectal cancer. Cancer Res 73, 1287–1297. [DOI] [PubMed] [Google Scholar]
- Peterson EA, Jenkins EC, Lofgren KA, Chandiramani N, Liu H, Aranda E, Barnett M, and Kenny PA (2015). Amphiregulin is a critical downstream effector of estrogen signaling in ERa-positive breast cancer. Cancer Res 75, 4830–4838. [DOI] [PMC free article] [PubMed] [Google Scholar]
- Petitjean A, Ruptier C, Tribollet V, Hautefeuille A, Chardon F, Cavard C, Puisieux A, Hainaut P, and Caron de Fromentel C (2008). Properties of the six isoforms of p63: p53-like regulation in response to genotoxic stress and cross talk with DeltaNp73. Carcinogenesis 29, 273–281. [DOI] [PubMed] [Google Scholar]
- Quinlan AR, and Hall IM (2010). BEDTools: a flexible suite of utilities for comparing genomic features. Bioinformatics 26, 841–842. [DOI] [PMC free article] [PubMed] [Google Scholar]
- Rada-Iglesias A, Bajpai R, Swigut T, Brugmann SA, Flynn RA, and Wysocka J (2011). A unique chromatin signature uncovers early developmental enhancers in humans. Nature 470, 279–283. [DOI] [PMC free article] [PubMed] [Google Scholar]
- Rhim AD, Mirek ET, Aiello NM, Maitra A, Bailey JM, McAllister F, Reichert M, Beatty GL, Rustgi AK, Vonderheide RH, et al. (2012). EMT and dissemination precede pancreatic tumor formation. Cell 148, 349–361. [DOI] [PMC free article] [PubMed] [Google Scholar]
- Rocco JW, Leong C-O, Kuperwasser N, DeYoung MP, and Ellisen LW (2006). p63 mediates survival in squamous cell carcinoma by suppression of p73-dependent apoptosis. Cancer Cell 9, 45–56. [DOI] [PubMed] [Google Scholar]
- Roe JS, Hwang CI, Somerville TDD, Milazzo JP, Lee EJ, Da Silva B, Maiorino L, Tiriac H, Young CM, Miyabayashi K, et al. (2017). Enhancer Reprogramming Promotes Pancreatic Cancer Metastasis. Cell 170, 875–888. e20. [DOI] [PMC free article] [PubMed] [Google Scholar]
- Saldanha AJ (2004). Java Treeview–extensible visualization of microarray data. Bioinformatics 20, 3246–3248. [DOI] [PubMed] [Google Scholar]
- Sheng Q, Liu X, Fleming E, Yuan K, Piao H, Chen J, Moustafa Z, Thomas RK, Greulich H, Schinzel A, et al. (2010). An activated ErbB3/NRG1 autocrine loop supports in vivo proliferation in ovarian cancer cells. Cancer Cell 17, 298–310. [DOI] [PMC free article] [PubMed] [Google Scholar]
- Shi J, Wang E, Milazzo JP, Wang Z, Kinney JB, and Vakoc CR (2015). Discovery of cancer drug targets by CRISPR-Cas9 screening of protein domains. Nat. Biotechnol 33, 661–667. [DOI] [PMC free article] [PubMed] [Google Scholar]
- Shrestha P, Muramatsu Y, Kudeken W, Mori M, Takai Y, Ilg EC, Schafer BW, and Heizmann CW (1998). Localization of Ca(2+)-binding S100 proteins in epithelial tumours of the skin. Virchows Arch 432, 53–59. [DOI] [PubMed] [Google Scholar]
- Siegel RL, Miller KD, and Jemal A (2018). Cancer statistics, 2018. CA Cancer J. Clin 68, 7–30. [DOI] [PubMed] [Google Scholar]
- Soares E, and Zhou H (2018). Master regulatory role of p63 in epidermal development and disease. Cell. Mol. Life Sci 75, 1179–1190. [DOI] [PMC free article] [PubMed] [Google Scholar]
- Su X, Chakravarti D, Cho MS, Liu L, Gi YJ, Lin Y-L, Leung ML, El-Naggar A, Creighton CJ, Suraokar MB, et al. (2010). TAp63 suppresses metastasis through coordinate regulation of Dicer and miRNAs. Nature 467, 986–990. [DOI] [PMC free article] [PubMed] [Google Scholar]
- Subramanian A, Tamayo P, Mootha VK, Mukherjee S, Ebert BL, Gillette MA, Paulovich A, Pomeroy SL, Golub TR, Lander ES, and Mesirov JP (2005). Gene set enrichment analysis: a knowledge-based approach for interpreting genome-wide expression profiles. Proc. Natl. Acad. Sci. USA 102, 15545–15550. [DOI] [PMC free article] [PubMed] [Google Scholar]
- Tadeu AMB, and Horsley V (2013). Notch signaling represses p63 expression in the developing surface ectoderm. Development 140, 3777–3786. [DOI] [PMC free article] [PubMed] [Google Scholar]
- Tarumoto Y, Lu B, Somerville TDD, Huang Y-H, Milazzo JP, Wu XS, Klingbeil O, El Demerdash O, Shi J, and Vakoc CR (2018). LKB1, Salt-Inducible Kinases, and MEF2C Are Linked Dependencies in Acute Myeloid Leukemia. Mol. Cell 69, 1017–1027. e6. [DOI] [PMC free article] [PubMed] [Google Scholar]
- The Cancer Genome Atlas Research Network (2017). Integrated genomic characterization of pancreatic ductal adenocarcinoma. Cancer Cell 32, 185–203. e13. [DOI] [PMC free article] [PubMed] [Google Scholar]
- Thomas-Chollier M, Hufton A, Heinig M, O’Keeffe S, Masri NE, Roider HG, Manke T, and Vingron M (2011). Transcription factor binding predictions using TRAP for the analysis of ChIP-seq data and regulatory SNPs. Nat. Protoc 6, 1860–1869. [DOI] [PubMed] [Google Scholar]
- Tiriac H, Belleau P, Engle DD, Plenker D, Desche^nes A., Somerville TDD., Froeling FEM., Burkhart RA., Denroche RE., Jang G-H., et al. (2018). Organoid profiling identifies common responders to chemotherapy in pancreatic cancer. Cancer Discov 8, 1112–1129. [DOI] [PMC free article] [PubMed] [Google Scholar]
- Trapnell C, Williams BA, Pertea G, Mortazavi A, Kwan G, van Baren MJ, Salzberg SL, Wold BJ, and Pachter L (2010). Transcript assembly and quantification by RNA-seq reveals unannotated transcripts and isoform switching during cell differentiation. Nat. Biotechnol 28, 511–515. [DOI] [PMC free article] [PubMed] [Google Scholar]
- Urosevic J, Garcia-Albé niz X, Planet E, Real S, Cé spedes MV, Guiu M, Fernandez E, Bellmunt A, Gawrzak S, Pavlovic M, et al. (2014). Colon cancer cells colonize the lung from established liver metastases through p38 MAPK signalling and PTHLH. Nat. Cell Biol 16, 685–694. [DOI] [PubMed] [Google Scholar]
- Waugh DJJ, and Wilson C (2008). The interleukin-8 pathway in cancer. Clin. Cancer Res 14, 6735–6741. [DOI] [PubMed] [Google Scholar]
- Witkiewicz AK, McMillan EA, Balaji U, Baek G, Lin WC, Mansour J, Mollaee M, Wagner K-U, Koduru P, Yopp A, et al. (2015). Whole-exome sequencing of pancreatic cancer defines genetic diversity and therapeutic targets. Nat. Commun 6, 6744. [DOI] [PMC free article] [PubMed] [Google Scholar]
- Xi Y, Kim T, Brumwell AN, Driver IH, Wei Y, Tan V, Jackson JR, Xu J, Lee DK, Gotts JE, et al. (2017). Local lung hypoxia determines epithelial fate decisions during alveolar regeneration. Nat. Cell Biol 19, 904–914. [DOI] [PMC free article] [PubMed] [Google Scholar]
- Xu Y, Milazzo JP, Somerville TDD, Tarumoto Y, Huang Y-H, Ostrander EL, Wilkinson JE, Challen GA, and Vakoc CR (2018). A TFIID-SAGA Perturbation that Targets MYB and Suppresses Acute Myeloid Leukemia. Cancer Cell 33, 13–28. e8. [DOI] [PMC free article] [PubMed] [Google Scholar]
- Yang A, Kaghad M, Wang Y, Gillett E, Fleming MD, Dötsch V, Andrews NC, Caput D, and McKeon F (1998). p63, a p53 homolog at 3q27–29, encodes multiple products with transactivating, death-inducing, and dominant-negative activities. Mol. Cell 2, 305–316. [DOI] [PubMed] [Google Scholar]
- Ye LY, Chen W, Bai XL, Xu XY, Zhang Q, Xia XF, Sun X, Li GG, Hu QD, Fu QH, and Liang TB (2016). Hypoxia-Induced Epithelial-to-Mesenchymal Transition in Hepatocellular Carcinoma Induces an Immuno-suppressive Tumor Microenvironment to Promote Metastasis. Cancer Res 76, 818–830. [DOI] [PubMed] [Google Scholar]
- Young A, Lou D, and McCormick F (2013). Oncogenic and wild-type Ras play divergent roles in the regulation of mitogen-activated protein kinase signaling. Cancer Discov 3, 112–123. [DOI] [PubMed] [Google Scholar]
- Zhang J, Ji JY, Yu M, Overholtzer M, Smolen GA, Wang R, Brugge JS, Dyson NJ, and Haber DA (2009). YAP-dependent induction of amphiregulin identifies a non-cell-autonomous component of the Hippo pathway. Nature Cell Biology 11, 1444. [DOI] [PMC free article] [PubMed] [Google Scholar]
Associated Data
This section collects any data citations, data availability statements, or supplementary materials included in this article.