Abstract
Objectives. To examine 47 years of US urban and rural mortality trends at the county level, controlling for effects of education, income, poverty, and race.
Methods. We obtained (1) Centers for Disease Control and Prevention WONDER (Wide-ranging ONline Data for Epidemiologic Research) data (1970–2016) on 104 million deaths; (2) US Census data on education, poverty, and race; and (3) Bureau of Economic Analysis data on income. We calculated ordinary least square regression models, including interaction models, for each year. We graphed standardized parameter estimates for 47 years.
Results. Rural–urban mortality disparities increased from the mid-1980s through 2016. We found education, race, and rurality to be strong predictors; we found strong interactions between percentage poverty and percentage rural, indicating that the largest penalty was in high-poverty, rural counties.
Conclusions. The rural–urban mortality disparity was persistent, growing, and large when compared to other place-based disparities. The penalty had evolved into a high-poverty, rural penalty that rivaled the effects of education and exceeded the effects of race by 2016.
Public Health Implications. Targeting public health programs that focus on high-poverty, rural locales is a promising strategy for addressing disparities in mortality.
Many of the early successes of public health in the United States have been in response to place-based health disadvantages. A major public health challenge during the 19th and early 20th centuries was to eliminate a mortality penalty associated with urban life.1 City dwellers were experiencing higher mortality than were rural people. This “urban mortality penalty” was attributed to contagious diseases in dense populations, poor water quality, and inadequate sewage disposal. During the 20th century, large-scale public works projects resulted in improved water quality and sanitation, eliminating the mortality disadvantages of cities. By the 1940s, transformations in public health involving vaccinations, physical examinations, and health education had eliminated the urban penalty, and there was no longer a mortality advantage associated with rurality.2 In fact, during the past 3 decades, mortality patterns shifted to greater mortality disparities in rural America, creating a “rural mortality penalty.”1
The rural mortality penalty is grounded in literature emphasizing ecological factors affecting place-based health.3 A 2008 national mortality analysis indicated that the rural mortality penalty first emerged in the 1980s and consistently increased over the next 3 decades. The magnitude of the penalty was substantial; by 2004, rural counties experienced more than 35 000 additional deaths each year, and the mortality trends indicated a growing rural disparity.1 Recent analyses indicate that the rural penalty is broad based and occurs in all 5 leading causes of death: heart disease, cancer, unintentional injury, chronic lower respiratory disease, and stroke.4
The identification of the rural penalty as a social determinant of mortality is obscured by 2 factors. First, the rural penalty is not a result of increasing mortality in rural America; rather, rural mortality rates have declined during the past several decades. The rural penalty results from urban mortality declining at a faster rate.1,5 From 1990 to 2004, annual urban mortality rates declined at an average of 1.23%, whereas rural rates declined at a rate of 0.68%.1 Nevertheless, there are population groups in rural areas that have observed increasing death rates, most notably those aged 45 to 54 years, who experienced an increase of 15%.6 Second, the rural penalty is a recent disparity that was first reported in 2008.1 Other important social determinants, such as education, income, poverty, and race, are recognized as influencing mortality extensively.7
These ecological factors converge in work showing the rising morbidity and mortality among less-educated White Americans.8 Previous research revealed a mortality rate difference for this group of 134 deaths per 100 000 from 1999 to 2013. Having less than a high school education is highly correlated with income and poverty, particularly in rural America.9 The largest mortality disadvantage both historically and currently is experienced by Black Americans, particularly rural Black Americans, as indicated by the trends for race-specific rural mortality.10 Although mortality rates for Black Americans have improved in recent decades, the rates remained markedly higher throughout the period. The most disadvantaged region for White mortality (rural places) still has lower mortality rates than does the most advantaged region (urban) for Black mortality. Furthermore, the magnitude of race-specific rural–urban differences has increased over time.10
Finally, when studying place-based differences in health, especially over time, it is critical to understand that place is dynamic. From period to period, rural places may grow in population to become classified by the US Census as urban, and in some instances, places can decline, resulting in a shift from urban to rural classification. Furthermore, the Census uses Beale Rural–Urban Continuum Codes (RUC codes), which constitute a continuum of population, scale, and density. These can be collapsed into a binary rural–urban classification.11
The foregoing assessment of the rural penalty is on the basis of descriptive analyses of mortality rates between rural and urban places. It leaves an unaddressed issue: the rural penalty may result from a spurious relationship with other social determinants of mortality, such as race, education, income, and poverty. These determinants can potentially affect all-cause mortality at both the ecological (including counties) and the individual levels. Places experiencing less prejudice and discrimination and having higher levels of education, more wealth, and less poverty are capable of creating healthier environments that lead to longevity. Likewise, individuals who do not face prejudice and discrimination, with higher levels of education and wealth and with less poverty, have more opportunities to make healthier decisions and access life-extending resources. We conceptualized rural residence as another social determinant that affects mortality. This conceptualization requires research designs that estimate the effects of rurality while controlling for key determinants.9 It is also apparent in time series data that the rural penalty is growing. This suggests the need for a series of time-specific multivariable analyses that more comprehensively assess the relative and combined effects of the various determinants.
METHODS
Rurality is only 1 of many place-based characteristics that potentially affect mortality. On the basis of the literature, we hypothesized that higher levels of rurality, higher percentages of Black population, lower levels of educational achievement, lower levels of income, and higher levels of poverty are associated with higher mortality. We explored the net effects of rurality, race, education, income, and poverty on mortality rates from 1970 to 2016. We addressed the following questions: (1) what are the combined place-based effects of rurality, race, education, income, and poverty on mortality rates; (2) what is the relative impact of each of the place-based social determinants when the influence of the others is controlled; and (3) how did the pattern of combined and relative influences change from 1970 to 2016?
Study Population
We obtained all-cause mortality data from the National Center for Health Statistics Compressed Mortality File via Centers for Disease Control and Prevention (CDC) WONDER (Wide-ranging ONline Data for Epidemiologic Research), which reports deaths by age, race, sex, county of residence, and cause of death.12 The study population contained annual county-level (n = 3142) all-cause mortality data on the total number of US deaths from 1970 to 2016 (n = 105 132 761). We calculated county mortality rates per 100 000 and adjusted them to the year 2000 standard million, which accounts for age structure differences, to permit comparisons across metropolitan and nonmetropolitan counties. In addition to all-cause mortality data, we calculated excess deaths to estimate the number of deaths that would not have occurred had rural mortality rates kept pace with urban rates. We calculated total excess deaths as (rural age-adjusted mortality rate per 100 000 – urban age-adjusted mortality rate per 100 000) × (rural population/100 000).
We defined metropolitan and nonmetropolitan counties on the basis of the RUC codes.13 Urban counties were core areas forming a large population nucleus and adjacent communities with a high degree of economic and social integration, whereas rural areas were residual locations that fell outside urban statistical areas.14 Classifications 1 through 3 represent metropolitan counties with populations of less than 250 000 to more than 1 million residents. Nonmetropolitan classifications 4 through 9 represent counties with populations of less than 2500 to 20 000 or more residents. Counties are reclassified every decade on the basis of revised RUC codes: 1974 codes were used for 1970 to 1979; 1983 codes were used for 1980 to 1989; 1993 codes were used for 1990 to 1999; 2003 codes were used for 2000 to 2010; and 2013 codes were used for 2011 to 2016. This county classification follows previous research that helped us extend the descriptive time series using new mortality data as they became available.1 In addition, we obtained percentage rural by county from the US Census Bureau for 1970 to 2010 at each Census decade and assessed this as percentage of the total county population living in nonmetropolitan areas.15 We used the collapsed RUC codes for the descriptive comparison of rural and urban counties and the percentage rural measure as the rurality indicator for all multivariable models.
We obtained county-level race from the Census for 1970 to 2010.16 The Census Bureau collected county population each decade and provided estimates on the basis of sex, race, ethnicity, and age group. We assessed race as percentage White, Black, and other race. We also obtained county-level educational attainment from the Census for 1970 to 2010 at each decade.17 We assessed education as the percentage of each of the following categories: college graduate, some college, high school education, and less than high school education. Estimation methods for race17 and educational attainment18 are reported elsewhere.
We used 2 dimensions of county-level income for the analyses: per capita income and poverty. We obtained per capita income from the Bureau of Economic Analysis.19 Per capita income captured annual personal income (all income from all sources) divided by county population.20 We obtained poverty from the Census for 1970 to 201021 each decade and reported it as the percentage of the county living in poverty.22
We defined the study population area as the 48 contiguous states plus the District of Columbia. We excluded Alaska and Hawaii because of the difficulty in matching county Federal Information Processing Standards Codes across multiple data sets and over time. Following CDC WONDER suppression protocol, we deleted counties with 9 or fewer deaths (n = 12) to avoid identifying individuals.12 Also, we excluded counties that were newly created (n = 1) or deleted (n = 1). We aggregated Virginia data in combinations of independent cities and counties that caused gaps across county-level data sources. After the exclusions, the final sample included counties from the 48 contiguous states (n = 3065).
Statistical Analysis
We examined trends of rural and urban mortality using time series analysis comparing rates over 47 years. We extrapolated data to the mid-decade year for variables that we collected at Census decade only, including education, rurality, and poverty percentage. We conducted multivariable ordinary least square (OLS) regression analyses to examine associations among rurality, race, education, income, and poverty related to mortality. To account for variation in population size by year, we weighted data by annual county population via the Stata analytic command aweight. This gave a greater weight to rates (rural, Black, education, etc.) for counties with large populations than to rates for those with small populations.
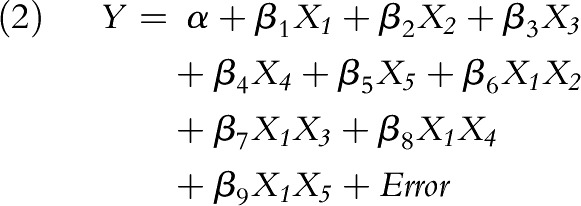
We examined variance inflation factors to determine potential multicollinearity. We also examined coefficients of determination (R2) to estimate the explanatory power of the models. We analyzed the following regression models for each of the 47 years: (1) without interactions and (2) with interactions, where Y = estimated age-adjusted mortality rate, X1 = percentage rural, X2 = percentage Black, X3 = percentage without college education, X4 = percentage poverty, X5 = per capita income, X1 × 2 = first-order interaction between rural and race, X1 × 3 = first-order interaction between rural and education, X1 × 4 = first-order interaction between rural and poverty, and X1 × 5 = first-order interaction between rural and per capita income.
 |
 |
We conducted sensitivity analyses to examine the interaction effects of race, education, income, and poverty with rural percentage. We also examined per capita income and poverty in separate models, models without the population weight variable, and models using college educational attainment. We collapsed the raw data for county-level race using SAS version 9.4 (SAS Institute, Cary, NC), and we conducted all other data transformation and analyses in Stata SE version 14 (StataCorp, College Station, TX).
RESULTS
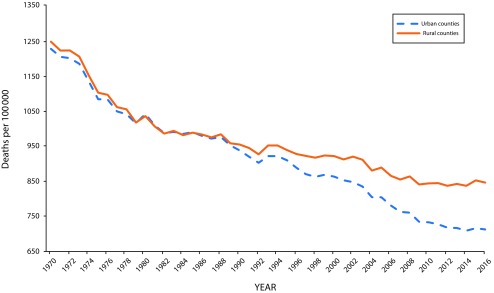
Figure 1 depicts the time series data that contrasts rural and urban mortality from 1970 to 2016, resulting in 12 more years of mortality data than those used in the initial, 2008, study.1 The magnitude of the difference between rural and urban mortality rates in 2004 (913.13 vs 836.16) resulted in 76.97 excess deaths per 100 000. It increased in 2016 (847.65 vs 712.95) to 134.70 excess deaths per 100 000. This reflects a 75% increase in the rural penalty in the past 12 years. By extending the 134.70 excess deaths occurring in rural America to the entire rural population in 2016 of approximately 45 350 000, the nation was experiencing about 61 000 additional deaths that would not have occurred if rural America had been able to achieve the same improvements as urban America.
FIGURE 1—
Trends in Rural and Urban Age-Adjusted (All-Cause) Mortality for the United States: Centers for Disease Control and Prevention WONDER, 1970–2016
Note. Results are from 47 annual ordinary least squares regression models of race, education, income, poverty, and rural residence regressed on age-adjusted all-cause mortality for the contiguous United States.
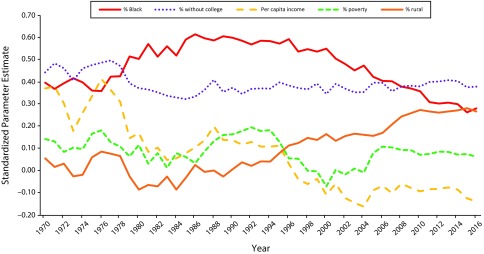
Figure 2 provides summary graphs of standardized parameter estimates from 47 OLS models in which we regressed county-level measures of race, education, income, poverty, and rurality on county mortality rates. We interpreted these standardized parameter estimates as time series indicators of the effects of place-based social determinants. Collectively, the graph depicts a complex set of influences.
FIGURE 2—
Standardized Parameter Estimates of Place-Based Social Determinants of Mortality: Centers for Disease Control and Prevention WONDER, US Census Bureau, Bureau of Economic Analysis, 1970–2016
Note. Results are from 47 annual ordinary least squares regression models of race, education, income, poverty, rural residence, and rural × poverty regressed on age-adjusted all-cause mortality for the contiguous United States.
First, the effects of race were strong throughout the time series, with parameter estimates ranging from 0.26 to 0.62, indicating large and persistent racial inequalities in mortality after controlling for education, income, poverty, and rurality. In 1996 the effects of race began declining over the next 2 decades, suggesting significant reduction in the influence of racial inequalities on mortality.
Second, the effects of those without a college education were consistently strong, ranging from 0.32 to 0.50. The magnitude of educational effects stabilized in the last half of the time series, with parameter estimates varying from 0.35 and 0.41.
Third, the parameter estimates for percentage rural ranged from −0.08 to 0.28 for the time series. The pattern of parameter estimates can be described in 2 parts. From 1970 to 1990, the effects were relatively small and inconsistent; however, after 1990, the effects of rurality consistently increased, with the 7 largest effects all occurring at the end of the time series (2010–2016). This pattern was consistent with the previous descriptive finding of an increasing disparity between rural and urban places (Figure 1).
Fourth, the parameter estimates for per capita income ranged from −0.16 to 0.42, with the strongest effects occurring during the earliest part of the time series, 1970 to 1978; afterward, the parameter estimates tended to decline and were found to be modestly negative.
Fifth, the parameter estimates for poverty were the least predictive, ranging from −0.07 to 0.20. Although not reported in the graph, we calculated R2 ranging from 0.34 to 0.59, with an average of 0.49 (Table A, available as a supplement to the online version of this article at http://www.ajph.org); all models from 1988 to 2016 had R2 of 0.50 or larger.
Additionally, sensitivity analyses assessed robustness of the models. We computed the variance inflation factor to assess multicollinearity for the explanatory variables. The variance inflation factor ranged from 1.30 to 1.89 for race, 1.79 to 3.38 for education, 2.21 to 3.70 for income, 1.54 to 2.71 for poverty, and 1.57 to 2.18 for rurality. These results indicated minimal multicollinearity among parameter estimates. We computed additional models with interaction terms between rurality and the other variables. The results pointed to the interaction between rurality and poverty as an important predictor of mortality. Interactions other than rural × poverty had minimal effects on explanatory power.
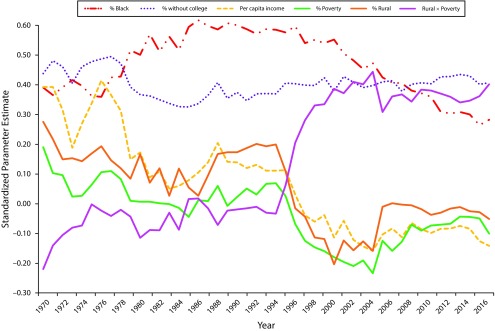
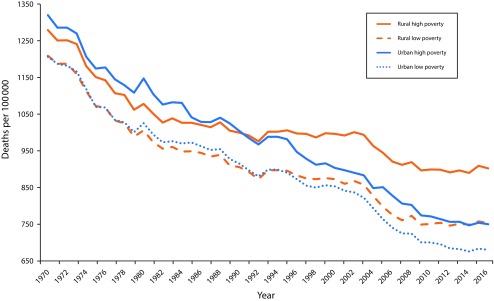
Figure 3 provides the revised models that include the rural × poverty interactions. The pattern of influences throughout the time series were similar for the effects of both race and education. Higher levels of minority population and lower levels of college education were strongly associated with higher mortality. The interaction effect of rural percentage and poverty became very strong beginning in 1996 and continued throughout the remainder of the time series (Table B, available as a supplement to the online version of this article at http://www.ajph.org). This interaction implies that the combination of rural status and high levels of poverty were strong underlying forces leading to high mortality. In Figure 4, the rural penalty graphs have been reconstructed to compare the age-adjusted mortality pattern of rural high poverty (≥ 15% or greater), rural low poverty (< 15%), urban high poverty (≥ 15%), and urban low poverty (< 15%). This new graph reveals a different perspective on the nature of the rural penalty. Most of the rural disparity is concentrated in the rural high-poverty counties. Urban high-poverty and rural low-poverty counties had similar and lower mortality. Urban low-poverty counties had the most favorable mortality outcomes.
FIGURE 3—
Standardized Parameter Estimates of Place-Based Social Determinants of Mortality: Centers for Disease Control and Prevention WONDER, US Census Bureau, Bureau of Economic Analysis, 1970–2016
Note. Poverty > 15% in rural high poverty; poverty ≤ 15% in rural low poverty.
FIGURE 4—
Trends in Age-Adjusted All-Cause Mortality Rates for Rural, High-Poverty Counties; Rural, Low-Poverty Counties; Urban, High-Poverty Counties; and Urban, Low-Poverty Counties: United States, Centers for Disease Control and Prevention WONDER, 1970–2016
DISCUSSION
This research supports the contention that “place matters” for mortality. Throughout the 47-year time series, certain place-based measures, such as race, education, income, poverty, and rurality, were consistently associated with higher mortality rates. An unanticipated outcome was the tendency for the predictive power of the models to increase over time, indicating that place is becoming more important as a component of health in the United States. Lack of a college education was associated with increased mortality across the entire time span. Although populations with higher proportions of Black citizens had higher mortality rates, the strength of this impact was beginning to decrease during the past 2 decades. The direct and interacting effects of rurality were more complex and necessitated reformulation of the rural mortality penalty concept.
First, the data indicated that the rural mortality penalty is large and growing and that many areas of rural America are not keeping pace with the health improvements of urban America. The 2016 rate for rural low-income America was approximately 2 decades behind the levels observed in urban America. Second, the findings indicated that the effects of rurality on mortality were not the result of spuriousness produced by place-based differences in race, education, income, and poverty. Third, the effects of rurality are best understood as an interaction between rurality and higher concentrations of poverty. Rural high-poverty counties accounted for most mortality disparities between rural and urban counties. Fourth, the magnitude of the mortality disparity observed in the rural × poverty analysis was very large and, in the most recent years of the time series, rivaled the effects of education and exceeded the effects of race. Collectively, the research supports identifying the rural mortality penalty as a major health disparity and reconceptualizing the penalty more correctly as a high-poverty, rural mortality penalty.
An additional implication is the distinction between the modest effects of per capita income and much stronger effects of percentage poverty (including interaction effects). This suggests that it is not how much wealth is in a county but, rather, how the wealth is concentrated and distributed within a county. Higher concentrations at the lower levels of the income spectrum appear to be the most consequential for creating mortality disparities.23,24 Further research that includes adjustments for cost of living could help clarify the significance of the rural × poverty interaction by eliminating the possible confounding influence of geographic differences in cost of living.
These findings may also be connected to emerging trends that the country is experiencing: increasing opioid addiction, increasing suicide rates, and declining life expectancy.25 These concerns are particularly relevant in rural America, where middle-aged Whites, high school educated or less, are dying at an alarming rate.8 This demographic subgroup shares many characteristics with those we find significant in our work: residing in rural places, high levels of poverty, and low education. The opioid epidemic has spread rapidly throughout the nation and is predictive of another key demographic event: declining life expectancy. Additionally, recent literature links other factors with rural deaths, such as smoking-attributable mortality, obesity, and a high cardiovascular disease presence,26–29 which urban areas have been more successful in reducing.30
Limitations
There are limitations that this research shares with many ecological health studies. We could not distinguish between place-based and individual effects.31 For example, are the effects of education a result of a healthier environment because of more college-educated citizens, or are the effects a result of educated individuals living longer? Also, global measures of rural and urban status at the county level clearly mask the complexity of place: the differences between neighborhoods within counties can be substantial.
It is noteworthy that our models did not include other ethnic categories that could affect mortality; there is insufficient ethnic data at the county level to generate stable estimates. The OLS models we used included only 4 control variables; there are clearly possibilities that additional variables could add to the explanatory power of the models.
Public Health Implications
Although mortality has decreased substantially in the United States, the increase and persistence in the rural mortality penalty suggest that narrowing the gaps between rural and urban places requires both local and national policies. Emphasis should be on tailoring and implementing local initiatives in rural communities for effective prevention and treatment. These include strengthening the local health systems by increasing primary, mental health, and specialty health services and providing wraparound services, such as the use of community health worker programs.32
Interventions or policies to improve mortality rates may be ineffective if they focus only on health care access and do not closely consider the social and economic conditions of rural places. The acceleration of the rural mortality penalty is associated with complex and interconnected social, behavioral, and structural factors, and identifying which factors are mutable is challenging. This is especially problematic considering that mortality is often downstream from the effects of these factors. However, this does not mean policymakers should continue identifying the gaps without taking actionable steps, such as changing funding mechanisms from a population number basis to a need-based allocation to bolster underfunded resources in rural areas or create special designations for health systems and public health services in high-mortality areas.32 Emphasis on a more targeted approach to rural health would provide the means to begin addressing the high-poverty, rural mortality penalty.
ACKNOWLEDGMENTS
M. M. McDoom-Echebiri was supported by the National Heart, Lung, and Blood Institute, National Institutes of Health (grant T32HL007024).
CONFLICTS OF INTEREST
No conflicts of interest.
HUMAN PARTICIPANT PROTECTION
This research used secondary, publicly available data from the WONDER (Wide-ranging ONline Data for Epidemiologic Research) data set, the US Census, and the Bureau of Labor Statistics; therefore, no institutional review board approval was required.
Footnotes
See also Stein and Remington, p. 23.
REFERENCES
- 1.Cosby AG, Neaves TT, Cossman RE et al. Preliminary evidence for an emerging nonmetropolitan mortality penalty in the United States. Am J Public Health. 2008;98(8):1470–1472. doi: 10.2105/AJPH.2007.123778. [DOI] [PMC free article] [PubMed] [Google Scholar]
- 2.Haines MR. The urban mortality transition in the United States, 1800–1940. Ann Demogr Hist (Paris) 2001;101(1):33–64. [Google Scholar]
- 3.Murray CJ, Kulkarni SC, Michaud C Eight Americas: investigating mortality disparities across races, counties, and race-counties in the United States. PLoS Med. 2006;3(9):1513–1524. [Erratum in PLoS Med. 2006;3(9):1513–1524] [DOI] [PMC free article] [PubMed]
- 4.Centers for Disease Control and Prevention. Reducing potentially excess deaths from the five leading causes of death in the rural United States. MMWR Surveill Summ. 2017;66(2):1–7. doi: 10.15585/mmwr.ss6602a1. [DOI] [PMC free article] [PubMed] [Google Scholar]
- 5.James WL. All rural places are not created equal: revisiting the rural mortality penalty in the United States. Am J Public Health. 2014;104(11):2122–2129. doi: 10.2105/AJPH.2014.301989. [DOI] [PMC free article] [PubMed] [Google Scholar]
- 6.Stein EM, Gennuso KP, Ugboaja DC, Remington PL. The epidemic of despair among White Americans: trends in the leading causes of premature death, 1999–2015. Am J Public Health. 2017;107(10):1541–1547. doi: 10.2105/AJPH.2017.303941. [DOI] [PMC free article] [PubMed] [Google Scholar]
- 7.Singh GK, Daus GP, Allender M et al. Social determinants of health in the United States: addressing major health inequality trends for the nation, 1935–2016. Int J MCH AIDS. 2017;6(2):139–164. doi: 10.21106/ijma.236. [DOI] [PMC free article] [PubMed] [Google Scholar]
- 8.Case A, Deaton A. Rising morbidity and mortality in midlife among White non-Hispanic Americans in the 21st century. Proc Natl Acad Sci USA. 2015;112(49):15078–15083. doi: 10.1073/pnas.1518393112. [DOI] [PMC free article] [PubMed] [Google Scholar]
- 9.Singh GK, Siahpush M. Widening rural–urban disparities in all-cause mortality and mortality from major causes of death in the USA, 1969–2009. J Urban Health. 2014;91(2):272–292. doi: 10.1007/s11524-013-9847-2. [DOI] [PMC free article] [PubMed] [Google Scholar]
- 10.James W, Cossman JS. Long-term trends in Black and White mortality in the rural United States: evidence of a race-specific rural mortality penalty. J Rural Health. 2017;33(1):21–31. doi: 10.1111/jrh.12181. [DOI] [PubMed] [Google Scholar]
- 11.Lichter DL, Ziliak JP. The rural–urban interface: new patterns of spatial interdependence and inequality in America. Ann Am Acad Pol Soc Sci. 2017;672(1):6–25. [Google Scholar]
- 12.Centers for Disease Control and Prevention. CDC WONDER. 2017. Available at: https://wonder.cdc.gov. Accessed April 24, 2018.
- 13.US Department of Agriculture Economic Research Service. Rural–urban continuum codes. 2016. Available at: https://www.ers.usda.gov/data-products/rural–urban-continuum-codes. Accessed April 24, 2018.
- 14.Ingram DD, Franco SJ. 2013 NCHS urban–rural classification scheme for counties. Vital Health Stat 2. 2014;2(166):1–73. [PubMed] [Google Scholar]
- 15.US Census Bureau. Urban and rural. 2016. Available at: https://www.census.gov/geo/reference/rural–urban.html. Accessed April 24, 2018.
- 16.US Census Bureau. Data: county intercensal datasets: 1970–2010. 2016. Available at: https://www.census.gov/programs-surveys/popest/data/data-sets.All.html. Accessed April 24, 2018.
- 17.US Department of Agriculture Economic Research Service. County-level data sets: download data. 2018. Available at: https://www.ers.usda.gov/data-products/county-level-data-sets/download-data. Accessed April 24, 2018.
- 18.US Census Bureau. Educational attainment. Available at: https://www.census.gov/topics/education/educational-attainment/about.html. Accessed April 24, 2018.
- 19.Bureau of Economic Analysis. Regional economic accounts: download. Available at: https://www.bea.gov/regional/downloadzip.cfm. Accessed April 24, 2018.
- 20.Bureau of Economic Analysis. Regional economic accounts: methodologies. Available at: https://www.bea.gov/regional/methods.cfm. Accessed April 24, 2018.
- 21.US Census Bureau. Data: population by poverty status by counties. 2016. Available at: https://www.census.gov/data/tables/time series/dec/census-poverty.html. Accessed April 24, 2018.
- 22.US Census Bureau. Poverty: how the census bureau measures poverty. Available at: https://www.census.gov/topics/income-poverty/poverty/guidance/poverty-measures.html. Accessed April 24, 2018.
- 23.Case A, Deaton A. Mortality and morbidity in the 21st century. Brookings Pap Econ Act. 2017;48(1):397–476. doi: 10.1353/eca.2017.0005. [DOI] [PMC free article] [PubMed] [Google Scholar]
- 24.Chetty R, Stepner M, Abraham S et al. The association between income and life expectancy in the United States, 2001–2014. JAMA. 2016;315(16):1750–1766. doi: 10.1001/jama.2016.4226. [DOI] [PMC free article] [PubMed] [Google Scholar]
- 25.Rossen LM, Hedegaard H, Khan D, Warner M. County-level trends in suicide rates in the US, 2005–2015. Am J Prev Med. 2018;55(1):72–79. doi: 10.1016/j.amepre.2018.03.020. [DOI] [PMC free article] [PubMed] [Google Scholar]
- 26.Fenelon A. Geographic divergence in mortality in the United States. Popul Dev Rev. 2013;39(4):611–634. doi: 10.1111/j.1728-4457.2013.00630.x. [DOI] [PMC free article] [PubMed] [Google Scholar]
- 27.Lawrence E, Hummer RA, Harris KM. The cardiovascular health of young adults: disparities along the rural–urban continuum. Ann Am Acad Pol Soc Sci. 2017;672(1):257–281. doi: 10.1177/0002716217711426. [DOI] [PMC free article] [PubMed] [Google Scholar]
- 28.Singh GK, Siahpush M, Williams SD. Changing urbanization patterns in US lung cancer mortality, 1950–2007. J Community Health. 2012;37(2):412–420. doi: 10.1007/s10900-011-9458-3. [DOI] [PMC free article] [PubMed] [Google Scholar]
- 29.Befort CA, Nazir N, Perri MG. Prevalence of obesity among adults from rural and urban areas of the United States: findings from NHANES (2005–2008) J Rural Health. 2012;28(4):392–397. doi: 10.1111/j.1748-0361.2012.00411.x. [DOI] [PMC free article] [PubMed] [Google Scholar]
- 30.Cossman JS, James WL, Cosby AG, Cossman RE. Underlying causes of the emerging nonmetropolitan mortality penalty. Am J Public Health. 2010;100(8):1417–1419. doi: 10.2105/AJPH.2009.174185. [DOI] [PMC free article] [PubMed] [Google Scholar]
- 31.Diez Roux AV. Investigating neighborhood and area effects on health. Am J Public Health. 2001;91(11):1783–1789. doi: 10.2105/ajph.91.11.1783. [DOI] [PMC free article] [PubMed] [Google Scholar]
- 32.National Advisory Committee on Rural Health and Human Services. Mortality and life expectancy in rural America: connecting the health and human service safety nets to improve health outcomes over the life course. 2015. Available at: https://www.hrsa.gov/advisorycommittees/rural/publications/mortality.pdf. Accessed April 30, 2018.


