

Abstract
Toxin–antitoxin (TA) systems are present in many bacteria and play important roles in bacterial growth, physiology, and pathogenicity. Those that are best studied are the type II TA systems, in which both toxins and antitoxins are proteins. The HicAB system is one of the prototypic TA systems, found in many bacterial species. Complex interactions between the protein toxin (HicA), the protein antitoxin (HicB), and the DNA upstream of the encoding genes regulate the activity of this system, but few structural details are available about how HicA destabilizes the HicB–DNA complex. Here, we determined the X-ray structures of HicB and the HicAB complex to 1.8 and 2.5 Å resolution, respectively, and characterized their DNA interactions. This revealed that HicB forms a tetramer and HicA and HicB form a heterooctameric complex that involves structural reorganization of the C-terminal (DNA-binding) region of HicB. Our observations indicated that HicA has a profound impact on binding of HicB to DNA sequences upstream of hicAB in a stoichiometric-dependent way. At low ratios of HicA:HicB, there was no effect on DNA binding, but at higher ratios, the affinity for DNA declined cooperatively, driving dissociation of the HicA:HicB:DNA complex. These results reveal the structural mechanisms by which HicA de-represses the HicB–DNA complex.
Keywords: structural biology, X-ray crystallography, DNA-binding protein, protein-protein interaction, bacterial toxin, antibiotic resistance, conditional cooperativity, HicAB, persistence, toxin–antitoxin system, type II TA system
Introduction
Toxin–antitoxin (TA)3 systems are found in a wide range of bacteria, and the best studied are the type II TA systems, where both the toxins and the antitoxins are proteins. Type II TA systems are structurally and functionally diverse, with 14 separate families classified by either three-dimensional structure or mode of action (see Refs. 1–3 for recent reviews). The operons for these systems are typically organized so that the antitoxin precedes the toxin encoding gene. Although the functions of TA systems are not fully clarified, they are known to play roles in postsegregational killing and abortive infection (cell death prior to bacteriophage replication). They have also been proposed to play roles in the formation of metabolically quiescent persister cells, which can survive exposure to otherwise supra-lethal doses of antibiotic, and subsequently grow when the antibiotics are removed (1, 4–6). However, the evidence for a role of TA systems in persister cell formation is controversial (7–9).
Different toxins have different molecular targets in the cell and are able to modify functions such as transcription, translation, or DNA replication (2, 10, 11), leading to growth arrest. The action of the toxin can be blocked after binding by the cognate antitoxin (1, 12). Protein antitoxins characterized to date consist typically of two recognition sites, one involved in toxin binding and the other in DNA binding. Monomeric and multimeric forms of both toxins and antitoxins can exist in solution and higher order complexes have been reported (2, 12).
A range of factors determine the relative levels of toxin and antitoxin in the cell. Compared with toxins, antitoxins are generally sensitive to degradation by proteases, including Clp and Lon (13, 14). In addition, there are interactions between the promoter region of the TA operon and the antitoxin or the toxin–antitoxin complex that regulates transcription. These interactions differ depending on the TA system (1, 15).
A prototypic model, describing regulation of the operon, indicates that antitoxin alone binds weakly to the promoter region. However, introduction of the toxin can modify the DNA-binding affinity of the antitoxin in a concentration-dependent fashion (15, 16). At low toxin:antitoxin ratios, binding is enhanced (17–26). At high toxin:antitoxin ratios the toxin acts as a de-repressor and DNA-binding affinity is reduced (15, 20, 22, 27, 28). This phenomenon of TA transcription being regulated by the toxin acting as either a co- or de-repressor is referred to as conditional cooperativity (2, 16). Aside from DinJ–YafQ (29) and MqsRA (30), the majority of TA systems are believed to display conditional cooperativity.
The HicAB system is widely distributed in a range of bacteria, and there is evidence that the toxins are RNases (31–33). We have previously studied the HicAB system in Burkholderia pseudomallei, a pathogen found in tropical regions of the world (34) which frequently causes chronic or latent infections of humans (35). The B. pseudomallei HicAB system plays a role in regulating the frequency of persister cells and may therefore play a role in disease (36). Recently, a truncated version of the HicAB complex from a different bacterium, Yersinia pestis, was solved by X-ray crystallography, and biochemical studies provided direct evidence of HicA3 acting as an mRNase and HicB3 as a autoregulatory DNA binder (33). The HicAB system from Escherichia coli has also been studied, and an excess of HicA shown to de-repress a HicB–DNA complex and restore transcription of HicB (37).
The X-ray structures of complexes representing many TA classes have been solved but to date there have been few examples of complexes representing the fully de-repressed state (15, 38). In particular, an atomic level description of how HicA destabilizes the HicB–DNA repressor complex has not been reported. Here we report the X-ray structures of the B. pseudomallei HicB and the HicAB complex and the characterization of their DNA interactions. Together these results reveal the structural mechanisms by which HicA de-represses the HicB–DNA complex.
Results
Structure determination of HicB
Purified HicB (sequence in Fig. 1A; Table S1) formed a tetramer (Fig. S1) and yielded crystals that diffracted to 1.8 Å (Table S2). Crystals of a mutant of HicB with two methionine substitutions (HicB-I51M/I99M) (33) incorporating selenomethionine, diffracted to 3 Å which yielded a partial model. To assist in finding a molecular replacement (MR) solution, we also purified a HicB N-terminal domain (N-domain) construct (HicB-NT, residues 1–86 lacking the C-terminal domain (C-domain)) (Fig. S2) and crystals diffracted to 1.5 Å. Using a combination of these datasets the complete structure of HicB was solved by molecular replacement and exists as a tetramer (Fig. 1B and Table S3). Each subunit consists of the N-domain (Met-1–Leu-85), a linker region (Ser-86–Glu-93) and a C-domain (Arg-94–Lys-135) (Fig. 1C). The N-domain adopts an antiparallel β1β2β3α1α2α3β4 fold (Fig. S2) where the central helix α1 (Ile-32–Leu-53) lies within a cleft formed by β1β2β3 strands. The C-domain adopts a ribbon-helix-helix (RHH) (β5α5α6) motif that forms a strand-swapped dimer with a partner C-domain. This occurs at two sites between subunits 1/3 and 2/4, forming two intact RHH domains (Fig. 1B). The tetramer has a single 2-fold symmetrical axis with dimerization interfaces between adjacent N- and C-domains. The subunits of HicB can adopt one of two different configurations where the N-domain α1 helices are either sequestered and lie parallel to the C-domains (subunits 1 and 4) or are solvent exposed and orient perpendicularly to the C-domains (subunits 2 and 3) (Fig. 1D and Fig. S3, A and B). This nonsymmetrical arrangement leads to two distinct sets of hydrophobic and electrostatic interactions between the N- and C-domains (Fig. S3C). N-domains of subunits 1 and 4 interact with the C-domains of subunits 2 and 3, respectively, via principally electrostatic interactions, whereas the reverse set of interactions (e.g. N-domain of subunit 2 with C-domain of subunit 4) employ predominantly hydrophobic interactions. The interface between adjacent RHH domains is comprised of only alanine residues 109 and 112 and histidine 115 that also provide little interaction. This arrangement creates two dimeric C-domains that interact minimally with each other and the N-domains (Fig. 1D).
Figure 1.

Crystal structure of HicB. A, sequence of B. pseudomallei HicB and comparison to the closest structural homologue, HicB3 from Y. pestis. Symbols indicate a conserved residue (*), conservative mutation (:), and a semi-conservative mutation (.). Underlined C-terminal residues were deleted in the His6-tagged construct of HicB used in this study. B, the tetrameric crystal structure of HicB with subunits highlighted and dimerization interfaces at both the N-terminal and C-terminal across adjacent subunits. C, single subunit of HicB with secondary structure elements labeled. D, HicB tetramer with the C-terminal domains rendered with a solid surface and residues at the interfaces between C-terminal pairs are annotated.
HicA binding drives conformational rearrangement from a closed to an open form of HicB
A HicAB complex (Fig. S4) was prepared and crystals diffracted to 2.5 Å from which the structure was solved via MR (Table S3). The asymmetrical unit of the HicAB complex contains four HicA and four HicB protomers arranged as a 222 symmetrical heterooctamer (Fig. 2A) with four identical HicA interaction sites at the N-domains of HicB. The positively charged face of the β-sheet of HicA binds to the α1 helix and β3 strand of HicB (Fig. 2B). In the complex, the dsRNA-binding domain-like fold of the HicA monomer is retained. However, the β1-β2 loop, which includes the functionally important residues Gly-22 and His-24 in the WT HicA, is buried and projects toward a polar pocket on HicB formed by Ser-27, Asn-38, and Phe-41 (Fig. 2C). A complete list of interactions between the two proteins is given in Table S4.
Figure 2.

The HicAB heterooctameric complex. A, cartoon representation of the HicAB heterooctamer where HicA (red) binds to the N-terminal domain of each HicB subunit (blue, pink, green, and yellow). B, HicA (red) has a triple stranded β-sheet that interacts with the α1 helix of HicB (blue). C, the functionally important residue His-24 (H24A in the crystal structure) is predicted to project into a polar pocket formed by Ser-27, Glu-41, and Asn-37 of HicB. D, cartoon representation of new interaction sites across the HicB tetramer. Box 1 highlights the new internal hydrophobic network formed because of the rotation of Leu-85 and Leu-88 to interact with Ile-22, Ile-43, Val-47, and Val-83 within subunit 1 of HicB (blue). Box 2 indicates new intersubunit interactions between adjacent subunits (1 and 3) of HicB (blue and green). Pro-100 and Phe-102 form hydrophobic contacts to Ile-22, Ile-43, Val-47, Val-57, and Val-83, whereas Glu-58 interacts with Lys-106. Because of the symmetrical nature of HicB within the heterooctamer, these interactions sites are conserved between subunits of HicB. This is highlighted for HicB subunit 2 (Boxes 3 and 4).
The conversion of the HicB tetramer to the higher symmetry HicAB heterooctamer requires extensive conformational rearrangements that generate a more open conformation (Fig. 2A). These conformational rearrangements are most marked for subunits 1 (blue) and 4 (yellow) of HicB that undergo a domain rearrangement to flip the α1 helix from a sequestered conformation into an exposed conformation that can bind HicA. Conversely, helix α1 which is already partially solvent exposed in subunits 2 (pink) and 3 (green) of HicB undergoes a smaller 2.4 Å lateral displacement (Fig. 3A).
Figure 3.
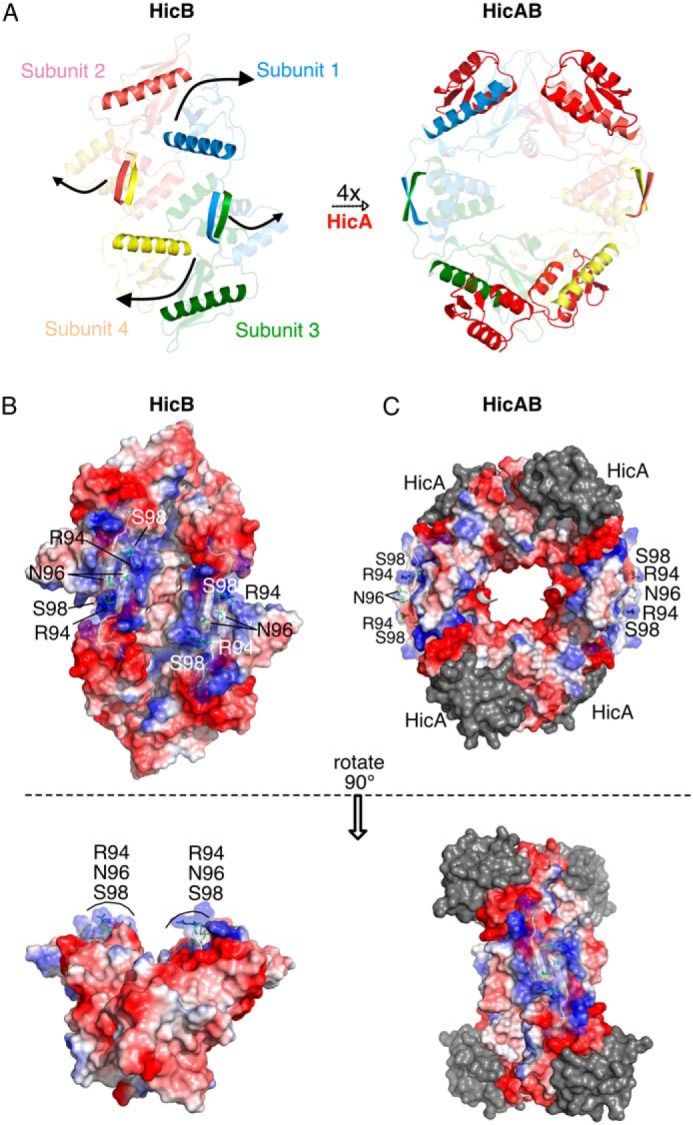
Conformation rearrangements induced by HicA binding and forming the complex HicAB. A, HicA (red) interacts with the α1 helix of each subunit of HicB (highlighted blue, pink, green, and yellow) in the unbound conformation to form the heterooctameric HicAB complex (PDB ID: 6G26), with β5 strands of HicB also highlighted to illustrate their rotation upon complexation. B, surface representation of HicB showing clustering of positive charges on one face mapped to Arg-94, Asn-96, and Ser-98 of the C-terminal domain of HicB. C, surface representation of HicAB highlighting perturbation of the positively charged patch of the C-terminal domain (Arg-94, Asn-96, and Ser-98) because of rotation of the two RHH domains. HicA is represented as gray to emphasize the surface charge of HicB.
The displacement of the α1 helix in subunits 1 and 4 requires a reshuffling of packing interactions within the N-domains and the interface to the C-domain (Fig. 2D). For example, the electrostatic interactions that tethered the N-domain of subunit 1 to the C-domain of subunit 2 (Fig. S3C) are lost. These are replaced by a hydrophobic network between N-domain residues Ile-51, Val-57, Phe-59, and Pro-92 and Pro-100/Phe-102 of an intersubunit C-domain (Fig. 2D). Supplementary ionic interactions between adjacent subunits, e.g. Glu-58–Lys-106 form additional intersubunit interactions to stabilize the symmetrical conformation of HicB. In the complex, Leu-85 rotates 60°, breaking the tethering interaction to the C-domains of subunit 1 and 4 (Pro-100 and Phe-102) that were present in free HicB (Fig. S3C). Leu-85 is instead drawn into an intrasubunit hydrophobic network (Ile-22, Ile-43, Val-47, Val-57, and Val-83) with the N-domain (Fig. 2D) which stabilizes the open conformation. Similarly, Leu-88 rotates into an empty pocket created by the 2.8 Å shift of Glu-48 that now forms a salt-bridge with Arg-19 of HicA (Fig. 2B). This movement breaks the Leu-88–Phe-102 interaction between adjacent subunits in free HicB.
The loss of these packing interactions allows the HicB C-domains to rotate outward in HicAB (Fig. 3A) without any significant rearrangements within the C-terminal domains themselves (hydrophobic packing is 80% conserved within the C-domains between HicB and HicAB). Residues from the C-terminal helix (Arg-124 and Leu-127) form new intrasubunit interactions with residues Phe-59, Asp-84, Ser-86, and Gln-87 from the N-domain.
Analysis of the surface charge distribution for HicB revealed a clustering of positive charge on each of the RHH C-domains (Fig. 3B). In the free form the C-domains are oriented in such a way as these clusters align to form an extended positively charged patch. When viewed from a 90° rotated angle this patch can be seen to encompass an obvious groove at its center. In the HicAB structure, however, these domains reorient to move these clusters of charges to opposite sides of the HicAB complex, breaking the positively charged patch apart (Fig. 3C).
Small angle X-ray scattering (SAXS) was employed to confirm the solution structure of HicB. The shape envelope of HicB fitted the crystal structure of the tetrameric form of HicB (Fig. 4A) (statistics given in Table S5, χ2 = 1.98). These results confirm that HicB is a tetramer in solution. By contrast, the symmetrical HicB tetramer component from the HicAB complex gave a poor fit (χ2 = 8.94, Fig. S5A) to this envelope. SAXS data collected on the HicAB complex generated a shape envelope that could accommodate the symmetrical HicB tetramer component of the HicAB crystal structure (Fig. 4B, χ2 = 2.89). Conversely, the reverse analysis showed that the HicB tetramer could not be fitted to the SAXS shape envelope of the HicAB complex (Fig. S5B, χ2 = 8.06). These results support our crystallographic data that the HicB to HicAB transition involves substantial conformational changes in both the crystal and solution forms.
Figure 4.

Small angle X-ray scattering of HicB and HicAB. A, ab initio modeling of the crystal structure of the tetrameric form of HicB into the shape envelope of HicB (white), with each subunit of HicB appropriately colored blue, pink, green, and yellow. The FoXS profile of the proposed scattering profile for the crystal structure (red) against the experimental raw scattering data (black) is underneath (χ2 = 1.98). B, ab initio modeling of the HicB component of the HicAB crystal structure into the shape envelope of HicAB (white), with the corresponding FoXS profile underneath (χ2 = 2.89).
HicB binds a symmetry DNA motif in the hicAB operon promoter region
Electrophoretic mobility shift assays (EMSA) were applied to investigate whether multimers of HicB or HicAB bound to synthetic oligonucleotides upstream of hicAB (Fig. S6, A and B). This revealed a binding region for HicB (S1–2) 17–36 bp upstream of the start codon (Fig. 5A). This region contained a single palindromic sequence containing two sites (S1 and S2) spanning −24 to −19 (ACACA) and −34 to −29 (TGTGT). HicB-NT lacking the C-terminal RHH domain did not bind (Fig. S6C). Mutating nucleotides within the palindromic sequence from ACACA (S1) to AGGGA (MS1) or TGTGT (S2) to TCCCT (MS2) also abolished binding of these oligonucleotides to HicB (Fig. S6D).
Figure 5.

Overview of HicB binding to S1–2. A, overview of the hicAB operon. The palindromic region within the upstream region of hicAB that binds HicB. S1 and S2 are highlighted in red and blue. CRP, cAMP receptor protein. B, quantification of HicB binding to HEX–S1–2. Samples contained 7.5 nm HEX–S1–2 in DNA-binding buffer. The proportion of HEX–S1–2 bound by increasing concentration of HicB was followed (n = 1). Data of three independent repeats were fit to Equation 2. C, quantification of HicA/HicB binding to HEX–S1–2 (n = 1) at HicA:B 0.5:1. Again three repeats were fit to Equation 2. D, quantification of HEX–S1–2 binding to HicAB at 1.2:1 for three independent repeats (n = 1). Data were fit to Equation 2. E, quantification of HicA binding to a preformed complex of HicBM (40 nm) with HEX–S1–2 (7.5 nm) corresponding to 80% bound, HicB refers to the monomer concentration of HicB. The proportion of substrate displaced by increasing concentrations of HicA was calculated for three independent repeats via Equation 3 with a Hill coefficient of 2.6. For each experiment the mean value is plotted with error bars representing the S.E. Standard errors of Kd values were calculated in GraphPad Prism.
Binding of fluorescently labeled S1–2 (HEX–S1–2) to HicB was also measured using fluorescence anisotropy (FA) (Fig. 5B) and the Kd determined to be 3.0 ± 0.4 nm. We did not detect binding of HicB-NT or HicA to DNA (Fig. S6, F and G).
In the presence of sub-stoichiometric ratios of HicA (HicA:HicB 0.5:1) the Kd was broadly similar (1.9 ± 0.2 nm) (Fig. 5C) to the Kd of HicB alone. However, when the HicA:HicB ratio was increased to greater than one (1.2:1), the titration did not reach saturation and the Kd was estimated to be in excess of ∼0.4 μm (Fig. 5D). When HicA was titrated into a preformed complex of HicB–HEX–S1–2 (80% bound), we observed dissociation of HicB from the DNA at HicA:HicB >1 (IC50 = 63.5 ± 0.9 nm; Hill coefficient = 2.6) and full dissociation of the HicB–DNA complex was observed after the addition of ∼300 nm HicA (Fig. 5E). The dissociation curve showed a sigmoidal dependence on the concentration of HicA indicative of a cooperative binding mechanism. The presence of free DNA at excess HicA:HicB ratios was also observed by EMSA (Fig. S6E).
The concentration of positively charged and polar groups on the RHH C-terminal domains of HicB (Fig. 3B) suggested that these residues might be involved in DNA binding. Purified HicB variants with R94A, R94E, N96A, N96Q, S98A, and S98T mutations were tetrameric and bound to HicA. Compared with WT HicB, gel shift assays for R94A, R94E, N96A, and S98A all showed loss of binding to S1–2 DNA (Figs. S7 and S8). Mutants N96Q and S98T both showed a marked reduction in binding (Fig. S8D).
Discussion
In this study we have solved the high-resolution X-ray structures of B. pseudomallei HicB and the complete complex of HicAB. The PISA server (39) confirmed the HicB oligomeric state (Table S6) and the dimerization interfaces within the tetramer were specific to HicB family members, with minor similarity to a putative RNA-binding protein (Table S7). DALI (40) also calculated structural similarity with other HicB family members, including putative antitoxin structures, but not non-HicB type 2 antitoxins (Table S8). HicB resembled several RNA-binding proteins and endoribonuclease/helicases, consistent with the observation that HicB contains a partially degraded RNase H fold and a DNA-binding domain (32). The PISA server also confirmed the HicAB oligomeric state (Table S9) and that the HicAB interface was specific to HicAB family members (Table S10). Our model supports the previous findings that Y. pestis HicB3 (33) binds to HicA3 and buries functionally essential residues of the toxin (Fig. S9). This may indicate a general mechanism for HicA recognition by HicB. A recent study has reported the HicBA crystal structure from Streptococcus pneumoniae and this also supports this mechanism (41). Although this complex is also heterooctameric, the authors did not observe the open conformation that we report here.
Our work also provides new insight into HicB recognition of DNA. The palindromic DNA binding sites (S1–2) we have identified overlap with the predicted −10 sequence and cAMP receptor protein (CRP)–binding sites (Fig. 5). The DNA-binding sites we have identified are distinct from those previously seen in studies with E. coli HicAB and show that HicB from different species can recognize different DNA motifs. A single promoter has been experimentally mapped to a similar upstream region of hicA3B3 in Y. pestis. However, we cannot exclude the possibility of a second promoter, as suggested upstream of E. coli hicAB (37). We have shown that residues in the RHH motif (β5) of the C-terminal domain (Arg-94, Asn-96, and Ser-98), which form a contiguous positively charged patch in the unbound conformation of HicB (Fig. 3B), are important for DNA recognition. FA and EMSA experiments (Fig. 5 and Fig. S6) reported similar results, although it was not possible to quantify the unbound and bound DNA components in EMSA because of the observed streaking of some HicB–DNA complexes. The RHH motif is also present in DinJ, FitA, and RelB antitoxins (29, 38, 42). A structural comparison revealed direct conservation of the proximal basic residue of the β strand (Arg-94) and Asn-96. Arg-94, Asn-96, and Ser-98 have Lys-95, Asn-97, and Thr-99 counterparts in HicB3 suggesting their more general importance (Fig. S10).
The broad mechanism by which HicB binding to DNA is modulated by HicA has been observed previously. EMSA data show that an excess of E. coli HicA resulted in the dissociation of E. coli HicB from DNA (37). In our distinct system, where HicB contains a different DNA-binding motif, we observe a similar phenomenon. We have, however, now elucidated at a molecular level how sufficiently high concentrations of HicA attenuate HicB:DNA interactions by stabilizing a rearranged conformation of HicB that binds DNA weakly. Whereas the free HicB tetramer contains two RHH domains that are oriented to contact S1 and S2 sites of the palindromic DNA sequence, the RHH domains are separated by 70 Å in the heterooctamer and cannot make the necessary simultaneous interactions with both S1 and S2 to achieve strong DNA binding.
Our structural and functional data and related functional data for HicAB from E. coli and Y. pestis showed that HicA binding decreased the affinity of HicB for DNA (37, 41). However, in the case of HicAB from S. pneumoniae (41) HicA appeared to induce a modest increase of HicB:DNA-binding affinity (Kd 8 μm for HicB:DNA, 4 μm HicAB:DNA) inferring that HicA acts as a co-repressor rather than a de-repressor. Because no free HicB structure has been reported for S. pneumoniae (41), and the Y. pestis HicAB structure lacked the C-terminal DNA-binding domains (33) (Fig. S9), the conformational changes induced by HicA cannot be elucidated. The two high-resolution structures presented herein delineate the conformational changes in HicB that modulate DNA binding.
Conditional cooperativity has been demonstrated in a number of systems where there are multiple antitoxin-binding sites within the regulatory regions of DNA (15, 16, 20, 27, 28). Three distinct molecular mechanisms have been proposed to explain conditional cooperativity: steric exclusion between nonrepressing TA complexes; low–high affinity switches of toxin–antitoxin interaction sites; and allosteric communication between antitoxin domains (16). The RelBE system operates via a steric exclusion mechanism where free toxin can compete with a high-affinity toxin/antitoxin–DNA complex (Fig. 6A) (24, 38). In contrast, in the Phd–Doc (15) (Fig. 6B) and CcdAB (27) systems, when the antitoxin is in excess it binds both high- and low-affinity sites on the toxin. However when the toxin is in excess, only high-affinity–binding sites are occupied by the antitoxin that results in conditional cooperativity as the DNA–TA complex is disrupted. Phd (antitoxin) binding to the target operon is also allosterically regulated by the toxin Doc by forming a more structured DNA-binding domain upon association with sub-stoichiometric ratios of Doc (15, 43).
Figure 6.

Overview of de-repression models for RelBE, Phd–Doc, DinJ–YafQ, MqsRA, and HicAB. The toxin is highlighted in red and the antitoxin in blue, whereas DNA-binding sites are represented by half arrows. A, the RelB2 dimer or RelB2E complex can bind to one of the two adjacent DNA operator sites, but it is proposed that the formation of a W-shaped heterohexameric complex (RelB2E)2 may occupy both adjacent DNA operator sites simultaneously to confer full transcriptional repression of the relBE operon. Excess toxin (RelE) binds a second site of a RelB dimer forming a rigid RelB2E2 heterotetramer, two heterotetramers that cannot simultaneously bind both operator sites because of steric hindrance resulting in transcriptional de-repression. Transcription of the relBE operon returns RelB and RelE to stoichiometric levels (≠ 1:1). B, Doc forms a heteropentameric complex with Phd (Phd2-Doc-Phd2) by binding to Phd2 via low (L) and high (H) affinity sites to confer full repression of the phd-doc operon by binding two operator sites. Doc allosterically regulates Phd to form a structured DNA-binding domain to ensure full transcription repression only occurs upon formation of a Phd–Doc complex. An excess of Doc preferentially binds Phd solely through H sites resulting in the formation of a rigid heterotetramer (Doc-Phd2-Doc) that cannot occupy both operator sites because of steric clashes between adjacent heterotetramers. C and D, in contrast both DinJ–YafQ (C) and MqsRA (D) do not follow the model of conditional cooperativity, as both toxins act as de-repressors rather than co-repressors. C, DinJ2 fully represses its operator via a single palindromic site. Addition of YafQ forms a YafQ-DinJ2-YafQ heterotetrameric complex, but an excess does not result in de-repression of the DinJ/YafQ–DNA complex and the de-repression mechanism is unknown. D, likewise, MqsA fully represses in the absence of MqsR. Excess MqsR competes with an overlapping DNA-binding site of MqsA (highlighted in red) and formation of a proposed heterotetrameric MqsRA complex results in de-repression (the published MqsRA complex is a partial model). MqsA cannot simultaneously bind both MqsA and DNA. E, like MqsA and DinJ, HicB alone results in saturation of the palindromic sequences (S1–2). HicA binds the surface exposed α1 helices of subunit 2 and 3 to form an intermediate HicA2HicB complex that does not result in an increase of affinity to S1–2. At concentrations of HicA >HicB, there is binding of a further two HicA molecules that results in the 90° rotation of the ribbon-helix-helix motifs and prevents binding to the palindromic sequences and dissociation of HicB from DNA. The intermediate steps of this pathway are unknown and either route, or an equilibrium between the two, cannot be discounted as of present.
The HicAB system described here falls into a class of TA systems including DinJ–YafQ (29) (Fig. 6C) and MqsRA (30) (Fig. 6D) where antitoxin binds to one or two operator sites but these are not individually or cross-stabilized by toxin. Less is known about the mechanism of de-repression or the fully de-rerepressed state in these cases. In the DinJ–YafQ system, the toxin YafQ has no influence on DinJ-binding affinity for DNA and the mechanism for dissociation is currently unknown. MqsRA on the other hand appears to operate under what has been termed a simplified conditional cooperativity model. Here the toxin is not a co-repressor but does act as a de-repressor, therefore ensuring that excess toxin is still effectively countered at the transcriptional level (16). The MqsRA operator contains two palindromic regions, each of which can independently bind an MqsA dimer. There is however no stabilizing interaction with MqsR and instead MqsR acts as a de-repressor because of overlap of the MqsR and DNA-binding sites on MqsA (30). In the case of HicAB, sub-stoichiometric levels of HicA have no discernible effect on DNA binding. In contrast, an excess of HicA causes dissociation of the HicB–DNA complex through a large-scale conformational reorganization of HicB to form a heterooctameric complex (Fig. 6E). The competitive mechanism for DNA binding is similar to other related systems (30), but we have shown de-repression is cooperative at high concentrations of HicA. This allosteric regulation of interdomain interactions has also been proposed as a mechanism for this single-site conditional cooperativity but had not previously been experimentally demonstrated (16). Although the structures defining the two end points of this process (i.e. HicB in forms that are and are not competent to bind DNA) have been determined here, further intermediate states are likely to exist. We have for example observed HicA1–HicB4 and HicA2–HicB4 complexes by native MS (Fig. S4) and the Y. pestis HicA2–HicB4 complex has previously been observed by size exclusion chromatography (SEC) multi-angle light scattering (33). Under experimental conditions, the FA data indicate that HicB can bind two HicA molecules with little change in the affinity of HicB for DNA (Fig. 6E). Therefore, in the presence of DNA, the population of free HicA2HicB4 in the open non-DNA–binding form is low. However, in accordance with a previous study with E. coli HicAB, competition experiments monitored with EMSA were unable to confirm formation of a stable DNA–HicB4–HicA1/2 complex (37). When HicB is in an open conformation, four molecules of HicA can be accommodated. In this conformation the DNA-binding sites are separated and cannot cooperatively bind the target. Consequently, the Kd for HicB binding to DNA increases from 3 nm to 0.4 μm. Whether the HicB promoter site is occupied by HicB or not will be influenced by the balance of two effects: the affinity of the closed form of HicB to DNA versus the affinity/competition of HicA for HicB that stabilizes the open, non-DNA–binding form. Within the cell the interplay between HicB, DNA, and HicA interactions will be complex. In a typical bacterium, the DNA target is at an effective concentration of ∼1–2 nm (44) and on the order of the HicB–DNA dissociation constant (3 nm). At the point at which the pool of free HicB has been largely bound as heterooctamers by HicA and approaches the concentration of DNA, a mixture of spontaneous dissociation and HicA-driven dissociation may operate. Further studies are required to determine the series of steps leading to the release of the final HicB molecule from DNA in the presence of increasing concentrations of HicA.
Experimental procedures
Protein expression, purification, and mutation
All primers are given in Table S11. hicB (B. pseudomallei) was cloned from K96243 genomic DNA with HicB_FL primer 1 and 2 and subcloned into pOPINE vector (pOPINE–HicB_FL) before transformation into E. coli T7 Express cells. Cultures were grown to OD = 0.6 in LB media (37 °C) and induced (0.3 mm isopropyl β-d-1-thiogalactopyranoside) at 16 °C (16 h). Harvested cells were sonicated (50 mm Tris-HCl, 0.5 m NaCl, 10% (v/v) glycerol, pH 8.0) and purified by immobilized metal affinity chromatography (IMAC) and SEC (HiLoad Superdex 75, 25 mm Tris-HCl, 150 mm NaCl, pH 7.5) (Fig. S1, E and F). Secondary structure calculations predicted a stretch of disordered amino acids at the C terminus and a construct lacking 135VRHA138 was designed (HicB) as well as a construct containing only the N-terminal residues (1–85) (HicB-NT) and both were amplified from K96243 genomic DNA using appropriate primers and subcloned into pOPINE (pOPINE–HicB and pOPINE–HicB-NT). The pOPINE–HicB plasmid was used to generate HicB_DM using mutagenic primers I51M and I99M.HicB R94A, N96A, S98A, and N96Q genes were synthesized (Thermo Scientific), cloned into pOPINE, and also used to subsequently generate R94E and S98T. pOPINE–HicB_DM was transformed into E. coli B834 and cultures grown in SelenoMethionine Nutrient Base supplemented with SelenoMethionine Nutrient Mix and 40 mg/L selenomethionine (Molecular Dimensions) at 37 °C to OD = 0.6, followed by addition of 20 mg/L selenomethionine and induction (isopropyl β-d-1-thiogalactopyranoside 0.3 mm, 16 h, 25 °C). Purification buffers were supplemented with 2 mm TCEP.
The HicA (H24A) B. pseudomallei mutant bearing an N-terminal His6-tag and a tobacco etch virus cleavage site (ENLYFQ) construct was generated by Thermo Fisher and subcloned into a pET151-D/TOPO plasmid and HicA expressed and purified (36).
Crystallization and data collection
Crystallization conditions for HicB, HicB_DM, HicB-NT, and HicAB are given in Table S2. Diffraction data were recorded from cryo-cooled crystals (100 K) at the Diamond Light Source Synchrotron in Oxford (i03 and i04). Data were processed and integrated using XDS (45), Xia2 (46) and further analyzed using Phenix (47).
Structure determination and refinement
HicB_FL crystals diffracted to 4 Å despite optimization. Crystals of HicB diffracted to 1.8 Å but could not be solved using MR. HicB_DM diffracted to 3 Å and a partial structure of the P212121 crystal of selenomethionine incorporated HicB–I51M/I99M was determined by single-wavelength anomalous diffraction. Identification of heavy atoms sites, the resulting phase calculations, and building of an initial model were determined by Crank2 (48), REFMAC5 (49), and Buccaneer (50). Iterative rounds of manual model building and refinement were carried out using Phenix and Coot (51). HicB-NT (P212121) was solved via MR and the Autobuild Pipeline in Phenix (52) using the partial model derived from HicB_DM followed by manual refinement using Coot and REFMAC.
The structure of HicB (P41) was determined by MR (Phaser) using the HicB_NT structure and C-terminal domains were manually built. The HicB model comprises 1–131 residues of the native sequence.
The structure of HicAB was also solved via MR. MOLREP (53) identified high-contrast solutions for the two C-domain dimers with rotation peaks 1 (5.74σ) and 5 (4.45σ). Fixing the C-domains allowed four N-domains of HicB to be located when 200 rotation peaks were used in the translation search (MOLREP option NP = 200). The four correct rotation peaks were 5, 10, 162, and 4 in the list. Four copies of a single chain of HicA (PDB ID: 4C26) were positioned into the resulting electron density using the spherically averaged phased translation function (54) and phased translation function implemented in MOLREP. The 4-fold NCS averaging in DM (55) was used for phase improvement of HicAB structure with masks and NCS operators calculated separately for HicA and each domain of HicB. Density modification phases were input for phase refinement (56) in REFMAC5 (49). Resulting electron density maps allowed building of the hinge regions of HicB monomers in Coot.
Mass spectrometry
For native electrospray ionization (ESI) MS, 20 μm samples of HicB were dialyzed in 100 mm ammonium acetate. Nano-ESI experiments were performed on a Synapt G2-Si (Waters) using acquisition parameters adapted from Ref. 57. Complexes of HicAB were formed by mixing appropriate ratios of HicA and HicB, then dialyzed in 100 mm NH4Cl, and analyzed as described for HicB.
Analytical size exclusion chromatography
HicAB was pre-formed at 50 μm and incubated at 25 °C (1 h) and analyzed with a calibrated (58) Superdex 75 10/300 GL pre-packed column (Table S12).
Small angle X-ray scattering
In line SEC-SAXS for HicB and HicAB were collected at Beamline 21, Diamond Light Source, using an Agilent 1200 HPLC and 2.4 ml Superdex S200 column (Table S5). 50 μl of protein at an appropriate concentration was loaded (0.04 ml/min) onto an equilibrated S200 column (25 mm Tris-HCl, 150 mm NaCl, pH 7.5). Frames were collected at 3 s per frame, 25 °C. X-ray scattering was recorded (Pilatus 2M detector) with a fixed camera length of 4.014 m, at 12.4 keV. Angular range q data were collected between 0.006 and 0.042 Å−1. ScÅtter (www.bioisis.net)4 (68) determined the radius of gyration (Rg), the maximum particle dimension (Dmax), and the pair distribution function (P(r)) (59, 60). Ab initio bead density shape envelope models for HicB and HicAB were generated by DAMMIF (61), averaging 23 independent runs using the program DAMAVER, before a single DAMMIN run refinement (62). Ab initio bead density shape envelope models were aligned to both ab initio models and crystal structures using SUPCOMB (63). FoXS (64) was used to compare the calculated X-ray scattering of crystal structures with the experimental scattering profile of each protein. Experimental SAXS data and derived models of both HicB and HicAB have been deposited in the Small Angle Scattering Biological Data Bank (SASBDB) (65) with the accession codes SASDD45 and SASDD55.
DNA-binding assays
Gel shift assays were carried out with specific annealed pairs of oligonucleotides (Integrated DNA Technologies) and serial dilutions of protein. For determination of the DNA-binding region, 12.8 μm HicBM (3.2 μm tetramer concentration) was equilibrated at room temperature with 3 μm DNA for 30 min in 25 mm Tris, 100 mm NaCl, 10% glycerol; loaded onto a 10% Tris-acetate-EDTA gel (66) in 1× TAE buffer; run at 100 V (1 h, 16 °C); and de-stained in ethidium bromide in 1× TAE buffer. For stepwise binding between the 0–20 and 0–40 fragments, the mixture was loaded onto a 15% TAE gel. For all other gel-shift assays, serial dilutions of HicB and appropriate constructs (0.8–3.2 μm) were equilibrated (25 °C) with 2 μm 17–36 dsDNA (S1–2) (30 min) before loading onto a 10% TAE gel. HicA depression of HicB.S1–2 complex involved challenging a mixture of tetrameric HicB (3.2 μm) bound to S1–2 DNA (2 μm) with increasing concentrations of HicA (0.8–50.8 μm).
Fluorescence anisotropy
Fluorescence equilibrium titrations were performed (Jobin Yvon Fluorolog, Horiba Scientific) to determine the dissociation constants (Kd) for HicB, HicAB, HicA, and HicB-NT binding at 20 °C to S1–2 (5′-ATGTGTATAATTACACACAA-3′) which harbored the fluorescence dye HEX at the 5′-end (7.5 nm). The excitation wavelength was set at 530 nm and the emission intensity set at 554 nm. Slit widths were set to 5.0 nm for both excitation and emission. Following sample equilibration for 2 min, three data points with an integration time of 0.5 s were collected for each titration point. Anisotropy was determined by Equation 1.
| (Eq. 1) |
Titrations were performed in 25 mm Tris-HCl, 100 mm NaCl, pH 7.5, in a total volume of 200 μl in a 10 × 2 mm quartz cuvette (Hellma Analytics). HicB, HicAB, and HicB-NT were titrated into HEX–S1–2 up to 150 nm. HicA was titrated until an end point of 1000 nm. For competition assays, a preformed HicB (40 nm)–S1–2 (7.5 nm) complex (80% bound) (67) was formed before the addition of HicA to a final concentration of 300 nm.
Data fitting
Data were fitted to a single-component binding equation to determine the dissociation binding constant Kd using GraphPad Prism 7.04, as in Equation 2.
| (Eq. 2) |
Where ADP is the anisotropy of the fully bound HicB–S1–2 complex, AD is the anisotropy of unbound S1–2, n is the stoichiometry and [X] is the concentration of protein. For competition assays involving HicA, data were fitted to a four-component inhibition equation to determine the IC50 value via Equation 3.
| (Eq. 3) |
Where A is the measured anisotropy, AD is the anisotropy of free S1–2, ADP is the anisotropy of the saturated HicB–S1–2 complex, [HA] is the concentration of HicA, H is the Hill slope.
The atomic coordinates of HicB-NT, HicB, and the HicAB complex have been deposited to the Protein Data Bank under accession codes: PDB IDs 6G1C, 6G1N, and 6G26, respectively. Experimental SAXS intensities of HicB and HicAB are deposited in SASBDB database (accession entries SASDD45 and SASDD55).
Author contributions
A. J. W., R. W. T., and M. P. C. conceptualization; A. J. W. data curation; A. J. W., C. W., M. N. I., and M. S. D. formal analysis; A. J. W., M. N. I., H. C., M. G., P. M., O. J. W., N. J. H., and M. P. C. investigation; A. J. W., N. J. H., R. W. T., and M. P. C. writing-original draft; A. J. W., C. W., R. W. T., and M. P. C. writing-review and editing; M. S. D., R. W. T., and M. P. C. methodology; R. W. T. and M. P. C. funding acquisition; M. P. C. supervision; M. P. C. project administration.
Supplementary Material
This work was supported by the Biotechnology and Biological Sciences Research Council–funded South West Biosciences Doctoral Training Partnership Training Grant BB/J014400/1. The authors declare that they have no conflicts of interest with the contents of this article.
This article contains Figs. S1–S10 and Tables S1–S12.
The atomic coordinates and structure factors (codes 6G1C, 6G1N, and 6G26) have been deposited in the Protein Data Bank (http://wwpdb.org/).
Experimental SAXS data and derived models of both HicB4 and HicAB4 have been deposited in the Small Angle Scattering Biological Data Bank (SASBDB) under the accession codes SASDD45 and SASDD55.
Please note that the JBC is not responsible for the long-term archiving and maintenance of this site or any other third party hosted site.
- TA
- toxin-antitoxin
- DM
- density modification
- FA
- fluorescence anisotropy
- HicB_FL
- full-length HicB
- HicB-NT
- N-terminal domain of HicB
- MR
- molecular replacement
- OD
- optical density
- RHH
- ribbon-helix-helix (motif)
- SAXS
- small angle X-ray scattering
- SEC
- size exclusion chromatography
- TAE buffer
- Tris-Acetate-EDTA buffer.
References
- 1. Hall A. M. J., Gollan B., and Helaine S. (2017) Toxin-antitoxin systems: Reversible toxicity. Curr. Opin. Microbiol. 36, 102–110 10.1016/j.mib.2017.02.003 [DOI] [PubMed] [Google Scholar]
- 2. Page R., and Peti W. (2016) Toxin-antitoxin systems in bacterial growth arrest and persistence. Nat. Chem. Biol. 12, 208–214 10.1038/nchembio.2044 [DOI] [PubMed] [Google Scholar]
- 3. Lobato-Márquez D., Díaz-Orejas R., and García-Del Portillo F. (2016) Toxin-antitoxins and bacterial virulence. FEMS Microbiol. Rev. 40, 592–609 10.1093/femsre/fuw022 [DOI] [PubMed] [Google Scholar]
- 4. Lewis K. (2010) Persister cells. Annu. Rev. Microbiol. 64, 357–372 10.1146/annurev.micro.112408.134306 [DOI] [PubMed] [Google Scholar]
- 5. Gerdes K., and Maisonneuve E. (2012) Bacterial persistence and toxin-antitoxin loci. Annu. Rev. Microbiol. 66, 103–123 10.1146/annurev-micro-092611-150159 [DOI] [PubMed] [Google Scholar]
- 6. Balaban N. Q., Merrin J., Chait R., Kowalik L., and Leibler S. (2004) Bacterial persistence as a phenotypic switch. Science 305, 1622–1625 10.1126/science.1099390 [DOI] [PubMed] [Google Scholar]
- 7. Goormaghtigh F., Fraikin N., Putrinš M., Halleart T., Hauryliuk V., Garcia-Pino A., Sjödin A., Kasvandik S., Udekwu K., Tenson T., Kaladu N., and Van Melderen L. (2018) Reassessing the role of type II toxin-antitoxin systems in formation of Escherichia coli type II persister cells. MBio 9, e00640–18 10.1128/mBio.00640-18 [DOI] [PMC free article] [PubMed] [Google Scholar]
- 8. Harms A., Maisonneuve E., and Gerdes K. (2016) Mechanisms of bacterial persistence during stress and antibiotic exposure. Science 354, aaf4268 10.1126/science.aaf4268 [DOI] [PubMed] [Google Scholar]
- 9. Song S., and Wood T. K. (2018) Post-segregational killing and phage inhibition are not mediated by cell death through toxin/antitoxin systems. Front. Microbiol. 9, 814 10.3389/fmicb.2018.00814 [DOI] [PMC free article] [PubMed] [Google Scholar]
- 10. Lee K. Y., and Lee B. J. (2016) Structure, biology, and therapeutic application of toxin-antitoxin systems in pathogenic bacteria. Toxins 8, E305 10.3390/toxins8100305 [DOI] [PMC free article] [PubMed] [Google Scholar]
- 11. Cheverton A. M., Gollan B., Przydacz M., Wong C. T., Mylona A., Hare S. A., and Helaine S. (2016) A salmonella toxin promotes persister formation through acetylation of tRNA. Mol. Cell 63, 86–96 10.1016/j.molcel.2016.05.002 [DOI] [PMC free article] [PubMed] [Google Scholar]
- 12. Harms A., Brodersen D. E., Mitarai N., and Gerdes K. (2018) Toxin, targets and triggers: An overview of toxin-antitoxin biology. Mol. Cell 70, 768–784 10.1016/j.molcel.2018.01.003 [DOI] [PubMed] [Google Scholar]
- 13. Kędzierska B., and Hayes F. (2016) Emerging roles of toxin-antitoxin modules in bacterial pathogenesis. Molecules 21, E790 10.3390/molecules21060790 [DOI] [PMC free article] [PubMed] [Google Scholar]
- 14. Muthuramalingam M., White J. C., and Bourne C. R. (2016) Toxin-antitoxin modules are pliable switches activated by multiple protease pathways. Toxins 8, E214 10.3390/toxins8070214 [DOI] [PMC free article] [PubMed] [Google Scholar]
- 15. Garcia-Pino A., Balasubramanian S., Wyns L., Gazit E., De Greve H., Magnuson R. D., Charlier D., van Nuland N. A. J., and Loris R. (2010) Allostery and intrinsic disorder mediate transcription regulation by conditional cooperativity. Cell 142, 101–111 10.1016/j.cell.2010.05.039 [DOI] [PubMed] [Google Scholar]
- 16. Loris R., and Garcia-Pino A. (2014) Disorder- and dynamics-based regulatory mechanisms in toxin-antitoxin modules. Chem. Rev. 114, 6933–6947 10.1021/cr400656f [DOI] [PubMed] [Google Scholar]
- 17. Afif H., Allali N., Couturier M., and Van Melderen L. (2001) The ratio between CcdA and CcdB modulates the transcriptional repression of the ccd poison-antidote system. Mol. Microbiol. 41, 73–82 10.1046/j.1365-2958.2001.02492.x [DOI] [PubMed] [Google Scholar]
- 18. Wilbur J. S., Chivers P. T., Mattison K., Potter L., Brennan R. G., and So M. (2005) Neisseria gonorrhoeae FitA interacts with FitB to bind DNA through its ribbon-helix-helix motif. Biochemistry 44, 12515–12524 10.1021/bi0511080 [DOI] [PubMed] [Google Scholar]
- 19. Zorzini V., Buts L., Sleutel M., Garcia-Pino A., Talavera A., Haesaerts S., De Greve H., Cheung A., van Nuland N. A. J., and Loris R. (2014) Structural and biophysical characterization of Staphylococcus aureus SaMazF shows conservation of functional dynamics. Nucleic Acids Res. 42, 6709–6725 10.1093/nar/gku266 [DOI] [PMC free article] [PubMed] [Google Scholar]
- 20. Monti M. C., Hernández-Arriaga A. M., Kamphuis M. B., López-Villarejo J., Heck A. J. R., Boelens R., Díaz-Orejas R., and van den Heuvel R. H. H. (2007) Interactions of kid-kis toxin-antitoxin complexes with the parD operator-promoter region of plasmid R1 are piloted by the Kis antitoxin and tuned by the stoichiometry of kid-kis oligomers. Nucleic Acids Res. 35, 1737–1749 10.1093/nar/gkm073 [DOI] [PMC free article] [PubMed] [Google Scholar]
- 21. Khoo S. K., Loll B., Chan W. T., Shoeman R. L., Ngoo L., Yeo C. C., and Meinhart A. (2007) Molecular and structural characterization of the PezAT chromosomal toxin-antitoxin system of the human pathogen Streptococcus pneumoniae. J. Biol. Chem. 282, 19606–19618 10.1074/jbc.M701703200 [DOI] [PubMed] [Google Scholar]
- 22. Johnson E. P., Strom A. R., and Helinski D. R. (1996) Plasmid RK2 toxin protein ParE: Purification and interaction with the ParD antitoxin protein. J. Bacteriol. 178, 1420–1429 10.1128/jb.178.5.1420-1429.1996 [DOI] [PMC free article] [PubMed] [Google Scholar]
- 23. Magnuson R., and Yarmolinsky M. B. (1998) Corepression of the P1 addiction operon by Phd and Doc. J. Bacteriol. 180, 6342–6351 [DOI] [PMC free article] [PubMed] [Google Scholar]
- 24. Overgaard M., Borch J., Jørgensen M. G., and Gerdes K. (2008) Messenger RNA interferase RelE controls relBE transcription by conditional cooperativity. Mol. Microbiol. 69, 841–857 10.1111/j.1365-2958.2008.06313.x [DOI] [PubMed] [Google Scholar]
- 25. Maté M. J., Vincentelli R., Foos N., Raoult D., Cambillau C., and Ortiz-Lombardía M. (2012) Crystal structure of the DNA-bound VapBC2 antitoxin/toxin pair from Rickettsia felis. Nucleic Acids Res. 40, 3245–3258 10.1093/nar/gkr1167 [DOI] [PMC free article] [PubMed] [Google Scholar]
- 26. Ke¸dzierska B., Lian L. Y., and Hayes F. (2007) Toxin-antitoxin regulation: Bimodal interaction of YefM-YoeB with paired DNA palindromes exerts transcriptional autorepression. Nucleic Acids Res. 35, 325–339 10.1093/nar/gkl1028 [DOI] [PMC free article] [PubMed] [Google Scholar]
- 27. De Jonge N., Garcia-Pino A., Buts L., Haesaerts S., Charlier D., Zangger K., Wyns L., De Greve H., and Loris R. (2009) Rejuvenation of CcdB-poisoned gyrase by an intrinsically disordered protein domain. Mol. Cell 35, 154–163 10.1016/j.molcel.2009.05.025 [DOI] [PubMed] [Google Scholar]
- 28. Winther K. S., and Gerdes K. (2012) Regulation of enteric vapBC transcription: Induction by VapC toxin dimer-breaking. Nucleic Acids Res. 40, 4347–4357 10.1093/nar/gks029 [DOI] [PMC free article] [PubMed] [Google Scholar]
- 29. Ruangprasert A., Maehigashi T., Miles S. J., Giridharan N., Liu J. X., and Dunham C. M. (2014) Mechanisms of toxin inhibition and transcriptional repression by Escherichia coli DinJ-YafQ. J. Biol. Chem. 289, 20559–20569 10.1074/jbc.M114.573006 [DOI] [PMC free article] [PubMed] [Google Scholar]
- 30. Brown B. L., Lord D. M., Grigoriu S., Peti W., and Page R. (2013) The Escherichia coli toxin MqsR destabilizes the transcriptional repression complex formed between the antitoxin MqsA and the mqsRA operon promoter. J. Biol. Chem. 282, 1286–1294 10.1074/jbc.M112.421008 [DOI] [PMC free article] [PubMed] [Google Scholar]
- 31. Jørgensen M. G., Pandey D. P., Jaskolska M., and Gerdes K. (2009) HicA of Escherichia coli defines a novel family of translation-independent mRNA interferases in bacteria and archaea. J. Bacteriol. 191, 1191–1199 10.1128/JB.01013-08 [DOI] [PMC free article] [PubMed] [Google Scholar]
- 32. Makarova K. S., Grishin N. V., and Koonin E. V. (2006) The HicAB cassette, a putative novel, RNA-targeting toxin-antitoxin system in archaea and bacteria. Bioinformatics 22, 2581–2584 10.1093/bioinformatics/btl418 [DOI] [PubMed] [Google Scholar]
- 33. Bibi-Triki S., de la Sierra-Gallay I., Lazar N., Leroy A., Van Tilbeurgh H., Sebbane F., and Pradel E. (2014) Functional and structural analysis of HicA3-B3, a novel toxin-antitoxin system of Yersinia pestis. J. Bacteriol. 196, 3712–3723 10.1128/JB.01932-14 [DOI] [PMC free article] [PubMed] [Google Scholar]
- 34. Limmathurotsakul D., Golding N., Dance D. A. B., Messina J. P., Pigott D. M., Moyes C. L., Rolim D. B., Bertherat E., Day N. P. J., Peacock S. J., and Hay S. I. (2016) Predicted global distribution of Burkholderia pseudomallei and burden of melioidosis. Nat. Microbiol. 1, 1–5 10.1038/nmicrobiol.2015.8 [DOI] [PubMed] [Google Scholar]
- 35. Lewis E. R. G., and Torres A. G. (2016) The art of persistence—the secrets to Burkholderia chronic infections. Pathog. Dis. 74, ftw070 10.1093/femspd/ftw070 [DOI] [PMC free article] [PubMed] [Google Scholar]
- 36. Butt A., Higman V. A., Williams C., Crump M. P., Hemsley C. M., Harmer N., and Titball R. W. (2014) The HicA toxin from Burkholderia pseudomallei has a role in persister cell formation. Biochem. J. 459, 333–344 10.1042/BJ20140073 [DOI] [PMC free article] [PubMed] [Google Scholar]
- 37. Turnbull K. J., and Gerdes K. (2017) HicA toxin of Escherichia coli derepresses hicAB transcription to selectively produce HicB antitoxin. Mol. Microbiol. 104, 781–792 10.1111/mmi.13662 [DOI] [PubMed] [Google Scholar]
- 38. Bøggild A., Sofos N., Andersen K. R., Feddersen A., Easter A. D., Passmore L. A., and Brodersen D. E. (2012) The crystal structure of the intact E. coli ReIBE toxin-antitoxin complex provides the structural basis for conditional cooperativity. Structure 20, 1641–1648 10.1016/j.str.2012.08.017 [DOI] [PMC free article] [PubMed] [Google Scholar]
- 39. Krissinel E., and Henrick K. (2007) Inference of macromolecular assemblies from crystalline state. J. Mol. Biol. 372, 774–797 10.1016/j.jmb.2007.05.022 [DOI] [PubMed] [Google Scholar]
- 40. Holm L., and Laakso L. M. (2016) Dali server update. Nucleic Acids Res. 44, W351–W355 10.1093/nar/gkw357 [DOI] [PMC free article] [PubMed] [Google Scholar]
- 41. Kim D. H., Kang S. M., Park S. J., Jin C., Yoon H. J., and Lee B. J. (2018) Functional insights into the Streptococcus pneumoniae HicBA toxin-antitoxin system based on a structural study. Nucleic Acids Res. 46, 6371–6386 10.1093/nar/gky469 [DOI] [PMC free article] [PubMed] [Google Scholar]
- 42. Mattison K., Wilbur J. S., So M., and Brennan R. G. (2006) Structure of FitAB from Neisseria gonorrhoeae bound to DNA reveals a tetramer of toxin-antitoxin heterodimers containing pin domains and ribbon-helix-helix motifs. J. Biol. Chem. 281, 37942–37951 10.1074/jbc.M605198200 [DOI] [PubMed] [Google Scholar]
- 43. Garcia-Pino A., De Gieter S., Talavera A., De Greve H., Efremov R. G., and Loris R. (2016) An intrinsically disordered entropic switch determines allostery in Phd-Doc regulation. Nat. Chem. Biol. 12, 490–496 10.1038/nchembio.2078 [DOI] [PubMed] [Google Scholar]
- 44. Milo R. (2013) What is the total number of protein molecules per cell volume? A call to rethink some published values. Bioessays 35, 1050–1055 10.1002/bies.201300066 [DOI] [PMC free article] [PubMed] [Google Scholar]
- 45. Kabsch W. (2010) XDS. Acta Crystallogr. D Biol. Crystallogr. 66, 125–132 10.1107/S0907444909047337 [DOI] [PMC free article] [PubMed] [Google Scholar]
- 46. Winter G. (2010) xia2: An expert system for macromolecular crystallography data reduction. J. Appl. Cryst. 43, 186–190 10.1107/S0021889809045701 [DOI] [Google Scholar]
- 47. Adams P. D., Afonine P. V., Bunkóczi G., Chen V. B., Davis I. W., Echols N., Headd J. J., Hung L. W., Kapral G. J., Grosse-Kunstleve R. W., McCoy A. J., Moriarty N. W., Oeffner R., Read R. J., Richardson D. C., Richardson J. S., Terwilliger T. C., and Zwart P. H. (2010) PHENIX: A comprehensive Python-based system for macromolecular structure solution. Acta Crystallogr. D Biol. Crystallogr. 66, 213–221 10.1107/S0907444909052925 [DOI] [PMC free article] [PubMed] [Google Scholar]
- 48. Skubák P., and Pannu N. S. (2013) Automatic protein structure solution from weak X-ray data. Nat. Commun. 4, 2077 10.1038/ncomms3777 [DOI] [PMC free article] [PubMed] [Google Scholar]
- 49. Murshudov G. N., Skubák P., Lebedev A. A., Pannu N. S., Steiner R. A., Nicholls R. A., Winn M. D., Long F., and Vagin A. A. (2011) REFMAC5 for the refinement of macromolecular crystal structures. Acta Crystallogr. D Biol. Crystallogr. 67, 355–367 10.1107/S0907444911001314 [DOI] [PMC free article] [PubMed] [Google Scholar]
- 50. Cowtan K. (2006) The Buccaneer software for automated model building. 1. Tracing protein chains. Acta Crystallogr. D Biol. Crystallogr. 62, 1002–1011 10.1107/S0907444906022116 [DOI] [PubMed] [Google Scholar]
- 51. Emsley P., and Cowtan K. (2004) Coot: Model-building tools for molecular graphics. Acta Crystallogr. D Biol. Crystallogr. 60, 2126–2132 10.1107/S0907444904019158 [DOI] [PubMed] [Google Scholar]
- 52. Terwilliger T. C., Grosse-Kunstleve R. W., Afonine P. V., Moriarty N. W., Zwart P. H., Hung L. W., Read R. J., and Adams P. D. (2008) Iterative model building, structure refinement and density modification with the PHENIX AutoBuild wizard. Acta Crystallogr. D Biol. Crystallogr. 64, 61–69 10.1107/S090744490705024X [DOI] [PMC free article] [PubMed] [Google Scholar]
- 53. Vagin A., and Teplyakov A. (2010) Molecular replacement with MOLREP. Acta Crystallogr. D Biol. Crystallogr. 66, 22–25 10.1107/S0907444909042589 [DOI] [PubMed] [Google Scholar]
- 54. Vagin A. A., and Isupov M. N. (2001) Spherically averaged phased translation function and its application to the search for molecules and fragments in electron-density maps. Acta Crystallogr. D Biol. Crystallogr. 57, 1451–1456 10.1107/S0907444901012409 [DOI] [PubMed] [Google Scholar]
- 55. Cowtan K. (2010) Recent developments in classical density modification. Acta Crystallogr. D Biol. Crystallogr. 66, 470–478 10.1107/S090744490903947X [DOI] [PMC free article] [PubMed] [Google Scholar]
- 56. Pannu N. S., Murshudov G. N., Dodson E. J., and Read R. J. (1998) Incorporation of prior phase information strengthens maximum-likelihood structure refinement. Acta Crystallogr. D Biol. Crystallogr. 54, 1285–1294 [DOI] [PubMed] [Google Scholar]
- 57. Wen Y. R., Sobott F., and Devreese B. (2016) ATP and autophosphorylation driven conformational changes of HipA kinase revealed by ion mobility and crosslinking mass spectrometry. Anal. Bioanal. Chem. 408, 5925–5933 10.1007/s00216-016-9709-3 [DOI] [PubMed] [Google Scholar]
- 58. Tayyab S., Qamar S., and Islam M. (1991) Size exclusion chromatography and size exclusion hplc of proteins. Biochem. Educ. 19, 149–152 10.1016/0307-4412(91)90060-L [DOI] [Google Scholar]
- 59. Glatter O. (1977) A new method for evaluation of small-angle scattering data. J. Appl. Crystallogr. 10, 415–421 10.1107/S0021889877013879 [DOI] [Google Scholar]
- 60. Svergun D. I. (1992) Determination of the regularization parameter in indirect-transform methods using perceptual criteria. J. Appl. Crystallogr. 25, 495–503 10.1107/S0021889892001663 [DOI] [Google Scholar]
- 61. Franke D., and Svergun D. I. (2009) DAMMIF, a program for rapid ab-initio shape determination in small-angle scattering. J. Appl. Crystallogr. 42, 342–346 10.1107/S0021889809000338 [DOI] [PMC free article] [PubMed] [Google Scholar]
- 62. Volkov V. V., and Svergun D. I. (2003) Uniqueness of ab initio shape determination in small-angle scattering. J. Appl. Crystallogr. 36, 860–864 10.1107/S0021889803000268 [DOI] [PMC free article] [PubMed] [Google Scholar]
- 63. Kozin M. B., and Svergun D. I. (2001) Automated matching of high- and low-resolution structural models. J. Appl. Crystallogr. 34, 33–41 10.1107/S0021889800014126 [DOI] [Google Scholar]
- 64. Schneidman-Duhovny D., Hammel M., Tainer J. A., and Sali A. (2013) Accurate SAXS profile computation and its assessment by contrast variation experiments. Biophys. J. 105, 962–974 10.1016/j.bpj.2013.07.020 [DOI] [PMC free article] [PubMed] [Google Scholar]
- 65. Valentini E., Kikhney A. G., Previtali G., Jeffries C. M., and Svergun D. I. (2015) SASBDB, a repository for biological small-angle scattering data. Nucleic Acids Res. 43, D357–D363 10.1093/nar/gku1047 [DOI] [PMC free article] [PubMed] [Google Scholar]
- 66. Hellman L. M., and Fried M. G. (2007) Electrophoretic mobility shift assay (EMSA) for detecting protein-nucleic acid interactions. Nat. Protoc. 2, 1849–1861 10.1038/nprot.2007.249 [DOI] [PMC free article] [PubMed] [Google Scholar]
- 67. Huang X. Y. (2003) Fluorescence polarization competition assay: The range of resolvable inhibitor potency is limited by the affinity of the fluorescent ligand. J. Biomol. Screen. 8, 34–38 10.1177/1087057102239666 [DOI] [PubMed] [Google Scholar]
- 68. Rambo R. P., and Tainer J. A. (2013) Accurate assessment of mass, models and resolution by small-angle scattering. Nature 496, 477–481 10.1038/nature12070 [DOI] [PMC free article] [PubMed] [Google Scholar]
Associated Data
This section collects any data citations, data availability statements, or supplementary materials included in this article.