Abstract
Background
PLK1 overexpression is oncogenic and is associated with poor prognosis in various cancers. However, the current PLK1 inhibitors have achieved limited clinical successes. On the other hand, although immunotherapies are demonstrating efficacy in treating many refractory cancers, a substantial number of patients do not respond to such therapies. The potential of combining PLK1 inhibition with immunotherapy for cancer treatment is worthy of exploration.
Methods
We analyzed the associations of PLK1 expression with tumor immunity in 33 different cancer types. Moreover, we analyzed the associations of the drug sensitivities of PLK1 inhibitors with tumor immunity in cancer cell lines. Furthermore, we explored the mechanism underlying the significant associations between PLK1 and tumor immunity. Finally, we experimentally verified some findings from bioinformatics analysis.
Results
The cancers with higher PLK1 expression levels tended to have lower immune activities, such as lower HLA expression and decreased B cells, NK cells and tumor-infiltrating lymphocytes infiltration. On the other side, elevated tumor immunity likely increased the sensitivity of cancer cells to PLK1 inhibitors. The main mechanism underlying the associations between PLK1 and tumor immunity may lie in the aberrant cell cycle and p53 pathways in cancers.
Conclusions
Our findings implicate that the PLK1 inhibition and immunotherapy combination may achieve a synergistic antitumor efficacy.
1. Introduction
PLK1 (Polo-like kinase 1) is a member of the Polo-like kinase family [1], which plays an important role in cell cycle regulation [2]. The role PLK1 plays in regulating cell cycle is diverse which includes controlling mitotic entry, harmonizing centrosome and cell cycles, regulating chromosome segregation, and mediating cytokinesis and meiosis [2]. Thus, the malfunction of PLK1 would result in cell cycle aberration that often incites cell proliferation. In fact, a substantial number of studies have revealed that PLK1 was overexpressed in a wide variety of cancers, and its overexpression correlated with unfavorable prognosis of cancer patients [3]. Hence, the inhibition of PLK1 has been suggested as a potential strategy for cancer therapy [4]. A number of PLK1 inhibitors have been explored in laboratory or clinical studies such as BI2536, volasertib, GSK461364, rigosertib, poloxin, poloxin-2, and RO3280 [3]. However, none of these exploratory agents have been used in clinics thus far [5].
On the other hand, recently cancer immunotherapy is demonstrating astonishing successes in treating various cancers [6, 7]. Particularly, the blockade of immune checkpoints CTLA4 (cytotoxic T-lymphocyte-associated protein 4), PD1 (programmed cell death protein 1), and PD-L1 (programmed cell death 1 ligand) has clinical successes in various cancers including melanoma, lung cancer, renal cell cancer, bladder cancer, head and neck cancer, Hodgkin's lymphoma, and the cancers with MSI (microsatellite instability) or DNA mismatch-repair deficiency [6]. Another notable cancer immunotherapeutic strategy is the chimeric antigen receptor (CAR) T cell therapy that has been used to treat refractory leukemia and lymphoma successfully [7]. Despite these remarkable achievements of cancer immunotherapy, a substantial proportion of patients had limited or no response to such therapies [8]. To predict the patients responsive to cancer immunotherapy, some biomarkers have been explored such as tumor mutation burden (TMB) [9, 10], neoantigens [11], MSI [12], and PD-L1 expression [13]. In addition, to improve the efficacy of cancer immunotherapy, the combination of immunotherapy with chemotherapy, radiotherapy, or targeted therapies has been explored [14]. For example, a recent study demonstrated that the combination of cyclin-dependent kinases 4 and 6 (CDK4/6) inhibitors with immunotherapy could promote antitumor immunity [15].
In this study, to explore the potential of combining PLK1 inhibitors with immunotherapy in treating cancers, we analyzed the associations of PLK1 expression with immune cell infiltration and immune activities in 33 different cancer types based on the Cancer Genome Atlas (TCGA) data (https://cancergenome.nih.gov/). Moreover, we analyzed the associations of the drug sensitivities of PLK1 inhibitors with immune cell infiltration and immune activities in cancer cell lines (CCLs) based on the Genomics of Drug Sensitivity in Cancer (GDSC) project data (http://www.cancerrxgene.org/). Furthermore, we explored the potential mechanisms that underlie the significant associations between PLK1 expression and tumor immunity.
2. Methods
2.1. Datasets
The TCGA data for gene expression profiles (RNA-Seq, Level 3) and gene somatic mutations (Level 3) were downloaded from the genomic data commons data portal (https://portal.gdc.cancer.gov/). The 33 TCGA cancer types analyzed are shown in Table 1. The GDSC data for gene expression profiles (Affymetrix Human Genome U219 array) and drug sensitivities (IC50) were downloaded from the Wellcome Sanger Institute website: https://www.cancerrxgene.org/downloads. We analyzed the enrichment levels of 6 immune cell types and functions in cancers including B cells, natural killer (NK) cells, tumor-infiltrating lymphocytes (TILs), human leukocyte antigen (HLA), regulatory T (Treg) cells, and cancer-testis antigens (CTAs) based on the expression profiles of their gene signatures. These gene signatures are shown in the Supplementary Table S1.
Table 1.
The 33 TCGA cancer types analyzed.
| Cancer type | Full name | # Cancer samples |
|---|---|---|
| ACC | adrenocortical carcinoma | 79 |
|
| ||
| BLCA | bladder urothelial carcinoma | 408 |
|
| ||
| BRCA | breast invasive carcinoma | 1100 |
|
| ||
| CESC | cervical squamous-cell carcinoma and endocervical adeno-carcinoma | 306 |
|
| ||
| CHOL | cholangiocarcinoma | 36 |
|
| ||
| COAD | colon adenocarcinoma | 287 |
|
| ||
| DLBC | lymphoid neoplasm diffuse large B-cell lymphoma | 48 |
|
| ||
| ESCA | esophageal carcinoma | 185 |
|
| ||
| GBM | glioblastoma multiforme | 166 |
|
| ||
| HNSC | head and neck squamous cell carcinoma | 522 |
|
| ||
| KICH | kidney chromophobe | 66 |
|
| ||
| KIRC | kidney renal clear cell carcinoma | 534 |
|
| ||
| KIRP | kidney renal papillary cell carcinoma | 291 |
|
| ||
| LAML | acute myeloid leukemia | 173 |
|
| ||
| LGG | brain lower-grade glioma | 530 |
|
| ||
| LIHC | liver hepatocellular carcinoma | 373 |
|
| ||
| LUAD | lung adenocarcinoma | 517 |
|
| ||
| LUSC | lung squamous cell carcinoma | 501 |
|
| ||
| MESO | mesothelioma | 87 |
|
| ||
| OV | ovarian serous cystadenocarcinoma | 307 |
|
| ||
| PAAD | pancreatic adeno-carcinoma | 179 |
|
| ||
| PCPG | pheochromocytoma and paraganglioma | 184 |
|
| ||
| PRAD | prostate adenocarcinoma | 498 |
|
| ||
| READ | rectum adenocarcinoma | 95 |
|
| ||
| SARC | sarcoma | 263 |
|
| ||
| SKCM | skin cutaneous melanoma | 472 |
|
| ||
| STAD | stomach adenocarcinoma | 415 |
|
| ||
| TGCT | testicular germ-cell tumors | 156 |
|
| ||
| THCA | thyroid carcinoma | 509 |
|
| ||
| THYM | thymoma | 120 |
|
| ||
| UCEC | uterine corpus endometrial carcinoma | 370 |
|
| ||
| UCS | uterine carcinosarcoma | 57 |
|
| ||
| UVM | uveal melanoma | 80 |
2.2. Evaluation of the Activity of an Immune Cell Type or Function in Cancers
We quantified the activity (or enrichment levels) of an immune cell type or function in a cancer sample using the single-sample gene-set enrichment analysis (ssGSEA) score [16, 17]. The gene-set is the set of gene signatures of the immune cell type or function. The higher the ssGSEA score, the higher the activity of the immune cell type or function. In addition, we assessed the levels of immune infiltration in cancers by the ESTIMATE algorithm [18]. ESTIMATE output immune scores quantify the immune infiltration levels in cancers based on gene expression profiles data.
2.3. Cell Lines and Cell Culture
Human cells from Lung Squamous Cell Carcinoma (SK-MES-1), Glioblastoma Multiforme (U251), Uterine Corpus Endometrial Carcinoma (HEC-1B), and Skin Cutaneous Melanoma (SK-MEL-2) were from the American Type Culture Collection (ATCC). SK-MES-1 and U251 cells were cultured in DMEM (GIBCO, USA) supplemented with 10% fetal bovine serum (FBS, GIBCO, USA). HEC-1B cells were incubated in Roswell Park Memorial Institute-1640 (RPMI-1640, GIBCO, USA) supplemented with 10% FBS. SK-MEL-2 was cultured in MEM (GIBCO, USA) supplemented with 10% FBS. All the cells were cultured in a humidified incubator at 37°C and a 5% CO2 atmosphere. Cells were harvested in logarithmic growth phase in all the experiments performed in this study.
2.4. Reverse Transcription Quantitative PCR (qPCR) Analysis
BI2536 were purchased from Selleck. Cells were harvested after being treated with BI2536 (1 μM, 48h). The total RNA was isolated by Trizol (Invitrogen, USA) and was reversely transcribed into cDNA by the RevertAid First Strand cDNA Synthesis Kit (Thermo Fisher, USA). Primer sequences used for qPCR were presented in Supplementary Table S2. Primers were diluted in nuclease-free water with the real-time PCR (RT-PCR) Master Mix (SYBR Green) (TOYOBO Co., LTD, JAPAN). Relative copy number was determined by calculating the fold-change difference in the gene of interest relative to β-actin. The qPCR was performed on an ABI 7500 FAST and Applied Biosystems StepOnePlus RT-PCR machine.
2.5. Flow Cytometry
Cells were harvested after treatments for 48 hours by trypsinization and were washed with PBS. Cells were resuspended in labeling buffer (PBS supplemented with 10% FBS and 1% NaN3) to a final concentration of 5×10⁵ per ml and were stained with W6/32 monoclonal antibody (1:20,eBIOSCIENCE: 12-9983-42) at 37°C without lights for 30 minutes. Cells were then washed by PBS for flow cytometric analysis using a LSRII 4-laser flow cytometer (Becton Dickinson, USA). The results were analyzed and MFI calculated by FlowJo.
2.6. Statistical Analyses
We calculated the correlation between the PLK1 expression levels and the expression levels of another gene using the Pearson method, and the correlations between the PLK1 expression levels and the other variables including the enrichment levels (ssGSEA scores) of a gene-set, tumor mutation counts, and drug sensitivities (IC50) using the Spearman method. In comparisons of TP53 mutation rates between the cancers with higher PLK1 expression levels (upper third) and the cancers with lower PLK1 expression levels (lower third), we used the Fisher's exact test. We adjusted for multiple tests using the false discovery rate (FDR) calculated by the Benjamini and Hochberg (BH) method [19]. The threshold of FDR < 0.1 was used to identify the statistical significance. All the computational and statistical analyses were implemented by R (https://www.r-project.org/). The experimental data were analyzed by Prism 5.0 software (GraphPad) and were presented as mean ± SD. The t test P < 0.05 was considered statistically significant.
3. Results
3.1. PLK1 Expression Likely Correlates with Depressed Immune Cell Infiltration and Immune Activities in Cancer
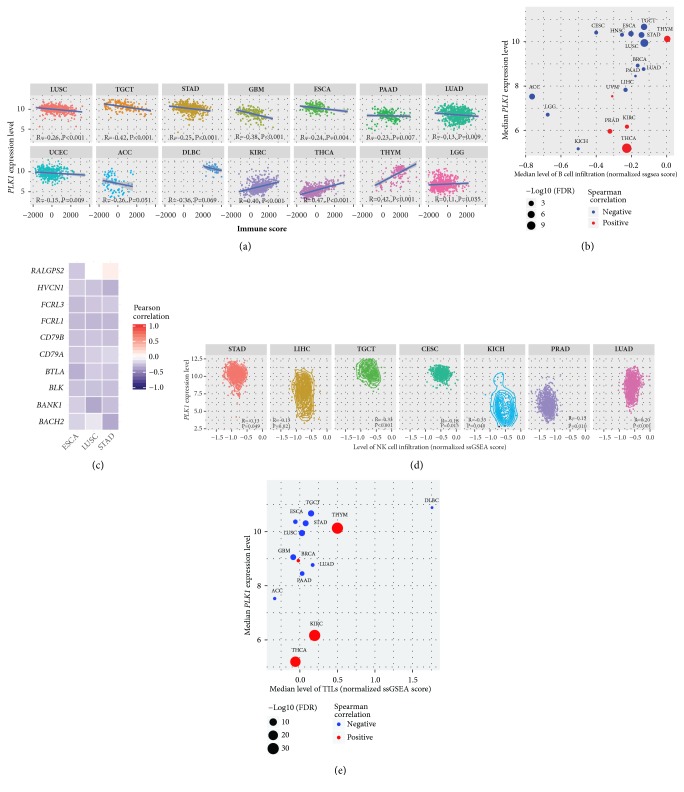
We found that the PLK1 expression levels were negatively associated with immune scores in 10 cancer types (LUSC, TGCT, STAD, GBM, ESCA, PAAD, LUAD, UCEC, ACC, and DLBC) while were positively associated with immune scores in 4 cancer types (KIRC, THCA, THYM, and LGG) (Spearman correlation, FDR<0.1) (Figure 1(a)) among the 33 cancer types analyzed. Moreover, higher PLK1 expression levels were associated with more abundant B cell infiltration in 13 cancer types (LUSC, TGCT, ACC, STAD, ESCA, LIHC, HNSC, LGG, CESC, BRCA, LUAD, KICH, and PAAD) while were associated with fewer B cell infiltration in 5 cancer types (THCA, THYM, PRAD, KIRC, and UVM) (Spearman correlation, FDR<0.1) (Figure 1(b)). Notably, all the 10 B cell gene signatures (BANK1, HVCN1, CD79B, RALGPS2, FCRL3, CD79A, BACH2, FCRL1, BLK, and BTLA) showed negative expression correlations with the PLK1 expression in ESCA, and 9 did in LUSC and STAD (Pearson correlation, FDR<0.1) (Figure 1(c)). In addition, in 6 cancer types (TGCT, PRAD, CESC, LIHC, KICH, and STAD), the upregulation of PLK1 was associated with higher levels of NK cell infiltration, and in 1 cancer type (LUAD), we observed an opposite trend (Spearman correlation, FDR<0.1) (Figure 1(d)). Furthermore, we associated the PLK1 expression levels with the enrichment levels of TILs in cancers. We found that the PLK1 expression levels negatively correlated with the enrichment levels of TILs in 9 cancer types (LUSC, TGCT, STAD, GBM, PAAD, ESCA, LUAD, ACC, and DLBC), and in 4 cancer types (KIRC, THYM, THCA, and BRCA), we observed an opposite trend (Spearman correlation, FDR<0.1) (Figure 1(e)). Notably, 114 (95%) of the 120 TILs genes showed negative expression correlations with the PLK1 expression in LUSC, and 110 (92%) TILs genes did in TGCT (Spearman correlation, FDR<0.1). Altogether, these data suggest that elevated PLK1 expression tends to inhibit immune cell infiltration and antitumor immunity in a number of cancer types.
Figure 1.
PLK1 likely inversely correlates with immune cell infiltration and immune activities in cancer. (a) The PLK1 expression levels inversely correlate with immune scores in 10 cancer types and positively correlate with immune scores in 4 cancer types (Spearman correlation, FDR<0.1). (b) The PLK1 expression levels inversely correlate with B cell infiltration in 13 cancer types and positively correlate with B cell infiltration in 5 cancer types (Spearman correlation, FDR<0.1). (c) Most of the B cell gene signatures show negative expression correlations with the PLK1 expression in ESCA, LUSC, and STAD (Pearson correlation, FDR<0.1). (d) The PLK1 expression levels inversely correlate with NK cell infiltration in 6 cancer types and positively correlate with NK cell infiltration in 1 cancer type (Spearman correlation, FDR<0.1). (e) The PLK1 expression levels inversely correlate with TILs infiltration in 9 cancer types and positively correlate with TILs infiltration in 4 cancer types (Spearman correlation, FDR<0.1). R: Spearman or Pearson correlation coefficient. FDR: false discovery rate. NK: natural killer. TILs: tumor-infiltrating lymphocytes.
3.2. PLK1 Expression Likely Correlates with Depressed HLA Activity in Cancer
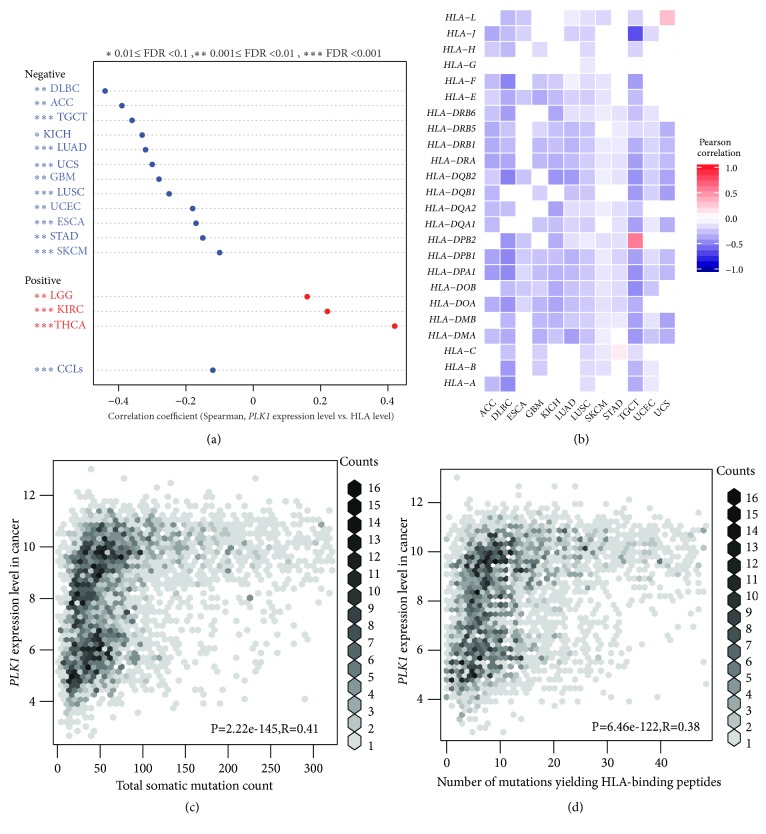
HLA genes encode the MHC (major histocompatibility complex) proteins that are important in the tumor immune regulation [20]. We found that the PLK1 expression negatively correlated with the HLA activity in 12 cancer types (LUAD, LUSC, TGCT, GBM, ACC, UCEC, DLBC, STAD, KICH, ESCA, SKCM, and UCS), while in 3 cancer types (THCA, KIRC, and LGG), we observed an opposite trend (Spearman correlation, FDR<0.1) (Figure 2(a)). The GDSC data analysis showed that the PLK1 expression negatively correlated with the HLA activity in cancer cell lines (Spearman correlation, R=-0.12, P=2.0∗10−4) (Figure 2(a)). Furthermore, we found that a majority of the 24 HLA genes analyzed showed significantly negative expression correlations with the PLK1 expression in the 12 cancer types in which the PLK1 expression negatively correlated with the HLA activity. For example, in both lung cancer types, all the 24 HLA genes had negative expression correlations with the PLK1 expression in LUSC, and 19 HLA genes did in LUAD (Pearson correlation, FDR<0.1) (Figure 2(b)). 22 and 21 HLA genes showed negative expression correlations with the PLK1 expression in TGCT and DLBC, respectively. Notably, HLA-A, HLA-DPA1, HLA-DQB1, HLA-DRA, HLA-DRB1, HLA-DRB5, and HLA-J consistently negatively correlated with the PLK1 expression in the 12 cancer types (Figure 2(b)). Taken together, these results suggest that the PLK1 expression likely inhibits the HLA activity in cancer.
Figure 2.
PLK1 likely inversely correlates with HLA activity in cancer. (a) The PLK1 expression levels inversely correlate with the HLA activity in 12 cancer types and cancer cell lines and positively correlate with the HLA activity in 3 cancer types (Spearman correlation, FDR<0.1). (b) Most of the 24 HLA genes show negative expression correlations with the PLK1 expression in the 12 cancer types in which the PLK1 expression inversely correlates with the HLA activity (Pearson correlation, FDR<0.1). (c) The PLK1 expression levels positively correlate with somatic mutation counts in cancer. (d) The PLK1 expression levels positively correlate with the numbers of mutations yielding predicted HLA-binding peptides. HLA: human leukocyte antigen. CCLs: cancer cell lines. R: Spearman or Pearson correlation coefficient. FDR: false discovery rate.
The neoantigens yielded by gene mutations are associated with antitumor immunity [11]. We found that the tumors with higher PLK1 expression levels had significantly higher total somatic mutation counts than the tumors with lower PLK1 expression levels in TCGA (Spearman correlation, R=0.46, P=2.57∗10−214) (Figure 2(c)). Moreover, the tumors more highly expressing PLK1 had significantly more mutations yielding predicted HLA-binding peptides [21] than the tumors more lowly expressing PLK1 (Spearman correlation, R=0.43, P=1.03∗10−186) (Figure 2(d)). It suggests that although the PLK1 upregulation correlates with higher TMB and more neoantigens, it inhibits antitumor immune response by repressing the HLA activity.
3.3. PLK1 Expression Likely Correlates with Depressed Regulatory T Cell Activity in Cancer
Treg cells play an important role in tumor immunosuppression [22]. We found that high PLK1 expression levels were associated with depressed Treg cell enrichment levels in 16 cancer types (THYM, LUSC, GBM, TGCT, SKCM, PRAD, UCEC, ESCA, UCS, UVM, OV, DLBC, LUAD, STAD, CESC, and KICH) while were associated with enhanced Treg cell activity in 5 cancer types (THCA, KIRC, LIHC, BRCA, and BLCA) (Spearman correlation, FDR<0.1) (Figure 3). The GDSC data analysis showed that high PLK1 expression levels were associated with decreased Treg cell enrichment levels in cancer cell lines (Spearman correlation, R=-0.13, P=3.29∗10−5) (Figure 3). Altogether, these data suggest that the PLK1 expression is negatively associated with the Treg cell activity in a wide range of cancers.
Figure 3.
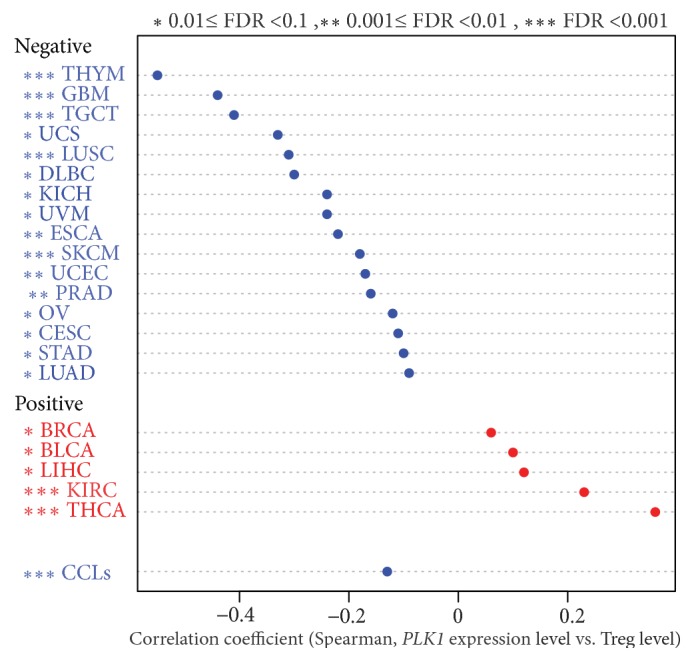
PLK1 likely inversely correlates with regulatory T cell activity in cancer. Treg: regulatory T. CCLs: cancer cell lines.
3.4. PLK1 Expression Likely Positively Correlates with Expression of Cancer-Testis Antigens in Cancer
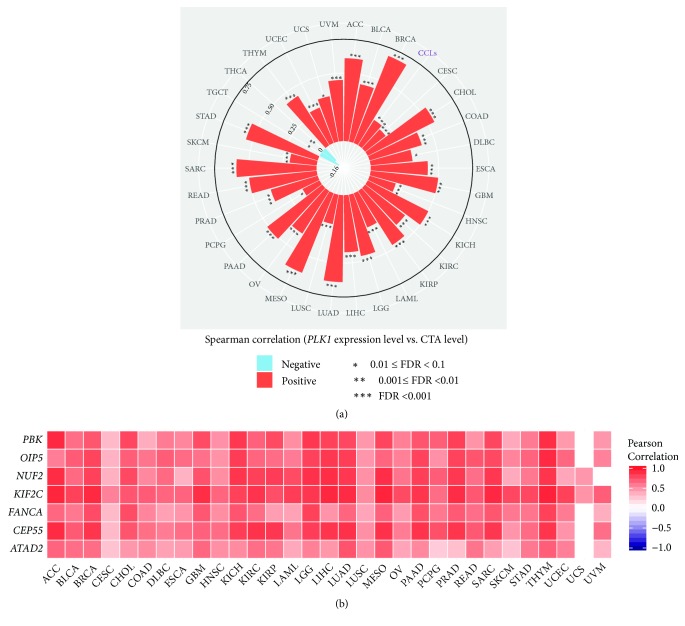
CTAs are the immunogenic proteins that are aberrantly activated in many cancers [23]. Strikingly, we found that higher PLK1 expression levels were significantly associated with higher CTA enrichment levels in 31 of the 33 cancer types (Spearman correlation, FDR<0.1) (Figure 4(a)). Markedly, the CTA genes ATAD2, CEP55, FANCA, KIF2C, NUF2, OIP5, and PBK had significantly positive expression correlations with the PLK1 expression in 30 cancer types (Pearson correlation, FDR<0.1) (Figure 4(b)). Moreover, 166 (74%) of the 223 CTA genes showed positive expression correlations with the PLK1 expression in LIHC, and 145 (65%) CTA genes did in KIRC. Furthermore, the GDSC data analysis showed that the PLK1 expression levels were positively associated with the CTA enrichment levels in cancer cell lines (Spearman correlation, R=0.22, P=4.09∗10−12) (Figure 4(a)). Altogether, these data suggest that higher PLK1 expression is associated with higher CTA presentation.
Figure 4.
PLK1 likely positively correlates with cancer-testis antigen (CTA) activity in cancer. (a) The PLK1 expression levels are positively associated with the CTA enrichment levels in 31 cancer types (Spearman correlation, FDR<0.1). The Spearman correlation coefficient for each cancer type is proportional to the length of the bar pointing to the cancer type. (b) The CTA genes ATAD2, CEP55, FANCA, KIF2C, NUF2, OIP5, and PBK show significantly positive expression correlations with the PLK1 expression in 30 cancer types (Pearson correlation, FDR<0.1).
3.5. Elevated Immune Activities Tends to Enhance the Sensitivity of Cancer Cells to PLK1 Inhibitors
The GDSC data involved the drug sensitivity (IC50) of cancer cells to hundreds of compounds, of which GW84368 and BI-2536 target PLK1. We found that the enrichment levels of B cells, NK cells, and TILs negatively correlated with the IC50 values of GW84368, and the enrichment levels of B cells and TILs negatively correlated with the IC50 values of BI-2536 (Spearman correlation, P<0.05) (Figure 5). It indicated that higher levels of B cells, NK cells, or TILs could promote the sensitivity of cancer cells to PLK1 inhibitors. It is rational in that higher levels of B cells, NK cells, or TILs are associated with lower levels of PLK1 that would need lower concentrations of PLK1 inhibitors to inhibit cancer cell proliferation. Furthermore, the GDSC data analysis showed that the IC50 values of both GW84368 and BI-2536 were negatively associated with the immune scores of cancer cells (Spearman correlation, P<0.01) (Figure 5), again suggesting that elevated immune activities increase the sensitivity of cancer cells to PLK1 inhibitors.
Figure 5.
Cancer immune activities positively correlate the sensitivity of cancer cells to PLK1 inhibitors (GW84368 and BI-2536). ssGSEA: the single-sample gene-set enrichment analysis.
3.6. PLK1 Inhibits Antitumor Immunity via the Cell Cycle Regulation
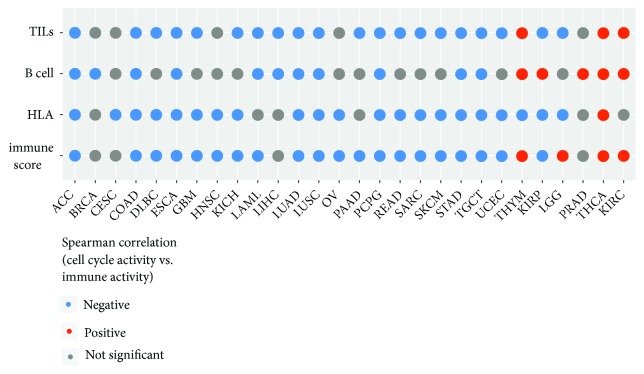
PLK1 is one of the essential regulators of cell cycle progression [24]. As expected, the TCGA data analysis showed that the PLK1 expression levels strongly correlated with the cell cycle activity in a positive direction in all 33 cancer types (Supplementary Table S3). Furthermore, our analysis showed that the high cell cycle activity tended to inhibit antitumor immunity. For example, the cell cycle activity negatively correlated with the TILs enrichment in 20 cancer types versus in 3 cancer types positively correlating with the TILs enrichment (Spearman correlation, FDR<0.1) (Figure 6). The cell cycle activity negatively correlated with the HLA enrichment in 21 cancer types, while only in 1 cancer type showed a positive correlation (Figure 6). Moreover, the cell cycle activity negatively correlated the B cell enrichment in 11 cancer types versus in 5 cancer types positively correlating with the B cell enrichment (Figure 6). Interestingly, the cell cycle showed a positive correlation with the CTA enrichment in 30 of the 33 cancer types (Spearman correlation, FDR<0.1) (Supplementary Table S4). Furthermore, we found that in 20 cancer types the cell cycle activity was negatively associated with the immune score compared to in 4 cancer types the cell cycle activity being positively associated with the immune score (Figure 6). Altogether, these results suggest that the PLK1 upregulation inhibits antitumor immunity via enhancing the cell cycle activity in cancer. This is in line with a recent study showing that the cell cycle inhibition promoted antitumor immunity [15].
Figure 6.
Immune activities likely inversely correlate with cell cycle activity in cancer.
3.7. PLK1 Inhibition Increases MHC Class I Expression in Multiple Cell Lines
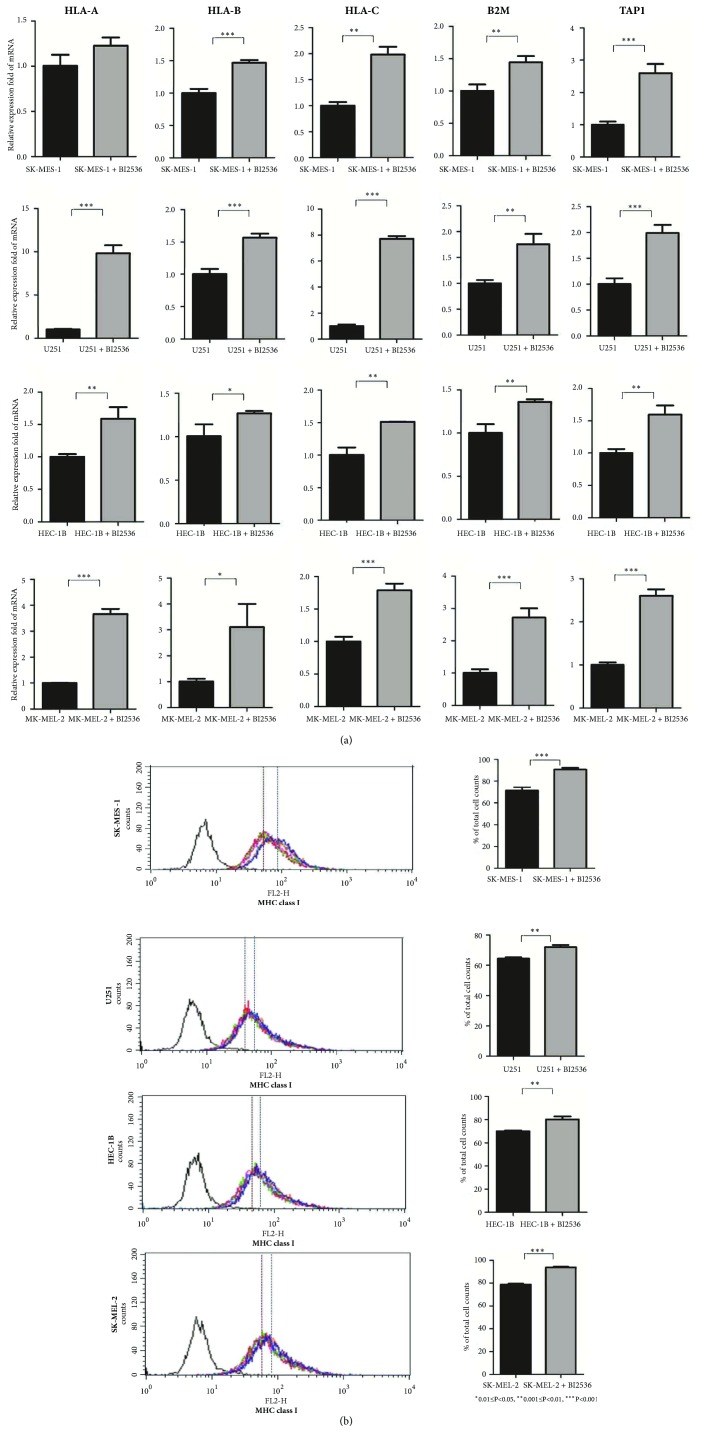
We used the PLK1 inhibitor (BI2536) to treat cancer cell lines and compared expression levels of MHC class I (HLA-A, HLA-B, HLA-C, B2M, and TAP1 genes and their protein products) between the pre- and post- treated cell lines. We observed that the MHC class I molecules had significantly increased expression in the post-treated cell lines compared to the pretreated cell lines, and the results were consistent in all the four different cell lines (LUSC, GBM, UCEC, and SKCM) tested (Figure 7). This experiment verified the results from bioinformatics analysis that the PLK1 expression inversely correlated with the HLA activity in diverse cancer types.
Figure 7.
PLK1 inhibition increases MHC class I expression in cell lines. (a) qPCR analysis of MHC class I mRNA expression in pre- and post- treated cell lines with BI2536. (b) Flow cytometric analysis of MHC class I (HLA-ABC, W6/32 labeling) expression on pre- and post- treated cell lines with BI2536.
4. Discussion
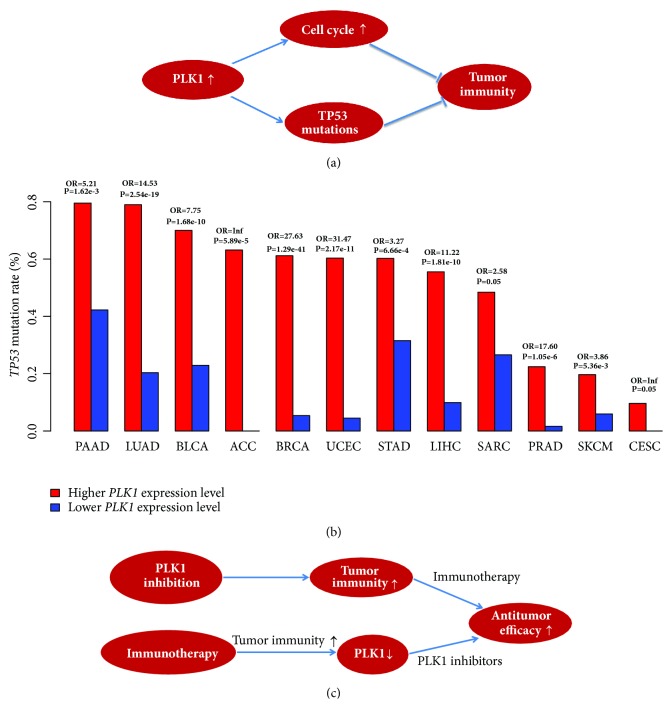
PLK1 is a master regulator of cell cycle, and its overexpression is oncogenic in various cancer types. Thus, targeting PLK1 could be promising in treating a wide range of malignancies. However, the current PLK1 inhibitors have achieved very limited clinical successes. On the other hand, although immunotherapies are achieving rapid clinical successes in treating many refractory cancers, a considerable number of patients do not respond to such therapies. To improve the clinical efficacy of both therapies, the combination of PLK1 inhibition and immunotherapy merits consideration. To explore the possibility of combining both therapies, we analyzed the associations between PLK1 expression and tumor immunity in various different cancer types. Our bioinformatics analyses showed that PLK1 expression tended to inhibit antitumor immunity as the cancers with higher PLK1 expression levels often had lower HLA expression levels and TILs infiltration. Moreover, the in vitro experiment verified that the PLK1 inhibition significantly increased the expression of HLA molecules in various cancers. A main mechanism by which PLK1 inhibits antitumor immunity lies in that the PLK1 upregulation activates the cell cycle which may decrease tumor immunogenicity (Figure 8(a)). Besides, we found that the cancers with higher PLK1 expression levels had significantly higher frequency of TP53 mutations than the cancers with lower PLK1 expression levels in 12 cancer types (Fisher's exact test, FDR<0.05) (Figure 8(b)), suggesting that the PLK1 upregulation positively correlates with the prevalence of TP53 mutations. Hence, the higher TP53 mutation rates in the cancers with higher PLK1 expression levels may also be partly responsible for the depressed tumor immunity in these cancers (Figure 8(a)) since a prior study has demonstrated that wildtype p53 could promote tumor immunity [25].
Figure 8.
The mechanism of PLK1 inhibiting tumor immunity and the viability of the PLK1 inhibition and immunotherapy combination in cancer treatment. (a) PLK1 inhibits tumor immunity via regulating the cell cycle and p53 pathways. (b) The cancers with higher PLK1 expression levels show a higher prevalence of TP53 mutations compared to the cancers with lower PLK1 expression levels in 12 cancer types (Fisher's exact test, FDR<0.05). OR: odds ratio. (c) The PLK1 inhibition and immunotherapy combination is viable in promoting the antitumor efficacy.
The correlations of PLK1 expression with the immune signature could be affected by other factors such as patient age, gender, tumor stage, and grade. We re-analyzed the correlations of PLK1 expression with the immune signature (immune score) under the stratification of patients based on age (<60 and ≥60 years old), gender (male and female), stage (early stage (Stage I-II) and late stage (Stage III-IV)), and grade (low-grade (G1-2) and high-grade (G3-4)), respectively. We did not observe marked changes of the statistical correlations when these covariates were considered (Supplementary Table S5). In addition, we performed the multiple linear regression analysis of the correlations between PLK1 expression and the immune signature by adding the covariate “age”. Our results showed that the correlations between PLK1 expression and the immune signature were unlikely affected by the variable “age” (Supplementary Table S6).
It is rational to anticipate that the PLK1 inhibition and immunotherapy combination may improve the antitumor efficacy. First, PLK1 inhibition is capable of boosting tumor antigen presentation and antitumor immune infiltration, which can be further augmented by the addition of immunotherapy (Figure 8(c)). Second, cancer immunotherapy may enhance tumor immunogenicity, which in turn increases the sensitivity of cancer cells to PLK1 inhibitors (Figure 8(c)). Hence, the PLK1 inhibition and immunotherapy combination could be promising in cancer treatment, although it needs to be proved by further experimental and clinical validations.
5. Conclusions
PLK1 likely inhibits antitumor immunity, and the elevated tumor immunity may enhance the sensitivity of cancer cells to PLK1 inhibitors. It implicates that the combination of PLK1 inhibition and immunotherapy may achieve a synergistic antitumor efficacy.
Acknowledgments
This work was supported by China Pharmaceutical University (grant numbers 3150120001 and 2632018YX01 to Xiaosheng Wang).
Abbreviations
- PLK1:
Polo-like kinase 1
- CTLA4:
Cytotoxic T-lymphocyte-associated protein 4
- PD1:
Programmed cell death protein 1
- PD-L1:
Programmed cell death 1 ligand
- CDK4/6:
Cyclin-dependent kinases 4 and 6
- TILs:
Tumor-infiltrating lymphocytes
- HLA:
Human leukocyte antigen
- MHC:
Major histocompatibility complex
- Treg:
Regulatory T
- CTAs:
Cancer-testis antigens
- MSI:
Microsatellite instability
- CAR:
Chimeric antigen receptor
- TMB:
Tumor mutation burden
- FDR:
False discovery rate
- ssGSEA:
Single-sample gene-set enrichment analysis
- TCGA:
The Cancer Genome Atlas
- GDSC:
Genomics of Drug Sensitivity in Cancer
- CCLs:
Cancer cell lines
- qPCR:
Quantitative PCR
- RT-PCR:
Real-time PCR.
Data Availability
The data for tumor tissue can be downloaded from the genomic data commons data portal (https://portal.gdc.cancer.gov/), and the data for cancer cell lines can be downloaded from the website: https://www.cancerrxgene.org/downloads.
Conflicts of Interest
The authors declare that they have no conflicts of interest.
Authors' Contributions
Mengyuan Li performed data analyses and helped in preparing the manuscript. Zhixian Liu performed experiments and helped in preparing the manuscript. Xiaosheng Wang conceived the research, designed analysis strategies, and wrote the manuscript. All the authors read and approved the final manuscript.
Supplementary Materials
Table S1: the gene signatures for the 6 immune cell types and functions analyzed. Table S2: primer sequences used for qPCR analysis. Table S3: correlations between the PLK1 expression levels and the cell cycle activity in 33 TCGA cancer types. Table S4: correlations between the CTA enrichment levels and the cell cycle activity in 33 TCGA cancer types. Table S5: the correlations of PLK1 expression with immune scores. Table S6: the multiple linear regression analysis of the correlations between PLK1 expression and the immune signature by adding the covariate “age”.
References
- 1.Golsteyn R. M., et al. The family of polo-like kinases. Progress in Cell Cycle Research. 1996;2:107–114. doi: 10.1007/978-1-4615-5873-6_11. [DOI] [PubMed] [Google Scholar]
- 2.van de Weerdt B. C. M., Medema R. H. Polo-like kinases: a team in control of the division. Cell Cycle. 2006;5(8):853–864. doi: 10.4161/cc.5.8.2692. [DOI] [PubMed] [Google Scholar]
- 3.Liu Z., Sun Q., Wang X. PLK1, A potential target for cancer therapy. Translational Oncology. 2017;10(1):22–32. doi: 10.1016/j.tranon.2016.10.003. [DOI] [PMC free article] [PubMed] [Google Scholar]
- 4.Degenhardt Y., Lampkin T. Targeting polo-like kinase in cancer therapy. Clinical Cancer Research. 2010;16(2):384–389. doi: 10.1158/1078-0432.CCR-09-1380. [DOI] [PubMed] [Google Scholar]
- 5.Gutteridge R. E. A., Ndiaye M. A., Liu X., Ahmad N. Plk1 inhibitors in cancer therapy: From laboratory to clinics. Molecular Cancer Therapeutics. 2016;15(7):1427–1435. doi: 10.1158/1535-7163.MCT-15-0897. [DOI] [PMC free article] [PubMed] [Google Scholar]
- 6.Ribas A., Wolchok J. D. Cancer immunotherapy using checkpoint blockade. Science. 2018;359(6382):1350–1355. doi: 10.1126/science.aar4060. [DOI] [PMC free article] [PubMed] [Google Scholar]
- 7.June C. H., O’Connor R. S., Kawalekar O. U., Ghassemi S., Milone M. C. CAR T cell immunotherapy for human cancer. Science. 2018;359(6382):1361–1365. doi: 10.1126/science.aar6711. [DOI] [PubMed] [Google Scholar]
- 8.Braun D. A., Burke K. P., Van Allen E. M. Genomic approaches to understanding response and resistance to immunotherapy. Clinical Cancer Research. 2016;22(23):5642–5650. doi: 10.1158/1078-0432.CCR-16-0066. [DOI] [PMC free article] [PubMed] [Google Scholar]
- 9.Goodman A. M., Kato S., Bazhenova L., et al. Tumor mutational burden as an independent predictor of response to immunotherapy in diverse cancers. Molecular Cancer Therapeutics. 2017;16(11):2598–2608. doi: 10.1158/1535-7163.MCT-17-0386. [DOI] [PMC free article] [PubMed] [Google Scholar]
- 10.Rizvi N. A., et al. Cancer immunology. Mutational landscape determines sensitivity to PD-1 blockade in non-small cell lung cancer. Science. 2015;348(6230):124–128. doi: 10.1126/science.aaa1348. [DOI] [PMC free article] [PubMed] [Google Scholar]
- 11.Yarchoan M., Johnson B. A., Lutz E. R., Laheru D. A., Jaffee E. M. Targeting neoantigens to augment antitumour immunity. Nature Reviews Cancer. 2017;17(4):209–222. doi: 10.1038/nrc.2016.154. [DOI] [PMC free article] [PubMed] [Google Scholar]
- 12.Xiao Y., Freeman G. J. The microsatellite instable subset of colorectal cancer is a particularly good candidate for checkpoint blockade immunotherapy. Cancer Discovery. 2015;5(1):16–18. doi: 10.1158/2159-8290.cd-14-1397. [DOI] [PMC free article] [PubMed] [Google Scholar]
- 13.Patel S. P., Kurzrock R. PD-L1 expression as a predictive biomarker in cancer immunotherapy. Molecular Cancer Therapeutics. 2015;14(4):847–856. doi: 10.1158/1535-7163.mct-14-0983. [DOI] [PubMed] [Google Scholar]
- 14.Smyth M. J., Ngiow S. F., Ribas A., Teng M. W. L. Combination cancer immunotherapies tailored to the tumour microenvironment. Nature Reviews Clinical Oncology. 2016;13(3):143–158. doi: 10.1038/nrclinonc.2015.209. [DOI] [PubMed] [Google Scholar]
- 15.Goel S., Decristo M. J., Watt A. C., et al. CDK4/6 inhibition triggers anti-tumour immunity. Nature. 2017;548(7668):471–475. doi: 10.1038/nature23465. [DOI] [PMC free article] [PubMed] [Google Scholar]
- 16.Barbie D. A., Tamayo P., Boehm J. S., et al. Systematic RNA interference reveals that oncogenic KRAS-driven cancers require TBK1. Nature. 2009;462(7269):108–112. doi: 10.1038/nature08460. [DOI] [PMC free article] [PubMed] [Google Scholar]
- 17.Hänzelmann S., Castelo R., Guinney J. GSVA: Gene set variation analysis for microarray and RNA-Seq data. BMC Bioinformatics. 2013;14:p. 7. doi: 10.1186/1471-2105-14-7. [DOI] [PMC free article] [PubMed] [Google Scholar]
- 18.Yoshihara K., Shahmoradgoli M., Martínez E., et al. Inferring tumour purity and stromal and immune cell admixture from expression data. Nature Communications. 2013;4, article no. 2612 doi: 10.1038/ncomms3612. [DOI] [PMC free article] [PubMed] [Google Scholar]
- 19.Benjamini Y., Hochberg Y. Controlling the false discovery rate: a practical and powerful approach to multiple testing. Journal of the Royal Statistical Society B: Methodological. 1995;57(1):289–300. [Google Scholar]
- 20.Fritsch E. F., Rajasagi M., Ott P. A., Brusic V., Hacohen N., Wu C. J. HLA-binding properties of tumor neoepitopes in humans. Cancer Immunology Research. 2014;2(6):522–529. doi: 10.1158/2326-6066.CIR-13-0227. [DOI] [PMC free article] [PubMed] [Google Scholar]
- 21.Rooney M. S., Shukla S. A., Wu C. J., Getz G., Hacohen N. Molecular and genetic properties of tumors associated with local immune cytolytic activity. Cell. 2015;160(1-2):48–61. doi: 10.1016/j.cell.2014.12.033. [DOI] [PMC free article] [PubMed] [Google Scholar]
- 22.Tanaka A., Sakaguchi S. Regulatory T cells in cancer immunotherapy. Cell Research. 2017;27(1):109–118. doi: 10.1038/cr.2016.151. [DOI] [PMC free article] [PubMed] [Google Scholar]
- 23.Salmaninejad A., Zamani M. R., Pourvahedi M., Golchehre Z., Hosseini Bereshneh A., Rezaei N. Cancer/Testis Antigens: Expression, Regulation, Tumor Invasion, and Use in Immunotherapy of Cancers. Immunological Investigations. 2016;45(7):619–640. doi: 10.1080/08820139.2016.1197241. [DOI] [PubMed] [Google Scholar]
- 24.Mundt K. E., Golsteyn R. M., Lane H. A., Nigg E. A. On the regulation and function of human polo-like kinase 1 (PLK1): Effects of overexpression on cell cycle progression. Biochemical and Biophysical Research Communications. 1997;239(2):377–385. doi: 10.1006/bbrc.1997.7378. [DOI] [PubMed] [Google Scholar]
- 25.Wang B., Niu D., Lai L., Ren E. C. P53 increases MHC class i expression by upregulating the endoplasmic reticulum aminopeptidase ERAP1. Nature Communications. 2013;4:p. 2359. doi: 10.1038/ncomms3359. [DOI] [PMC free article] [PubMed] [Google Scholar]
Associated Data
This section collects any data citations, data availability statements, or supplementary materials included in this article.
Supplementary Materials
Table S1: the gene signatures for the 6 immune cell types and functions analyzed. Table S2: primer sequences used for qPCR analysis. Table S3: correlations between the PLK1 expression levels and the cell cycle activity in 33 TCGA cancer types. Table S4: correlations between the CTA enrichment levels and the cell cycle activity in 33 TCGA cancer types. Table S5: the correlations of PLK1 expression with immune scores. Table S6: the multiple linear regression analysis of the correlations between PLK1 expression and the immune signature by adding the covariate “age”.
Data Availability Statement
The data for tumor tissue can be downloaded from the genomic data commons data portal (https://portal.gdc.cancer.gov/), and the data for cancer cell lines can be downloaded from the website: https://www.cancerrxgene.org/downloads.


