Abstract
Proteins are the structural elements and machinery of life responsible for a functioning biological architecture and homeostasis. Advances in nanotechnology are catalyzing key breakthroughs in many areas, including the analysis and study of proteins at the single-molecule level. Nanopore sensing is at the forefront of this revolution. This tutorial review provides readers a guidebook and reference for detecting and characterizing proteins at the single-molecule level using nanopores. Specifically, the review describes the key materials, nanoscale features, and design requirements of nanopores. It also discusses general design requirements as well as details on the analysis of protein translocation. Finally, the article provides the background necessary to understand current research trends and to encourage the identification of new biomedical applications for protein sensing using nanopores.
Graphical Abstract
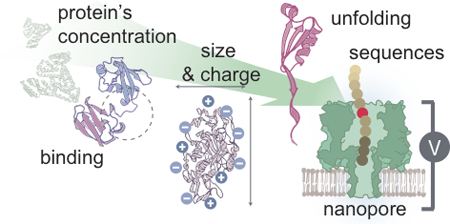
1. P is for Protein
Proteins play critical roles in all aspects of life. Proteins consist of amino acids as their fundamental building units, and the sequence of which is referred to as the primary structure. These chemically precise macromolecules fold locally and globally into secondary and tertiary three-dimensional structures in aqueous solution to afford biochemically active entities. Proteins engage with other biomolecules through specific physicochemical interactions at their surfaces, and these interactions are dependent on the protein’s structure and composition. These interactions dictate the selectivity, the time, and the strength of interaction(s), which enable the diversity of protein functions from structural and organizational support, manufacturing, to signaling. Study of the protein structure in solution is key to understanding its biological role as well as to identifying new diagnostics and treatments for diseases.
Proteins are abundant in our daily life, for example, we observe the albumin proteins in egg white transform from a clear liquid to white solid during cooking (or heat-induced) denaturing process. In a research setting, the structures and compositions of proteins are analyzed using a variety of biochemical and biophysical techniques. Edman sequencing is the gold standard to determine a protein’s primary structure, and it involves digesting the protein one amino acid at a time followed by mass spectrometry analysis to determine the sequence and any post-translational modifications, such as glycosylation. X-Ray crystallography, nuclear magnetic resonance (NMR) spectroscopy, circular dichroism, and infrared spectroscopy are all common methods to assess a protein’s secondary structure including alpha helices, beta sheets, beta turns, and random coils. The spatial relationships between the secondary structures of a protein define its tertiary structure, which X-ray crystallography and NMR spectroscopy are often used to characterize. Finally, the quaternary structure reflects multiple folded subunits into a larger oligomeric complex. Similarly, techniques like X-ray crystallography and NMR spectroscopy are extensively used along with newer methods such as cryo-electron microscopy to elucidate the quaternary structures. The above techniques directly determine the protein composition and structures. There are also indirect methods, whereby a spectroscopy probe(s) attached at a specific site(s) on a protein provides a signal in response to folding, binding with another protein, post-translational modification, or oligomeric states.
Although the above techniques are widely used and valued in protein characterization, these bulk measurement or ensemble-averaged techniques do not enable us to address a number of critical questions, such as obtaining dynamic structural information on a protein (or its reaction or binding with another protein) in real-time. Moreover, bulk analysis methods require a large copy number of identical proteins which is not readily available in many clinical and biomedical situations. Investigating proteins at the single-molecule level is of particular interest as it provides: 1) insights into molecular mechanisms; 2) a dynamic view of the stochastic nature of chemical processes; 3) an overview of the heterogeneity across a population of molecules; and 4) opportunities to develop new protein based molecular diagnostics for research and clinical applications (Figure 1).
Figure 1.
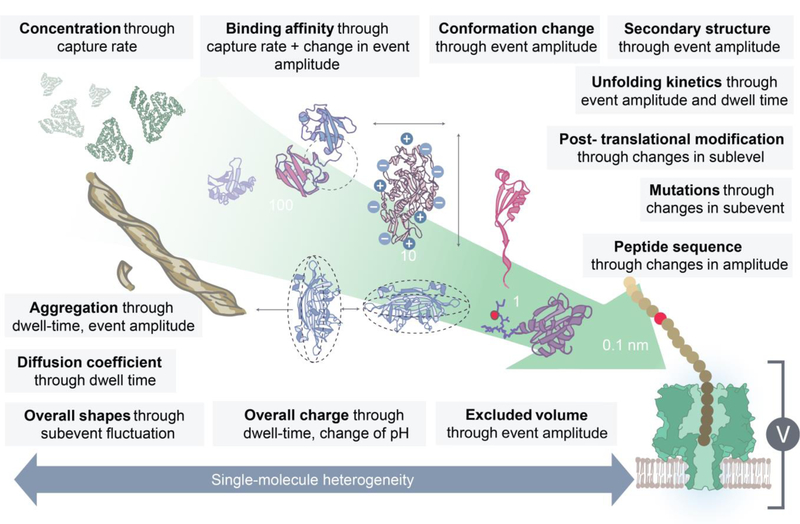
The protein biochemical/biophysical information obtained from a nanopore sensor. The information is ranked according to its length scale. For example, the concentration of the bulk solution protein is obtained by measuring the translocation rate. Nanopore sensing enables measurement of an enzyme and protein’s binding kinetics,3–5 oligomeric formation,6,7 and aggregation kinetics.8 Once the pool of events are collected, the information about protein’s diffusion coefficient, overall charge, volume and shapes is estimated.9,10 Small nanopores are used to sense protein conformational changes,4,10 unfolding pathway,11,12 domain structures,3,5 post-translational modifications,3,5,13 and mutations,12 as well as to identify peptide sequences.14 A major advantage of using this single-molecule technique is the collection of data on individual biomacromolecules.
To address these challenges as well as future questions, single-molecule protein sensing techniques have been developed, which include advanced optical microscopy techniques, optical/magnetic tweezers, atomic force microscopy, microcantilevers, nanochannels, and nanopores. For example, single-molecule force spectroscopy techniques such as optical tweezers, magnetic tweezers, and atomic force microscopy can provide information on the folding and unfolding of a protein structure as a function of applied external force and the binding strength between a protein and its partner ligand. Current emerging single-molecule techniques used to study proteins are reviewed elsewhere.1 Among these techniques, nanopore sensing is at the forefront. The successful commercialization of nanopores for DNA sequencing (MinION by Oxford Nanopore Technologies) represents a significant milestone in the field, demonstrating the translatability of this technology.2 The potential applications of native, unmodified, protein nanopore sensing include the opportunities to: 1) detect and quantify concentration of a protein(s) in solution; 2) analyze protein size and charge; 3) monitor binding interactions or reactions between proteins or a protein and a ligand to afford kinetic and equilibrium data; and 4) resolve conformational changes in structure (Figure 1).
2. N is for Nanopore sensor
A nanopore sensor consists of a nanometer-sized pore (i.e., 1–100 nm in diameter) embedded or formed in an insulating membrane that separates two chambers containing an electrolyte solution. When an electrical bias is applied across the membrane, ions flow freely through the pore producing a constant open pore current. The flow of ions is partially impeded when a biomolecule diffuses through the pore or translocates from one side to the other under the influence of a driving force, thereby changing the ionic current. Figure 2 depicts schematically the fundamentals of the nanopore sensing techniques. The principles of operation are reminiscent of a classic Coulter counter. However, the nanopore sensor provides enhanced sensing capability at the single-molecule level due to its nanoscale dimension. Proteins are typically 2–10 nm in size. When the size of the pore is comparable to the size of the analyte, the change in ionic current is more prominent than when using a larger pore. By analogy, pushing an elephant through a door significantly reduces the flow of air through the door while an ant quickly and easily crawls through the door barely, if at all, disturbs the airflow (Figure 3).
Figure 2.
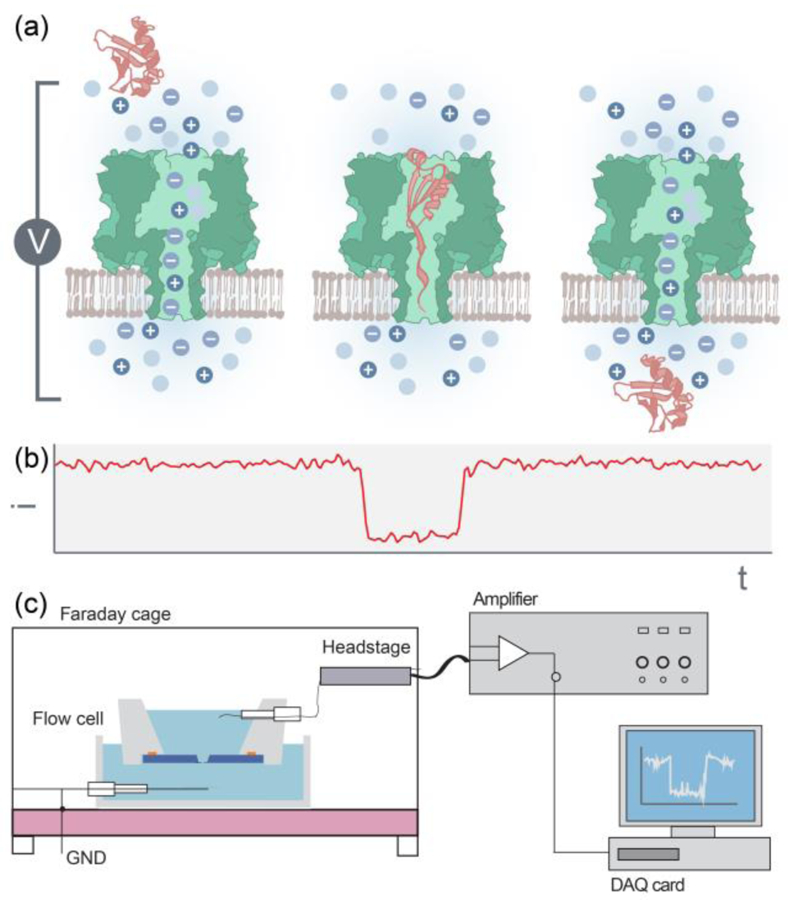
A schematic view of single-molecule nanopore sensing techniques. (a) Ions flow freely across the nanopore due to an applied electric field. Physical blockage of a protein of interest obstructs the ion flow, resulting in a drop in the pore’s current. The current is restored once the protein leaves the pore. (b) A representative event as a result of a single protein translocation. (c) Nanopore sensor experimental setup. The nanopore sensor resides in a Faraday cage to prevent external noise. The sensor is connected to a headstage, which transduces the current signal to an amplifier and to a data acquisition (DAQ) card. The data is then processed using a program to extract the nanopore events from the current trace as well as obtain the event characteristics.
Figure 3.
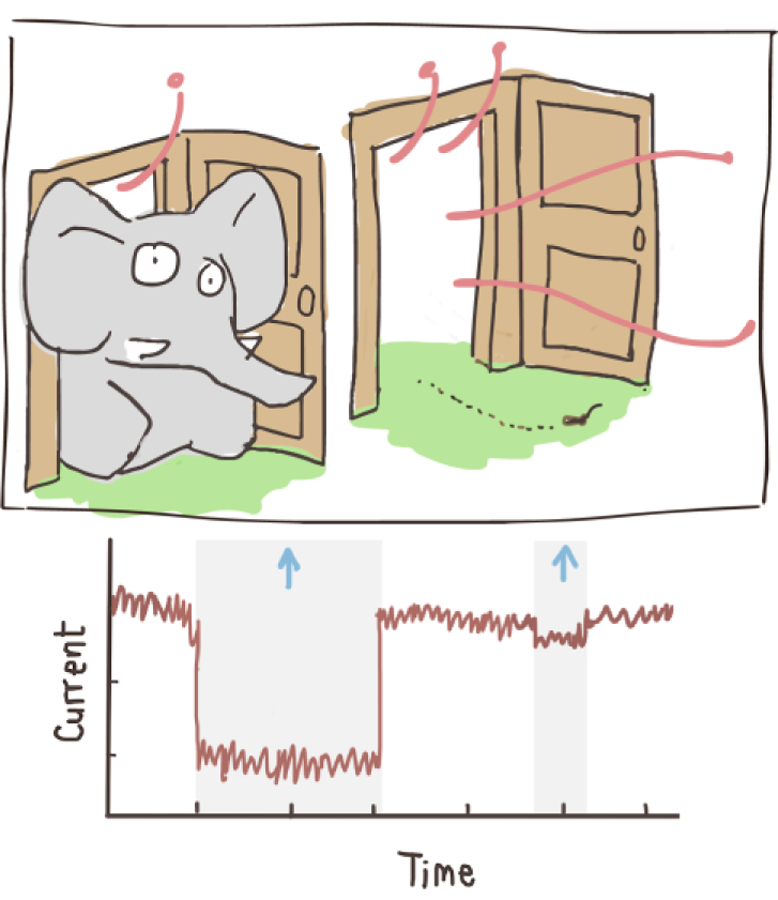
Cartoon illustrating nanopore operation. Translocating an elephant vs an ant through a door.
2.1. Nanopore types – biological and synthetic
Nanopores are broadly categorized into two main groups: biological and synthetic pores (Table 1). The first nanopore for single-biomolecule detection used a biological protein pore, α-hemolysin, for single-stranded RNA and DNA detection.15 The same type of α-hemolysin nanopores have subsequently been used to study protein,16 and protein/DNA complex.17 The device is composed of a single recombinant protein pore embedded in a lipid bilayer. More recently, additional protein pores such as ClyA,4,5 aerolysin,14,18 Nfp,19 and FraC20 have been evaluated. The advantage of protein nanopores include their well-characterized 3D structure and high reproducibility. Synthetic nanopores generally exhibit greater mechanical robustness, finer control over pore geometry, and opportunities for surface chemistry.21–25 Solid-state nanopores are fabricated by ion beam sculpting,26 electron-beam drilling,27 controlled dielectric breakdown,28 or direct laser drilling.29 Advances in micro-nanofabrication are also enabling the fabrication of single-atom layer nanopores from 2D materials such as graphene30 and molybdenum disulfide (MoS2).25 Last but not least, glass nanopores are fabricated by pulling a glass capillary to produce a taper end followed by electron beam sculpting to afford a narrow pore opening at the end.31 The advantage of using a glass nanopore is the ease of fabrication compared to other synthetic pores, however, fine-tuning the diameter of the pore down to sub nanometer level is challenging. For additional information, we refer the reader to the following two reviews which focus specifically on nanopore fabrication.32
Table 1.
The four main categories of nanopore sensors (drawings are not to scale).
| Type of nanopores | Features | Advantages | Challenges |
|---|---|---|---|
Protein pore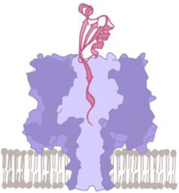
|
• A biological protein pore
suspended on a lipid membrane • Recombinant protein synthesis technique • e.g., α-hemolysin,18 ClyA,4,5 Aerolysin,14,18 Nfp,19 FraC20 |
• Well-defined sensing region
(typically 1–2 nm in diameter, ~1 nm thickness) • Modification with atomic precision • Highly repeatable • Low electrical noise |
• Constraint pore geometry
and surface’s chemical properties • Not compatible with the harsh chemical environment such as bleach cleaning and plasma treatment. • Poor mechanical stability (due to lipid membrane) |
Solid-state pore
|
• Small hole embedded in a
free- standing membrane on a silicon chip • Milling by electron beam, ion beam, dielectric breakdown or laser-drilling •e.g., SiNx,21,23 HfO210,22 |
• Flexible geometrical design
(1–100 nm in diameter, down to a few atomic layer thickness) • Surface chemical control |
• E-beam drilling is expensive
and slow • Difficulty in controlling and imaging the pore’s shape |
2D material pore
|
• Small hole embedded in a
free- standing membrane on a silicon chip • Milling by electron beam or ion beam • e.g., graphene,30 MoS225 |
• High sensitivity (ideally at
single-atom level) |
• Limited surface chemical
modification • Poor mechanical stability • The exact chemical composition of the edge of the nanopore is not known |
Glass pore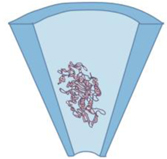
|
• A glass capillary with a tapered
end • Pulling a glass capillary followed by electron beam sculpting •e.g., borosilicate31 |
• Ease of fabrication | • Restricted pore size (usually
>50 nm size-unless followed by e-beam sculpting) |
2.2. General considerations for sensing single molecules: sensing region and resolution
In single-molecule nanopore sensing, the pore’s geometry is chosen to be comparable with the cross section of the biomolecule of interest to maximize the change in ionic current during a translocation event and ultimately, maximize the signal-to-noise ratio. Typically, a translocation event is measured by the fractional blockade current (IB), defined as a ratio between the mean blocked current (ib) and the mean open pore current (io): IB = ib/io. The fractional event amplitude (Δi/io) is used interchangeably as it is 1 - (ib/io). To a first approximation, the fractional event amplitude is correlated to the physical blocking volume of the analyst over the sensing volume of the pore. In general, the mean open pore current is expressed as:
| (1) |
where V is the voltage bias and R is the pore’s resistance. The first term of the resistance (4l/σπd2) arises from the geometrical constraint of the pore itself (assuming a cylindrical pore) while the second component so-called access resistance, Raccess = 1/2σd, results from the ionic current converging from the bulk solution into the pore’s vicinity, hence Rtotal= Rpore+2Raccess. For instance, a synthetic pore of 4 nm in diameter and 10 nm in thickness, immersed in 1 M KCl solution (bulk conductivity σ = 10.5 S m−1) results in Rtotal of 99.6 MΩ, which the access resistance contributes to over 24% of the total resistance. Under a bias of 300 mV, it will generate an open pore current of 3.0 nanoamperes.
The narrowest region of the pore is where the sensing occurs as it is the area with the largest electric field drop. In an α-hemolysin pore, this sensing region is estimated to be ~5 nm of the β-barrel’s length, while the entire pore length is 10 nm.33 An electron-beam sculpting solid-state nanopore usually possesses a double-conical shape, and thus, the effective pore’s length is smaller than the nominal film’s thickness. This dimension can be estimated, experimentally, by characterizing the translocation of a well-known analyte such as double-stranded DNA.34 A narrow sensing region is desired in order to resolve the molecular features of the analyte such as a protein’s primary or secondary structure.35 However, a drawback is that thin pores exhibit lower mechanical stability and shorter translocation time. As a result, many of the events may not be resolved within the experimental limited temporal bandwidth.
Capturing the nanopore signal requires a sufficient temporal bandwidth. For example, for a translocation dwell time of 1 µs the system bandwidth should be ~ 1 MHz. However, using a high bandwidth may complicate the measurement as the overall system noise increases rapidly at high frequencies and hence can obscure the protein translocation signals. Consequently, 10 to 100 kHz acquisition bandwidths (defined by the application of a low-pass filter) have often been used in nanopore sensing despite capturing only a fraction of the events.
In practice, the temporal resolution in nanopore sensing is dictated by a ratio of two factors: the event amplitude (Δi/io) and the overall electrical noise (in). The noise is approximated by the root-mean-square (RMS) of io. For example, a ratio of ~5 is obtained, with a signal amplitude of ~ 0.5 nA and an associated root-mean-square (RMS) noise of ~ 0.1 nA, measured at a bandwidth of 100 KHz. When this ratio is smaller than ~2 sensing might become unpractical since the translocation events cannot be differentiated from the background noise.36 The overall noise in the system originates from both the electrical sensing circuit (amplifier’s internal circuit, choice of filters, charge transfer at the electrodes, etc.) and the physical characteristics (membrane material and composition, charge, capacitance, etc.) of the nanopore sensor.
3. A is for Analysis
3.1. Understanding the nanopore signal generated from proteins
Characterizing and understanding the physical principles governing protein translocation through a nanopore by the resulting ionic current signal is an ongoing challenge. The most straightforward model is that a protein translocates through the pore as a fully-intact protein, similar to a cell translocating through the several hundred micron-sized pore of a traditional Coulter counter (Table 2 – first entry). However, protein molecules are subjected to significant forces of physical, electrical, and chemical origins while traversing through the nanopore. As a result, the protein may: 1) translocate smoothly through the pore, 2) momentarily collide with the pore opening and never enter the pore, 3) temporarily or permanently adsorb onto the pore walls,37,38 or 4) interacting with chemical modieties or ligands on the pore walls4,39 While protein resides inside the pore, it may 5) tumble,4,9 6) bind/unbind with its ligands or 7) undergo transient or permanent structural changes such as unfolding.11,12,40 Some, or all of these events may occur resulting in various characteristic signal signatures. Table 2 summarizes possible events, signal characteristics, and recommendations as to how to match a particular signal event with a translocation or other event(s). Note that first, these are generalized for all biological and synthetic pores. Second, multiple modes of interaction could happen in a single translocation. Lastly, this is just a set of guidelines and ultimately the analysis will require a thorough series of experiments.
Table 2.
The possible events inside a nanopore as a protein molecule enters.
| Events | Signal Characteristics | Events | Signal Characteristics |
|---|---|---|---|
| Fully-intact,
Smooth translocation 
|
Deep event amplitude
|
Collision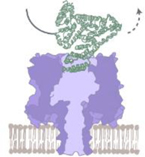
|
Shallow events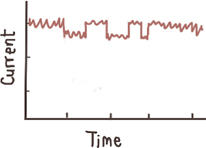
|
| • Increase
voltage/shorter dwell time |
• Increase voltage/longer
dwell time38 |
||
| Adsorption to a pore’s wall (non- specific interaction) 
|
Deep events, millisecond-to second long 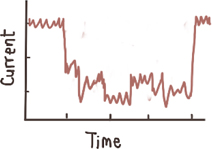
|
Specific interaction with the pore’s wall 
|
Deep events, millisecond-to second long 8 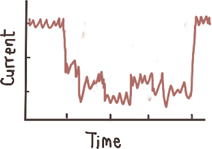
|
| • Adsorption • Electrostatic interaction |
• Reduce adsorption by
pre- treating the pore wall with a lipid or a surfactant37,38 • Change pH |
• ligand on the
pore’s wall |
|
| Tumbling inside
a pore 
|
Strong intra-event
signal fluctuation, two preferred levels9,10 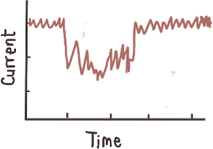
|
Binding/Unbinding
|
Well defined
sub-levels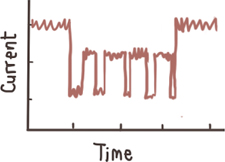
|
| • Introduce strongly-charged
tag like a short oligo4,11 |
• Due to coupling with other molecules (eg. enzyme substrates) |
||
| Conformational change (transient) 
|
Contribute to the width of the event amplitude histogram 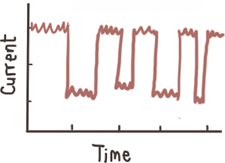
|
Unfolding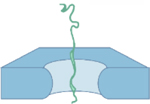
|
Shallow events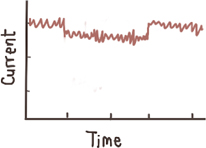
|
| • May be induced by the pore’s electric field or physical confinement |
• Induced by the pore’s electric field or physical confinement • Introducing denaturants |
• Introduce denaturing
agents such as SDS or urea • Increase voltage/ shorter dwell time11,12,41 |
|
3.2. Regulating the type of interaction(s): voltage, pH, ionic strength, temperature, surfactant, protein concentration
Proteins are drawn and translocated through the nanopore as a result of electrophoretic, electroosmotic, and in some cases thermophoretic forces. The nanopore can also serve as a physical barrier to facilitate the unfolding of protein, especially when a pore’s diameter is comparable or smaller than the size of a solvated protein.12 The voltage bias directly determines the electrophoretic force: a larger voltage bias facilitates the translocation of a protein with the opposite charge with a shorter dwell time. The voltage bias also increases the flow of counter ions due to electroosmotic force, which may facilitate or hamper the translocation of a protein depending on the direction of water flow.20 A stronger pulling force favors protein shearing or unfolding, resulting in a shallower event amplitude and a longer translocation time.12 Nanopore-induced protein denaturation is naturally stochastic, resulting in broad signal distributions.
To promote protein linearization prior to translocating through the pore, an unfoldase protein has been anchored to the pore’s opening to afford a signal with unique patterns corresponding to different proteins.11 Strong denaturants are also used to denature the protein pre-emptively in solution before reaching the pore such as urea12,21 or sodium dodecyl sulfate (SDS).42 Surfactants will form a monolayer coating the pore’s wall, and, thus, reduce the pore’s effective diameter while minimizing non-specific adsorption of a protein onto the pore’s wall similar to a lipid-coated pore.8 In the later strategy, Yusko et al, pre-treated 6 – 65 nm silicon nitride pores with an aqueous suspension of small unilamellar liposomes, creating a bilayer coating which increases the overall resistance of the nanopore. The protein analyte was anchored with the lipid molecule and diffused through the pore governed by the high viscosity of lipid membrane rather than the low viscosity of the aqueous electrolyte in the pore.
Temperature affects protein translocation through the nanopore in various aspects. First, a higher temperature promotes ion diffusion, hence the open pore current increases while the noise remains similar.18 When a protein such as a maltose binding protein, MalE219, enters the nanopore, the observed event arrival rate increases as a function of temperature, which is likely due to the enhancement of thermal motion.18 The increase in the protein’s diffusion coefficient results in faster translocations through the nanopore. Further heating the nanopore system up to 70 °C affords a temperature-induced unfolding of the protein.18
Because a protein is an amphiphilic molecule with ionizable amino acids, its overall charge depends on the pH of the solution, which in turn affects the electrophoretic force acting on the protein. The isoelectric point (pI), or the pH at which the overall charge of the protein equals to zero, depends on its amino acid sequence and post-translational modifications. At a pH smaller than the pI, the protein is positively charged and therefore is drawn across the nanopore with an applied negative bias, and vice versa. Furthermore, as the pH approaches the pI, the protein’s overall charge decreases, resulting in an increase in the translocation dwell time. Nir et al. reported that this small change can be significant - more than 2–3 orders of magnitude change in the dwell time when the pH is roughly 0.2–0.3 units away from the pI.3 This has allowed a robust sensing of a 8.5 KDa protein, Ubiquitin, as well as Ubiquitin chains of various types. By performing nanopore sensing experiments across a series of pH values, the precise isoelectric point of each molecule is determined similar to the isoelectric focusing technique. However, as the pH of the solution approaches the pI, the protein has almost zero net charge and aggregations are likely to occur with few translocations.
In the case where the analyte has a strong dipole moment, a protein will enter the nanopore and translocate in a preferred orientation. For example, a multilevel translocation signal is observed with the thioredoxin and DNA chimera as it translocates the pore under a positive bias. The event profile corresponds to a signal of the densely negatively charged DNA follow by a positively charged protein.12 Another interesting translocation profile is observed with a linearized amphiphilic peptide which gives a ratcheting motion or molecular stalling effect as a likely result of the presence of localize charge on the adjacent segments affording a molecular tug-of-war effect.21
3.3. Controlling the protein capture rate
The signals obtained from one single molecule measurement are subject to statistical fluctuations since natural phenomena are usually governed by thermal noise. Thus, it is important to collect a significant number of events, usually from a few hundred to thousands of events, and perform statistical analysis. Large data set require longer time to collect the data, depending on the protein capture rate (the rate at which the nanopore events are detected).
There are multiple strategies to increase the detection rate of proteins. The first strategy is to enhance the electro-chemical gradient pulling the molecules towards the nanopore by the use of a salt-gradient.43 A second strategy utilizes various types of ligands as carriers for the proteins of interest. Some common biomacromolecular carriers are DNA and RNA. In contrast to proteins, DNA and RNA molecules possess a uniform distribution of negative charges at neutral pH and therefore their translocation events are relatively easy to study and predict. Several studies have reported the successful use of these carriers to identify proteins using unfunctionalized solid-state nanopores. For example, Niedzwiecki et al. demonstrated the use of an RNA aptamer, stem-loop 3, to detect a protein biomarker of the human immunodeficiency virus 1, nucleocapsid protein 7 (NCp 7), using silicon nitride nanopores.44 Upon applying a positive voltage, no translocation of Ncp 7 was observed due to its net positive charge. When a negative voltage was applied, the proteins absorbed onto the silicon nitride surface, and translocation was thus hindered. However, when the NCp7 protein was bound to an aptamer, well-defined translocation events with distinguishable current blockades from the free NCp7 were observed, allowing measurement of the dissociation constant. In addition to RNA aptamers, Bell and co-worker reported the use of a DNA carrier to detect various proteins with high specificity.31 The DNA carrier used in the study was a seven kbp double-stranded DNA with evenly spaced nicks on one strand, which allowed for chemical attachment of functional motifs at the 3’ or 5’ end. When biotin was conjugated to the DNA carrier, streptavidin was able to selectively bind to the DNA carrier, producing predominantly multi-step translocation events. Whereas unmodified DNA carriers and biotin-conjugated DNA carriers, without exposure to streptavidin, afforded mainly single-step translocation events. Beside controlling capture rate, protein/aptamer interaction can also be used to enhance signal discrimination, enabling a quantification of multiple protein biomarkers from relatively complex sample like blood.45
3.4. Basic characteristics in signal processing: capture rate, event amplitude, and dwell time
The three basic nanopore event characteristics are capture rate, event amplitude and dwell time. The capture rate is the rate at which the nanopore event occurs, obtained by measuring the inter-event interval (ti, see figures 4a-b) and fitting its histogram with the exponential decay function. The nature of the protein capture rate is stochastic and is classified based on two mechanisms: 1) a protein diffuses from bulk solution and is trapped in the electric field generated near the vicinity of the pore following the Smoluchowski’s rate equation; and, 2) a protein overcomes an entropic barrier and enters the pore funnel under electrophoretic and electroosmotic forces.43,46 The two mechanisms depend on the protein’s bulk concentration as well as its biophysical properties such as diffusion coefficient, charge, size relative to the pore. These dependencies imply that the capture rate can be used to measure the analyst’s bulk concentration (if the biophysical properties are known or the concentration/capture rate curve is established) or, vice versa.
Figure 4.
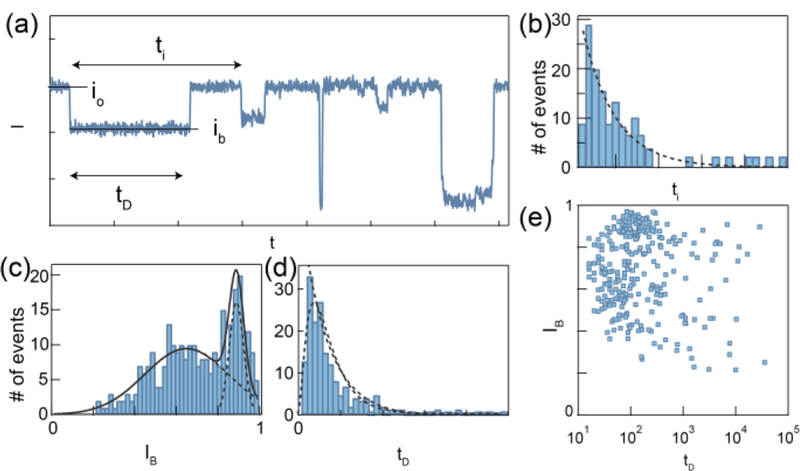
Basic nanopore signal processing. Example translocations of a model protein. (a) Representative current trace (I) as a function of time (t). Each drop in current is defined as a nanopore event. (b) The time between the start of each event is defined as the inter-event interval (ti), which is fitted by an exponential decay function. (c) The event dwell time (tD) histogram is fitted by either drift-diffusion model or exponential decay function. (d) The ratio between event amplitude (ib) and open pore current (io) is fitted by multimodal distribution. (e) The scatter plot of IB vs tD is used to perform single-molecule protein classification.
The nanopore event amplitude (Δi,) is proportional to the physical blockage of ionic current flow through the pore. The event amplitude is often normalized to io to mitigate slow drifts in io during an experiment. It is widely accepted that the event amplitude is positively correlated to the occupied volume of the protein inside the sensing region. However, the exact relationship between protein’s geometry and the event amplitude is still ambiguous. This is partly a consequence of the natural non-homogenous electrical charge distribution in the vicinity of each folded protein, which could give rise to significant deviations from the simple geometrical volume exclusion by the molecule.
Last but not least, the dwell time, defined by the time elapsed between the initial drop in the ion current to its return above the same level, is a reflection of the time the protein spends in the pores sensing volume. For small nanopores the translocation process can be generally viewed as an energy barrier crossing, hence the dwell time decays exponentially with the applied voltage (the applied voltage reduces the barrier by qV, where q is the total protein charge and V is the potential drop). In this case, performing measurements at several applied voltages is an effective way to discern the true translocation events from short collisional events, which are much less sensitive to the applied voltage. The dwell time distribution contains information about the protein’s charge, mobility, and diffusion coefficient. Typically, the dwell time distribution is tail-fitted by an exponential decay function to provide a characteristic time scale. In cases which there is an evidence that the protein translocate through the pore with a uniform velocity, a diffusion-drift model may be used to fit the data, although caution should be exercised when interpreting the meaning of the diffusion constant, D, and the proteins mobility, ν, inside a narrow pore. Notably, these two fit parameters are largely influenced by interactions with the pore itself, in addition to the normal solution friction, hence complicating their physical meaning:22
| (2) |
The physical confinement and the interaction between the protein and pore’s wall also can be theoretically related under some approximation of D and ν.47
3.5. Advanced signal analysis: subevent information
Complex structural motifs affecting the local size (cross-section) of proteins may result in long ion-current blockade events consisting of multiple subevent current levels. To analyze such events, an all data point histogram is plotted to identify if there are multiple sublevels. Each difference in sublevel must be larger than the current noise to be resolved. The sublevel identification and pattern recognition is done manually11,12 or by an algorithm such as edge-finding (similar to the one used in analyzing single-molecule FRET data).23 More advanced signal processing techniques involving machine learning are emerging and will play a crucial role in analysing nanopore signals generated from proteins. The current fluctuations during the event, which is measured by the noise of the residual current, is used to detect mutations or post-translational modifications on the protein.13 The distribution of an event amplitude histogram describes the natural fluctuation of the protein inside the pore, which is related to its overall gross shapes (e.g., prolate or oblate ellipsoid), its dipole moment, and its rotational diffusion coefficient. Up to five parameters can be obtained to classify a protein.9,10
4. E is for Examples
The following examples showcase the capabilities of nanopores for sensing and characterizing proteins. For a comprehensive review of single-molecule protein sensing in a nanopore, we refer the readers to several excellent reviews.35,40 In the following examples, we describe the use of nanopores to: 1) probe binding affinity; 2) characterize protein domains and oligomeric states; 3) study protein unfolding; 4) detect specific sites of phosphorylation on a protein; and 5) identify biomarkers and peptide variants.
4.1. Probing binding affinity
Nanopore sensing is a useful tool for the study of biomolecular complexes consisting of two or more biomolecules. Squires et al. investigated the binding between DNA and a classical transcription factor (TF) using a solid-state nanopore.23 Binding events between DNA and TFs play a critical role in the regulation of gene expression, and thus understanding these interactions provides valuable insights into genetic regulation. In this study, the well-characterized zinc finger protein, zif268, also known as early growth response protein 1 (EGR-1), binds a 1 kbp DNA fragment containing only one binding site for zif268. Upon translocation, five distinct event patterns, based on different steps found in subevent, were categorized. The researchers concluded that Zif268 binds to the DNA via two different states, a specific recognition state and a non-specific search state. When zif268 specifically binds to the DNA in the recognition state, all three zinc finger domains were bound to the major groove of the DNA. Whereas in the non-specific search state, one of the zinc finger domains was positioned away from the DNA, and the TF was able to slide easily and quickly along the DNA. Using the translocation data of the zif268 + DNA complex, different subgroups of translocation events are associated with the recognition and search mode of zif268 respectively. In the recognition state, translocation of the zif268 + DNA complex produced an ABA pattern event as shown in Figure 5, top panel. Blockage at level A represented the strand of DNA and a deeper level at B resulted from the tightly bound zif268. In the search state, translocation of the DNA-TF complex led to the event with AC pattern (Figure 5, bottom panel). Similar to the recognition state, the A level was associated with the DNA backbone and the deeper blockage of level C compared to level B was attributed to the less compact structure of zif268 in the search state.
Figure 5.
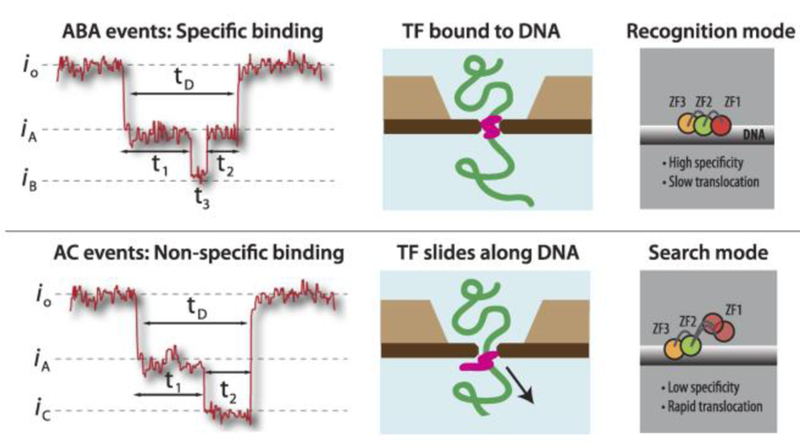
Probing binding states between DNA and a transcription factor (TF) using a solid-state nanopore. The 1 kbp DNA contains a single binding site for TF zif268. When the TF binds to the DNA specifically (top panel), the DNA backbone leads to a current drop from io to iA and the deeper blockage level at iB represents the tightly bound TF. In the non-specific binding state (bottom panel), the TF slides along the DNA backbone, creating a distinct blockage level at iC. Adapted with permission from A. Squires, E. Atas, and A. Meller, Sci. Rep., 2015, 5(April), 11643, under Creative Commons Attribution 4.0 International license, Nature Publishing.
4.2. Characterizing protein domains and oligomeric states
In biological systems, proteins can exist in different oligomeric states, and some proteins possess multiple domains or secondary/tertiary structures. Protein oligomers are often connected by disulfide bonds, and different domains within a protein exhibit distinct structures and functions. Several studies have elucidated the different domains and oligomeric states of proteins using nanopores.3,7,11 Nivala et al.,11 examined three variants of an ubiquitin-like protein (Smt3), all of which were conjugated to a negatively-charged polypeptide tail to aid in nanopore translocation with an applied postive bias and an unfoldase protein coupled to an α-hemolysin pore (Figure 6a). Variant i had one unit of Smt3, and variant ii and iii each had two units of Smt3 separated by a short and long linker, respectively. Translocation of these three variants produced distinct sub-event levels and residence times which correlated with their three-dimensional structures. Another study by Varongchayakul et al.,7 studied the dynamics of monomer, dimer, and trimer states of vascular endothelial growth factor (VEGF), which are held together via disulfide linkages. Each VEGF structure produced a unique event amplitude, with monomers affording the smallest blockage level and trimers giving the largest (Fig. 6b). After the addition of tris(2-carboxyethyl)phosphine (TCEP), a commonly used disulfide bond reducing agent, to a solution containing a mixture of VEGF structures, the majority of translocation events exhibited a small blockage level consistent with a population of VEGF monomer present. When the enzyme plasmin cleaved the receptor recognition and heparin-binding domain of VEGF, the positively charged heparin-binding domain gave single-level events with lower amplitude compared to events before cleavage when a negative potential was applied. When the potential was switched across the membrane, the negatively charge receptor recognition domain translocated with single-level events detected.
Figure 6.
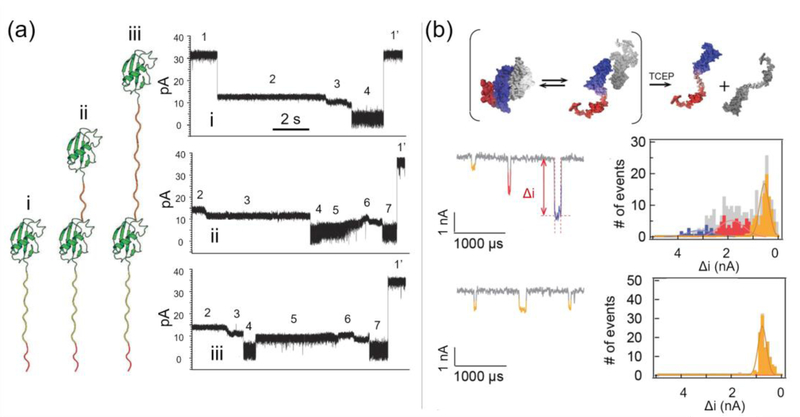
Characterization of protein (a) domains and (b) oligomeric states using nanopores. In the example shown in (a), three variants of Smt3 protein were labelled as i, ii and iii as shown on the left. Their corresponding translocation events revealed multiple ionic current blockage levels on the right. The sub-events were categorized into 7 stages, with stage 4 and stage 7 representing the translocation of the unfolded Smt7 protein. The events shown in (a) are also examples of nanopore-induced protein unfolding discussed in section 4.3. Adapted with permission from J. Nivala, D. B. Marks, and M. Akeson, Nat. Biotechnol., 2013, 31(3), 247–50. Copyright 2013, Nature Publishing. In (b), the monomeric, dimeric and trimeric states of VEGF exhibited moderate (yellow), intermediate (red) and deep (blue) current blockage levels that correspond to their sizes. After the addition of TCEP, a disulfide bonds reducing agent, the dimeric and trimeric VEGF proteins were converted into the monomeric state. Adapted with permission from N. Varongchayakul, D. Huttner, M. W. Grinstaff, and A. Meller, Sci. Rep., 2018, 8(1), 1017, under Creative Commons Attribution 4.0 International license, Nature Publishing.
4.3. Exploring nanopore-induced protein unfolding
When the diameter of the nanopore is smaller than the diameter of the protein molecules, the protein may undergo structural deformation such as partial or complete unfolding in order to traverse the pore. In the reported translocation events of the Smt3 protein, the translocation corresponding to construct i (Figure 6a) shows several distinct sub-events with different amplitudes and dwell times.12 These sub-events are correlated to different stages of translocation in the α-hemolysin nanopore. The protein substrate, in this case, is tagged with a negatively-charged polypeptide segment to induce unidirectional movement of the molecule when a potential is applied. Once the polypeptide tail traverses through the pore, the unfoldase-targeting sequence on the tail is recognized by the ClpX unfoldase protein in the trans chamber and the protein is then unfolded and threaded through the pore. Stage 1 shows the open-pore current before the capture of the protein. When the linear polypeptide tail enters the pore, the ion flow decreases immediately, creating a sharp drop in current as shown in Stage 2. Upon recognition between ClpX unfoldase and the polypeptide, the current drops further in Stage 3. The potential and unfoldase-driven force continue to pull on the protein, causing it to gradually unfold, enter and exit the pore, leading to a period of deep current blockage in Stage 4. Once the protein leaves the pore, the open-pore current returns to the same level in Stage 1. The magnitude and duration of each level in these subevents reveals further structural and functional information on the proteins.48
4.4. Detecting post-translational modification
After translation, a protein may undergo post-translational modification(s) such as phosphorylation, acetylation, ubiquitination and glycosylation. These modifications are critical to the function of the mature, native protein. To determine if a nanopore sensor detects these fine features of protein primary structure at the single-molecule level, Rosen and co-workers investigated the phosphorylation of a model protein thioredoxin (Figure 7).13 Thioredoxin contains two phosphorylatable sites at positions 107 and 112. To facilitate nanopore sensing, they conjugated a 30-mer oligonucleotide to the C-terminus of the protein. Upon applying a potential across the nanopore with a positive bias at the trans chamber, the negatively charged oligonucleotide guided the oligonucleotide-protein conjugate to the pore for subsequent translocation. During the translocation, thioredoxin unfolds, and a multi-level current pattern is observed. The four constructs of thioredoxin, containing the combinations of native and three different phosphorylation states, gave unique translocation signatures elucidated by the scatter plots of the fractional event amplitude versus subevent noise as shown in Figure 7.
Figure 7.

Detecting thioredoxin protein in native and three different phosphorylation states using an α-hemolysin nanopore. (a) Representation event trace shows multistep translocation. (b) The scatter plot of the fractional blockade current (IB) vs. subevent noise (in) at level 3 of the four thioredoxin constructs revealed four unique populations highlighted in blue, green, black and red, which correspond to the native and three different phosphorylation states of thioredoxin. The red circles signify the number and position of phosphorylated residues on the protein. Each protein is also tagged with a 30-mer oligonucleotide to the C-terminus to facilitate translocation. Adapted with permission from C. B. Rosen, D. Rodriguez-Larrea, and H. Bayley, Nat. Biotechnol., 2014, 32(2), 179–181. Copyright 2014, Nature Publishing.
4.5. Identifying biomarkers and peptide variants
Nanopore technologies have been widely explored for applications in nucleic acid sequencing in the past decade. Recently, research efforts are directed at nanopore sensing to detect proteins or peptides. In 2017, Huang and co-workers described the use of FraC nanopores to identify a variety of proteins with size ranging from 1.3 kDa to 25 kDa.20 When these proteins were analyzed independently, the translocation events were compared based on the dwell times and the fractional event amplitude. The events corresponding to each protein clustered around a certain region on the dwell time versus fractional event amplitude plot. When a mixture of three different proteins (β2-microglobulin, human epidermal growth factor and endothelin 1) was investigated and analyzed, based on a dwell time vs fractional event amplitude diagram, the event cluster corresponding to each protein produced a distinct population on the plot. Thus, these proteins are discriminated from each other based on the translocation data. Furthermore, when comparing the translocation events of endothelin 1 (ET-1) and endothelin 2 (ET-2), it was possible to distinguish these two peptides from each other even though these two peptides only differ by 1 amino acid out of 21 in their sequences (Figure 8). This remarkable sensing specificity highlights the potential of nanopore sensing for identifying proteins in a mixture. In 2018, Piguet et al., used a wild-type aerolysin nanopore to identity a single amino acid variant in uniformly charged homopolymeric peptides.14 First, arginine peptides of 5–10 amino acids, which differed by a single amino acid in length, were introduced to the nanopore. Unique fractional event amplitude and dwell-times were observed. The 10 amino acids long lysine homopeptides show different blockage current compared to the arginine homopeptides of the same length. Additionally, the event population shifts toward shorter species upon addition of trypsin enzyme. This result demonstrated that the mixture of the two homopeptides were discriminated at single-molecule resolution. Finally, a heteropolymer of 5 lysine amino acids and 5 arginine amino acids displayed unique event amplitude upon comparison with the homopolymers of arginine or lysine. These two reports reinforce the promising ability of a nanopore to sense differences at the single amino acid level.
Figure 8.
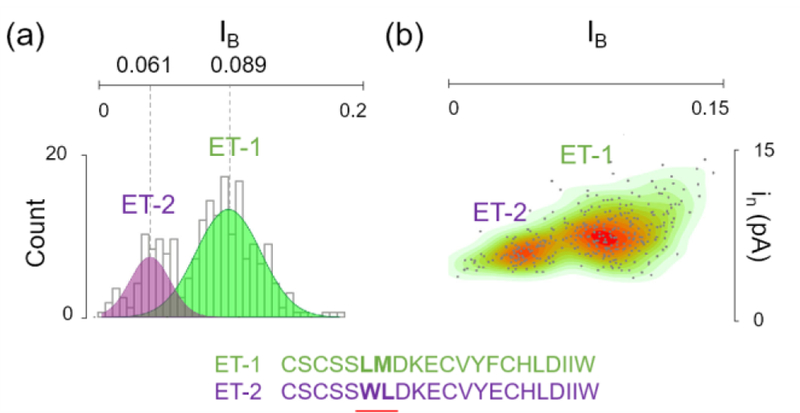
Distinguishing endothelin 1 (ET-1) from endothelin 2 (ET-2) using a FraC nanopore. (a) The translocation data of ET-2 and ET-2 revealed distinguishable fractional blockade current (IB) at 0.089 for ET-1 and 0.061 for ET-2. (b) By adding ET-1 and ET-2 consecutively to the same pore, two distinct populations were observed by plotting the event amplitude standard deviation (in) over the corresponding IB. (c) ET-1 and ET-2 are two nearly isomeric polypeptides differing from each other by 1 amino acid out of 21 as well as the position of a leucine residue (leucine 6 in ET-1 and leucine 7 in ET-2). Adapted with permission from G. Huang, K. Willems, M. Soskine, C. Wloka, and G. Maglia, Nat. Commun., 2017, 8, 935, under Creative Commons Attribution 4.0 International license, Nature Publishing.
5. O is for Outlook
5.1. Robust signal processing and understanding the protein translocation signal
There are multiple approaches to analyse or extract the features of the nanopore events, including the average dwell time, event amplitude, steps, noise, etc. Future nanopore analysis will include more sophisticated signal processing algorithm such as Wavelet Transform (similar to EKG signal), and competent composite method (similar to data compression technique). Classifying the signals using machine learning algorithms via supervised learning (such as support vector machine or neural network) or unsupervised learning (such as kmeans9) is becoming more common and likely to be the mainstream in the future. Computational simulation, both at atomic and higher level, will shed additional light on the mechanism of protein translocation or its interaction with the pore, however, such technique do require high computational power to account for the translation, rotation, as well as structural unfolding of the protein.
5.2. Device development
Although nanopore sensors are used in a number of laboratories and commercial available for DNA sequencing, significant opportunities exist for improvements including:
-
1)
higher temporal bandwidth, while minimizing noise, in order to resolve nanopore event with shorter dwell time and to capture more proteins of low copy number present in solution;
-
2)
innovative fabrication technique to precisely create ultra-thin and ultra-small sensing region, down to Angstroms, will enable identification of individual amino acids in a protein;
-
3)
expansion of emerging detection modality such as optical readout49 or transverse current readout50 to obtain additional information from the protein translocation event;
-
4)
improved methods for high-throughput nanopore fabrication. Alternative nanopore fabrication techniques such as dielectric breakdown28 and laser-based drilling29 might be an answer to the issue of nanopore reproducibility and mass-production; and,
-
5)
auxiliary devices to connect with the nanopore or multiuse integrated nanopore devices (e.g., microfluidic nanopore device) to enable the sensing of biological and clinical samples wherein the sample is isolated, purified, and delivered to the nanopore for sensing in a single device.
5.3. future applications
Nanopore sensing is at the forefront of the nanotechnology and nanomedicine revolution. The availability of low-cost, single-molecule protein nanopore sensing technology will undoubtedly advance basic research in molecular biology and medicine. Moreover, such technologies will likely be quickly adopted for commercial use in a broad range of industries, including biomedicine (molecular diagnostics and drug development), biotechnology (food industries and water quality control), cosmetics, and forensics. The application space is extensive. For example, the detection and quantification of a specific protein, including those present at a low concentration, will be accomplished using a tag, where the tag ensure a specific and unique signal from the translocation event for a given protein. Multiplexing this approach using different tags for different proteins along with signal processing advancements will enable many proteins to be detected from a single assay volume. Another specific example involves quantification of enzymatic activities. Given the ability to study protein binding and enzyme reaction kinetics, the nanopore provides the means to study protein reactivity at the single-molecule level or to screen for reactivity during drug discovery and development. As such, the nanopore will reduce the amounts of material required for analysis and replace the use of laborious bulk measurements such as gel electrophoresis or immunoassays. With regards to clinical applications, nanopore sensors require minimal sample, and, thus, screening or identifying a specific protein in a patient’s blood, urine, or sweat sample could be accomplished in a minimally invasive manner. Alternatively, nanopore sensor could be coupled with a controlled microfluidic device to create a single-molecule sorting device – analogous to a flow cytometer used to sort cells.
The purpose of this tutorial review is to provide a background for those interested in nanopore technology for sensing proteins and to instil a sense of the excitement, that we see, for this area. We encourage newcomers, from all science and engineering disciplines, to work in this field in order to advance nanopore materials and sensing methodologies, and to identify new applications for protein sensing. Today, the opportunities seem endless.
Key learning points.
-
(1)
Nanopore sensing allows detection and characterization of protein(s) at the single-molecule level.
-
(2)
Nanopore sensing provides key information on protein concentration, shape, size, secondary/tertiary structure, conformations and conformational changes, post-translational modifications, unfolding kinetics, diffusion coefficients, and reaction kinetics.
-
(3)
Nanopore design and assay conditions control the type of interactions a protein will have with a nanopore, which includes translocation, collision, deformation and partial unfolding, linearization, adsorption to the wall, or tumbling inside the pore.
-
(4)
Nanopore sensing provides unprecedented opportunities to study fundamental protein biochemistry at the molecular level, to characterize the biophysics of protein translocation, and to design and evaluate new diagnostic devices for rapid, quantitative detection of proteins.
Acknowledgements
This work was supported in part by the NIH (Center for Future Technologies in Cancer Care (CFTCC U54 EB015403), Boston University, BeyondSeq consortium (EC program 63489), and the i-Core program of the Israel Science Foundation (1902/12).
Biography

Nitinun Varongchayakul
Nitinun Varongchayakul received her Bachelor’s degree from Chulalongkorn University in 2010 and her Master’s degree in Material Science and Engineering from University of Maryland at College Park in 2012. She is pursuing a PhD degree under the tutelage of Professors Mark Grinstaff and Amit Meller. Her research interests lie in the use of nanopores for protein sensing.

Jiaxi Song
Jiaxi Song received her undergraduate degree in Chemistry at Mount Holyoke College in 2012. She is conducting her Ph.D. studies under the mentorship of Professors Mark W. Grinstaff and Amit Meller. Her current research interests include using solid-state nanopores to identify biomolecules and developing novel photoinitiators for two-photon polymerization.

Amit Meller
Amit Meller is the Roy Matas Winnipeg Chair in Biomedical Engineering and full professor in the Department of Biomedical Engineering at the Technion–Israel Institute of Technology, Haifa, Israel. He is also director of the Israeli Center of Excellence in Biological Physics (i-Core). During his postdoctoral studies at Harvard University, he was fortunate to be among the first to develop and employ nanopore-based DNA and RNA single molecule sensors, and publish some of the early and highly cited papers in this field. Dr Meller’s current research interests include single-molecule sensing and single molecule biophysics, bio-optics, nano-sciences and nano-biotechnology.

Mark W. Grinstaff
Mark W. Grinstaff is the Distinguished Professor of Translational Research, a Professor of Biomedical Engineering, Chemistry, Materials Science and Engineering, and Medicine at Boston University, and the Director of BU’s Nanotechnology Innovation Center. Grinstaff’s groundbreaking research has yielded more than 290 peer-reviewed publications, and more than 200 patents and patent applications. He is a co-founder of five companies and his innovative ideas and efforts have led to new commercialized products. His research interests cover a broad range of topics but always with an emphasis on new technologies, compositions, synthetic methods, and evaluation of properties.
Footnotes
Conflicts of interest
There are no conflicts to declare.
References
- 1.Gooding JJ and Gaus K, Angew. Chemie Int. Ed, 2016, 55, 11354–11366. [DOI] [PubMed] [Google Scholar]
- 2.Jain M, Koren S, Miga KH, Quick J, Rand AC, Sasani TA, Tyson JR, Beggs AD, Dilthey AT, Fiddes IT, Malla S, Marriott H, Nieto T, O’Grady J, Olsen HE, Pedersen BS, Rhie A, Richardson H, Quinlan AR, Snutch TP, Tee L, Paten B, Phillippy AM, Simpson JT, Loman NJ and Loose M, Nat. Biotechnol, 2018, 36, 338–345. [DOI] [PMC free article] [PubMed] [Google Scholar]
- 3.Nir I, Huttner D and Meller A, Biophys. J, 2015, 108, 2340–2349. [DOI] [PMC free article] [PubMed] [Google Scholar]
- 4.Van Meervelt V, Soskine M, Singh S, Schuurman-Wolters GK, Wijma HJ, Poolman B and Maglia G, J. Am. Chem. Soc, 2017, 139, 18640–18646. [DOI] [PMC free article] [PubMed] [Google Scholar]
- 5.Wloka C, Van Meervelt V, van Gelder D, Danda N, Jager N, Williams CP and Maglia G, ACS Nano, 2017, 11, 4387–4394. [DOI] [PMC free article] [PubMed] [Google Scholar]
- 6.Niedzwiecki DJ, Lanci CJ, Shemer G, Cheng PS, Saven JG and Drndić M, ACS Nano, 2015, 9, 8907–8915. [DOI] [PubMed] [Google Scholar]
- 7.Varongchayakul N, Huttner D, Grinstaff MW and Meller A, Sci. Rep, 2018, 8, 1017. [DOI] [PMC free article] [PubMed] [Google Scholar]
- 8.Yusko EC, Johnson JM, Majd S, Prangkio P, Rollings RC, Li J, Yang J and Mayer M, Nat. Nanotechnol, 2011, 6, 253–260. [DOI] [PMC free article] [PubMed] [Google Scholar]
- 9.Yusko EC, Bruhn BR, Eggenberger OM, Houghtaling J, Rollings RC, Walsh NC, Nandivada S, Pindrus M, Hall AR, Sept D and others, Nat. Nanotechnol, 2017, 12, 360–367. [DOI] [PubMed] [Google Scholar]
- 10.Waduge P, Hu R, Bandarkar P, Yamazaki H, Cressiot B, Zhao Q, Whitford PC and Wanunu M, ACS Nano, 2017, 11, 5706–5716. [DOI] [PubMed] [Google Scholar]
- 11.Nivala J, Marks DB and Akeson M, Nat. Biotechnol, 2013, 31, 247–250. [DOI] [PMC free article] [PubMed] [Google Scholar]
- 12.Rodriguez-Larrea D and Bayley H, Nat. Nanotechnol, 2013, 8, 288–295. [DOI] [PMC free article] [PubMed] [Google Scholar]
- 13.Rosen CB, Rodriguez-Larrea D and Bayley H, Nat. Biotechnol, 2014, 32, 179–181. [DOI] [PMC free article] [PubMed] [Google Scholar]
- 14.Piguet F, Ouldali H, Pastoriza-Gallego M, Manivet P, Pelta J and Oukhaled A, Nat. Commun, 2018, 9, 966. [DOI] [PMC free article] [PubMed] [Google Scholar]
- 15.Kasianowicz JJ, Brandin E, Branton D and Deamer DW, Proc. Natl. Acad. Sci. U. S. A, 1996, 93, 13770–13773. [DOI] [PMC free article] [PubMed] [Google Scholar]
- 16.Sutherland TC, Long YT, Stefureac RI, Bediako-Amoa I, Kraatz HB and Lee JS, Nano Lett, 2004, 4, 1273–1277. [Google Scholar]
- 17.Hornblower B, Coombs A, Whitaker RD, Kolomeisky A, Picone SJ, Meller A and Akeson M, Nat. Methods, 2007, 4, 315–317. [DOI] [PubMed] [Google Scholar]
- 18.Payet L, Martinho M, Pastoriza-Gallego M, Betton J-M, Auvray L, Pelta J and Mathé J, Anal. Chem, 2012, 84, 4071–4076. [DOI] [PubMed] [Google Scholar]
- 19.Singh PR, Bárcena-Uribarri I, Modi N, Kleinekathöfer U, Benz R, Winterhalter M and Mahendran KR, ACS Nano, 2012, 6, 10699–10707. [DOI] [PubMed] [Google Scholar]
- 20.Huang G, Willems K, Soskine M, Wloka C and Maglia G, Nat. Commun, 2017, 8, 935. [DOI] [PMC free article] [PubMed] [Google Scholar]
- 21.Talaga DS and Li J, J. Am. Chem. Soc, 2009, 131, 9287–9297. [DOI] [PMC free article] [PubMed] [Google Scholar]
- 22.Larkin J, Henley RY, Muthukumar M, Rosenstein JK and Wanunu M, Biophysj, 2014, 106, 696–704. [DOI] [PMC free article] [PubMed] [Google Scholar]
- 23.Squires A, Atas E and Meller A, Sci. Rep, 2015, 5, 11643. [DOI] [PMC free article] [PubMed] [Google Scholar]
- 24.Goyal G, Lee YB, Darvish A, Ahn CW and Kim MJ, Nanotechnology, 2016, 27, 495301. [DOI] [PubMed] [Google Scholar]
- 25.Feng J, Liu K, Bulushev RD, Khlybov S, Dumcenco D, Kis A and Radenovic A, Nat. Nanotechnol, 2015, 10, 1070–1076. [DOI] [PubMed] [Google Scholar]
- 26.Li J, Stein D, McMullan C, Branton D, Aziz MJ and Golovchenko JA, Nature, 2001, 412, 166–169. [DOI] [PubMed] [Google Scholar]
- 27.Storm AJ, Chen JH, Ling XS, Zandbergen HW and Dekker C, Nat. Mater, 2003, 2, 537–540. [DOI] [PubMed] [Google Scholar]
- 28.Kwok H, Briggs K and Tabard-Cossa V, PLoS One, 2014, 9, e92880. [DOI] [PMC free article] [PubMed] [Google Scholar]
- 29.Gilboa T, Zrehen A, Girsault A and Meller A, Sci. Rep, 2018, 8, 9765. [DOI] [PMC free article] [PubMed] [Google Scholar]
- 30.Garaj S, Hubbard W, Reina A, Kong J, Branton D and Golovchenko JA, Nature, 2010, 467, 190–193. [DOI] [PMC free article] [PubMed] [Google Scholar]
- 31.Bell NAW and Keyser UF, J. Am. Chem. Soc, 2015, 137, 2035–2041. [DOI] [PMC free article] [PubMed] [Google Scholar]
- 32.Miles BN, Ivanov AP, Wilson KA, Doğan F, Japrung D and Edel JB, Chem. Soc. Rev, 2013, 42, 15–28. [DOI] [PubMed] [Google Scholar]
- 33.Song L, Hobaugh MR, Shustak C, Cheley S, Bayley H and Gouaux JE, Science, 1996, 274, 1859–1866. [DOI] [PubMed] [Google Scholar]
- 34.Wanunu M, Sutin J, McNally B, Chow A and Meller A, Biophys. J, 2008, 95, 4716–4725. [DOI] [PMC free article] [PubMed] [Google Scholar]
- 35.Chinappi M and Cecconi F, J. Phys. Condens. Matter, 2018, 30, 204002. [DOI] [PubMed] [Google Scholar]
- 36.Plesa C, Kowalczyk SW, Zinsmeester R, Grosberg AY, Rabin Y and Dekker C, Nano Lett, 2013, 13, 658–663. [DOI] [PMC free article] [PubMed] [Google Scholar]
- 37.Niedzwiecki DJ, Grazul J and Movileanu L, J. Am. Chem. Soc, 2010, 132, 10816–10822. [DOI] [PMC free article] [PubMed] [Google Scholar]
- 38.Freedman KJ, Haq SR, Fletcher MR, Foley JP, Jemth P, Edel JB and Kim MJ, ACS Nano, 2014, 8, 12238–12249. [DOI] [PubMed] [Google Scholar]
- 39.Asandei A, Chinappi M, Lee J, Ho Seo C, Mereuta L, Park Y and Luchian T, Sci. Rep, 2015, 5, 10419. [DOI] [PMC free article] [PubMed] [Google Scholar]
- 40.Cressiot B, Oukhaled A, Bacri L and Pelta J, Bionanoscience, 2014, 4, 111–118. [Google Scholar]
- 41.Si W and Aksimentiev A, ACS Nano, 2017, 11, 7091–7100. [DOI] [PMC free article] [PubMed] [Google Scholar]
- 42.Restrepo-Pérez L, John S, Aksimentiev A, Joo C and Dekker C, Nanoscale, 2017, 9, 11685–11693. [DOI] [PMC free article] [PubMed] [Google Scholar]
- 43.Wanunu M, Morrison W, Rabin Y, Grosberg AY and Meller A, Nat. Nanotechnol, 2010, 5, 160–165. [DOI] [PMC free article] [PubMed] [Google Scholar]
- 44.Niedzwiecki DJ, Iyer R, Borer PN and Movileanu L, ACS Nano, 2013, 7, 3341–3350. [DOI] [PMC free article] [PubMed] [Google Scholar]
- 45.Liu L, Li T, Zhang S, Song P, Guo B, Zhao Y and Wu H-C, Angew. Chemie Int. Ed, 2018, 57, 11882–11887. [DOI] [PubMed] [Google Scholar]
- 46.Asandei A, Schiopu I, Chinappi M, Seo CH, Park Y and Luchian T, ACS Appl. Mater. Interfaces, 2016, 8, 13166–13179. [DOI] [PubMed] [Google Scholar]
- 47.Muthukumar M, J. Chem. Phys, 2014, 141, 081104. [DOI] [PMC free article] [PubMed] [Google Scholar]
- 48.Mereuta L, Roy M, Asandei A, Lee JK, Park Y, Andricioaei I and Luchian T, Sci. Rep, 2014, 4, 3885. [DOI] [PMC free article] [PubMed] [Google Scholar]
- 49.Gilboa T and Meller A, Analyst, 2015, 140, 4733–4747. [DOI] [PubMed] [Google Scholar]
- 50.Di Ventra M and Taniguchi M, Nat. Nanotechnol, 2016, 11, 117–126. [DOI] [PubMed] [Google Scholar]


